Embed Size (px)
Citation preview

DEVELOPMENT OF CASSAVA-SOY BEAN BREAKFAST FLAKES WITH
IMPROVED PROTEIN AND MINERALS
BY
MUCHIRA JAMES KABUI
(BSc. Food Science and Technology, University of Nairobi)
A56/89284/2016
A DISSERTATION SUBMITTED IN PARTIAL FULFILMENT OF THE
REQUIREMENTS FOR THE DEGREE OF MASTER OF SCIENCE IN FOOD
SAFETY AND QUALITY OF THE UNIVERSITY OF NAIROBI
DEPARTMENT OF FOOD SCIENCE, NUTRITION AND TECHNOLOGY
FACULTY OF AGRICULTURE
© 2019

ii
DECLARATION
I MUCHIRA JAMES KABUI, hereby declare that this dissertation is my original work and
has not been presented for award of degree in any other University.
James Kabui Muchira
Signature ……………………………. Date…………………………….
This dissertation has been submitted with our approval as University Supervisors.
Prof. Michael W. Okoth (PhD)
University of Nairobi
Department of Food Science, Nutrition and Technology
Signature ……………………………. Date…………………………….
Dr. George O. Abong’ (PhD)
University of Nairobi
Department of Food Science, Nutrition and Technology
Signature ………………………… Date …………………………..
iii
UNIVERSITY OF NAIROBI
PLAGIARISM DECLARATION FORM FOR STUDENTS
Name of Student: James Kabui Muchira
Registration Number : A56/89284/2016
College : Agriculture And Veterinary Sciences
Faculty/School/Institute : Agriculture
Department : Food Science, Nutrition And Technology
Course Name : MSc. Food Safety And Quality
Title of the work: Development of Cassava-Soy Bean Breakfast Flakes With Improved
Protein and Minerals.
DECLARATION
1. I understand what Plagiarism is and I am aware of the University’s policy in this regard
2. I declare that this dissertation is my original work and has not been submitted elsewhere for
examination, award of a degree or publication. Where other people’s work, or my own work
has been used, this has properly been acknowledged and referenced in accordance with the
University of Nairobi’s requirements.
3. I have not sought or used the services of any professional agencies to produce this work
4. I have not allowed, and shall not allow anyone to copy my work with the intention of passing
it off as his/her own work
5. I understand that any false claim in respect of this work shall result in disciplinary action, in
accordance with University Plagiarism Policy.
Signature __________________________________ Date: ___________________.

iv
DEDICATION
This research work is dedicated to Almighty God for seeing me through my entire study period,
my parents, Peter Muchira and Janet Muchira, my sisters Margaret Waruguru and Doreen
Nyakio, and my dearest uncle Dr. David G. Mugo.

v
ACKNOWLEDGEMENT
I wish to acknowledge my Supervisors Prof. Michael Wandayi Okoth and Dr. George Ooko
Abong’ for the academic guidance, support and constructive criticism they accorded me during
my research and writing of this dissertation. I am also grateful to University of Nairobi , Dean
Faculty of Agriculture and the Department of Food Science, Nutrition and Technology and all
the staff therein for financing my studies through the University Scholarship Scheme and the
support given all through the study program.
I also appreciate the Department of Food Science, Nutrition and Technology laboratory
technicians Mr. J. M’thika, Ms. Catherine Ngunju, Ms. Rosemary, Mr. James Ouma, and Ms.
E. Cheruiyot for their assistance during laboratory analysis. I would also not forget to
acknowledge Mr. Joseph Mwaniki for assisting and guiding me in statistical data analysis.
I finally take an obligation to appreciate Nairobi Bottlers Limited Human Resource Department
for offering me a study leave to sit for my exams and my team mates too for their support and
sacrifice to assist with my duties at work while attending classes. I am really thankful to my
family, classmates and friends for moral support during the entire period of study. You kept
encouraging me not to give up.

vi
Table of Contents
DECLARATION ....................................................................................................................... ii
PLAGIARISM DECLARATION FORM FOR STUDENTS ................................................. iii
DEDICATION .......................................................................................................................... iv
ACKNOWLEDGEMENT ......................................................................................................... v
LIST OF TABLES .................................................................................................................... xi
LIST OF FIGURES ................................................................................................................. xii
LIST OF ACRONYMS ......................................................................................................... xiii
OPERATIONAL DEFINITION OF TERMS ........................................................................ xiv
GENERAL ABSTRACT ......................................................................................................... xv
CHAPTER ONE: INTRODUCTION ....................................................................................... 1
1.1 Background Information ............................................................................................1
1.2 Problem Statement......................................................................................................2
1.3 Justification of the Study ............................................................................................3
1.4 Study Aim ...................................................................................................................3
1.5 Purpose of the Study ...................................................................................................4
1.6 Objectives ...................................................................................................................4
1.6.1 Overall objective ............................................................................................ 4
1.6.2 Specific objectives ......................................................................................... 4
1.7 Study Hypothesis ........................................................................................................4
CHAPTER TWO: LITERATURE REVIEW ............................................................................ 5
2.1 Cassava Production and Utilization: Global, Africa and Kenyan Trends ..................5
vii
2.2 Common Hazards in Cassava and Cassava Products .................................................8
2.3 Nutritional Contribution of Cassava .........................................................................10
2.4 Soy Bean Production: Global, Africa and Kenyan Trends .......................................12
2.5 Soy Bean and Nutrition ............................................................................................14
2.6 Soybean Lipids and Micronutrients Profile ..............................................................14
2.7 Anti-nutrient Factors in Soybean and their Deactivation .........................................15
CHAPTER THREE: PROXIMATE COMPOSITION AND PROCESSING METHODS
TO IMPROVE CHEMICAL SAFETY OF CASSAVA AND SOY BEAN ........ 18
3.1 Abstract.....................................................................................................................18
3.2 Introduction ..............................................................................................................19
3.3 Materials and Methods. ............................................................................................20
3.3.1 Sampling of cassava roots and soy bean. ..................................................... 20
3.3.2 Determination of proximate composition of cassava and soy bean as raw
materials ......................................................................................................... 20
3.3.2.1 Moisture content ....................................................................................... 20
3.3.2.2 Protein content .......................................................................................... 20
3.3.2.3 Crude ash................................................................................................... 21
3.3.2.4 Crude fat .................................................................................................... 21
3.3.2.5 Crude fiber ................................................................................................ 21
3.3.2.6 Carbohydrates ........................................................................................... 21
3.3.3 Calorific Value ............................................................................................. 22
3.3.4 Experimental Design to determine optimum fermentation time for
cassava roots .................................................................................................. 22
3.3.5 Determination of cyanide ............................................................................. 22

viii
3.3.6 Experimental design to determine most appropriate method(s) of
lowering anti-nutrients levels in Soy bean .................................................... 23
3.3.7 Determination of phytate ............................................................................. 23
3.3.8 Determination of tannins .............................................................................. 23
3.3.9 Determination of trypsin inhibitors .............................................................. 24
3.3.10 Statistical analysis ...................................................................................... 24
3.4 Results and Discussion .............................................................................................25
3.4.1 Proximate compositions of two cassava varieties in comparison with soy
bean ................................................................................................................ 25
3.4.2 Effect of pre-processing techniques on cyanide .......................................... 27
3.4.3 Levels of anti- nutrients in processed soy bean ........................................... 30
3.5 Conclusion ................................................................................................................33
CHAPTER FOUR: DEVELOPMENT OF CASSAVA-SOY BEAN FLAKES ..................... 35
4.1 Abstract.....................................................................................................................35
4.2 Introduction ..............................................................................................................36
4.3 Materials and Methods .............................................................................................37
4.3.1 Sampling and processing of cassava and soy bean ...................................... 37
4.3.2 Experimental design ..............................................................................................38
4.3.3 Sample preparation for sensory evaluation .................................................. 40
4.3.4 Sensory analysis ........................................................................................... 40
4.3.5 Analytical methods ................................................................................................41
4.3.5.1 Determination of Proximate Composition for Cassava Soy bean
breakfast flakes .............................................................................................. 41
4.3.5.2 Determination of Hydrogen Cyanide content ........................................... 41
4.3.5.3 Determination of zinc and iron content ..................................................... 41

ix
4.3.6 Statistical analysis ........................................................................................ 41
4.4 Results and Discussion .............................................................................................42
4.4.1 Proximate composition, cyanide and anti-nutrients content of cassava-
soy bean flakes ............................................................................................... 42
4.4.2 Sensory evaluation of cassava soy bean flakes ............................................ 45
4.4.3 Zinc and Iron content of most acceptable CSB flakes formulation in
comparison to cassava flakes (control) .......................................................... 49
4.5 Conclusion ................................................................................................................50
CHAPTER FIVE: SHELF STABILITY AND QUALITY CHANGES DURING
STORAGE OF THE MOST ACCEPTABLE CSB FLAKES .............................. 51
5.1 Abstract.....................................................................................................................51
5.2 Introduction ..............................................................................................................52
5.3 Materials and Methods .............................................................................................53
5.3.1 Sample preparation and analysis .................................................................. 53
5.3.2 Accelerated shelf life test design ................................................................. 53
5.3.2.1 Accelerated aging time determination .................................................... 53
5.3.2.2 Sample packaging ..................................................................................... 54
5.3.3 Statistical analysis ........................................................................................ 55
5.4 Results and Discussion .............................................................................................55
5.4.1 Effect of packaging material on moisture content of flakes ........................ 55
5.4.2 Effect of different packaging material on lipid oxidation of flakes ............. 57
5.4.3 Effect of packaging material on acid value of flakes ................................... 58
5.4.4 Effects of packaging material on growth of yeast and moulds in CSB
flakes .............................................................................................................. 59
5.4.5 Estimation of shelf life of CSB flakes ......................................................... 60

x
5.5 Conclusion ................................................................................................................60
CHAPTER SIX: GENERAL CONCLUSIONS AND RECOMMENDATIONS ................... 61
6.1 General Conclusions .................................................................................................61
6.2 General Recommendations .......................................................................................62
REFERENCES ........................................................................................................................ 63
APPENDIX 1: SENSORY EVALUATION QUESTIONNAIRE .......................................... 78
xi
LIST OF TABLES
Table 3.1: Proximate composition of two cassava varieties in comparison with soy bean .................. 25
Table 3.2: Variation of pH and cyanide content of the two cassava roots with fermentation time ...... 28
Table 3.3: Reduction of HCN in two cassava varieties with drying timeline graph ............................. 29
Table 3.4: Anti-nutrient levels of soy bean subjected to different processing methods ....................... 31
Table 4.1: Formulation of cassava- soy bean flakes ............................................................................. 40
Table 4.2: Proximate composition, anti-nutrient and cyanide content of the formulated CSB flakes .. 43
Table 4.3: Sensory evaluation scores for the CSB flakes ..................................................................... 47
Table 4.4: Zinc and Iron content of cassava flakes and most acceptable CSB flakes formulation ....... 50
Table 4.5: Quality lead indicators for shelf stability of most acceptable CSB flakes formulation ....... 56

xii
LIST OF FIGURES
Figure 4.1: Schematic flow diagram for CSB flakes processing .......................................................... 39

xiii
LIST OF ACRONYMS
CSB Cassava Soy Bean
KALRO Kenya Agricultural and Livestock Research Organization
FAO Food and Agriculture Organization
WHO World Health Organization
IFRP International Food Research Policy
PEM Protein Energy Malnutrition
FAOSTAT Food and Agriculture Organization Statistics
HQCF High Quality Cassava Flour
KTI Kutiniz Trypsin Inhibitor
RDI Recommended Daily Intake
AOAC Association of Official American Chemist
RTEBC Ready To Eat Breakfast Cereals
TIU Trypsin Inhibitors Units
TI Trypsin Inhibitors
SSA Sub-Saharan Africa
PDA Potato Dextrose Agar
g Grams
IFAD International Fund for Agricultural Development
CFU Coliform Forming Unit

xiv
OPERATIONAL DEFINITION OF TERMS
Protein energy malnutrition- Refers to a form of malnutrition where there is inadequate
calorie or protein intake which manifests in form of Kwashiakor, marasmus and marasmic
kwashiakor.
Anti- nutrients- are natural or synthetic compounds found in a variety of foods especially
grains, beans, legumes and nuts that interfere with the absorption of vitamins, minerals and
other nutrients. They can even get in the way of the digestive enzymes, which are key for proper
absorption.
Flakes- A small thin, flat and dry sheet of food substance obtained through drying of a paste
or slurry.
Shelf stability- Ability of a food to remain effective and free from deterioration and thus can
be consumed without causing adverse health effects

xv
GENERAL ABSTRACT
Cassava production in sub-Saharan Africa, has greatly increased. However, utilization of the
roots is hindered by very short shelf life and presence of hydrogen cyanide a natural chemical
hazard. Further, cassava roots are poorly endowed with quality protein and minerals despite its
versatility to grow in marginalized soils. Consequently, this poses a problem of food loss,
serious risk of acute and chronic cyanide poisoning and protein energy malnutrition especially
to children under complementary feeding aged 2-5 years whose diets are solely cassava based.
Conversely, soy bean has been profiled as a cheap source of quality protein and minerals.
However, it also faces utilization challenges due to presence of anti-nutrients such as phytates,
tannins and trypsin inhibitors that decreases bioavailability of minerals and palatability. These
drawbacks have created a gap in knowledge and hence this study aimed at developing a safe,
nutritious, acceptable and shelf stable flaked product by incorporation of soy bean in cassava.
A random sampling of the raw materials was done from Muthurwa market, City Park market
in Westlands for cassava varieties and Nyamakima market for soy bean. Nutritional profiling
of the raw materials was carried out as per standard methods. Further, an experimental design
was set up to evaluate most appropriate methods of lowering cyanide in cassava roots to
maximum allowable level of 10 mg/kg and anti-nutrients in soy bean to acceptable levels. The
most appropriate methods were employed to process the two raw materials.
A single Pearson square was used as a tool of formulation to target half of required daily intake
of protein requirement for children aged between 2-5 years as recommended by WHO. The
following were the formulation with soy bean to cassava ratio respectively; 0:100= Treatment
A, 15:85= Treatment B, 25:75= Treatment C, 35:65= Treatment D and 50:50= Treatment E.
Descriptive sensory evaluation and overall acceptability was carried out for all the five
formulations. In addition, most acceptable sample was packaged in kraft paper, laminated kraft

xvi
paper and plastic container and accelerated shelf life test, anti-nutritional properties, zinc and
iron content were analyzed.
Results of proximate analysis for raw materials showed that most of nutritional components of
soy bean were significantly higher (p<0.05) compared to the two cassava varieties with
exception of carbohydrates. Combination of soaking cassava roots for four days using a ratio
of cassava to water of 1:3, pulping and drying in an air oven at 550 C for 3 days (p<0.05)
significantly lowered cyanide content by 81 % on average of the two cassava varieties to safe
levels. Soaking soy bean for 24 hours in water at a ratio of 1:2, germination for 1 day, drying
at 1000 C in an air oven followed by roasting at 2000 C for 5-8 min significantly (p<0.05)
lowered anti- nutrients levels by 96.9 %, 20.5 % and 89.8 % for tannins, trypsin inhibitors and
phytates respectively compared to control.
Proximate composition results of the formulation showed significant increase (p<0.05) in
protein, ash, fat and fiber content in formulations as level of soy bean incorporation increased
while cyanide content in all formulations was maximum allowable limit of 10 mg/kg. The
formulation that had 35:65 soy to cassava ratio had highest scores of sensory evaluation
attributes and overall acceptability at (p<0.05). Further, shelf stability, zinc and iron analysis
for this formulation was determined. Among the packaging materials laminated kraft paper
emerged the most appropriate in minimizing deteriorative factors and hence preserving quality
and safety. Cassava soy bean flakes were termed shelf stable for a period of five months but
probably could be longer as maximum allowable limits for peroxide values, acid value and
microbial stability were not exceeded in the five days of accelerated shelf life test. Zinc and
iron content were significantly higher for most acceptable sample compared to the cassava
flakes. The current study therefore established that nutritious, safe, acceptable shelf stable can
be developed into cassava soy bean flakes and can assist to solve PEM menace.
1
CHAPTER ONE: INTRODUCTION
1.1 Background Information
Cassava ((Manihot esculenta) is the third most crucial source of calories in the tropics, after
maize and rice. In Africa, Asia and Latin America millions of people depend on cassava for
food. Its ability to grow in a wide range of agro-ecological conditions and produce satisfactory
yields where most common food crops are unable to grow gives it a competitive edge to fight
food insecurity at the household level and to be an important source of dietary energy. More
than half a billion people in the world depend on cassava as a source of livelihood especially
for the farmers, processors and traders (Prakash, 2013). In sub-Saharan Africa, cassava is
mainly grown in more than 40 countries with 70% being produced in Nigeria, Congo and
Tanzania (IFAD and FAO, 2000). In Kenya, cassava is grown in Western, Eastern/Central and
Coastal regions with Western region producing about 60% and coastal region producing about
38% (Obiero et al., 2007). According to Githunguri et al., (2007) throughout the country
farmers produce cassava in small scale practicing traditional farming systems.
Nutritionally, cassava is generally known to contain high content of starch, dietary fiber,
riboflavin, nicotinic acid and magnesium. Vitamin A and Iron are usually low in cassava. The
roots are of low and poor quality protein especially with regard to limiting essential amino
acids such as lysine, methionine and therefore protein from other sources needs to be included
if cassava is to be part of a balanced diet (Oboh and Akindahunsi, 2003).
Cassava has a variety of uses compared to other starchy crops giving it a competitive edge. The
uses include: food, livestock feed, brewing, textile Industries, ply wood and paper industries
production of industrial starch. However it’s the most perishable root crop and readily
deteriorates within 1-3 days after harvesting. Additionally, the root is naturally known
to contain cyanogenic glucosides which needs to be reduced to safe levels of 10 mg/kg before

1
to contain cyanogenic glucosides which needs to be reduced to safe levels of 10 mg/kg before
consumption (Bradbury & Gleadow, 2017). As a result this has prompted intensive research
that began in 1985 that focuses on improving yields, processing control and new product
development especially development of composite flours with high protein quality cereals for
example Soy bean (Dufour et al., 2002).
Soy bean is a crucial legume crop in the world owing to its nutritional, economic and functional
importance especially in sub-Saharan Africa where food insecurity and Protein Energy
Malnutrition (PEM) is still a threat, case study of Kenya where about 30% of the children are
malnourished. According to (Goyal et al., 2012), soy bean contains about 40-45% protein, 18-
22% oil content and also a rich source of minerals and vitamins. Fabiyi and Hamidu (2011)
reported that protein quality from soy bean can be compared to that of animal sources such as
milk, eggs and meat with respect to lysine which is deficient in many cereals. Its protein profile
also contains substantial levels of methionine which is higher than that of other cereals and
vegetables. Consequently, it can be viewed as an excellent source of affordable protein for
supplementation of predominantly cassava diets which are deficient in protein.
In Kenya soy bean is mainly grown in two regions, Central Highlands and western regions with
the latter being the higher producer than the former. Coincidentally the western region is also
the largest producer of cassava in the country with much of it being utilized locally by the
communities and also as a weaning food. According to a study carried out to assess nutrition
status of Children under five years in Cassava consuming communities in Nambale, Busia
Western Kenya it was suggested that cassava helps to cushion hunger but however a need arises
to improve it nutritionally with regard to protein content and quality (Nungo et al., 2012).
Previous research has attempted to improve cassava based products in other parts of the world
where cassava is produced in large amount for example in Nigeria, enrichment of gari with soy

2
bean extract (Eke et al., 2008), nutritional and sensory properties of soy fortified fermented
cereal gruel (ogi) (Adesokan et al., 2011) among others. However, little work has been done in
Kenya especially in regions producing Cassava like in western Kenya. This elicited a need for
this project to develop high protein flakes from cassava and soy bean that can be used in
nutritional intervention programs to curb PEM in such communities which is nutritionally
wholesome, convenient in terms of preparation for consumption and probably has a longer
shelf life than the roots.
1.2 Problem Statement
Cassava production has increased tremendously in Africa. However, its utilization is hampered
by a short shelf-life and natural chemical hazards. Efforts have been made to add value to it
with an aim to solve these problems. Nevertheless, products produced solely from cassava are
low in protein content which may further impede utilization in a continent where protein energy
malnutrition is prevalent. Cassava is a poor source of protein especially with regard to essential
and limiting amino acids lysine and methionine. Moreover, in sub-Saharan Africa, cassava is
grown in areas where soils are poorly endowed with minerals hence cassava roots are also
deficient of vital micro nutrients such as Zinc and Iron (Montagnac et al., 2009a). In addition,
some communities that solely depend on cassava as main source of energy are at a greater risk
to suffer from Protein Energy Malnutrition (PEM). Due to lack of enough knowledge on proper
detoxification methods of cassava roots, they end up consuming cassava with higher cyanide
levels above the safe recommended maximum levels of 10 mg/kg. The proposed research
should therefore aim at developing high protein cassava products by incorporating protein and
mineral rich soy bean.

3
1.3 Justification of the Study
Soy bean is an excellent source of plant protein with 40-42 % and with regard to limiting
essential amino acids lysine and methionine 3% and 0.64% respectively (WHO/FAO/UNU
Expert Consultation, 2007). Fortifying cassava with soybean and developing a product such as
flakes makes it a nutritionally balanced product that can be used in nutritional intervention
programs for problems of PEM, improved mineral content with regard to Zinc and Iron. . In
addition, it has also been established that apart from the excellent protein profile of soy beans
they are also capable of lowering blood cholesterol, amino acids content are able to lower blood
pressure which is highly linked to conservation of calcium ions (Dadson and Noureldin, 2001).
Processing of flakes can create employment opportunities that can help improve the livelihood
of individuals and economic welfare. Flakes are also convenient by the fact that they are ready
to eat requiring minimal preparation and probably longer shelf life than the common composite
flours among other products. Moreover, CSB flakes are hypoallergenic due to absence of
gluten. As a result this makes CSB flakes an ideal gluten free alternative to wheat and wheat
related RTEBC which according to Taylor and Hefle (2001) cereals with gluten rank top 8
most common causes of food allergies.
Moreover, western Kenya is one of the two regions in the country known for cassava
production. It’s also a main region where soy bean is grown in the country hence ease of
diversification of cassava based diets to the community.
1.4 Study Aim
Aim of the study is to contribute towards enhancing food security especially in Kenya and sub-
Saharan Africa with regard to protein energy malnutrition.
4
1.5 Purpose of the Study
The data generated by this study will help to profile the quality characteristics ranging from:
nutrition aspects, color, taste texture and general acceptability and shelf-life of the cassava-soy
flakes.
1.6 Objectives
1.6.1 Overall objective
To develop acceptable Cassava Soy Bean breakfast flakes with improved protein and minerals.
1.6.2 Specific objectives
1. To evaluate proximate compositions and processing methods to improve
chemical safety of cassava and soy bean.
2. To develop Cassava-Soy bean Flakes with enriched protein and minerals.
3. To determine shelf stability of most acceptable formulation of Cassava- soy bean
flakes in comparison with cassava flakes.
1.7 Study Hypothesis
1. Proximate composition of cassava and soy bean are not significantly different, chemical
safety of cassava and soy bean are not significantly different before and after
processing.
2. Nutrition, safety and acceptability of cassava-soy bean flakes is not significantly
different from cassava flakes.
3. The shelf stability of most acceptable CSB breakfast flakes is not significantly different
from that of cassava roots.

5
CHAPTER TWO: LITERATURE REVIEW
2.1 Cassava Production and Utilization: Global, Africa and Kenyan Trends
Cassava (Manihot esculenta Crantz) is a crucial crop with adequate amount of carbohydrates,
B vitamins, calcium, Vitamin C and other essential minerals required for growth of a healthy
individual. Principally it is grown for its starchy roots which provides excellent calorific value
to millions of Africans. In 16th Century, Portuguese introduced Cassava into Africa and later
spread to East Africa through Zanzibar. Since then diffusion of cassava especially in sub-
Saharan Africa can be described as self-spreading innovation (Hillocks, 2002). According to
Jarvis et al., (2012) nearly all countries located between latitude 30o north and south of equator,
with rainfalls of 50 millimeters to five meters annually, and to poor soils with a pH ranging
from acidic to alkaline. These conditions are common in certain parts of Africa and South
America.
Studies have shown that cassava is an important perennial crop and act as a source of
carbohydrate to over 800 million people throughout the world; with a competitive edge among
other sources of starch in that it is a drought resistant crop and requires little agronomic inputs.
In addition it is perfectly adapted to traditional mixed cropping systems (Montagnac et al.,
2009a). Most African countries are victims of poverty, hunger and HIV/AIDS pandemic, it is
also a continent whereby population growth is increasing at a higher rate than food production.
Therefore Cassava being a nutritive and hardy crop can be viewed as one of the crop that can
help forestall food insecurity in Africa continent (Achidi et al., 2017). According to
(FAOSTAT 2014), world cassava production has risen to 268000 metric tons of which 146000
metric tons being from Africa. Narrowing to Africa, West Africa region has the highest
production of cassava of 87300 metric tons. Kenya production of Cassava is 858000 tons this
6
translates to 0.005% of total Africa production. This clearly shows that Kenya’s production is
still low compared to other African nations that produce cassava.
According to Hongbété et al., (2009), millions of people in East, Central and West Africa
depend on cassava as their main source of calories. Approximately 70% of all cassava grown
in Africa is from Nigeria, this can explain why the West Africa region has the highest
production in Africa (Nhassico et al., 2008). In Sub-Saharan Africa, cassava cultivation is a
major factor in food security. During harvesting time, farmers enjoy flexibility as the root can
be left in the ground until it is needed, this ensures food availability (Sarr et al., 2014). In
addition, cassava is able to grow in marginalized areas, requires low farm inputs, resistant to
pest and diseases and yet produce satisfactory yields. As reported by (Patrick, 2015) when the
crop is faced by drought, it sheds its leave and its large roots keeps it alive and sprouts again
when rain comes. On average, Kenya produces about 500,000 tons of cassava every year.
In Kenya cassava production is mainly concentrated in three main regions namely: central,
western and coastal regions. Among the three regions western produces and consume about
60% of total cassava produced national wide (Githunguri et al., 2015). As reported by Ndung’u
(2012), Eastern (former eastern and central province), the coastal ( former Coast province),)
and Western (former Nyanza and Western province) regions accounts for 10%, 30% and 60%
respectively. For the last two regions cassava seconds maize in importance hence the two
remains the sole producers of cassava in Kenya (Obiero et al., 2007).
Using the International Food Policy Research Institute (IFPRI), total world cassava use is
expected to increase from 172.7 million tons to 275 million tons between the years 1993-2020.
In Africa the majority of cassava produced about 80% is utilized as human food with over 50%
utilized in processed forms to products such as paste, flour, and chips, it can also be prepared
into cooked food serving both in urban and rural areas as a source of dietary energy; other

7
products processed from cassava include: cassava flakes, fufu, gari, macaroni more common
in Western Africa region (Westby & Me, 2002). A study carried out by (Gegios et al., 2010)
reported that the need for processed High Quality Cassava Flour (HQCF) for use by local food
processors has provided great potential to small scale flour producers in the country,
nevertheless, the rising urbanization, quality and safety of the flour has raised concern.
Cassava roots and leaves constitute 50%- 10% of the mature root and these are the most
nutritious parts of the plant (Charles, 2016). Potential yield of the growing areas in Kenya is
50- 70 tons/ha compared to actual yields of 10 tons/ ha which has been attributed to farmers
growing low yielding varieties, poor crop management practices and also a common viral
disease known as cassava brown streak disease (Jennings, 2003). According to Githunguri et
al., (2015), cassava roots are mainly used for human consumption as well as animal feeds.
Among the locals cassava leaves are a common vegetable while the roots are consumed boiled
or fried (Ceballos et al., 2006).
A study done by Kiura et al., (2012) reported that approximately 38% of the cassava produced
is consumed domestically and about 51% of farmers are involved in chips manufacturing for
sale to flour and feed processors as an intermediate raw material. Utilisation of cassava
composite flours for making products such as porridge, breads, chapattis, and unleavened bread
has also been achieved though not well adopted by majority of processors Nungo et al., (2012).
Nonetheless, the Western region communities peels the roots and cut them into smaller pieces
(cassava chips) which are then dried and combined with cereals such as maize, sorghum and
millet which are then milled to make composite flours for making ugali or porridge for weaning
children (Nungo et al., 2012). According to Ndung and Muli (2007), the Coastal region of
Kenya use cassava leaves as vegetable while in Eastern region (Kitui and Machakos) is chewed
as a snack when boiled or roasted.

8
As intimated by Valdivia et al., (2014), cassava serves as a staple food of Western Kenya region
and is intercropped with other local food crops such as maize, soybeans, sorghum and millet.
Studies has shown that the region produces and consumes 60% of national output of Cassava.
However, hydrogen cyanide presence in the roots has lowered the quality of the roots and this
has been attributed to rejection of cassava utilization decreasing its popularity among the
communities in Kenya (Montagnac et al., 2009a).
2.2 Common Hazards in Cassava and Cassava Products
According to (Obadina, Oyewole, Sanni, Tomlins, & Westby, 2008), cassava growing
communities have adopted most common and economic method of drying cassava to lower its
moisture content to arrest its perishability. The method involves cutting cassava roots into
chips, grating the roots and drying them in open space to dry naturally by heat from the sun.
As a result the chips to be dried are exposed to dust, insects, animal contamination and other
environmental hazards. A study done by Odom, Udensi, and Nwanekezi, (2012) reported that
the drying of the chips is usually done under unhygienic conditions leading to contamination
of the products with Staphylococcus and E.coli from human and animal sources during
handling, packing and utensils used in size reduction of the bulky roots.
The climatic conditions in countries around the tropics in Africa favors fungal growth that leads
to production of mycotoxins as secondary metabolites, fungal contamination can occur at any
stage ranging from the field when growing and harvesting, processing, packaging and also
during transportation (Bankole & Adebanjo, 2003). Therefore, appropriate quality control is
required when the roots are at the farm until they reach the folk. A study done by Wareing, et
al, (2001) intimated that predominant fungi in cassava are Aspergillus and Fusarium species,
the study also reported that Fusarium species had been isolated from Ghanian cassava chips
which can lead to fumonisin contamination. Environmental conditions such as humidity,

9
temperature, rainfall during pre-harvest and harvesting periods and drought stress contributes
to contamination of roots with fungi which are all common in countries in sub-Saharan Africa
countries that grows cassava (Fandohan et al., 2005). Study have reported that exposure to
mycotoxins can have both acute and chronic effects with the worst being carcinogenicity of
mycotoxins (Williams et al., 2004). To overcome contamination of both bacterial and fungal
contamination of cassava proper practices need to be emphasized especially during farming
and processing to enhance safe quality cassava products in the market for which are free from
off flavors, discolored and free from moldy taste.
Cassava roots contain quite a considerable amount of anti-nutrient factors that hinder its
utilization and popularity too among communities. Presence of cyanogenic glucoside act as a
natural defense mechanism against predators (Hongbété et al., 2009). Study reveals that there
exist three sole cyanogens in cassava which are and free hydrogen cyanide (HCN), linamarin,
and acetonehydrin (lotaustralin), the last two undergoes enzymatic hydrolysis by plant
endogenous enzyme linamarase to release free cyanide which in total contribute to cyanogenic
potential of cassava roots (Achidi et al., 2017). According to Nhassico et al., (2008), other than
the genetic factor of cassava roots, stress factors such as movement of a genotype from its
locality to a totally new area with different climatic conditions has significant contribution to
the amount of cyanide produced by the roots. The concentration of the cyanide has been
quantified highest in the leaves followed by roots parenchyma with levels up to 53 to 1300 and
10 to 500 mg cyanide equivalents/kg dry matter respectively (Charles, 2016). Bitter varieties
of cassava have cyanide content that exceeds the one recommended by FAO/WHO 1991 of 10
mg/ cyanide equivalent/kg dry matter.
Among cassava eating populations health disorders have been reported showing that
consumption of cassava products with even 50 to 100 mg of cyanide/kg dry matter can result
to serious acute poisoning which is even lethal to adults (Montagnac et al., 2009a). Some of
10
the common signs of acute cyanide poisoning include: vertigo, cardiac arrhythmias, vomiting,
lack of motor coordination, headaches, weak pulse, stupor, convulsions and can result to coma
(Famurewa & Emuekele, 2014). Lethality of consuming low amount of cyanide is low but in
the long run can result to severe chronic health effects such as glucose intolerance, tropical
ataxic neuropathy and when combined with low iodine intake can result to goiter and crenitsm
(Bankole & Adebanjo, 2003). According to a study done by Ernesto et al., (2002) in
Mozambique, it reported that Konzo an upper motor neuron condition characterized by
irreversible spastic paraparesis and other developmental disorders, was associated to
consumption of cassava varieties with sub-lethal concentration of cyanide which is more
prevalent in women and young children. Studies done in Congo have reported similar results
(Banea et al., 2014). Several methods exist for cassava detoxification before consumption.
They include: peeling and pounding, grating, boiling, roasting and fermentation. In this study,
peeling, boiling and fermentation will be employed to reduce the cyanide contents of the roots
as studies have shown they are more efficient. Attempts have also been made to develop low
cyanogen content cassava varieties although much has not been done on agricultural education
and extension on it. These cassava varieties provide a significant food safety risk from cyanide
poisoning which needs to be addressed.
2.3 Nutritional Contribution of Cassava
The nutritional composition of cassava roots varies with the part of the plant being consumed
(leaves and roots) and other factors such as variety, geographical location, environmental
conditions and age of the plant. For a mature cassava plant, on average roots and leaves
constitute of 50% and 6% respectively which forms nutritionally important parts of the plant.
Cassava has been ranked high due to its enormous amount of energy stored in the roots Gegios
et al., (2010). A 100g fresh weight of the roots has been reported to yield 145.93 kcal compared
to the same amount of sweet potato that yields 110.05 kcal hence positioning it first among
11
other common sources of energy such as maize and tubers (Valdivia et al., 2014). Naturally,
it’s an energy reserve with high carbohydrate content which ranges from 32-35g/100 g on fresh
weight basis and 80-90g/100g dry weight basis (Tivana, 2012). The roots have a fiber content
that does not exceed 1.5%, however, the level is dependent on the variety and age of the root.
Upon exceeding the physiological maturity, the roots become woody and fiber content may
exceed the mentioned level (Charles, 2016).
Lipids in cassava roots ranges between 0.1-0.3 % on fresh weight basis and this is quite low
compared to other starchy crops that yields lipids too such as maize (Montagnac et al., 2009a).
Of concern is the protein content of the roots which is as low as 1- 3% on dry weight basis and
0.4- 1.5 g/100g on fresh weight basis compared to that of other common starchy staple foods
such as sorghum and maize which have about 10 g/100g on fresh weight basis (Ceballos et al.,
2006). With exception of soybean the roots have almost equal amounts of minerals and
vitamins common in legumes such as: calcium, magnesium, zinc, iron, potassium and
manganese. Vitamin C level in roots is quite high to levels of 45g/100g edible portions.
However the roots are poor source of B vitamins most of which are lost during processing
(Wobeto, et al., 2006). More important is the quality of protein which is determined by the
composition of amino acids especially limiting ones which animals and human beings cannot
synthesis but only obtain from plant sources. Some essential amino acids such as cysteine,
tryptophan, lysine, and methionine are very low hence a need arises for diversification of diet
or value addition of cassava based products especially to communities that solely depend on
cassava as staple food. Nevertheless, a study done by Vanderschuren, & Stupak, (2006) has
shown that cassava leaves have considerable amount of proteins of 14-40% of dry matter which
is dependent on variety, age and proportional size of stems and leaves. Despite the high amount
of protein in the leaves, a gap still exist in the amino acid profile as the leaves have very little
or lack the limiting essential amino acids namely lysine, methionine and probably isoleucine
12
(Montagnac, et al., 2009c). With the roots being highly utilized than the leaves among
communities, an intervention is needed to protect millions of individuals’ especially young
children who are at risk of facing chronic protein deficiency. A study by Nungo et al., (2012)
in Western Kenya suggested that it would be of benefit adding value to cassava based products
or diversify the diets with regard to protein quality to improve the nutrition status of children
who depend on cassava during weaning stage. This gap formed the backbone of this project
that will focus on improving the protein quality of cassava product (flakes) using a soy bean
that has considerable amounts of these limiting essential amino acids such as lysine and
methionine.
2.4 Soy Bean Production: Global, Africa and Kenyan Trends
Domestication of soybean first started in China between 2500-2300 BC (Hiu and Chang, 2010).
South and South East Asia were the initial habitats of the crop as a result of migration and
settling of the locals. It is until early 19th Century when the crop was introduced to France and
England as an ornamental crop (Hartman, et al., 2011). The crop gained popularity first in
Yugoslavia when it was first grown as an animal feed due to its high energy values contributed
by its oil content of up to 20%. According to (Kolapo, 2010), soy bean was introduced to other
parts of the world through French and British Imperialism in the entire 19th Century. Therefore
there is no doubt that as the British colonialized Kenya introduced Soybean farming in the year
1909 and regarded it promising. (Bulletin of Imperial Institute, 1909)
In Eastern Africa, Kenya has the highest demand of soy bean of over 10000 annually (Tinsley,
2009). According to (FAO, 2008, FAO, 2012), reports shows that the annual production has
never been more than 5000 MT creating unmet demand of 95% compared to annual demand.
This gap is filled by imports from other countries which are large producers of the crop namely
Uganda, (Tinsley et al., 2009), Zibambwe, Malawi, Zambia, Argentina and lately Brazil

13
(Chianu et al., 2008). U.S.A and China also exports a few Soy bean products to Kenya.
According to (FAO,2008) Kenya spent US $ 27.54 million to import Soy bean from other
country to meet the demand an amount that can easily deplete the foreign exchange earned
from other exported crops and from other sources. As a result, this has an enormous implication
on the balance of trade and exchange rates affecting the stability of the country economically.
In Kenya Soy bean is mainly grown in two key regions namely Central highlands and Western
region. In Central highlands region it’s grown in the following areas: Meru, Tharaka Nithi,
Embu and Kirinyaga Counties. In Western region it comprises of the following areas:
Bungoma, Tranzoia, Busia, Nyamira, Kisii, Vihiga, Homabay, Siaya, Migori and Kakamega
Counties. The latter region has higher productivity than the former (Nungo et al., 2012)
When British Colonialist introduced Soy bean to Kenya in 1909, their ultimate intention was
to have an industrial crop that would help justify establishment of the colony, provide raw
materials for the British Industries and provide finances for the construction of the Kenya-
Uganda Railway (Tarus, 2004, Mark, 2010, British Imperial institute, 1909). At the beginning,
locals were not allowed to grow the crop as compared to other cash crops introduced during
the time like coffee and tea. They were also not allowed to utilize it until the World War II
when it was realized Soy bean had a solution to malnutrition problem cases among Africans
(Graham, 1943; Halcrow, 1939). Efforts were made by the British colonialist to introduce large
scale mechanized commercial production of Soy bean but it did not pick up and it was
abandoned in 1950. Reasons for the failure were attributed to: poor germination rates and
inoculation, lack of uniformity in maturity, high shuttering and diseases (Kolapo, 2011;
Thorpe, 1953). The other main contributor to the failure of the crop was the hut tax. Native
farmers were subjected to high taxes from income generated from farming crops introduced by
the British. They felt that if the adoption of crop was successful, hard labor and high tax burden
would follow. This hindered the crop from being adopted by the locals (Tarus, 2004). This

14
explains why Soy bean farming lagged behind in Kenya as other African countries, Latin
America and USA had a trajectory move in adopting the crop.
2.5 Soy Bean and Nutrition
There has been an increase in consumption of Soy bean and Soy bean products owing to its
health benefits. Nutritionally soy bean is a major source of protein, some vitamins, minerals,
B-vitamins, calcium, omega-3 fatty acids and dietary fiber when it is consumed wholly.
According to Lokuruka, (2010), animal protein can be substituted by soy protein due to its
complete protein profile when compared to other legumes. It contains all essential amino acids
with exception of methionine which must be supplied in the diet because the body cannot
synthesize them. It’s also limited in Sulphur containing amino acids but its lysine level is high
enough to curb lysine deficiency in cereals (Awasthi, et al., 2012).
The high biological value of soy bean protein together with the high level of protein increases
its food and feeding value which owes to it its high economic value over the other oil seeds.
2.6 Soybean Lipids and Micronutrients Profile
Soy bean being a high seed oil it provides essential calories and vitamins especially the fat
soluble ones, Vitamin D, A, K and E. Its Iodine value is among the highest of 134 almost
similar to that of sunflower, maize, peanut butter of 101, 51 and 127 respectively indicating
high level of unsaturation. The fatty acids linoleic, oleic, palmitic and linolenic make more than
85% of the total fatty acid content in the oil hence contributing to the high unsaturation. It’s for
this reason soy bean has been associated with lowering serum cholesterol (Bluckner, 2000).
Upon ashing, dry soybean has an ash content of 5% which is quite considerable. The minerals
majorly exist in the form of phosphates, sulphates and carbonates. Some of the major mineral
elements are Potassium phosphorous, magnesium, Sulphur calcium, chloride and sodium in
that order. Minor mineral elements are silicon, iron, zinc, selenium, molybdenum, chromium

15
and selenium among other. The components mentioned above are dependent on factors such
as season, variety and cultural practices. In general, mineral bioavailability after consumption
of animal foods is higher than that of plants foods. In soy foods calcium, and phytate associate
to form complexes that makes the biologically unavailable. This reduces zinc absorption by a
greater margin than pytates.(Samuel, et al., 2012).
According to Maggie and Covington (2004), soy bean contains considerable amounts of alpha-
linolenic acid and linoleic acid with Omega -6 fatty acids being more than other omega -3 oil
seeds. As a result this qualifies soy bean oil as a source of both omega -6 and omega-3 oils.
Omega -3 oils are precursors of the eicosanoids-prostaglandins, thromboxanes and leukotrienes
which have been shown to have vasodilatory, anti-thrombotic, anti-arrhythmic and anti-
inflammatory effects. In addition, eicosanoids have been shown to have inhibitory effects
against cardiovascular diseases.
2.7 Anti-nutrient Factors in Soybean and their Deactivation
Soy bean is the principal source of cheap and affordable high quality plant protein among all
other legumes. However, it is faced with a major limitation diverse compounds which have
anti- nutritional properties especially if consumed in large amounts. As reported by Yasothai,
(2016), these anti-nutrients decrease the nutritive value of the soy bean and if taken in large
amounts for can be fatal to both human and animals and also results to health problems.
Consequently, this has elicited research on breeding programmes to develop varieties which
have low amounts of these anti-nutrient factors. Processing methods have been shown to reduce
the anti-nutrient though not completely (Samuel et al., 2012). Main Anti- nutrients factors
include: protease inhibitors (Trypsin) – Kunitz trypsin inhibitor (KTI) and Bowman-Birk
inhibitor, and lectins. Of the total protein content in Soybean, 6% is composed of protease
inhibitors. Others are Glycinin 150-200 mg/g and 40-70 mg/g; β-conglycin 50-100 mg/g and

16
10-40 mg/g; Saponins 0.5% and 0.6%; Oligosaccharides 14% and 15%; Phytic acid 0.6% and
0.6%.
About, 80% of the trypsin inhibition is caused by KTI, which strongly inhibits trypsin and
hence lowers intake of food by decreasing their digestion, absorption and utilization. In
addition, KTI causes, hyper secretion, induction of pancreatic enzyme and the fast stimulation
of pancreas growth, hyperplasia and hypertrophy (Miki, et al., 2009).
Heat treatment of soy bean before utilization denatures trypsin inhibitors. According to Samuel
et al., (2015) right heat treatment lowers the levels of trypsin inhibitors by more than 90%.
Plant breeders have managed to develop varieties of Soy bean with low amount of trypsin
inhibitors. Consequently, this has lowered significantly amount of heat treatment that is
subjected to the raw soybean before utilization which to an extent can denature the proteins.
This has also reduced the processing cost of feeds to animal feed manufacturers.
In plant kingdom, there is a wide distribution of lectins which are proteins with specific
characteristic to bind specific molecules containing carbohydrates which results to
agglutination of red blood cells (Pan et al., 2013). In soy bean the agglutinin present reduces
functionality of the microvilli. According to Kaviani & Kharabian, (2008), this leads to
increase in weight of small intestines due to hyperplasia of crypt cells and also reduction in
viability of the epithelial cells. It has been shown that soy bean agglutinin can be destroyed by
moist heat during processing. However they are resistant to dry heat.
Phytate levels in Soy bean ranges between 1-2.3%. They have an effect of complexing with
mineral elements such as magnesium, calcium, phosphorous, zinc, iron and copper (Trimble &
Trimble, 2009). Among the mentioned minerals the most chelated is phosphorous where about
two thirds is bound to phytic acid. Phytates are not destroyed by heat but a breakthrough has

17
been found by developing Soy bean genotypes with low phytate levels through genetic
engineering (Spear, 2006).
Other than the mentioned anti nutrients, physiologically active compounds are also found in
soy bean which include tannins, saponnins, antivitamins and isoflavones which have small or
unknown effects.

18
CHAPTER THREE: PROXIMATE COMPOSITION AND PROCESSING METHODS
TO IMPROVE CHEMICAL SAFETY OF CASSAVA AND SOY BEAN
3.1 Abstract
In spite of increased cassava production in Africa, utilization is impeded by short shelf life and
HCN. Further, it’s poorly endowed with quality protein and minerals. Soy bean can be utilized
to offset the nutrition deficiencies of cassava to make a shelf stable and nutritious product.
However, utilization is also hindered by presence of anti-nutrients. The study sought to develop
appropriate methods of processing cassava and soy bean to lower HCN content and anti-
nutrients to safe levels. Two cassava varieties were used in the study. Significant difference
(p<0.05) was observed in HCN content for both varieties except for the last two days of
soaking, with final level of 18.98 and 29.88 mg/kg for Meru and Western Kenya variety from
initial levels of 36.71 and 88.56 mg/kg respectively. Pulping the soaked roots and drying them
in an air oven at 500C for 3 days further lowered HCN content to 9.62 and 10.33 mg/kg for
Meru and Western Kenya variety respectively.
Soy bean was subjected to four treatments targeting to lower phytates, tannins and Trypsin
Inhibitors. Soaking soy beans for 24 hrs, germinating the beans for 24hrs, drying for 24 hrs
followed by roasting at 2000C for 5-8 minutes. This reduced initial levels of 31.5 mg/100g,
1.22 mg/100g and 35.85 TIU to 0.98 mg/100g, 0.97 mg/100g and 3.66 TIU of tannins, pytates
and trypsin inhibitors respectively. Proximate composition revealed significant differences
with regard to protein and ash content of soy bean and cassava.

19
3.2 Introduction
In the tropics cassava roots are important source of calories covering about 60% of calorific
needs in tropical Africa and Central America. By quantity it ranks third most important after
corn and rice in the tropics (Hounhouigan, 2014; Kobawila,et al., 2005). However, a major
setback facing its utilization is the existence of cyanide, a natural chemical hazard which if
not lowered to safe levels of less than 10 ppm in roots has toxic acute and chronic health effects
to human being (Montagnac et al., 2009c). Several methods can be employed to lower cyanide
content in cassava. However, the rate of removal is dependent on the initial level of cyanogen
in the roots. A study done by Andama and Oloya (2017) found that soaking of cassava roots
before sun drying leads to greater removal of cyanide content of up to 97.8% to 98.7%.
Nevertheless, post-fermentation processes are very important in cyanide removal due to
stability of cyanogen at low pH during fermentation process.
In animal and human diets, legume protein forms a significant source of cheap quality protein.
With regard to soy bean, it is an important legume due to its high protein content and excellent
amino acid profile. Its steady supply and reasonable pricing makes it affordable and a cheap
source of high quality protein (Bajpai, et al., 2004). Nonetheless, Soybean nutritional value is
lower than expected, regardless of its high protein content and excellent amino acid content.
This is attributed to anti-nutritional factors such as trypsin inhibitors, phytates, lectins, tannins
and protease inhibitors. A study done by Franco-Fraguas et al., (2003), reported that of all the
anti-nutrient factors in soybean, protease inhibitors are most significant and have been
successfully removed by heat treatment though to varying degrees.
Therefore, the present study evaluated the most appropriate fermentation time combined with
pulping and drying to lower cyanide content of roots to safe levels as well as the most
appropriate method of lowering anti-nutrient factors with regard to phytates, trypsin inhibitors
and tannins. In addition, it evaluated the difference in nutritional composition of the two raw
20
materials with a view to providing evidence that soybean can be used to supplement the
nutritional composition of cassava.
3.3 Materials and Methods.
3.3.1 Sampling of cassava roots and soy bean.
Markets were identified in Nairobi where produce from upcountry are brought for marketing
due to the large numbers of consumers around the city environs. For cassava two markets were
identified namely: Muthurwa and City Park market in Westlands. Purposive sampling of the
markets was considered and the samples collected were according to availability and came
from two regions in the countries which are main producers of Cassava. In Muthurwa a variety
from Western Kenya was sampled and at City Park market a variety from Meru was sampled.
The samples were then packed in airtight bags to prevent contamination and transported to
University of Nairobi Chemistry lab for analysis.
Soy bean was sampled randomly from one of the main cereals markets in Nairobi, namely
Nyamakima market. It was packed in kraft paper and transported to University of Nairobi
Chemistry lab for analysis.
3.3.2 Determination of proximate composition of cassava and soy bean as raw materials
Proximate composition was assayed according to the standard AOAC (2008) methods for
cassava and soy bean.
3.3.2.1 Moisture content
A sample of 10g was dried in an oven and moisture content determined according to AOAC
(2008 method 967.08)
3.3.2.2 Protein content
Crude protein content of the samples was determined using the micro-Kjeldahl method
(AOAC, 2008 method 988.05).

21
3.3.2.3 Crude ash
Crude ash determination was done according to AOAC (2008 method 942.05). A sample of
2g of sample was weighed into a crucible whose weight is known and ignited. Contents together
with the crucible were ignited at 600 0C for 2 hours. The crucible was weighed again upon
cooling.
3.3.2.4 Crude fat
Crude fat was measured as per the method (AOAC, 2008 method 2003.06). A dry sample of 2
g was weighed into a cellulose thimble and plugged with glass wool. The fat extraction was
carried out in soxhlet apparatus for 16 hours with 150 ml of petroleum ether. The extract in the
flask was evaporated on steam bath. The extract in the flask was finally dried in the hot air
oven at 103°C for 30 minutes, cooled in a desiccator and weighed.
3.3.2.5 Crude fiber
Crude fiber was determined according to the (AOAC, 2008 method 958.06). A sample of 2 g
was subjected to digestion using 100 ml of 0.25N sulphuric acid and then filtered through a
fiber sieve cloth. The residue was further digested by addition of 100 ml of 0.31N NaOH and
sieved through a fiber sieve cloth again. To the residue, 10 ml of acetone was added to dissolve
any organic constituent. The residue was washed further with 50 ml hot water twice on the
sieve cloth and put into a crucible to be oven-dried at 105°C overnight. Then the oven-dried
crucible with the residue was weighed upon cooling and further drying in a desiccator. The
oven-dried residue was subjected to ashing at 550°C for 4 hours. The weight lost was then
determined to represent the crude fiber content.
3.3.2.6 Carbohydrates
Carbohydrate content was determined by the difference in the composition and the total mass
(100% - (Moisture Content+ Crude fat + crude protein + Crude ash + Crude fiber).

22
3.3.3 Calorific Value
Caloric value was determined by Wilwater conversion factor; Energy= 4 kcal /g (protein) + 9
kcal/g (fat) + 4 kcal/g (carbohydrates) based on Pearson, (1976) formula.
3.3.4 Experimental Design to determine optimum fermentation time for cassava roots
Two varieties based on the region grown were used in the experiment as described in the
sampling procedure. Fermentation method was used to lower cyanide content whereby after
peeling and cutting the roots into small pieces approximately 5cm3, cyanide content was
determined before fermentation at zero days. Fermentation was then carried out and cyanide
levels determined after every 24 hrs for 4 days. From the experiment, the most optimum
fermentation time was adopted and combined with post fermentation processes namely pulping
and drying to process the roots before milling into flour.
3.3.5 Determination of cyanide
The hydrogen cyanide (HCN) content of cassava roots was analyzed using AOAC method
(1990). 10 g of the sample was mixed with approximately 100 ml distilled water in a distillation
flask. The distillation flask was then connected to the distillation unit and allowed to stand for
at least two hours. The mixture was then distilled and approximately 200 ml of the distillate
collected in a volumetric flask containing 25 ml of 2.5% NaOH solution; a portion of 8 ml of
5% KI solution was added to 100 ml of distillate and titrated against 0.02 N silver nitrate
(AgNO3) solution. The end point was indicated by a faint but permanent turbidity. The HCN
content was calculated as: 1 ml of 0.02 N Silver Nitrate being equivalent to 1.08 mg of HCN
per 10g and then expressed as HCN mg/kg of sample. Analysis was done in duplicates.

23
3.3.6 Experimental design to determine most appropriate method(s) of lowering anti-
nutrients levels in Soy bean
Soy bean was subjected to four treatments namely: Treatment 1=Soy bean soaked in water for
24 hrs, Treatment 2= Raw soy bean which acted as the control, Treatment 3= Soybean soaked
for 24 hrs, germinated for 1 day, dried in an air oven at 1000C for 24 hrs then roasted at 2000
C for 5-8 minutes until golden brown, Treatment 4= Raw soy bean subjected to roasting at
2000 C for 5-8 minutes until golden brown. Most suitable method that lowered anti-nutrients
with focus to: phytates, tannins and trypsin inhibitors was adopted to process the soy bean
before milling them into flour.
3.3.7 Determination of phytate
Phytate were analyzed according to the method described by Latta and Eskin, (1980) . A sample
of 1 g was defatted by adding 10 ml of petroleum ether and left to stand for 2 hrs, decanted and
let to dry. Hydrochloric acid (10 ml at 2.4%) was added to the dried samples and centrifuged
(Dr. Ngerber, K.Schneider & co, Zurich, Centrifuge) for 10 minutes at 482.97 g. Centrifuging
was repeated four times, each time the supernatant was collected in 100 ml volumetric flask.
Wade reagent (2 ml mixture of 0.03% Iron chloride and 0.3% sulfosalicyclic acid) was added
to 2 ml of sample solution and topped up to 10 ml. Absorbance was read at 500 nm (Single
beam spectrophotometer, Milton Roy Company, Spectronic 1001, USA). Phytate content was
calculated as g/100 g using phytic acid standard curve prepared as described by Latta and Eskin
(1980).
3.3.8 Determination of tannins
Tannins were analyzed as per AOAC (2012) 19th edition, method number 952.0 with
modification. Follins denis reagents was prepared as per Ferreira et al. (2004). Approximately
0.5 g sample was extracted with 50 ml of distilled water, vortexed for 5 minutes and left to
decant. Folins Denis reagent (2 ml) was added to 75 ml of distilled water followed by 2 ml of
24
sample solution and finally 5 ml of concentrated sodium carbonate was added. The total
mixture was topped up to 100 ml, vortexed and left to stand for 40 minutes before reading
absorbance at 725 nm (Single beam spectrophotometer, Milton Roy Company, Spectronic
1001, USA).
3.3.9 Determination of trypsin inhibitors
Trypsin inhibitors were analyzed as per a Manual of Laboratory Techniques National Institute
of Nutrition (Indian Council of Medical Research Hyderabad. 500 007 India). Four grams of
the pulverized defatted soy bean was treated with 40 ml of 0.05M of Sodium Phosphate buffer
pH 7.5 and 40 ml of distilled water. The samples were shaken for 3 hrs and then centrifuged at
700 g for 30 minutes at 150C. The supernatants were diluted in such a way that there was an
inhibition between 40 and 60% of the control enzyme activity. The incubation mixture
consisted of 0.05 ml of TI solution, 2 ml of 2% casein, 1.0 ml of sodium phosphate buffer (pH
7.5, 0.1M), 0.4 ml HCl (0.001 M) and the extracts 0.1 ml. In all the cases the total volume of
incubation mixture was kept at 4 ml. Incubations were carried out at 370C for 20 minutes after
which 6.0 ml of 5% TCA solution was added to stop the reaction and corresponding blanks
were run concurrently. In this method, one Trypsin unit (TU) is arbitrarily defined as an
increase of 0.01 absorbance unit at 410 nm in 20 min for 10 ml reaction mixture under the
conditions described and the trypsin inhibitory activity as number of trypsin units inhibited
(TUI).
3.3.10 Statistical analysis
The experiments in this study are reported as mean ± standard deviation of triplicate
determinations. The statistical analysis of data was by independent t- test and Analysis of
Variance (ANOVA) at 5 % level of significance using the programme Genstat Version 15.
Means were separated using the Tukeys’ honest significance difference post hoc test.
25
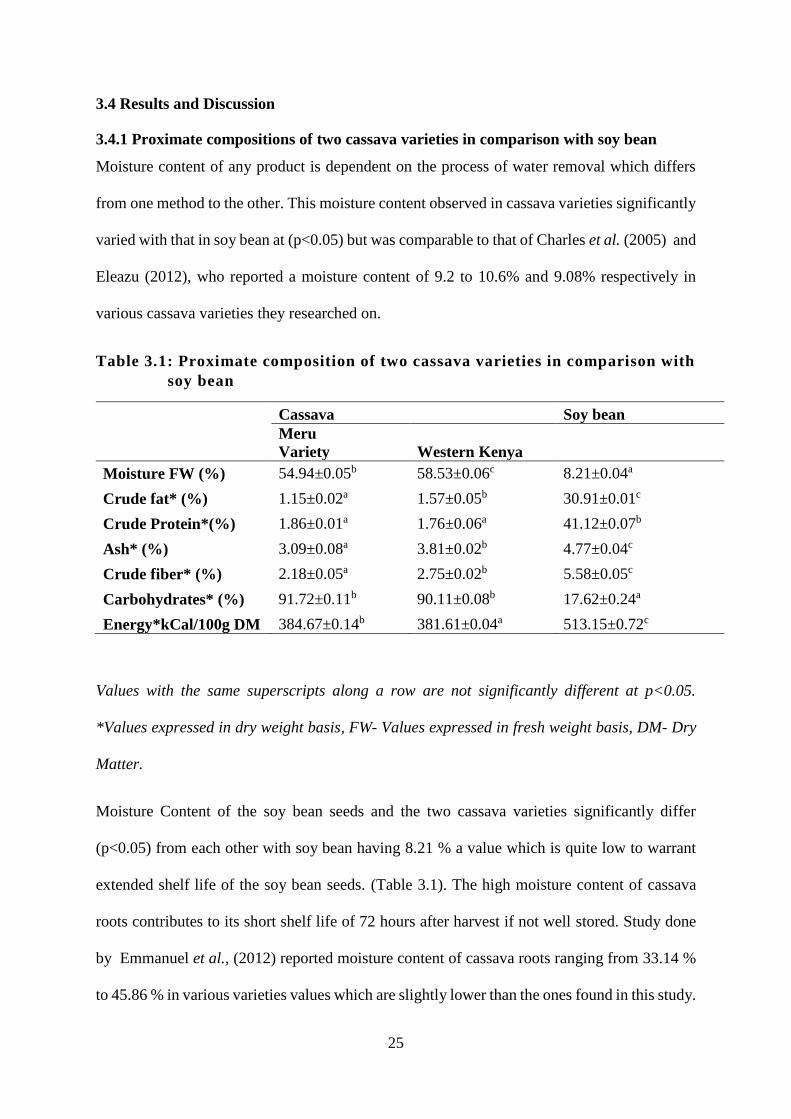
3.4 Results and Discussion
3.4.1 Proximate compositions of two cassava varieties in comparison with soy bean
Moisture content of any product is dependent on the process of water removal which differs
from one method to the other. This moisture content observed in cassava varieties significantly
varied with that in soy bean at (p<0.05) but was comparable to that of Charles et al. (2005) and
Eleazu (2012), who reported a moisture content of 9.2 to 10.6% and 9.08% respectively in
various cassava varieties they researched on.
Table 3.1: Proximate composition of two cassava varieties in comparison with
soy bean
Cassava Soy bean
Meru
Variety Western Kenya
Moisture FW (%) 54.94±0.05b 58.53±0.06c 8.21±0.04a
Crude fat* (%) 1.15±0.02a 1.57±0.05b 30.91±0.01c
Crude Protein*(%) 1.86±0.01a 1.76±0.06a 41.12±0.07b
Ash* (%) 3.09±0.08a 3.81±0.02b 4.77±0.04c
Crude fiber* (%) 2.18±0.05a 2.75±0.02b 5.58±0.05c
Carbohydrates* (%) 91.72±0.11b 90.11±0.08b 17.62±0.24a
Energy*kCal/100g DM 384.67±0.14b 381.61±0.04a 513.15±0.72c
Values with the same superscripts along a row are not significantly different at p<0.05.
*Values expressed in dry weight basis, FW- Values expressed in fresh weight basis, DM- Dry
Matter.
Moisture Content of the soy bean seeds and the two cassava varieties significantly differ
(p<0.05) from each other with soy bean having 8.21 % a value which is quite low to warrant
extended shelf life of the soy bean seeds. (Table 3.1). The high moisture content of cassava
roots contributes to its short shelf life of 72 hours after harvest if not well stored. Study done
by Emmanuel et al., (2012) reported moisture content of cassava roots ranging from 33.14 %
to 45.86 % in various varieties values which are slightly lower than the ones found in this study.
26
Moisture content is influenced by factors such as age and variety of cassava roots. As the roots
age, they becomes more fibrous and moisture content decrease and dry matter increase.
Fat content of the two cassava varieties and soy bean significantly varied at (p<0.05) with Meru
variety having a higher value than Western Kenya variety. Fat content observed in Meru variety
of 1.15 % which is in range but slightly higher with findings reported by Eleazu (2012), of
0.82% and 0.95% respectively in two of the varieties he researched on. Soy bean crude fat was
30.91 %, a level which is quite high compared to that reported by other researchers. Levels of
22.25 to 22.70% and 16.82 to 19.30 % respectively were reported by El-shemy et al. (2012)
and Eshun (2012) in studies they conducted using various varieties. Fat content of a food
material is dependent on factors such as varieties, environmental conditions and extraction
method while analyzing among other factors.
Protein content of the two cassava varieties did not significantly differ at (p<0.05) but
significantly differed with that of soy bean. Protein content of the two cassava varieties was
1.86 % and 1.76 % a level which is quite low compared to those reported by Abel et al. (2017)
who found levels ranging between 2.41% and 4.84% in 3 varieties studied. Soy crude protein
was 41.12 % which was comparable to the levels reported by Eshun (2012) which ranged 36.94
to 40.01%. As a result, this makes soy bean an excellent source of quality and affordable protein
that can be used to supplement other plant materials poorly endowed with protein.
Ash and fiber content of the two cassava varieties significantly differed (p<0.05) with those in
soybean indicating that soy bean is also a very good source of fiber and minerals. Soy bean ash
and fiber content were 4.77 % and 5.58 % respectively, levels which were quite high compared
to those reported by Eshun (2012) but agreeable with those reported by Elshemy et al. (2012)
an indicator that these nutritional components vary from variety to variety.

27
Soy bean carbohydrates were 17.62 %, level which was relatively low and significantly varied
(p<0.05) compared to those in the two cassava varieties of 91.72 % and 90.11 % for Meru and
Western Kenya respectively. Carbohydrate levels in soy bean were comparable to those
reported by Etiosa et al., (2018) which was 16.31 % in fresh weight basis. However, despite
all the disparities in the various nutritional components, calorific values of the soy bean used
in this study of 513.15 kCal/100 g dry weight which is slightly than those reported by Eshun
(2012) of 458.58 to 473.68 kCal/100 g dry weight. In addition, a significant difference was
observed in calorific value of the two cassava varieties with slight difference.
3.4.2 Effect of pre-processing techniques on cyanide
There was a decreasing trend in cyanide content as fermentation time increased for both
varieties. Western Kenya variety had cyanide content about 2.4 times that of Meru variety. The
pH of soaking water also decreased as cyanide content decreased. However, after 72 hrs of
soaking, cyanide levels had no significant difference with the levels after 96 hrs of soaking in
both varieties (p≤0.05). Always indicate implication of your results. The finding of the present
study agrees with that of Montagnac et al. (2009b), who reported that in terms of cyanogen
reduction, fermentation of soaked roots is much more efficient than that of grated roots and
leads to 90% cyanogen reduction.
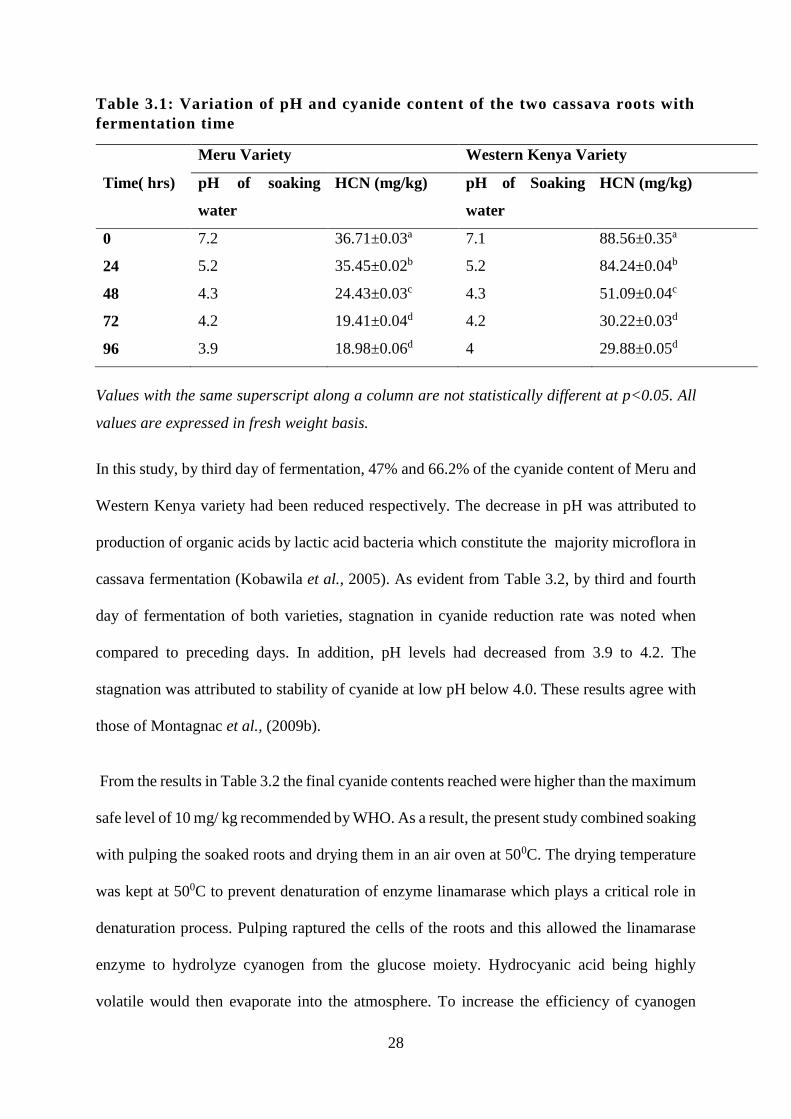
28
Table 3.1: Variation of pH and cyanide content of the two cassava roots with
fermentation time
Meru Variety Western Kenya Variety
Time( hrs) pH of soaking
water
HCN (mg/kg) pH of Soaking
water
HCN (mg/kg)
0 7.2 36.71±0.03a 7.1 88.56±0.35a
24 5.2 35.45±0.02b 5.2 84.24±0.04b
48 4.3 24.43±0.03c 4.3 51.09±0.04c
72 4.2 19.41±0.04d 4.2 30.22±0.03d
96 3.9 18.98±0.06d 4 29.88±0.05d
Values with the same superscript along a column are not statistically different at p<0.05. All
values are expressed in fresh weight basis.
In this study, by third day of fermentation, 47% and 66.2% of the cyanide content of Meru and
Western Kenya variety had been reduced respectively. The decrease in pH was attributed to
production of organic acids by lactic acid bacteria which constitute the majority microflora in
cassava fermentation (Kobawila et al., 2005). As evident from Table 3.2, by third and fourth
day of fermentation of both varieties, stagnation in cyanide reduction rate was noted when
compared to preceding days. In addition, pH levels had decreased from 3.9 to 4.2. The
stagnation was attributed to stability of cyanide at low pH below 4.0. These results agree with
those of Montagnac et al., (2009b).
From the results in Table 3.2 the final cyanide contents reached were higher than the maximum
safe level of 10 mg/ kg recommended by WHO. As a result, the present study combined soaking
with pulping the soaked roots and drying them in an air oven at 500C. The drying temperature
was kept at 500C to prevent denaturation of enzyme linamarase which plays a critical role in
denaturation process. Pulping raptured the cells of the roots and this allowed the linamarase
enzyme to hydrolyze cyanogen from the glucose moiety. Hydrocyanic acid being highly
volatile would then evaporate into the atmosphere. To increase the efficiency of cyanogen
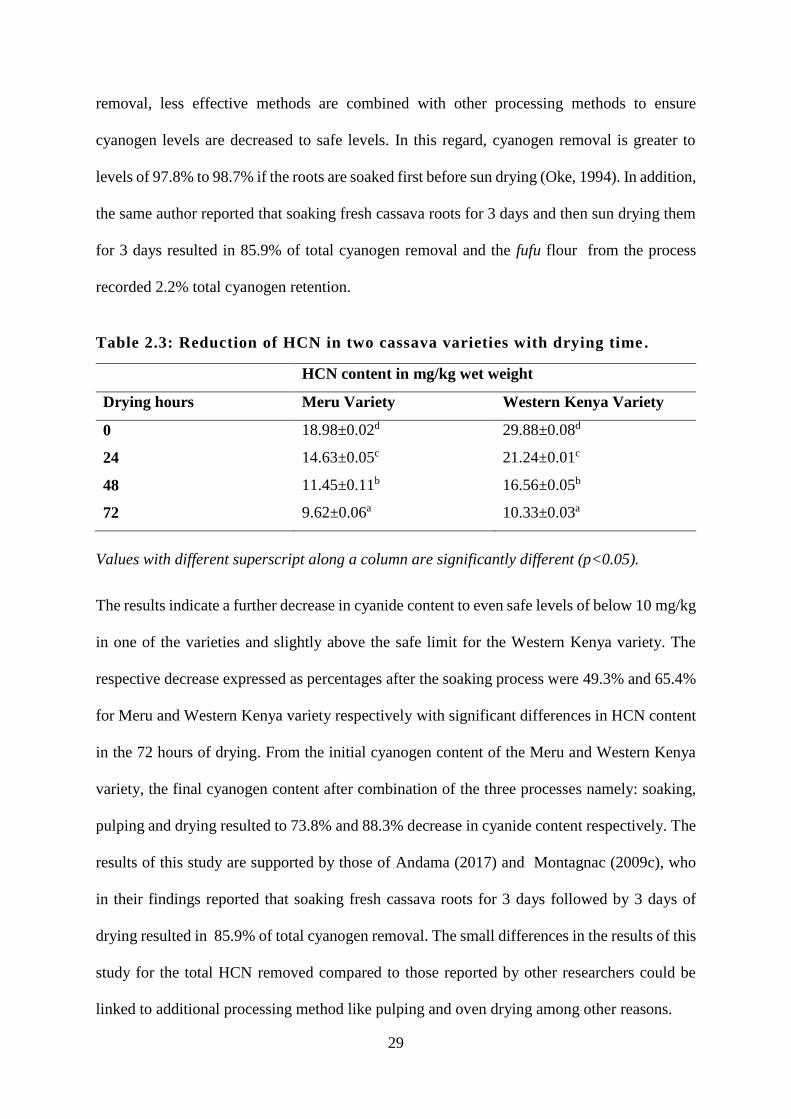
29
removal, less effective methods are combined with other processing methods to ensure
cyanogen levels are decreased to safe levels. In this regard, cyanogen removal is greater to
levels of 97.8% to 98.7% if the roots are soaked first before sun drying (Oke, 1994). In addition,
the same author reported that soaking fresh cassava roots for 3 days and then sun drying them
for 3 days resulted in 85.9% of total cyanogen removal and the fufu flour from the process
recorded 2.2% total cyanogen retention.
Table 2.3: Reduction of HCN in two cassava varieties with drying time .
HCN content in mg/kg wet weight
Drying hours Meru Variety Western Kenya Variety
0 18.98±0.02d 29.88±0.08d
24 14.63±0.05c 21.24±0.01c
48 11.45±0.11b 16.56±0.05b
72 9.62±0.06a 10.33±0.03a
Values with different superscript along a column are significantly different (p<0.05).
The results indicate a further decrease in cyanide content to even safe levels of below 10 mg/kg
in one of the varieties and slightly above the safe limit for the Western Kenya variety. The
respective decrease expressed as percentages after the soaking process were 49.3% and 65.4%
for Meru and Western Kenya variety respectively with significant differences in HCN content
in the 72 hours of drying. From the initial cyanogen content of the Meru and Western Kenya
variety, the final cyanogen content after combination of the three processes namely: soaking,
pulping and drying resulted to 73.8% and 88.3% decrease in cyanide content respectively. The
results of this study are supported by those of Andama (2017) and Montagnac (2009c), who
in their findings reported that soaking fresh cassava roots for 3 days followed by 3 days of
drying resulted in 85.9% of total cyanogen removal. The small differences in the results of this
study for the total HCN removed compared to those reported by other researchers could be
linked to additional processing method like pulping and oven drying among other reasons.

30
However, through the data obtained in the present study and validation of the results by
researchers who have done similar work, the study lays into place effective methods that can
be used to process cassava roots to lower cyanide content to safe levels.
3.4.3 Levels of anti- nutrients in processed soy bean
Tannin content after the four treatments was in the range 0.98-31.5mg 100g-1 with treatment
two being raw soy bean and treatment 4 being raw soy bean subjected to roasting at 2000 C for
5-8 minutes until golden brown being significantly different (p<0.05) with levels of 31.5 and
30.33 mg 100 g-1 respectively compared with those in treatment 1 and 2 respectively whose
levels were 1.07 and 0.98mg 100g-1 (Table 3.4). The study demonstrated that tannins can be
reduced by soaking the soy bean in water for 24 hrs. In this regard, a study done by El-Shemy
et al., (2012) also demonstrated that by soaking and decorticating soy beans and fababeans the
treatment was able to lower the initial levels of tannins in whole seeds from 29.3 and 31.2mg
100g -1 respectively to traces in decorticated seeds.
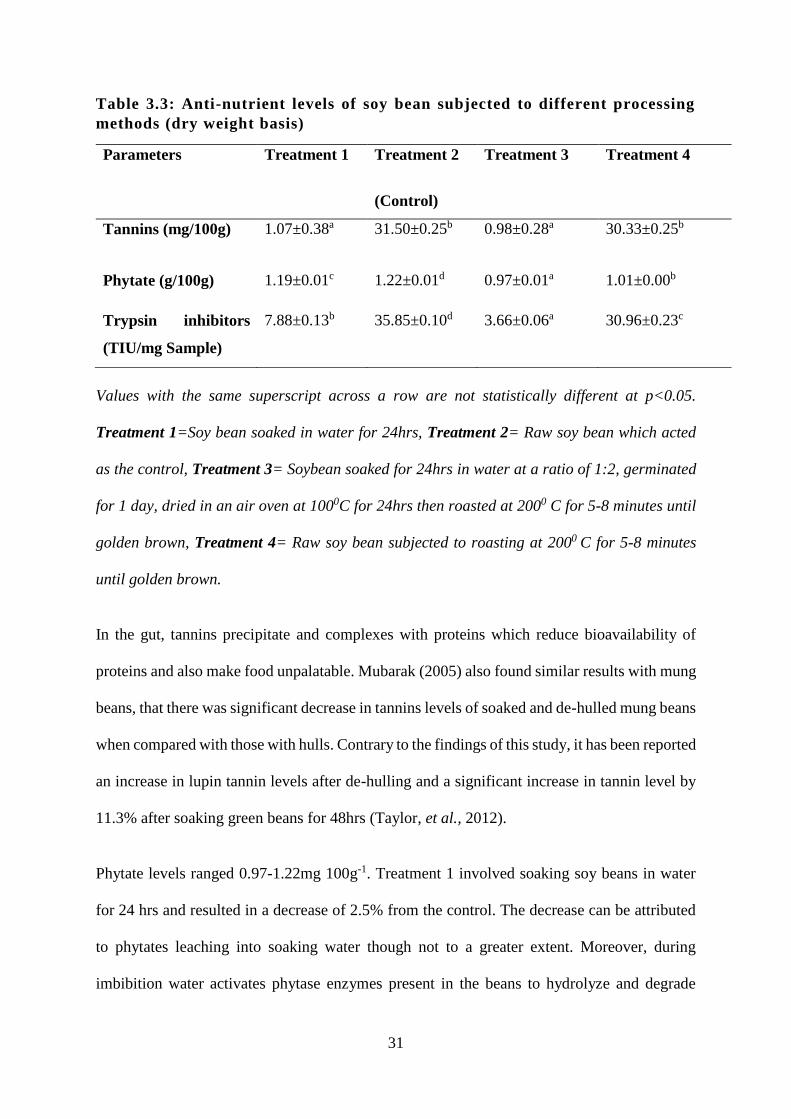
31
Table 3.3: Anti-nutrient levels of soy bean subjected to different processing
methods (dry weight basis)
Parameters Treatment 1 Treatment 2
(Control)
Treatment 3 Treatment 4
Tannins (mg/100g) 1.07±0.38a 31.50±0.25b 0.98±0.28a 30.33±0.25b
Phytate (g/100g) 1.19±0.01c 1.22±0.01d 0.97±0.01a 1.01±0.00b
Trypsin inhibitors
(TIU/mg Sample)
7.88±0.13b 35.85±0.10d 3.66±0.06a 30.96±0.23c
Values with the same superscript across a row are not statistically different at p<0.05.
Treatment 1=Soy bean soaked in water for 24hrs, Treatment 2= Raw soy bean which acted
as the control, Treatment 3= Soybean soaked for 24hrs in water at a ratio of 1:2, germinated
for 1 day, dried in an air oven at 1000C for 24hrs then roasted at 2000 C for 5-8 minutes until
golden brown, Treatment 4= Raw soy bean subjected to roasting at 2000 C for 5-8 minutes
until golden brown.
In the gut, tannins precipitate and complexes with proteins which reduce bioavailability of
proteins and also make food unpalatable. Mubarak (2005) also found similar results with mung
beans, that there was significant decrease in tannins levels of soaked and de-hulled mung beans
when compared with those with hulls. Contrary to the findings of this study, it has been reported
an increase in lupin tannin levels after de-hulling and a significant increase in tannin level by
11.3% after soaking green beans for 48hrs (Taylor, et al., 2012).
Phytate levels ranged 0.97-1.22mg 100g-1. Treatment 1 involved soaking soy beans in water
for 24 hrs and resulted in a decrease of 2.5% from the control. The decrease can be attributed
to phytates leaching into soaking water though not to a greater extent. Moreover, during
imbibition water activates phytase enzymes present in the beans to hydrolyze and degrade

32
phytates. These findings agree with those reported by Vijayakumari, et al., (2007). Treatment
3 resulted in greatest reduction of phytates of 20.5% from the control treatment. Apart from
soaking for 24 hrs, the soy beans were allowed to germinate and then dried to prevent further
germination and later roasted in an oven at 2000C for 5-8 minutes until golden brown. During
germination, important metabolic compounds are mobilized some of which serve as anti-
nutrients and by so doing the sprouting process has been employed to lower anti-nutrient
factors in legumes. Phytic acid onto which phosphorous is bound plays a crucial role in storage
of phosphate needed during germination. Luo and Xie (2013) noted that during germination,
phytase enzyme hydrolyzed phytic acid that resulted in an overall increase of available organic
phosphorous required by developing seedling.
Treatment 4 involved roasting raw soy beans in an oven until golden brown. This resulted into
17.2% decrease in phytate levels from the control. This can be attributed to the heat labile
nature of phytic acid hence thermal processing has been employed to lower phytate levels in
legumes. Similar findings were reported by Udensi et al., (2007), which showed a decrease of
62.35% in vegetable cow peas phytates during roasting. However, the type of heat employed
to reduce phytate is an important determinant to reduction level, with moist heat being reported
to be more effective than dry heat (Akande & Fabiyi, 2010).
Of all anti-nutrients, trypsin inhibitor are the most serious as they impair protein digestibility
and their absorption too. In this study Trypsin Inhibitors (TI) were in the range 3.66-35.85
TUI/mg. Treatment 1 involved soaking soy bean and resulted in 78% decrease from the control.
This could be explained by leaching of TI in soaking water. The finding in the present study
agrees with those of Avil et al., (2018) that showed a 67.3% and 35% decrease in TI of bitter
lupine and soy bean respectively upon soaking for 96 hrs. Nevertheless, for the process to be
effective, factors such as pH, temperature and soaking duration are important. In addition,

33
water soluble proteins leach into steeping water especially with longer soaking duration which
can reduce the protein content by up to 26.3% (Rahma and Sobihah, 2000). Interestingly,
prolonged soaking of soy bean for 120 hrs has been shown not to decrease the amount of TI
beyond the value obtained after 96 hrs (Agarwal, 2014; Ibrahimet et al., 2002). It’s therefore
necessary to conduct studies on other legumes of interest in order to keep soaking time as short
as possible.
Treatment 3 resulted in the greatest reduction of TI from the control of 89.8%. The treatment
involved soaking the soy bean for 24 hrs, germinating the seeds and roasting until golden
brown. In additional to the reduction as a result of soaking discussed earlier, the enormous
decrease in this treatment was attributed to germination and roasting. During germination,
catabolic processes takes place in superior plants whereby seeds come out of latency and utilize
stored compounds reserved in the cotyledons for embryo growth and development (Sangronis
and Machado, 2007). During this stage, proteases are mobilized to hydrolyze cellular proteins
and enzymes into free amino acids for subsequent autotrophic growth of the seedling. Thermal
treatment like roasting has the effect of destroying the intermolecular bonds holding the tertiary
structure of TI. However, roasting alone is not a very effective process as evident in Treatment
4 results that indicated 13.6% decrease from control. Care needs to be taken to hinder
deleterious effects on various important component of legumes such as heat labile vitamins,
sulphur amino acids and lysine by combining roasting with other methods of lowering anti-
nutrients and this lowers roasting time (Sangronis & Machado, 2007; Yang et al., 2014).
3.5 Conclusion
Cassava and Soy bean can be processed successfully with an aim of lowering cyanide and anti-
nutrients such as tannins, phytates and trypsin inhibitors respectively to safe levels that do not
pose any adverse health effects to consumers while improving protein and mineral content too.

34
With a target in mind of improving the protein and mineral content of cassava, cassava and soy
bean exhibit significant differences in nutritional composition with regard to protein and
minerals. Therefore, soy bean can be used to supplement nutritional composition of cassava by
developing a chemically safe and nutritious product that can be used in nutritional intervention
programs to address PEM and also diversify the common breakfast cereals foods.

35
CHAPTER FOUR: DEVELOPMENT OF CASSAVA-SOY BEAN FLAKES
4.1 Abstract
Cassava is nutritionally deficient of quality protein and minerals. This study sought to evaluate
how formulation of safe CSB flakes could be achieved while striking a balance between
maximizing nutrition and sensory aspects. A single Pearson square was used to give a target of
25% of soy bean incorporation that targeted half of RDI of protein intake for children aged 2-
5 yrs. Variation above and below 25% of soy bean incorporation level was done. After
formulation, the samples were subjected to descriptive sensory evaluation after 24hrs.
At (p<0.05), moisture, fat, fiber, protein, ash, and carbohydrates for all the formulations had
significant differences. HCN content for all the samples were within safe range of below 10
mg/kg in all the formulated samples and significantly differed at (p<0.05). Anti-nutrient levels
differed significantly with the control having lowest levels. As incorporation of soy bean
increased, progressive increase in anti-nutrient was noted but in range with levels noted when
processing raw materials using same methods.
Sensory results showed that sample 103 had the highest score of 6.4 in a seven point hedonic
scale for overall acceptability at (p<0.05) and exhibited significant difference from all the rest
of samples. Color, crispiness, smoothness, roasted flavor and sweetness followed a similar
trend. Scores increased as incorporation of soy bean increased from 0 to 35% at (p<0.05). There
was no significant difference at (p<0.05) for beany flavor in all the sample treatments an
indicator that the objectionable flavor that hamper utilization of soy bean had been eliminated.

36
4.2 Introduction
In sub-Saharan Africa (SSA), Protein Energy Malnutrition (PEM) is a significant health
problem especially where staple starchy diets are utilized as complementary foods (Müller and
Krawinkel, 2005). Complementary foods are any liquid or nutritious foods fed to children
alongside breast milk. Upon commencement of complementary feeding, PEM can be initiated
depending on the nature of staple foods fed to children. Therefore nutritional improvement of
staple foods can be used as a suitable avenue of reducing PEM (WHO/UNICEF, 1998). Living
standards of most mothers in developing countries are low hence provision of complementary
foods containing right proportions of nutrients is a challenge to them.
Consumption of root and tubers crops in these regions has increased tremendously in recent
years as complementary foods and studies have shown that these foods are low in protein,
minerals and vitamins. Consequently, this puts the children at risk of suffering PEM
(Stephenson et al., 2010). Cassava is a staple food crop in SSA where it’s able to grow in
marginalized soils and in erratic rainfall conditions (Maredia et al., 2000). With exception of
histidine and leucine, research has proven that cassava based diets are deficient in essential
amino acids recommended for children aged 2-5 years undergoing complementary feeding
(Montagnac et al., 2009c).
Soy bean cultivation and utilization is gaining popularity in SSA and hence its addition to
cassava based diets like porridges and flour would improve the protein quality and quantity.
Soy-bean is rich in protein and has a good balance of amino acids that would complement the
limiting essential amino acids in cassava (Zarkadas et al., 2007). Attempts have been made by
scientists to fortify various staple foods used in complementary feeding. An example is use of
soy bean to fortify cassava based complementary porridge food by Muoki et al., (2012) who
noted that mothers preferred instant or precooked foods which requires minimal preparation
like just addition of warm water. It is worth noting that acceptability of a product by its

37
consumers is highly dependent on its sensory characteristics irrespective of the reason behind
its formulation for example: improvement of nutrient characteristics of a food product.
Adjustment and changes in ingredient levels brings about differences in various sensory
parameters which is established by descriptive analysis (Duizer & Walker, 2015).
Incorporation of soy bean into cassava flour to make cassava soybean breakfast flakes aimed
at improving the protein, zinc and iron content of the final product which is known to be a
cheap source of quality protein and mineral content (Ugwu & Ukpabi, 2002). In addition the
flakes are ready to eat, hypoallergenic compared to other common wheat based breakfast
cereals and probably shelf stable and palatable. Further, if the project is adopted by community
in which these raw materials are grown, it would result into improving nutrition with respect
to PEM, creation of employment opportunities among other economic benefits. The present
study therefore sought to develop a flaked product from cassava and soy bean which is
nutritious, ready to eat, acceptable and with extended shelf- life. The study also sought to strike
a balance between sensory characteristics and nutrition aspects of the developed flakes through
product formulation.
4.3 Materials and Methods
4.3.1 Sampling and processing of cassava and soy bean
Cassava roots from Meru region were purposively sampled at City park market in Westlands
Nairobi, putting consideration of availability since it was off season for cassava roots. They
were then hygienically packed in airtight bags and transported to University of Nairobi Kabete
Campus Pilot Plant for processing and analysis. Soy bean was sourced from Nyamakima
market, Nairobi and packed in kraft papers then transported to same venue for analysis and
processing. Both raw materials were processed as illustrated in schematic flow diagram (Figure
4.1). The methods of processing validated in chapter one were used with an aim of lowering

38
hydrogen cyanide levels in cassava to safe levels of 10 mg/kg and anti-nutrients in soy-bean to
levels that improves its nutrient bioavailability and palatability.
4.3.2 Experimental design
A controlled experimental study design was used to formulate the Cassava Soy Bean flakes
with RDI of proteins of age between 2-5 years as the target. A single Pearson square was used
to calculate the RDI of protein targeted to be 23 g/day on average as recommended by
WHO/FAO/UNU Expert Consultation (2007). Pearson square calculations showed that if 25%
of Soy bean and 75% of cassava was used as formulation ratio, it would result in Cassava soy
bean breakfast flakes with approximately 12g/ day of protein which provided 50% of the WHO
RDI. Treatments involved variation of soybean and cassava above and below the target (25%
soy bean and 75% cassava) to evaluate the best accepted sample and at the same time improving
the protein content. Cassava flakes were used as the control sample. Figure 4.1 below shows
how the CSB flakes were processed using methods validated in chapter three.
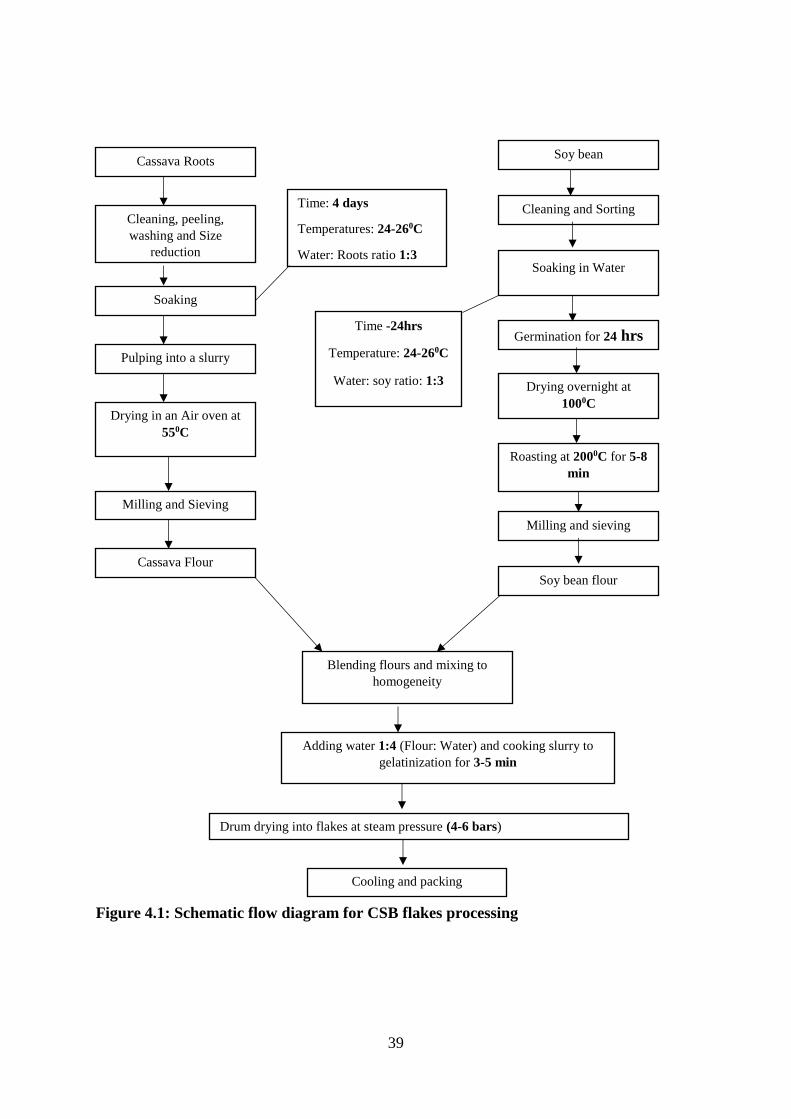
39
Cassava Roots
Cleaning, peeling,
washing and Size reduction
Soaking
Pulping into a slurry
Drying in an Air oven at
550C
Milling and Sieving
Cassava Flour
Soy bean
Cleaning and Sorting
Soaking in Water
Germination for 24 hrs
Drying overnight at
1000C
Roasting at 2000C for 5-8
min
Milling and sieving
Soy bean flour
Blending flours and mixing to
homogeneity
Adding water 1:4 (Flour: Water) and cooking slurry to
gelatinization for 3-5 min
Drum drying into flakes at steam pressure (4-6 bars)
Cooling and packing
Time: 4 days
Temperatures: 24-260C
Water: Roots ratio 1:3
Time -24hrs
Temperature: 24-260C
Water: soy ratio: 1:3
Figure 4.1: Schematic flow diagram for CSB flakes processing
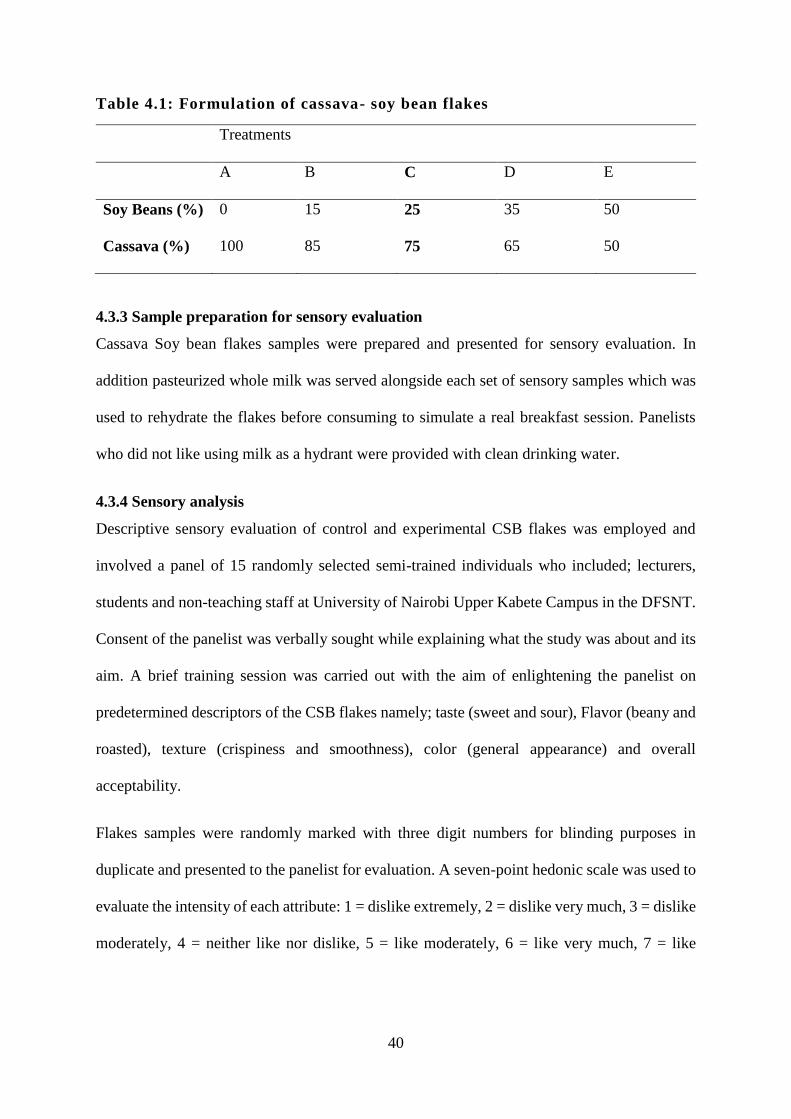
40
Table 4.1: Formulation of cassava- soy bean flakes
Treatments
A B C D E
Soy Beans (%) 0 15 25 35 50
Cassava (%) 100 85 75 65 50
4.3.3 Sample preparation for sensory evaluation
Cassava Soy bean flakes samples were prepared and presented for sensory evaluation. In
addition pasteurized whole milk was served alongside each set of sensory samples which was
used to rehydrate the flakes before consuming to simulate a real breakfast session. Panelists
who did not like using milk as a hydrant were provided with clean drinking water.
4.3.4 Sensory analysis
Descriptive sensory evaluation of control and experimental CSB flakes was employed and
involved a panel of 15 randomly selected semi-trained individuals who included; lecturers,
students and non-teaching staff at University of Nairobi Upper Kabete Campus in the DFSNT.
Consent of the panelist was verbally sought while explaining what the study was about and its
aim. A brief training session was carried out with the aim of enlightening the panelist on
predetermined descriptors of the CSB flakes namely; taste (sweet and sour), Flavor (beany and
roasted), texture (crispiness and smoothness), color (general appearance) and overall
acceptability.
Flakes samples were randomly marked with three digit numbers for blinding purposes in
duplicate and presented to the panelist for evaluation. A seven-point hedonic scale was used to
evaluate the intensity of each attribute: 1 = dislike extremely, 2 = dislike very much, 3 = dislike
moderately, 4 = neither like nor dislike, 5 = like moderately, 6 = like very much, 7 = like
41
extremely. Clean water was provided to refresh the palate after successive evaluation of
samples.
4.3.5 Analytical methods
4.3.5.1 Determination of Proximate Composition for Cassava Soy bean breakfast flakes
Proximate composition of cassava soy bean breakfast flakes were determined as per AOAC
(2008) methods in terms of moisture content (AOAC 2008 method 967.08), crude protein
(AOAC, 2008 method 988.05), crude fiber (AOAC, 2008 method 958.06), crude fat (AOAC,
2008 method 2003.06), crude ash (2008 method 942.05) and carbohydrate content (by
difference method).
4.3.5.2 Determination of Hydrogen Cyanide content
Determination of HCN content of flakes was determined as per AOAC (1990)
4.3.5.3 Determination of zinc and iron content
Samples were analyzed for zinc and iron according to Puwastien et al., (2011). To 0.5g sample,
a mixture of conc. Nitric acid and hydrogen peroxide (5:3) was added and left to stand
overnight in a fume chamber before digesting at 110⁰C for 3 hrs or until a clear or milky digest
was found. The digest was topped up to 50ml with deionized water for respective mineral
analysis. Atomic Absorption Spectrophotometer (AAS) machine was used in the mineral
analysis.
4.3.6 Statistical analysis
The experiments in this study are reported as mean ± standard deviation of duplicate
determinations. The means of Zn and Fe content were subjected to an independent t-test and
one way analysis of variance (ANOVA) at 5% level of significance for proximate analysis and
sensory results using Gentstat Software 15th edition. Means were separated using the Tukey’s
honestly significant difference post hoc test.

42
4.4 Results and Discussion
4.4.1 Proximate composition, cyanide and anti-nutrients content of cassava-soy bean
flakes
There was significant difference in moisture content among formulations (p<0.05) ranging
from 7.60% to 10.47% wet weight basis (Table 4.2). Low moisture content may indicate
extended shelf life of the product as moisture is critical in growth of microorganisms. These
results are in line with those of (Dada et al., 2018) who also suggested extended shelf life for
cassava strip with such range of moisture content. A significant difference existed in protein
content of the treatment (p<0.05) ranging from 1.54 % to 24.52 %. This is evidence that as
substitution level of cassava with soy bean increased, the protein content of the flakes also
increased suggesting an improvement of nutrition value of flakes with regard to protein content.
These results agree with those of Siulapwa (2015) and Abioye (2011) who reported an increase
in protein content of soy plantain flour and cookies as level of substitution with soy bean
increased.
Fat content of the flakes ranged from 0.64 % to 14.41 % with significant difference existing in
all treatments (p<0.05). The increase in fat content was attributed to increased content of soy
bean. Soy bean is an oil seed and this also suggests increase in energy value as fat content of
flakes increased. Similar results whereby an increase in fat content of biscuits fortified with
soy flour increased to 30.5% from 1.6% in 20:80 cassava and soy flour incorporation
respectively (Akubor & Ukwuru, 2003). Ash content of the flakes ranged from 2.60 % to 4.48
% with significant differences existing among all the five treatments (p<0.05). This suggested
that soy bean is a cereal rich in mineral contents, the study sought to improve the mineral
content of the cassava flakes. These results agree with those of Chinma (2013) who reported
an increase of 0.45% to 2.9% in ash content of cassava and soy protein concentrate blend.

43
Table 4.2: Proximate composition, anti-nutrient and cyanide content of the
formulated CSB flakes
Formulations
A B C D E
Moisture WW % 10.47±0.07e 7.98±0.06b 7.60±0.02a 10.26±0.08d 9.78±0.06c
Protein % 1.54±0.05a 12.10±0.07b 14.99±0.18c 19.31±0.05d 24.52±0.06e
Fats % 0.64±0.06a 7.60±0.12b 9.04±0.07c 11.43±0.09d 14.41±0.07e
Ash % 2.60±0.07a 3.27±0.06b 3.56±0.07c 4.13±0.05d 4.48±0.14e
Fiber % 2.47±0.06a 4.79±0.01b 5.70±0.12c 6.88±0.06d 9.65±0.03e
CHO % 92.75±0.38e 71.18±0.06d 68.17±0.15c 58.26±0.19b 46.95±0.14a
Energy (Kcal/100g) 382.92±0.42a 401.52±0.13c 414.00±0.60b 413.15±0.21b 415.57±0.82c
Phytates (mg/100g) 0.14±0.05a 0.76±0.08b 0.81±0.01c 0.84±0.03c 0.92±0.11d
Tannins (g/100g) 0.26±0.04a 0.65±0.01b 0.83±0.04c 0.92±0.05d 0.95±0.06d
Trypsin Inhibitors
(TIU/mg sample)
0.68±0.07a 3.28±0.15b 3.31±0.12b 3.47±0.11c 3.52±0.10c
Cyanide mg/kg 9.72±0.03c 8.35±0.02a 9.68±0.02c 8.69±0.01b 9.06±0.01d
Values with similar superscript across a row are not statistically different at (p<0.05). All
values are expressed in dry weight basis except moisture content on WW- Wet weight basis.
Formulation A had 0:100, B 15:85, C 25:35, D 35:65 and E had 50:50 cassava to soy bean
ratio.
There were significant differences (p<0.05) in the fiber contents of the flakes with values of
2.47 % to 9.65 %. From the proximate results of the soy bean, it was noted that it had about
2.6 times the fiber content of cassava. This therefore suggested that as substitution of cassava
with soy bean increased, fiber content also increased. Dietary fiber is important in nutrition as
it increases water holding capacity of stool. As a result, stool bulk and softness is increased and
transit time is reduced which reduce hemorrhoids, diverticular diseases and probably other
diseases of lower gastro intestinal tract (Lokuruka, 2010). The results of most preferred sample
with 6.64 % dietary fiber are higher than those reported by Wireko-Manu (2016) who reported
44
3.34% in most preferred sample of a complementary feeding food by weaning mothers that
used similar raw materials.
Variation in carbohydrate content among the treatments was significant (p<0.05). As
substitution of cassava with soy bean increased, the carbohydrate content of the flakes
decreased. This resulted in almost 50% reduction in the most substituted treatment (E) with
50:50 soy to cassava compared with the control (A) with 100% cassava. Among all the roots,
cassava is known to have the highest content of carbohydrate in form of starch (Burns et al.,
2010). Comparing the findings of the present study with the results of Wireko-Manu (2016),
the carbohydrate content of the most preferred sample was 64.15%, a level higher than the
most preferred sample of the CSB flakes of 58.26 % (p≤0.05). Energy content ranged from
382.92 to 415.57 kcal 100g-1 with treatment C that had 25:75 and D with 35:65 soy to cassava
respectively having no significant difference, just like treatment B with 15:85 and E with 50:50
soy to cassava (p<0.05). Nevertheless, despite lack of significant difference in afore mentioned
treatments in terms of energy content, it was noted that protein and fat content significantly
differed with increased substitution of cassava with soy bean which also plays a big role in
energy content of a food ration. A good energy balance from various nutritional components
of a food is important (Mashayekh et al., 2008).
Cyanide content of the formulated flakes ranged from 8.35 to 9.72 mg/kg dry weight.
Treatments B, D and E with 15:85, 35:65 and 50:50 soy to cassava ratios respectively had
significant difference (p≤0.05) while C and A with 25:75, 0:100 soy to cassava respectively
exhibited no significant difference (p>0.05). These levels of HCN are within the WHO/FAO
guidelines on the level of HCN in cassava flour set at 10 mg/kg dry weight. These results also
agree with those reported by Lambri et al., (2013) who suggested that effectiveness of cyanide
removal is achieved when several processing methods are combined. With regard to the results
of this study, he reported levels as low as 8 mg/kg dry weight by combining fermentation of
45
grated cassava with oven drying at 550 C. He further noted that the final residual HCN content
is dependent on initial levels.
Anti-nutrient levels were significantly low (p<0.05) in cassava flakes (control) in comparison
with all the treatments. Highest level of phytates, tannins and trypsin inhibitors were noted in
treatment E that had 50:50 soy to cassava ratio with levels of 0.92 g/100g, 0.95 mg/100g and
3.52 TIU/mg sample respectively. There was no significant difference (p<0.05) in treatment C
and D that had 25:75 and 35:65 soy to cassava ratio respectively for phytates. Similarly
treatment D and E with 35:65 and 50:50 soy to cassava respectively did not significantly differ
(p<0.05) for tannins and trypsin inhibitors. Notably, anti-nutrients levels showed an increasing
trend as level of soy bean incorporation increased. Studies done by Wobeto et al., (2006),
showed that anti-nutrient levels of cassava are dependent on age. As the plant ages, tannin,
phytates and trypsin inhibitors levels in cassava roots and leaves also increases. CSB flakes
anti nutrient levels in the formulations did not differ with great margins from the levels
observed when the most appropriate method was employed when processing raw materials in
previous chapter for tannins phytates and trypsin inhibitors of 0.98 mg/100g, phytates
0.97g/100g and 3.66 TIU/mg sample respectively.
4.4.2 Sensory evaluation of cassava soy bean flakes
Acceptance and rejection of food is highly dependent on colour which gives consumer the first
impression. In this study highest colour score was in sample 104 that had 35:65 soy to cassava
with the highest mean score of 5.53. As incorporation of soy bean into cassava increased the
colour intensity also improved as evident in the scores. However up to a certain level. These
results fairly agrees with those of Alabi et al. (2007), who reported colour improvement of
wheat bread fortified with soy bean.
To an extent, food texture embraces appearance. In this study, both texture parameters
crispiness and smoothness exhibited almost a similar trend with mean scores ranging from 4.13

46
to 6.00 for crispiness and 3.24 to 5.38 for smoothness. There was no significant difference
(p<0.05) in formulation A with 100 % cassava and E with 50:50 soy to cassava for crispiness,
however the two samples significantly differed from the rest which had no significant
difference for crispiness. Formulation E with 50:50 soy to cassava had the highest score of
crispiness of 6. Smoothness was evaluated after hydrating the flakes, formulation E
significantly differed (p<0.05) with the rest of formulations.
The increasing trend in scores for both crispiness and smoothness was attributed to the increase
in incorporation of soy bean but with limitation to a certain point where the scores decreased
for both texture parameters. The results are comparable to those reported by Akubor and
Ukwuru (2003); Oluwamukomi et al., (2011), who found out that there was no significant
difference in texture, colour and taste of cassava-soy enriched and un-enriched flour blend
biscuits.
Taste is also an important sensory characteristic of a food. The study evaluated sweetness and
sourness of the CSB flakes as main parameters of taste. Sweetness is a sensory characteristic
primarily associated with sucrose or non-nutritive sweetener though other compounds such as
sugar alcohols, ketones, aldehydes and amino acids such as glycine, alanine and serine have
also been reported to bring about sweetness (W. Navicha et al., 2018). An increasing trend in
scoring the sweetness of flakes was observed as soy bean incorporation level increased.
Samples with 15:85 and 50:50 soy to cassava ratio had no significant difference but
significantly differed with the rest at (p<0.05). The trend could be explained by increasing
amount of simple sugars and some specific amino acids in soy bean as its level of incorporation
increased. However this is on condition that objectionable flavour such as beany flavour in soy
bean are eliminated while processing.

47
Table 4.3: Sensory evaluation scores on a 7-point hedonic scale for the CSB flakes
Values with similar superscript along a column are not statistically different at (p<0.05). Sample 100- formulation A, 101- formulation B, 102-
formulation C, 103- formulation D and 104- formulation E
Sample Appearance Texture Taste Flavor Overall Acceptability
Color Crispness Smoothness Sweetness Sourness Beany Roasted
100 4.80±1.93b 4.13±1.68a 4.16±0.68b 4.45±0.79a 6.33±0.98b 5.74±1.28a 2.16±1.22a 4.40±1.55ab
101 4.93±1.36b 5.33±0.62b 4.41±1.15b 5.28±0.96b 4.67±1.18a 6.38±1.48a 3.64±1.43b 4.87±1.06ab
102 5.13±1.28b 5.40±0.91b 4.36±1.67b 5.52±1.67b 5.00±1.20a 6.56±0.78a 5.22±0.92b 5.20±0.86b
103 5.53±1.41b 6.00±0.85b 5.38±0.94b 6.13±0.85b 4.20±1.57a 6.48±0.94a 6.78±1.07c 6.40±0.63c
104 3.60±1.80a 4.27±1.62a 3.24±1.96a 3.98±1.03a 4.00±1.73a 6.26±1.12a 6.85±0.96c 4.13±1.68a

48
Sourness is brought about by pH of below 7 in foods. The highest level of sourness was scored
6.33 on sample 100 which was the control comprising of 100% cassava flour. A significant
difference on sample 100 and the rest of the samples existed (p<0.05). Degree of sourness
decreased as substitution of cassava with soy bean increased. This was attributed to
fermentation of cassava roots during soaking as explained earlier in this study as a method of
lowering cyanide content to required level. These results were similar to those reported by
Maziya-Dixon (2017) who reported a similar trend on a snack made from high quality cassava
flour and legume blend.
Regardless of superiority of other sensory attributes, soy based foods can be faced with a
dominant beany flavour that discourages its consumption. There was no significant difference
(p<0.05) in beany flavour scores ranging from 5.74 to 6.56. This was an indicator that the
processing methods employed eliminated the objectionable beany flavour. Many studies have
reported beany flavour with attributes such as painty, grassy, green and rancid among others.
Soy bean used in formulation of the flakes were subjected to roasting at 2000 C for 5-8 minutes
which inactivated lipoxygenase enzyme activity which brings about the beany flavour. These
results are similar to those reported by Navicha (2017), who reported a decrease in
lipoxygenase activities in soy milk commensurate with increasing roasting temperatures and
time.
Good aroma and flavour profile excites the taste buds and makes the food acceptable at sight.
The study evaluated roasted flavour in CSB flakes solely attributed to roasted soy beans.
Significant difference (p<0.05) was observed in samples with formulation A with 100%
cassava being significantly different with the rest, formulation B with 15:85 and C with 25:75
soy to cassava having no significant difference. An increasing trend was observed as level of
soy bean incorporation increased. This was probably due to production of volatile compounds

49
such as thiazoles, thiopohenes, pyridines, pyrazines, furans, pyrroles and oxazoles generated
as a result of maillard reactions of sugars and amino acids (Lee & Shibamoto, 2011). The
findings are similar to those reported by Navicha (2018), who evaluated the effects of soy bean
roasting on sensory attributes of soy milk.
Significant difference existed in overall acceptability of the CSB flakes at (p<0.05) with
formulation A with 100% cassava having the lowest mean score of 4.13 and 103 with the
highest of 6.4. However formulation A with 0:100 and C with 25:75 soy to cassava ratio had
no significant difference but differed significantly with sample formulation D with 35:65 soy
to cassava. This could be attributed to a balance of other sensory attributes compared to other
samples. These results slightly differed with those of Akubor (2003), whose study reported a
50:50 cassava and soy bean flour ratio used to make biscuits had highest score in overall
acceptability but lacked significance difference with all other formulations. This could be as a
result of personal opinions of the sensory panellists and also differences in the product and
product processing.
4.4.3 Zinc and Iron content of most acceptable CSB flakes formulation in comparison
to cassava flakes (control)
Results in this study showed that both zinc and iron content of the most accepted CSB flakes
were significantly higher (p<0.05) than in cassava flakes of 8.53 ppm and 50.25 ppm
respectively Table 4.4. According to National Institutes of Health and WHO, recommended
dietary allowance (RDA) for zinc and iron are 2-5ppm/ day and 10-11 ppm/day respectively at
an age of 2-5 years. CSB flakes had 19.68 ppm and 50.71 ppm zinc and iron respectively levels
quite higher than RDA. However, due to bioavailability challenges in cereals and legume diets,
the higher the amount increases probability of the minerals being metabolically available
(Fischer et al., 2005).

50
Table 4.4: Zinc and Iron content of cassava flakes and most acceptable CSB
flakes formulation
Zn (ppm) Fe (ppm)
CSB flakes (35:65)
Soy to cassava
19.68±0.06b 50.71±0.06a
Cassava flakes 8.53±0.08a 50.25±0.09a
Values with similar superscript along a column are not statistically different at (p<0.05).
Iron and zinc deficiency is still a global problem especially in women and young children under
five years of age in developing countries causing perinatal complications, poor growth,
intellectual impairment, haematopoiesis impairment and increased risk of mortality and
morbidity (Bailey, West, & Black, 2015). High demand of these micronutrients during infant
growth and pregnancy calls for adequate intake of foods rich in these minerals. Dietary
diversity to access excellent sources of these minerals is highly influenced by poverty levels in
these countries and revolution in agriculture that has led to population abandoning animal based
diets with rich bioavailable Fe and Zn by cereals, legumes and plant based diets (Lynch, 2011).
4.5 Conclusion
Incorporation of soy bean into cassava flours can be used to make flakes that are safe in terms
of cyanide content and anti-nutrients, nutritious with regard to protein quality and with high
acceptability. As a result, the cassava soy bean flakes can be utilized to assist in addressing the
problem of protein energy malnutrition among other benefits. Incorporation of soy bean flour
into cassava flour at a percentage level of 35:65, would at least provide half of the required
daily intake of protein level and increase zinc and iron content required by complementary
weaning children aged between 2-5 years. In addition, among all the formulations in the study,
this formulation is the most acceptable in terms of sensory characteristics.
51
CHAPTER FIVE: SHELF STABILITY AND QUALITY CHANGES DURING
STORAGE OF THE MOST ACCEPTABLE CSB FLAKES
5.1 Abstract
Food insecurity, hunger and safety is still a huge problem in developing countries especially in
SSA countries. This elicits a need by all the stake holder in food supply chain to intensively
focus on invention and innovation of existing and new products to address the gap. However
shelf life determination becomes a challenge especially to farmers who might not have
adequate knowledge of shelf stability. This study aimed at estimating shelf stability of most
acceptable CSB flakes through an accelerated shelf life test using kraft paper, laminated kraft
paper and plastic container.
Moisture content showed a dominant decreasing trend through entire incubation time with
significant differences (p<0.05) existing in incubation days. Highest level of 8.23% being in
plastic container and lowest being 1.23% in laminated kraft paper. Peroxide value increased
significantly (p<0.05) as incubation days increased with highest being 11.48 meq O2/kg oil in
plastic container in day five. Acid value significantly differed (p<0.05) throughout the entire
incubation period for the packaging materials with highest levels being in day 3 for plastic
container of 4.71 mg KOH/g oil. Yeast and moulds differed significantly (p<0.05) with highest
levels being noted in plastic container of 5.37 log cfu/g in day two and lowest in laminated
kraft paper. Laminated kraft paper seemed the most appropriate packaging material in reserving
quality aspects of flakes with an estimated shelf life of about 5 months but could even be longer
as critical limits of the parameters were not yet reached during the 5 days of incubation.

52
5.2 Introduction
In recent past, consumers have demanded complex and dynamic changes in food with focus to
nutrition quality and health, sensory characteristics, convenience, shelf stability among other
reasons (Grunert, 2006). This has pushed scientist, food processors and all other stake holders
to focus on product development for instance with focus to curbing rising PEM in Sub-Saharan
Africa. Nevertheless, accurate shelf life profiling of new products poses a challenge to involved
parties while still crucial to consumers (Manzocco et al., 2012). This calls for extensive
familiarization and understanding of food composition, degradation kinetics and how the
undesirable processes can be stalled or slowed (Freitas & Costa, 2006).
Shelf life can be defined as period of time through which food product will: retain expected
desirable sensory characteristics and acceptability to consumers, chemical and microbiological
and physical attributes, accord with provided nutrition data, and most importantly remain safe
(Phimolsiripol & Suppakul, 2016). Foods contain biological components which with time
degrades causing food to undergo spoilage. As a result, scientists and food manufacturers
employs measures such as packaging, preservatives, handling and storage to slow down
degradation of these biological components (Leufven et al., 2010).
Soy bean a main raw material used in this study is known to have high amounts of oil and with
regard to unsaturated fatty acids linolenic and linoleic acids (Cao et al., 2015; Kim et al., 2007).
Consequently, lipid oxidation of the product that contain soy bean or soy bean oil itself
becomes inevitable bringing about undesirable quality aspects of foods most affected being
sensory characteristics (Su, 2003). Lipid oxidation is the process by which fats and oils
breakdown as a result of environmental factors (storage temperatures, light), moisture content,
presence of pro-oxidants and anti-oxidants, metal catalysts (Fe and Cu) among other factors.
This results to production of radicals, alcohols, aldehydes, ketones, peroxides and other low
molecular weight compounds than can easily reach olfactory cells being perceived as off odors

53
and flavors in foods (Sarkar et al., 2006). As a result, this causes deleterious changes in foods
such as flavor and color loss, nutritional and functional value loss and most importantly
accumulation of compounds that are detrimental to consumer health (Kim et al., 2007).
Accelerated shelf life test (ASLT) is a method of estimating shelf life of a food product where
product stability data is significantly obtained in a shorter time than product’s real shelf-life
(Steele, 2004). It is assumed that by storing food under high temperatures, accelerates most of
reactions that leads to food spoilage such as microbial, enzymatic and chemical reactions such
as lipid oxidation (Phimolsiripol & Suppakul, 2016). However, it is worth noting that the
degree of temperature increase should not result into other reactions in food components or
suppress the reactions that indicate shelf stability of the product (Corradini & Peleg, 2007).
This study sought to evaluate the shelf stability and quality changes in the most preferred
sample of CSB flakes under different packaging materials.
5.3 Materials and Methods
5.3.1 Sample preparation and analysis
Sample preparation was carried out as described in section (4.3.3), sensory evaluation done as
illustrated in section (4.3.4) and the most acceptable sample proceeded with ASLT and further
analyzed for zinc and iron content in comparison with cassava flakes.
5.3.2 Accelerated shelf life test design
5.3.2.1 Accelerated aging time determination
Q10 calculation which is temperature quotient for a 10 0C temperature difference was used to
calculate shelf life. Peroxide value and free fatty acids analysis were used as indicator of sample
deterioration which in this case was slightly above 10% fat content. Q10 of about 4 was used
since the CSB flakes sample in question was partly soy bean based, a high fat content cereal
and therefore oxidation would probably be enzyme dependent. These calculations were based
on Sewarld and Devries (2003).
54
Q10= {Shelf life at given temperature (t 0C)}/ {Shelf life at accelerated temperature (t 0C +10
0C)}
Accelerated aging time was determined by;
Accelerated aging time = Desired real time/ Accelerated aging rate
Where; Accelerated aging rate= Q10 (Te - Ta)/10) where; Te-elevated temperature and Ta-
Ambient temperature
On average, full fat soy bean based products have a shelf life of 180 days due to the high fat
content thus accelerated aging time at 550C is ≈5days hence the experiment was set for 5 days.
5.3.2.2 Sample packaging
CSB flakes for the study were packaged in kraft paper, laminated kraft paper and plastic
containers. Each packaging material had 6 samples of 150 g each representing a sampling day.
The samples were then stored in an incubator at 550C. The final sample was retrieved and
analyzed on day 5.
5.3.2.3 Safety and quality degradation analysis
The CSB flakes sample in each packaging material was evaluated for changes in peroxide
value, acid value, moisture content and yeast and moulds.
Moisture content: Moisture content changes were determined using AOAC (1990) method
925.10 Five gram of sample was weighed in a crucible and put in an air oven at 105° C for four
hours until constant weight was achieved. The moisture content was calculated as a percentage
of sample weight changes.
Peroxide value: This was determined according to AOAC (2006) method 965.33. The samples’
peroxide values were analyzed against the maximum allowable peroxide value of 10-15 milli-
equivalent of active oxygen per kg oil as guided by CODEX (1999) for various vegetable oils
and vegetable oils based foods.

55
Acid Value: Acid value was determined by titration method, AOAC (2012) method 965.33 .
Three grams of sample was weighed in a volumetric flask. Forty milliliter mixture of benzene
and alcohol (1:3) was added and titrated with alcoholic KOH (0.1N) with phenolphthalein as
indicator until pink color, stable for thirty seconds developed. The samples were analyzed on
acid values against the maximum allowable acid value of up to 20-30mgKOH for edible
manufacturing grade soy bean based foods (EAC, 2012) to determine the actual shelf life of
flakes.
Yeast and molds: Yeast and molds were analyzed according to Horizontal method for the
enumeration of yeasts and molds, on potato dextrose agar. ISO 21527-1: 2008.
5.3.3 Statistical analysis
Analysis was done in duplicate and results tabulated as means ± standard deviations. The means
were subjected to an independent t-test and one way analysis of variance (ANOVA) using
Gentstat Software 15th edition. The means were separated by Fisher’s protected LSD multiple
range test and difference was considered significant (p<0.05).
5.4 Results and Discussion
5.4.1 Effect of packaging material on moisture content of flakes
Moisture content of the samples in different packaging material ranged from 1.93 % to 8.23 %
with the lowest observed on the last day of incubation day 5 and the highest on day zero. All
packaging materials in question allowed a degree of moisture loss in (%) of 72.9, 76.5 and 75.9
respectively corresponding to plastic container, kraft paper and laminated kraft paper. This
observed trend was attributed to difference in porosity of the packaging materials (Brody et al.,
2008). Low moisture content in foods hinders growth of yeast and moulds (Perera, 2005).
However, excessive moisture loss can lead to chemical changes that influences sensory
attributes of a food and hence consumer acceptability (Sherwin & Labuza, 2003).

56
Table 5.1: Quality lead indicators for shelf stability of most acceptable CSB
flakes formulation
Days Packaging
material
Moisture
content
(%)
Peroxide
value
(meq O2/kg
Oil)
Acid value
(mg KOH/g
oil)
Yeast and
moulds
(Log CFU/
g)
0 Plastic
Container 8.23±0.00a ND 2.67±0.03i ND
Kraft Paper 8.23±0.00a ND 2.67±0.03i ND
Laminated
Kraft Paper 8.23±0.00a ND 2.67±0.03i ND
1 Plastic
Container 6.59±0.04b 2.18±0.04k 3.53±0.01e ND
Kraft Paper 6.51±0.04b 2.26±0.04k 2.72±0.04hi ND
Laminated
Kraft Paper 6.31±0.04c 1.90±0.04l 3.64±0.04d ND
2 Plastic
Container 3.60±0.02d 3.83±0.02i 4.37±0.06b 5.37±0.03a
Kraft Paper 3.57±0.07de 3.51±0.06j 2.84±0.04g 5.31±0.04a
Laminated
Kraft Paper 3.50±0.05e 3.39±0.05j 4.12±0.05c 4.08±0.05c
3 Plastic
Container 2.91±0.06f 4.90±0.02g 4.71±0.04a 4.52±0.04bc
Kraft Paper 2.82±.05f 4.37±0.03h 3.00±0.05f 5.37±0.03a
Laminated
Kraft Paper 2.81±0.03g 4.48±0.06h 4.28±0.04b 4.61±0.77b
4 Plastic
Container 2.57±0.06hi 8.48±0.06d 3.48±0.06e 4.52±0.04bc
Kraft Paper 2.48±0.05ij 7.79±0.19f 2.00±0.03k 4.34±0.06bc
Laminated
Kraft Paper 2.43±0.03j 8.00±0.05e 3.01±0.04f 4.12±0.06c
5 Plastic
Container 2.23±0.04k 11.48±0.10a 2.71±0.04i 2.44±0.06d
Kraft Paper 1.93±0.04l 10.02±0.03b 1.89±0.06l 2.31±0.08d
Laminated
Kraft Paper 1.98±0.04l 9.31±0.05c 2.22±0.02j ND
LSD 0.09 0.13 0.10 0.50
ND- Not detected
Values with similar superscript along a column are not statistically different at (p<0.05)
There was significant difference in moisture content of the flakes at (p<0.05) throughout the
five days with a dominating decreasing trend as number of incubation days increased.
However, in some instances no significant difference was observed in moisture content in
57
different packaging materials. In incubation day 1, 2, 3 and 4 plastic container and kraft papers
showed no significant difference in moisture content at (p<0.05) as incubation days increased
with exception of last day. This was attributed to closeness of the two packaging materials
porosity. Study done by Raheem (2013) reported that moisture vapor transmission rate is
dependent on permeability of a packaging material which have an impact in moisture
penetration and microbial growth too.
5.4.2 Effect of different packaging material on lipid oxidation of flakes
Peroxide value of food is indicative of level of lipid oxidation present in that food. In this study,
an increasing trend in peroxide value was noted as number of incubation days increased from
day zero to day 5. This was as a result of decrease in activation energy as temperatures
increased from room temperature of 250C to 550C which was set in the incubator and held for
entire study period. This trend agrees with the findings of Azeredo (2004) who reported that
by storing oils in high temperature had an effect of accelerating lipid oxidation. Of all the
packaging materials, the plastic container had the highest peroxide values in all the incubation
days. There was significant difference in peroxide values of samples in different packaging
materials at (p<0.05) except for day one in plastic container and kraft paper, day two and three
for kraft paper and laminated kraft paper. The high peroxide value observed in plastic container
compared to other packaging materials was attributed to its porous nature and transparency
which allowed light and to an extent accelerated the oxidation process. This observation agrees
with the findings of Naz (2004); Manzocco (2012) who reported an increase in peroxide values
of soy bean oil and other vegetable oils in the study with increased light intensity.
Significant differences at (p<0.05) in peroxide values for kraft paper and laminated kraft paper
were noted with exception of day two and three. Laminated kraft paper had a dominance of
low peroxide values during incubation days over the kraft paper. This was probably due to
difference in permeability to moisture with laminated kraft paper having a lower permeability,

58
due to presence of laminate layer inside and hence lower peroxide values of flakes samples in
it. As food absorbs moisture, amount of available oxygen for reactions in food also increases
and therefore to an extent moisture content facilitates oxidation of lipids (Choe & Min, 2006).
5.4.3 Effect of packaging material on acid value of flakes
Acid value level is an indicator of amount of free fatty acids as a result of breakdown of lipids
due to high frying temperatures, enzymatic activity and oxidation. High light intensity,
moisture and high temperatures are known to accelerate formation and accumulation of fatty
acids (Fu et al., 2018; Ullah et al., 2003). In this study, significant differences existed in acid
value (p<0.05) of the three packaging materials during the entire incubation period with
exception of acid value in kraft paper in day three and laminated kraft paper in day four. High
acid values were observed in plastic container in all the entire incubation period with a
maximum of 4.71 mg KOH/g oil in day three. This could have been caused by presence of
oxygen in the head space of the plastic container which was further accelerated by the high
temperatures of 550C during incubation. These results agrees with those reported by Kucuk
(2005) who reported that higher acid and peroxide values in sunflower oil were noted in clear
plastic containers with head spaces compared to glass containers stored in darkness.
Lower levels of acid value were observed in laminated kraft paper compared to kraft paper.
Both were folded tightly that hardly any head space was left. This probably explains the low
acid value levels compared to plastic container. There was continuous rise in acid value in first
three days ranging from a minimum of 2.71 to a maximum of 4.71 mg KOH/g oil, which was
then followed by a decrease in acid value levels due to exhaustion of trapped oxygen. In
general, laminated kraft paper was effective in preventing formation of free fatty acids through
the entire study followed by kraft paper while plastic container showing minimal prevention.

59
5.4.4 Effects of packaging material on growth of yeast and moulds in CSB flakes
Results in Table 5.1 shows that no growth was detected during day zero and first day of
incubation. However, as incubation days increased growth was detected on day two with
variation being significant (p<0.05) in laminated kraft paper and insignificant for plastic
container and kraft paper. Despite the hygiene measures employed during processing and
handling of raw materials, it is possible that post processing activities such as packaging might
have contaminated the CSB flakes with yeast and moulds (Muthomi et al., 2012).
Growth was high during the second incubation day with highest level in plastic container of
5.37 log cfu/g and lowest in laminated kraft paper at 4.31 log cfu/g. This could be as a result
of availability of oxygen and moisture in the initial days before onset of oxidation and drying
due to elevated incubation temperatures of 550. Consequently this lead to depletion in oxygen
and moisture levels after being utilized in oxidation process and drying. Further, low moisture
contents in foods translates to low water activity that hinders microbial growth (Olaimat &
Holley, 2012). Accumulation of carbon dioxide may have contributed to inhibition of some
species of yeast resulting to overall decrease in the number as number of incubation days
increased (Valdes et al., 2015). The results agrees with those reported by Sautor et al., (2002)
who reported similar findings on effect of temperature and water activity in growth of food
spoilage moulds.
A decreasing trend in growth was noted as number of incubation days increased. At (p<0.05)
there was no significance different in growth in different packaging materials in day 2, 4 and 5
with regard to plastic container and kraft paper despite higher growth in plastic being noted.
No growth that was detected on the last day of incubation in laminated kraft paper. This leaves
the laminated kraft paper as the most appropriate packaging material among the three owed to
the low counts of yeast and moulds and lower values of other indicative quality parameters in
the entire study period.

60
5.4.5 Estimation of shelf life of CSB flakes
The results of the study showed that only the plastic packaging material in day 5 slightly
exceeded though with in the maximum allowable limit range for peroxide value. The other
quality indicator parameters did not surpass the maximum allowable limit of, 10-15
milliequivalent of active oxygen per kg for peroxide value and 20-30 mg KOH/g oil for acid
value (CODEX, 1999; EAC 2012). According to Sewarld and Devrise (2003) storage of food
at temperature of 50-550C for 5 days is approximately equivalent to storing food at 250C for 5
months owing to the fact that most of chemical and microbial reactions follow Arrhenius’
equation. Therefore the flakes were considered to be shelf stable for a period of approximately
maximum 5 months with laminated kraft paper as most favorable packaging material. It was
also noted that, any packaging material that eliminated absorption of moisture into the product,
eliminated oxygen and prevented light from reaching the product could be considered favorable
to even extend the shelf life beyond the estimated 5 months.
5.5 Conclusion
Packaging material of a food product prevents microbial contamination and also creates a
barrier between product and any extrinsic factors that can trigger chemical degradation.
Therefore, shelf stability of a product is dependent on packaging material among other factors
such as use of preservative and low temperature storage to extend shelf life. Indicative quality
parameters maximum limits were not exceeded with the three packaging materials put into
consideration hence the product was considered to be shelf stable for a period of five months
but could be probably be longer as the maximum set limits for quality parameters were not yet
exceeded.
61
CHAPTER SIX: GENERAL CONCLUSIONS AND RECOMMENDATIONS
6.1 General Conclusions
Cassava and soy bean as the basic raw materials for developing CSB flakes had significant
differences in proximate composition. With regard to protein and mineral content, soy bean
was then utilized to improve protein and mineral content of cassava by developing a flaked
product from the two. Cyanide was shown to be reduced by soaking cassava roots for 4 days,
pulping and drying the pulp at 550 C for 3 days while soy bean anti-nutrients were shown to be
lowered to levels that can allow metabolic bioavailability.
The formulated flakes were acceptable in terms of sensory attributes appearance texture taste
flavor and overall acceptability with the most acceptable having a ratio of 35:65 of soy to
cassava. This formulation was found to improve the protein content of cassava and would
provide more than a half of recommended daily allowance of protein as recommended by
WHO. Further, its mineral level with focus to zinc and iron were shown to have improved
compared to the control cassava flakes. This would increases chances of metabolic
bioavailability of these minerals.
Packaging materials were shown to have a huge impact when it comes to shelf stability of a
product. It protects the food product against microbial and chemical degradation that would set
in upon interaction of food with intrinsic and extrinsic factors. CSB flakes being made with
full fat soy, it would be susceptible to fat degradation due to high content of unsaturated fatty
acids such as linoleic and linoleic. Therefore the most appropriate packaging material would
serve to prevent fat degradation and microbial contamination by preventing the low moisture
content CSB flakes from absorbing moisture. The study concluded that laminated kraft paper
was the most appropriate packaging material in comparison with other packaging materials
considered and would keep the flakes stable for five months or more before onset of
deterioration.

62
6.2 General Recommendations
The study was based on pilot plant level and lab trials studies. It is therefore necessary to carry
out suitability studies on commercialization using business models to assess profitability if the
project was to be adopted by a community. Further, market sensitization to consumers is still
necessary to enlighten the public on the common cheap raw materials that can be used to
develop nutritious products.
The ASLT was done through estimation due to limitation of time during the study period. It
would be necessary to conduct a real shelf life test while assessing the quality parameters too
until onset of deterioration. Finally, it would be of great help to cascade the findings of the
study to various target groups like communities through government agencies and non-
governmental organizations that solely focus in improving livelihood via nutritional
intervention programs.
63
REFERENCES
Abel Otache, M., Terver Ubwa, S., and Kparobo Godwin, A. (2017). Proximate Analysis and
Mineral Composition of Peels of Three Sweet Cassava Cultivars. Asian Journal of
Physical and Chemical Sciences, 3(4), 1–10.
Abioye, V. F., O Ade-Omowaye, B. I., Babarinde, G. O., and Adesigbin, M. K. (2011).
Chemical, physico-chemical and sensory properties of soy-plantain flour. African Journal
of Food Science, 5(4), 176–180.
Achidi, A. U., Ajayi, O. A., Bokanga, M., and Maziya-, B. (2017). The Use of Cassava Leaves
as Food in Africa. Ecology of Food and Nutrition, 44(6), 423-435.
Adesokan, I. A., Fawole, A. O., Ekanola, Y. A., Odejayi, D. O., and Olanipekun, O. K. (2011).
Nutritional and sensory properties of soybean fortified composite ogi – A Nigerian
fermented cereal gruel. African Journal of Microbiology 5(20), 3144–3149.
Adeyeye, A. (1992). Chemical composition and fatty acid profiles of cereals in Nigeria.
Journal of Food Chemistry, 44, 44–47.
Agarwal, K. (2014). Comparative Biochemical Analysis of Raw and Processed Soybean.
Journal of Science and Technology, 3(1), 61–66.
Akande, K. E., and Fabiyi, E. F. (2010). Effect of Processing Methods on Some Antinutritional
Factors in Legume Seeds for Poultry Feeding. Internationa Journal of Poultry Science
9(10), 996–1001.
Akubor, P. I., and Ukwuru, M. U. (2003). Functional properties and biscuit making potential
of soybean and cassava flour blends. Plant Foods for Human Nutrition, 58(3), 1–12.
Alabi M.O, and Anuonye J.C, (2007). Nutritional and sensory attributes of soy-supplemented
cereal meals. Nigerian Food Journal, 25(1), 100-110.
Andama, M., and Oloya, B. (2017). Effectiveness of Traditional Processing Techniques in
Reducing Cyanide Levels in Selected Cassava Varieties in Zombo District , Uganda.

64
International Journal of Food Science and Biotechnology, 2(4), 121–125.
AOAC. (2012). Official methods of analysis, Association of official analytical chemist (19th
Editi). Washington D.C., USA.
Avil, S., and Chuck-hern, C. (2018). Inactivation Methods of Trypsin Inhibitor in Legumes : A
Review. Journal of Food Science 83(1), 17-29.
Awasthi, I., Siraj, P., and Tripathi, M. (2012). Development of soy fortified high protein and
high calorie supplementary biscuits. Indian Journal of Science and Research, 3(1), 51–
58.
Azeredo, H. M. C., Faria, J. D. A. F., and Da Silva, M. A. (2004). Minimization of peroxide
formation rate in soybean oil by antioxidant combinations. Food Research International,
37(7), 689–694.
Bailey, R. L., West, K. P. and Black, R. E. (2015). The epidemiology of global micronutrient
deficiencies. Annals of Nutrition and Metabolism, 66(suppl 2), 22–33.
Bajpai, S., Sharma, A., and Gupta, M. N. (2004). Removal and recovery of antinutritional
factors from soybean flour. Journal of Food Chemistry, 89, 497-501.
Banea, J. P., Bradbury, J. H., Mandombi, C., Nahimana, D., Ian, C., Foster, M. P., and
Katumbay, D. T. (2014). Prevention of konzo in the Democratic Republic of Congo (
DRC ) using the wetting method and correlation between konzo incidence and percentage
of children with high urinary thiocyanate level. African Journal of Food Science, 8(6),
297–304.
Bankole, S. a, and Adebanjo, A. (2003). Mycotoxins in food in West Africa : current situation
and possibilities of controlling it. Journal of Biotechnology, 2(9), 254–263.
Bradbury, J. H., & Gleadow, R. (2017). Total cyanide content of cassava food products in
Australia. Journal of Food Composition and Analysis, 25(1), 79–82.

65
Brody, A. L., Bugusu, B., Han, J. H., Sand, C. K., and McHugh, T. H. (2008). Innovative food
packaging solutions. Journal of Food Science, 73(8) 52-68.
Burns, A., Gleadow, R., Cliff, J., Zacarias, A., and Cavagnaro, T. (2010). Cassava: The
drought, war and famine crop in a changing world. Sustainability, 2(11), 3572–3607.
C. Ferreira, E., Rita A. Nogueira, A., B. Souza, G., and A. R. Batista, L. (2004). Effect of
drying method and length of storage on tannin and total phenol concentrations in Pigeon
pea seeds. Food Chemistry, 86(1), 17–23.
Cao, J., Li, H., Xia, X., Zou, X. G., Li, J., Zhu, X. M., and Deng, Z. Y. (2015). Effect of fatty
acid and tocopherol on oxidative stability of vegetable oils with limited air. International
Journal of Food Properties, 18(4), 808–820.
Ceballos, H., Sánchez, T., Chávez, A. L., Iglesias, C., Debouck, D., Mafla, G., and Tohme, J.
(2006). Variation in crude protein content in cassava (Manihot esculenta Crantz) roots.
Journal of Food Composition and Analysis, 19(6–7), 589–593.
Charles, A. L. (2016). Proximate composition , mineral contents , hydrogen cyanide and phytic
acid of 5 cassava genotypes. Journal of Food Chemistry, 10(5), 225-239.
Charles, A. L., Sriroth, K., and Huang, T. C. (2005). Proximate composition, mineral contents,
hydrogen cyanide and phytic acid of 5 cassava genotypes. Food Chemistry, 92(4), 615–
620.
Chinma, C. E., Ariahu, C. C., and Abu, J. O. (2013). Chemical composition, functional and
pasting properties of cassava starch and soy protein concentrate blends. Journal of Food
Science and Technology, 50(6), 1179–1185.
Choe, E., and Min, D. B. (2006). Mechanisms and Factors for Edible Oil Oxidation. Institute
of Food Technologist, 5(4), 169–186.
Corradini, M. G., and Peleg, M. (2007). Shelf-life estimation from accelerated storage data.
Trends in Food Science and Technology, 18(1), 37–47.

66
Dada, T. A., Barber, L. I., Ngoma, L., and Mwanza, M. (2018). Formulation, sensory
evaluation, proximate composition and storage stability of cassava strips produced from
the composite flour of cassava and cowpea. Food Science and Nutrition, 6(2), 395–399.
Duizer, L. M., and Walker, S. B. (2015). The Application of Sensory Science to the Evaluation
of Grain-Based Foods. Encyclopedia of Food Grains: Second Edition (2nd ed., Vol. 3–
4). Elsevier Ltd.
Eke, U. B., Owalude, S. O., and Usman, L. A. (2008). Enrichment of a Cassava Meal ( Gari )
with Soyabean Protein Extract. Advances in Natural and Applied Sciences, 2(2), 60–62.
El-shemy, H., Abdel-rahim, E., Shaban, O., Ragab, A., and Fujita, K. (2012). Comparison of
nutritional and antinutritional factors in soybean and fababean seeds with or without
cortex Comparison of Nutritional and Antinutritional. Soil Science and Plant Nutrition
44(6), 515–524.
Eleazu, C. O. (2012). Determination of the proximate composition, total carotenoid, reducing
sugars and residual cyanide levels of flours of 6 elite yellow and white cassava varieties.
International Journal of Toxicological and Pharmacological Research, 45(5), 589-596.
Emmanuel O.A., Clement A., S.B, A., Karltun, C., and B.N, D. (2012). Chemical composition
and cyanogenic potential of traditional and high yielding CMD resistant cassava ( Manihot
esculenta Crantz ) varieties. Internationa Food Research Journal 19(1), 175–181.
Ernesto, M., Cardoso, A. P., Nicala, D., Massaza, F., Cliff, J., Haque, M. R., and Bradbury, J.
H. (2002). Persistent konzo and cyanogen toxicity from cassava in northern Mozambique. Acta
Tropica 82, 357–362.
Eshun, G. (2012). Nutrient composition and functional properties of bean flours of three soya
bean varieties from Ghana. African Journal of Food Science and Technology, 3(8), 2141–
5455.

67
Etiosa, O. R., Chika, N. B., and Benedicta, A. (2018). Mineral and Proximate Composition of
Soya Bean. Asian Journal of Chemical and Physical Sciences 4(3) 1-6.
Famurewa, J., and Emuekele, P. (2014). Cyanide reduction pattern of cassava ( mannihot
Esculenta ) as affected by variety and air velocity using fluidized bed dryer. Journal of
Food Science and Technology, 5(3), 75–80.
Fandohan, P., Gnonlonfin, B., Hell, K., Marasas, W. F. O., and Wingfield, M. J. (2005). Natural
occurrence of Fusarium and subsequent fumonisin contamination in preharvest and stored
maize in Benin, West Africa. International Journal of Food Microbiology, 99(2), 173–
183.
Fischer Walker, C. L., Kordas, K., Stoltzfus, R., and Black, R. E. (2005). Interactive effects of
iron and zinc on biochemical and functional. The American Journal of Clinical Nutrition,
85(March), 5–12.
Franco-Fraguas, L., Plá, A., Ferreira, F., Massaldi, H., Suárez, N., and Batista-Viera, F. (2003).
Preparative purification of soybean agglutinin by affinity chromatography and its
immobilization for polysaccharide isolation. Journal of Chromatography B: Analytical
Technologies in the Biomedical and Life Sciences, 790(1–2), 365–372.
Freitas, M. A., and Costa, J. C. (2006). Shelf life determination using sensory evaluation scores:
A general Weibull modeling approach. Computers and Industrial Engineering, 51(4),
652–670.
Fu, X., Xing, S., Xiong, H., Min, H., Zhu, X., He, J., and Mu, H. (2018). Effects of packaging
materials on storage quality of peanut kernels. PLoS ONE, 13(3), 1–10.
Gegios, A., Amthor, R., Maziya-Dixon, B., Egesi, C., Mallowa, S., Nungo, R., and Manary,
M. J. (2010). Children consuming cassava as a staple food are at risk for inadequate zinc,
iron, and vitamin A intake. Plant Foods for Human Nutrition, 65(1), 64–70.
68
Githunguri, C. M., Lung’ahi, E. G., Kabugu, J., and Musili, R. (2015). Cassava Farming
Transforming Livelihoods Among Smallholder Farmers in Mutomo a Semi-arid District
in Kenya. Adapting African Agriculture To Climate Change: Transforming Rural
Livelihoods, (October), 225–233.
Grunert, K. G. (2006). How changes in consumer behaviour and retailing affect competence
requirements for food producers and processors. Economia Agraria y Recursos Naturales,
6(11), 3–22.
Hartman, G. L., West, E. D., and Herman, T. K. (2011). Crops that feed the World 2. Soybean-
worldwide production, use, and constraints caused by pathogens and pests. Food Security,
3(1), 5–17.
Hillocks, R. J. (2002). Cassava in Africa. Journal of Agricuture 6(8) 41–54.
Hongbété, F., Mestres, C., Akissoé, N., and Nago, M. C. (2009). Effect of processing
conditions on cyanide content and colour of cassava flours from West Africa. African
Journal of Food Science 3(1), 1–6.
Hounhouigan, D. J. (2014). Reduction of the cyanide content during fermentation of cassava
roots and leaves to produce bikedi and ntoba mbodi , two food products from Congo.
African Journal of Biotechnology, 4(7), 689-696.
Ibrahim, S. S., Habiba, R. A., Shatta, A. A., and Embaby, H. E. (2002). Effect of soaking ,
germination , cooking and fermentation on antinutritional factors in cowpeas. Nahrung/
Food 46(2), 92–95.
Impact of adding chickpea ( Cicer arietinum L .) flour to wheat flour on the rheological
properties of toast bread. (2012), 19(2), 521–525.
Jarvis, A., Ramirez-Villegas, J., Campo, B. V. H., and Navarro-Racines, C. (2012). Is Cassava
the Answer to African Climate Change Adaptation? Tropical Plant Biology, 5(1), 9–29.
69
Jennings, D. (2003). Cassava Brown Streak Virus Disease : Past , Present and Future Cassava
Brown Streak Virus Disease : Past , Present and Future. African Journal of Food Science,
5(8), 538-560.
Kaviani, B., and Kharabian, A. (2008). Improvement of the Nutritional Value of Soybean [
Glycine max ( L ) Merr .] Seed with Alteration in Protein Subunits of Glycinin ( 11S
Globulin ) and β -conglycinin ( 7S Globulin ). Turkish Journal of Biology, 32, 91–97.
Kim, H. J., Hahm, T. S., and Min, D. B. (2007). Hydroperoxide as a prooxidant in the oxidative
stability of soybean oil. JAOCS, Journal of the American Oil Chemists’ Society, 84(4),
349–355.
Kobawila, S. C., Louembe, D., Keleke, S., Hounhouigan, J., and Gamba, C. (2005). Reduction
of the cyanide content during fermentation of cassava roots and leaves to produce bikedi
and ntoba mbodi , two food products from Congo. African Journal of Biotechnology, 4(7),
689–696.
Kucuk, M., and Caner, C. (2005). Effect of packaging materials and storage conditions on
sunflower oil quality. Journal of Food Lipids, 12(3), 222–231.
Lambri, M., Fumi, M. D., Roda, A., Faveri, D. M. De, Cattolica, U., and Parmense, V. E.
(2013). Improved processing methods to reduce the total cyanide content of cassava roots
from Burundi. African Journal Biotechnology 12(19), 2685–2691.
Latta, M., and Eskin, M. (1980). A Simple and Rapid Colorimetric Method for Phytate
Determination. Journal of Agricultural and Food Chemistry, 28(6), 1313–1315.
Lee, K., and Shibamoto, T. (2011). Toxicology and antioxidant activities of non- enzymatic
browning reaction products : review of non-enzymatic browning reaction. Food Review
International 10(2012), 37–41.
Leufven, A., Sedaghat, N., and Habibi, M. B. (2010). Influence of different packaging systems
on stability of raw dried pistachio nuts at various conditions. Amirican-Eurasion Journal
70
of Agriculture and Environmental, 8(5), 576–581.
Lokuruka, M. (2010). Soybean nutritional properties: the good and the bad about soy foods
consumption-a review. African Journal of Food Agriculture Nutrition and Development
10(4), 2439-2459.
Luo, Y., and Xie, W. (2013). Effect of different processing methods on certain antinutritional
factors and protein digestibility in green and white faba bean ( Vicia faba L.). Journal of
Food 11(1), 43-49.
Lynch, S. R. (2011). Why Nutritional Iron Deficiency Persists as a Worldwide Problem. The
Journal of Nutrition, 24(11), 586–591.
Maggie, B., and Covington, M. . (2004). Omega-3 Fatty Acids. American Family Physician,
70(1), 133–140.
Manzocco, L., Panozzo, A., and Calligaris, S. (2012). Accelerated shelf life testing (ASLT) of
oils by light and temperature exploitation. JAOCS, Journal of the American Oil Chemists’
Society, 89(4), 577–583.
Maredia, M. K., Byerlee, D., and Pee, P. (2000). Impacts of food crop improvement research:
evidence from sub-Saharan Africa. Food Policy, 25(5), 531–559.
Mashayekh, M., Mahmoodi, M. R., and Entezari, M. H. (2008). Effect of fortification of
defatted soy flour on sensory and rheological properties of wheat bread. International
Journal of Food Science and Technology, 43(9), 1693–1698.
Maziya-Dixon, B., Alamu, E. O., Popoola, I. O., and Yomeni, M. (2017). Nutritional and
sensory properties: Snack food made from high-quality cassava flour and legume blend.
Food Science and Nutrition, 5(3), 805–811.
Miki, A., Peri, V., Đ, V., Srebri, M., and Mihailovi, V. (2009). Anti-nutritional legumes factors
in some grain. Biotechnology in Animal Husbandry 25, 1181–1188.
71
Montagnac, J. A., Davis, C. R., and Tanumihardjo, S. A. (2009b). Processing techniques to
reduce toxicity and antinutrients of Cassava for use as a staple food. Comprehensive
Reviews in Food Science and Food Safety, 8, 17-29.
Mubarak, A. E. (2005). Nutritional composition and antinutritional factors of mung bean seeds
(Phaseolus aureus) as affected by some home traditional processes. Food Chemistry,
89(4), 489–495.
Müller, O., and Krawinkel, M. (2005). Malnutrition And Health In Developing Countries.
Canadian Medical Association Journal, 173(3), 279–86.
Muoki, P. N., De Kock, H. L., and Emmambux, M. N. (2012). Effect of soy flour addition and
heat-processing method on nutritional quality and consumer acceptability of cassava
complementary porridges. Journal of the Science of Food and Agriculture, 92(8), 1771–
1779.
Muthomi, J. W., Musyimi, S. L., Wagacha, J. M., & Narla, R. D. (2012). Occurrence of
Fusarium species and associated T2-toxin in Kenyan wheat. Agricultural Sciences, 3(1),
24–34.
Navicha, W. B., Hua, Y., Masamba, K., and Kong, X. (2017). Optimization of soybean roasting
parameters in developing nutritious and lipoxygenase free soymilk. Journal of Food
Measurement and Characterization, 8(5), 827-842.
Navicha, W., Hua, Y., Masamba, K. G., Kong, X., Zhang, C., Navicha, W., and Masamba, K.
G. (2018). Effect of soybean roasting on soymilk sensory properties. British Food Journal
5(6), 1-12.
Naz, S., Sheikh, H., Siddiqi, R., and Sayeed, S. A. (2004). Oxidative stability of olive, corn
and soybean oil under different conditions. Food Chemistry, 88(2), 253–259.

72
Ndung’u, J. M., and Muli, B. M. (2007). Processing cassava into chips in coastal kenya :
commercial potential is in the future. Kenya Agricultural Research Institute 16(80109),
179–183.
Ndung’u, J. N. (2012). Influence of the Environment on Cassava Quality Traits in Central Rift
Valley of Kenya. American Journal of Plant Sciences, 03(10), 1504–1512.
Nhassico, D., Muquingue, H., Cliff, J., Cumbana, A., and Bradbury, J. H. (2008). Rising
African cassava production , diseases due to high cyanide intake and control measures.
Journal of the Science of Food and Agriculture, 88(8), 2043–2049.
Nungo, R. A., Okoth, M. W., and Mbugua, S. K. (2012). Nutrition Status of Children Under-
Five Years in Cassava Consuming Communities in Nambale , Busia of Western Kenya.
Food and Nutrition Sciences, 2012(3), 796–801.
Obadina, A. O., Oyewole, O. B., Sanni, L. O., Tomlins, K. I., and Westby, A. (2008).
Identification of hazards and critical control points (CCP) for cassava fufu processing in
South-West Nigeria. Food Control, 19(1), 22–26.
Obiero, H. M., Whyte, J. A. B., Legg, J. P., Akhwale, M. S., Malinga, J., & Magut, T. (2007).
Successful restoration of cassava production in Western Kenya. Proceedings of the 13th
ISTRC Symposium, 682–685.
Odom, T. C., Udensi, E. A., and Nwanekezi, E. C. (2012). Microbiological Qualities of
Hawked Retted Cassava Fufu in Aba Metropolis of Abia State. Nigerian Food Journal,
30(1), 53–58.
Oke, O. L. (1994). Eliminating Cyanogens From Cassava Through Processing: Technology
and Tradition. Acta Horticulturae 6(5), 56-68.
Olaimat, A. N., and Holley, R. A. (2012). Factors influencing the microbial safety of fresh
produce: A review. Food Microbiology, 32(1), 1–19.
73
Oluwamukomi, M. O., Oluwalana, I. B., and Akinbowale, O. F. (2011). Physicochemical and
sensory properties of wheat-cassava composite biscuit enriched with soy flour. African
Journal of Food Science, 5(2), 50–56.
Pan, L., Qin, G., Zhao, Y., Wang, J., Liu, F., and Che, D. (2013). Effects of Soybean Agglutinin
on Mechanical Barrier Function and Tight Junction Protein Expression in Intestinal
Epithelial Cells from Piglets. International Journal of Molecular Science, 14, 21689–
21704.
Perera, C. (2005). Selected Quality Attributes of Dried Foods. Drying Technology, 23(4), 717–
730.
Phimolsiripol, Y., and Suppakul, P. (2016). Techniques in Shelf Life Evaluation of Food
Products. Reference Module in Food Science, (October 2017). Chiang Mai.
Prakash, A. (2013). Cassava: International Market Profile. Journal of Agriculture 8, 2–11.
Raheem, D. (2013). Application of plastics and paper as food packaging materials - An
overview. Emirates Journal of Food and Agriculture, 25(3), 177–188.
Rahma, E. H., and Sobihah, T. Y. (2000). Effect of soaking process on nutritional quality and
protein solubility of some legume seeds. Nahrung 4(5), 339–343.
Samuel, F. O., Ishola, O. R., and Otegbayo, B. O. (2015). Nutritional and Sensory Evaluation
of Rice-Based Masa Enriched with Soybean and Crayfish. Food and Nutrition Sciences,
6, 234–241.
Samuel, F. O., Otegbayo, B. O., and Alalade, T. (2012). Nutrient and Anti-Nutrient Content of
Soy-Enriched Tapioca. Food and Nutrition Sciences, 3, 784–789.
Sangronis, E. Ã., and Machado, C. J. (2007). Influence of germination on the nutritional quality

74
of Phaseolus vulgaris and Cajanus cajan. Lebensmittel-Wissenschaft & Technologie 40,
116–120.
Sarkar, A., Golay, P. A., Acquistapace, S., and Craft, B. D. (2015). Increasing the oxidative
stability of soybean oil through fortification with antioxidants. International Journal of
Food Science and Technology, 50(3), 666–673.
Sarr, P. S., Shigeru, A., and Ngue-, T. (2014). Cassava value chain development through
partnership and stakeholders ’ platform in Cameroon. International Journal of
Agricultural Policy and Research, 2(11), 383–392.
Sautour, M., Soares Mansur, C., Divies, C., Bensoussan, M., and Dantigny, P. (2002).
Comparison of the effects of temperature and water activity on growth rate of food
spoilage moulds. Journal of Industrial Microbiology and Biotechnology, 28(6), 311–315.
Sewald, B. M., and Devries, J. (2003). Food Product Shelf Life. Journal of Food Sciences 44,
pp 1162
Sherwin, C., and Labuza, T. P. (2003). Role of Moisture in Maillard Browning Reaction Rate
in Intermediate Moisture Foods: Comparing Solvent Phase and Matrix Properties. Journal
of Paleontology, 62(2), 302–303.
Siulapwa, N., and Mwambungu, A. (2015). Nutritional Value of Differently Processed
Soybean Seeds. The Indian Journal of Nutrition and Dietetics, 52(1), 45–56.
Spear, Jordan Dustin, "Genetic improvement of seedling emergence of soybean lines with low
phytate " (2006). Iowa State University, Retrospective Theses and Desertations, (862).
Steele, R. (2004). Understanding and measuring the shelf-life of food. CRC Press, Boca Raton.
Stephenson, K., Amthor, R., Mallowa, S., Nungo, R., Maziya-dixon, B., Gichuki, S., and
Manary, M. (2010). Consuming cassava as a staple food places children 2-5 years old at
risk for inadequate protein intake , an observational study in Kenya and Nigeria. African
journal of Nutrition, 5(6), 1–6.
75
Steve, L. T., and L., H. S. (2001). Food Allergies and Other Food Sensitivities. Journal of Food
Technology, 55(9), 68-83.
Stupak, M., Vanderschuren, H., and Stupak, M. (2006). Biotechnological approaches to
cassava protein improvement Biotechnological approaches to cassava protein
improvement. Trends in Food Science and Technology, 20, 1-9.
Su, C. (2003). Fatty acid composition of oils , their oxidative , flavor and heat stabilities and
the resultant quality in foods. Iowa State University, Retrospective Theses and
Desertations, (1466).
Taylor, P., Luo, Y., and Xie, W. (2012). Effect of different processing methods on certain
antinutritional factors and protein digestibility in green and white faba bean ( Vicia faba
L .). Journal of Food, 11(1), 37–41.
Tinsley, R. L. (2009). Assessing the Soybean Value Chain Analysis in Kenya. Cnfa, 5(6), 1-
50.
Tivana, L. D. (2012). Cassava Processing : Safety and Protein Fortification. Lund, Media-
Tryck Lund University.
Torres, M., Lloret, C., Sosa, M., and Maestri, D. (2006). Composition and oxidative stability
of soybean oil in mixtures with jojoba oil. European Journal of Lipid Science and
Technology, 108(6), 513–520.
Trimble, Loren Ambrose, "Genetic improvement of seedling emergence of low-phytate
soybean lines" (2009). Graduate Theses and Dissertations. Lowa state University (10499).
Udensi, E. A., Ekwu, F. C., and Isinguzo, J. N. (2007). Antinutrient Factors of Vegetable
Cowpea ( Sesquipedalis ) Seeds During Thermal Processing. Pakistan Journal of
Nutrition, 6(2), 194–197.
Ugwu, B. O., and Ukpabi, U. J. (2002). Potential of soy-cassava flour processing to sustain
increasing cassava production in Nigeria. Outlook on Agriculture, 31(2), 129–133.
76
Ullah, J., Hamayoun, M., Ahmad, T., Ayub, M., and Zafarullah, M. (2003). Effect of light,
natural and synthetic antioxidants on stability of edible oil and fats. Asian Journal of Plant
Sciences, 2(17-24), 1192-1194.
Valdes, A., Beltrn, A., Karabagias, I., Badeka, A., Kontominas, M. G., and Garrigs, M. C.
(2015). Monitoring the oxidative stability and volatiles in blanched, roasted and fried
almonds under normal and accelerated storage conditions by DSC, thermogravimetric
analysis and ATR-FTIR. European Journal of Lipid Science and Technology, 117(8),
1199–1213.
Valdivia, C., Danda, M. K., Sheikh, D., Gathaara, V., Mbure, G., Murithi, F., and Folk, W.
(2014). Using translational research to enhance farmers ’ voice : a case study of the
potential introduction of GM cassava in Kenya ’ s coast. Agriculture and Human Values,
31, 673–681.
Vijayakumari, K., Pugalenthi, M., and Vadivel, V. (2007). Food Chemistry Effect of soaking
and hydrothermal processing methods on the levels of antinutrients and in vitro protein
digestibility of Bauhinia purpurea L . seeds. Food Chemistry, 103, 968–975.
Wareing, P. W., Westby, A., Gibbs, J. A., Allotey, L. T., and Halm, M. (2001). Consumer
preferences and fungal and mycotoxin contamination of dried cassava products from
Ghana. International Journal of Food Science and Technology, 36(1), 1–10.
Westby, A., and Me, K. (2002). Cassava Utilization , Storage and Small-scale Processing.
Journal of Agricultural Policy and Development, 6(10), 281–300.
WHO/FAO/UNU Expert Consultation. (2007). Protein and amino acid requirements in human
nutrition. World Health Organization Technical Report Series, (935), 1–265.
WHO/UNICEF. (1998). WHO |Complementary feeding of young children in developing
countries. WHO, ROME.

77
Williams, J. H., Phillips, T. D., Jolly, P. E., Stiles, J. K., Jolly, C. M., and Aggarwal, D. (2004).
Human aflatoxicosis in developing countries : a review of toxicology , exposure , potential
health consequences , and interventions. American Journal of Clinical Nutrition, 80,
1106–1122.
Wireko-Manu, F., Otu, M., Aryeetey, E., Quarcoo, C., and Oduro, I. (2016). Acceptability of
Instant Cassava-soybean Based Complementary Food by Weaning Mothers. British
Journal of Applied Science & Technology, 18(6), 1–11.
Wobeto, C. ., Corrêa, A. D. ., De Abreu, C. M. P. ., Dos Santos, C. D ., and De Abreu, J. R. .
(2006). Nutrients in the cassava (Manihot esculenta Crantz) leaf meal at three ages of the
plant. Ciencia e Tecnologia de Alimentos, 26(4), 865–869.
Yang, H., Hsu, C., and Yang, Y. (2014). Effect of thermal treatments on anti-nutritional factors
and antioxidant capabilities in yellow soybeans and green-cotyledon small black
soybeans. Journal of science of Food and Agriculture, 94, 1794-1801.
Yasothai, R. (2016). Antinutritional factors in soybean meal and its deactivation. International
Journal of Science, Environment and Technology, 5(6), 3793–3797.
Zarkadas, C. G., Gagnon, C., Gleddie, S., Khanizadeh, S., Cober, E. R., & Guillemette, R. J.
D. (2007). Assessment of the protein quality of fourteen soybean [Glycine max (L.) Merr.]
cultivars using amino acid analysis and two-dimensional electrophoresis. Food Research
International, 40(1), 129–146.
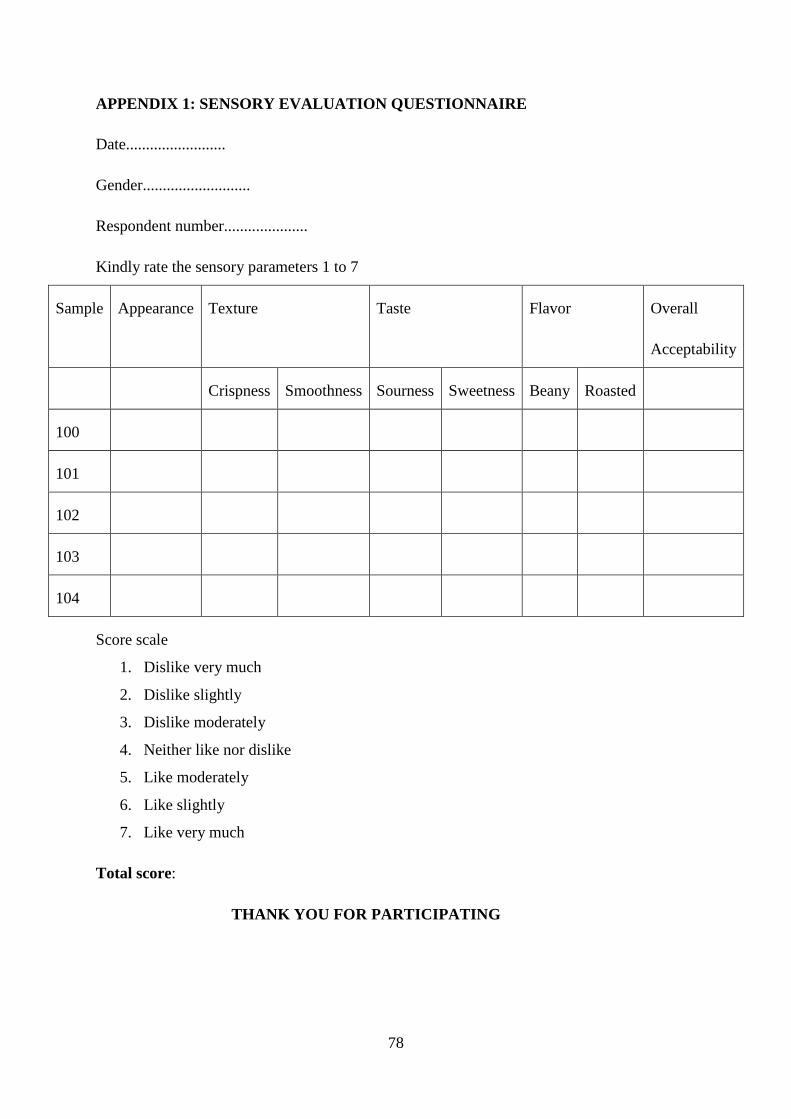
78
APPENDIX 1: SENSORY EVALUATION QUESTIONNAIRE
Date.........................
Gender...........................
Respondent number.....................
Kindly rate the sensory parameters 1 to 7
Sample Appearance Texture Taste Flavor Overall
Acceptability
Crispness Smoothness Sourness Sweetness Beany Roasted
100
101
102
103
104
Score scale
1. Dislike very much
2. Dislike slightly
3. Dislike moderately
4. Neither like nor dislike
5. Like moderately
6. Like slightly
7. Like very much
Total score:
THANK YOU FOR PARTICIPATING