Embed Size (px)
Citation preview

Development of a Novel Eco-Friendly
Thermoelectric Air-Conditioning System
Tiasha Joardar ©
Tiasha Joardar ©
5124 Water Haven Lane
Plano, TX 75093

2
Acknowledgements
First I would like to thank Ms. Deanna Shea for her help and guidance with the entire science
fair process. I would like to thank my father for purchasing all the items required for this project,
for his help with constructing some of the apparatus, for allowing me to use the garage and
laundry room, for explaining several electrical and thermal concepts, and for proof reading and
help with formatting this report. All experimental work was done in our home in Plano, Texas.

3
Abstract
A novel thermoelectric air conditioning system is reported that can remove heat without
requiring the use of energy intensive compressors or environmentally harmful
chlorofluorocarbons (CFCs). Thermoelectric cooling units (TECs) operate on the Peltier Effect
and use electricity to pump heat. A TEC based air conditioning unit is demonstrated which
consumes significantly less energy than a vapor compression unit of similar size when used to
maintain a scaled model home at 8°C below outside temperature under a heat load of 150 W/m2.
In addition, a method for optimization of the currents in each stage of a two-stage cascaded
thermoelectric cooling system is developed theoretically and confirmed experimentally for the
first time.
Since commercially available TECs have low Coefficients of Performance (COP),
several innovative steps are taken to overcome this limitation. First, it is recognized from
theoretical analysis that the energy used by TECs decreases exponentially with heat load. By
using a "divide and conquer" approach where the heat load is shared by multiple TEC modules in
a room, the overall energy efficiency of the system is greatly improved. Second, it is also noted
from theoretical analysis that the COP of thermoelectric cooling systems improves significantly
if its hot side temperature is kept as low as possible. This is accomplished by using a water-
cooled heat sink which efficiently removes heat from the module, thereby keeping its hot side at
a temperature no higher than the outside air temperature. The active heat sink is powered by
solar cells, which have no operating cost. Thirdly, theoretical analysis is used to show that
energy efficiency of a thermoelectric system can be increased further by using a cascaded dual-
stage system if the current in each stage is optimized.
Several experiments are conducted the results from which support the theoretical
findings. A scaled model home is constructed for experiments and fitted with a traditional vapor
compression air conditioner unit on one side and a thermoelectric unit on the other. The walls are
insulated using Styrofoam insulation. A resistor bank driven by a variable power supply is placed
inside the model home. This serves as a controllable heat load. Energy used by the vapor
compression and thermoelectric systems as a function of home indoor temperatures is
investigated. It is found that under identical heat load and temperature conditions, it is possible to
obtain up to 40% savings in energy usage using a dual-stage cascaded thermoelectric system by
optimizing the current driven through the TECs.
The findings of this project provide an opportunity to reduce energy usage in homes and
buildings greatly and open up the possibility of providing air conditioning in homes in less
developed areas. Additional efficiency gains are possible by using real time adaptive control on
the current flowing through the units. This aspect will be studied in future.

4
Table of Contents
1. Introduction ………………………………………………………………………………… 7
1.1 Problem Statement………………………………………………………………........ 8
1.2 Fundamentals of Solid State Thermoelectric Cooling ……………………………..... 8
1.3 Review of Prior Work…………………………………………………….………..... 11
2. Theory…………………………………………………..……………………………………12
2.1 Single Stage Thermoelectric Cooling ………………….................................................14
2.2 Two-stage Cascaded Thermoelectric Cooling.……………………………………..…..14
2.3 Design Innovations Based on Theoretical Analysis ………………………..………… 18
2.4 Theoretical Calculations and Hypothesis ……………………………… ……………19
3. Experimental Setup and Procedures …...……………………………………………….. 20
3.1 Variables……………………………………………………..……………………….. 20
3.2 Apparatus Used………………………………………….……………………………. 20
3.3 Measurement Procedures……………………................................................................ 23
4. Experimental Results……………………………………………………………………… 23
4.1 Energy Consumption of Vapor Compression System………………………………... 23
4.2 Energy Consumption of Single Stage Thermoelectric Systems…… …………......25
4.3 Energy Consumption of Two-Stage Cascaded Thermoelectric Systems………………28
5. Discussion………………...………………………………………………………………….29
6. System Cost Comparisons……………….………………………………………………….30
7. Future Work………………………………………………………………………………... 32
8. Conclusions…………………………………………………………………………………. 32
9. References ………………………………………………………………………………….. 33

5
List of Figures
Fig. 1 Simplified diagram of a TEC showing (a) a single junction and (b) an assembled
view of a TEC module.. 9
Fig. 2 Theoretical dependence of optimum COP of a TEC module on its hot
side temperature. 11
Fig. 3 Theoretically calculated plots of indoor temperature, cooling power, and COP as a
function of current passed through a single-stage thermoelectric
air conditioning system. 14
Fig. 4 Diagram showing a two-stage thermoelectric cooling system. 14
Fig. 5 Theoretically calculated variation of cold side temperature TC with currents in the
upper and lower TECs. (a) is a 3-d surface plot and (b) is a contour plot of the data. 16
Fig. 6 3-d surface plot of COP versus IC and IH for the two-stage system described
in this section. 17
Fig. 7 Theoretically calculated TC as a function of input power for TH = 37°C
and Qgen = 4W. 18
Fig. 8 .Diagram showing how an active water cooled heat sink is used to control the
temperature of the hot side of the TEC. 19
Fig. 9 Diagram showing equipment used to monitor energy usage by different
air conditioning units. 21
Fig. 10 (a) Diagram of the single-stage, quad-module thermoelectric cooling system,
(b) diagram of the two-stage cascaded thermoelectric system, and (c) photograph
of fully assembled cascaded thermoelectric cooling unit used in this project. 22
Fig. 11 Energy consumed as a function of time by the vapor compression air conditioner
over a 20 minute duration for three different T settings, each with a heat
load of 24W. 24
Fig. 12 Temperature inside home as a function of time for the vapor compression
air conditioner for different T values. 24
Fig. 13 Summary of energy used over one hour by the vapor compression system as a
function of indoor temperature setting. 25

6
Fig. 14 Energy consumed as a function of time by the single-stage, single-module,
thermoelectric air conditioner over a 20 minute duration for three different T
settings, each with a heat load of 24W. 26
Fig. 15 Temperature inside home as a function of time for the single-stage, single-module,
thermoelectric air conditioner over a 20 minute duration for different T settings. 26
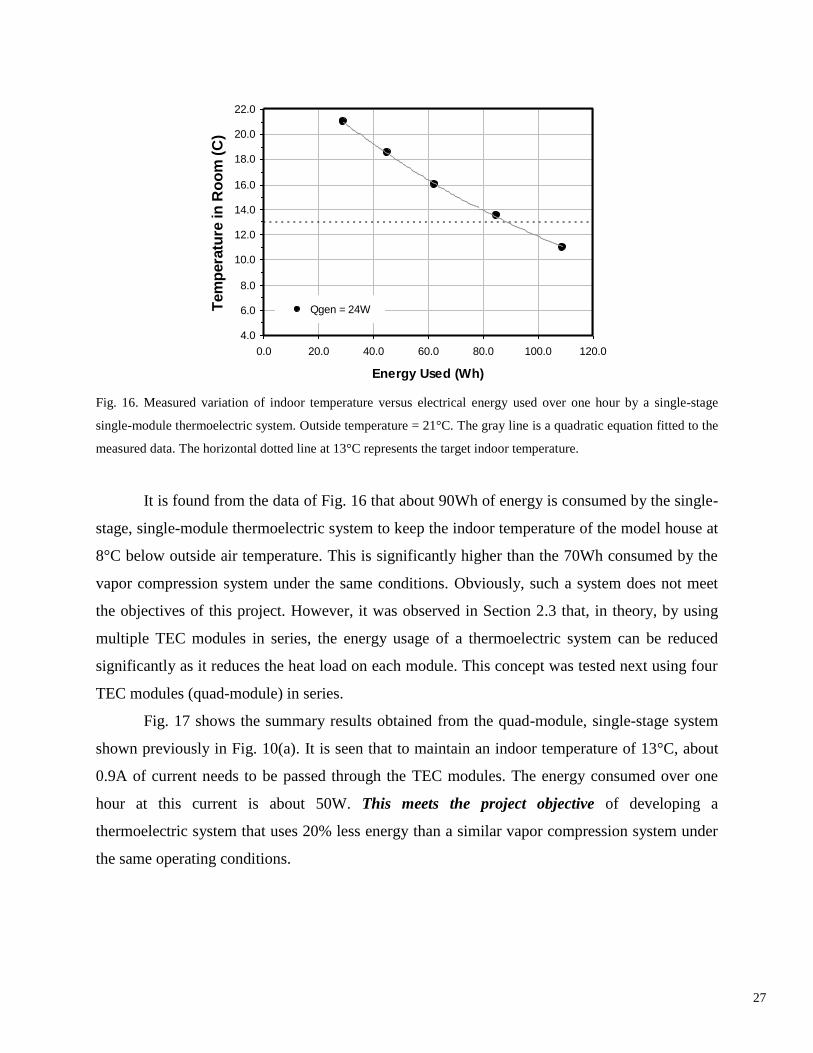
Fig. 16 Measured variation of indoor temperature versus electrical energy used over one
hour by a single-stage single-module thermoelectric system. 27
Fig. 17 Measured variation of indoor temperature (blue) and energy consumed in one
hour versus electrical current input for a single-stage quad-module thermoelectric
system. 28
Fig. 18 Measured variation of indoor temperature versus (a) electrical current IH, and
(b) versus hourly energy use for a dual-stage cascaded thermoelectric system. 29
Fig. 19 Comparison of energy usage of vapor compression and thermoelectric air
conditioning systems as a function of T with a heat load of 24W. 30
Fig. 20 Dependence of purchase price of vapor compression air conditioners on
cooling power found from a market survey (dots). Dashed line represents
estimated dependence of cost per cooling watt for TEC systems based on
current market prices. 31

7
1. Introduction
From an environmental sustainability viewpoint it has become critical that global energy use be
brought under control. One of the largest sources of energy consumption is air conditioning
systems. According to the American Council for an Energy-Efficient Economy, home air
conditioning consumes 5% of the total electricity produced in the US [1, 2]. Energy use from
residential air conditioning is also increasing rapidly in Brazil, China, and India as their
economies expand. Reducing this energy usage will not only provide economic relief to residents
but, on a larger scale, it will help protect our environment by lowering pollution from fossil fuel
based power plants. Further, the refrigerants used in today's air conditioners are
hydrochlorofluorocarbons (HCFCs) which are known to be harmful to the environment.
Therefore, it is worth investigating alternative energy efficient and eco-friendly ways of heat
pumping.
One possibility is the use of the thermoelectric effect. Thermoelectric cooling modules
(TECs) pump heat from a high temperature region to a low temperature region by passing an
electric current through a thermoelectric material. Since this does not require compressors or
refrigerants, and since its cooling power can be electrically controlled, it may be possible to
develop thermoelectric air conditioners without the drawbacks of traditional vapor compression
units. Thermoelectric systems may be most suitable as small room air conditioners that are
popular in Asia, Europe, and South America.
In this project, a thermoelectric based room air conditioning system is developed. Since
the practical use of such a system will depend entirely on how well it compares against a vapor
compression air conditioner, this aspect will be the main theme of this project. The basis for
comparing a thermoelectric and a vapor compression system will be the energy consumed by
each system operating under identical environmental conditions. Energy consumption of an air
conditioning system is normally stated in terms of its Coefficient of Performance (COP) which is
defined as the ratio of the amount of heat energy pumped by the system to the amount of electric
energy required to do so. The higher the COP of a system, the lower its energy consumption
under constant heat loads.
UsedyElectricit
PumpedHeatCOP
_
_ . (1)

8
1.1 Problem Statement
The question addressed in this project can be stated quantitatively as follows.
Is it possible to demonstrate a thermoelectric air conditioning system, using
commercially available parts, that consumes 20% less energy when compared to a
similarly sized conventional vapor compression air conditioning system while
maintaining a scaled model home at 8°C below outside air temperature, with an
internal heat load of 150 W/m2?
The choice of an 8°C temperature difference is explained as follows. The industry standard
conditions for stating the COP or energy efficiency ratings (EER) of air conditioners require an
indoor temperature of 80°F (27°C) and outside temperature of 95°F (35°C), which is a difference
of about 8°C. Regarding the target of 20% reduction in energy use, it is noted that if air
conditioners would consume about 30% less energy than they do today, it would become
practical to operate them off solar panels, a green source of energy [3]. If the objective of this
project can be met, then the results could be a useful step towards controlling and sustaining the
rapid growth in worldwide energy usage. Lastly, regarding the use of 150 W/m2 as internal heat
load, the reasons for this are explained in Section 2.4.
1.2 Fundamentals of Solid State Thermoelectric Cooling
Thermoelectric cooling is based on the Peltier effect. This effect, discovered by Jean-Charles
Peltier in 1834, states that when an electric current is driven through a junction between two
different conductors heat is absorbed or generated, depending on the direction of current flow.
The amount of heat transferred depends on the materials used to form the junction [4, 5].
Extensive research has been conducted in the last few decades to develop materials that exhibit
thermoelectric properties strong enough to be of practical value [6]. Today's commercially
available thermoelectric modules use tightly arranged pellets of bismuth telluride, and are
capable of pumping almost 10 watts/cm2. Fig. 1 shows a simplified diagram of such a TEC
module. The figure on the left, Fig. 1(a), represents a thermoelectric single junction and shows
the flow of electric current and heat. The figure on the right, Fig. 1(b), shows how several of
these thermoelectric junctions are assembled to make a TEC module.

9
Conductor
Semiconductor
pelletp n
Heat sink
HEAT
HEAT
(a)
(b)
Fig. 1. Simplified diagram of a TEC showing (a) a single junction and (b) an assembled view of a TEC module.
The Coefficient of Performance (COP) of TEC modules depends on a "figure of merit" of
the thermoelectric material used. This figure is denoted as ZT and is given as [6]:
K
TSZT
2 , (2)
where is the electrical conductivity of the thermoelectric material, S is its Seebeck coefficient,
is its thermal conductivity, and T is the average temperature of the TEC. For commonly used
bismuth antimony telluride alloys the highest ZT is about 1. New superlattice materials can have

10
ZTs as high as 3.5 but these are not commercially available [7]. The dependence of maximum
achievable COP of a TEC module on ZT is given by [8]:
11
1
maxZT
TT
ZT
TT
TCOP C
H
CH
C , (3)
where TH is the hot side temperature and TC is the cold side temperature in Kelvin (degrees
Celcius + 273). Using equation (3) it is found that for a hot side temperature of 37°C (outside
temperature) and a cold side temperature of 27°C (temperature in home) a maximum COP of
about 5 is possible with bismuth telluride TECs (ZT = 1). In comparison, vapor compression air
conditioners have COPs between 2 and 3. This may suggest that TEC based air conditioners will
almost always consume less energy than vapor compression systems. Unfortunately, there are
additional considerations that pose significant challenges when using TEC based systems.
Fig. 2 shows a plot of COP as a function of the high side temperature TH of a TEC
module, obtained using equation (3). The low side temperature TC is assumed to be 27°C and ZT
is assumed to be 1. It can be seen that the COP drops very quickly as TH increases. For TH larger
than about 45°C the COP drops below 2, the COP of many vapor compression systems of good
quality. In theory, TH of a TEC based air conditioner can be as low as the outside air temperature.
In reality, though, it could be several degrees higher. This is because TH is determined by how
effectively the heat being pumped by the TEC, plus the heat it generates internally, can be
carried away from its hot side. If the heat energy accumulates on the hot side of the TEC, TH will
continue to increase and, as a result, its COP will drop. An effective heat sink is therefore critical
to the success of a TEC based cooling system. Similarly, due to inefficiencies in heat transfer, TC
needs to be a few degrees lower than the desired room temperature. This also leads to lower
COP. Finally, the promisingly high COP values calculated from (3) occur at very low cooling
powers, meaning a large number of TECs will be required to attain reasonable cooling.

11
0
1
2
3
4
5
6
7
8
9
10
30 32.5 35 37.5 40 42.5 45 47.5 50
TEC Hot Side Temperature, TH (C)
CO
P
Fig. 2. Theoretical dependence of optimum COP of a TEC module on its hot side temperature. The red dots are
COPs reported by the US Department of Energy from tests on a high quality Mitsubishi vapor compression air
conditioning system (model FE12NA). Both data sets are at cold side temperature of 27°C [9].
For purposes of comparison, the measured variation of COP with TH of a very high
quality Mitsubishi vapor compression system is also shown in Fig. 2 (red dots). In theory, from
Fig. 2 it can be assumed that it is feasible to design a thermoelectric air conditioning system that
will outperform typical vapor compression systems of similar size on the basis of COP.
1.3 Review of Prior Work
Since Goldsmid first demonstrated in 1954 the possibility of producing large Ts using
semiconductor thermoelectrics like bismuth telluride, there have been many attempts at
developing a commercial thermoelectric unit [10]. Unfortunately these systems were not
commercially successful because they consumed large amounts of energy. The general opinion
appears to be that until thermoelectric materials with high ZT can be developed, vapor
compression systems will be more energy efficient and practical. However, it is also recognized
that thermoelectric cooling is likely to be effective (i) under relatively low heat loads, (ii) where
the heat load shows large variation, and (iii) where large temperature differences are not required
[11]. Since room air conditioning satisfies these conditions there is reason to continue to pursue
the development of a thermoelectric system for such use.
A review of technical literature revealed only one prior technical report on thermoelectric
air conditioning where the installation of a TEC based air conditioner in a studio size room with

12
a heat load of 960 watts is described [12]. A total of 48 TEC modules were required. However,
no quantitative comparison with traditional vapor compression systems is provided.
A major aspect of this work involves the use of two-stage cascaded thermoelectric
modules. Cascaded thermoelectric cooling systems have been studied in the past, but all of the
existing literature is theoretical with almost no experimental confirmation of results [13, 14]. In
addition, the majority of existing work on cascaded thermoelectric cooling systems is centered
on optimizing the geometry ratio of the different stages of the structure. In this project, for the
first time, a method for optimization of the currents in each layer of a two-stage cascaded
thermoelectric cooling system is developed theoretically and confirmed experimentally.
2. Theory
2.1 Single Stage Thermoelectric Cooling
The cooling power at the cold end of a single stage thermoelectric cooling module is given by
[10]:
L
ATK
A
LISITNQ Cp
2
2
12 , (4)
where N is the number of thermoelectric junction pairs, S is the Seebeck coefficient of the
thermoelectric material, I is the current through the thermoelectric module, TC is the cold side
temperature, is the resistivity of the thermoelectric material, A is the cross-sectional area of
each thermoelectric pellet, K is the thermal conductivity of the thermoelectric material, and T is
the temperature difference between the hot and cold sides of the TEC. The first term inside
braces is the heat removed by the Peltier effect. The second and third terms represent,
respectively, the heat injected into the cold side due to the electrical resistance of the TEC and
heat conduction through the TEC from the hot side. These two latter effects tend to reduce the
cooling power of the TEC.
Under steady temperature conditions the above cooling power is balanced by the heat
load, which consists of any internal sources of heat in the room being cooled, plus conduction of
heat through the walls and ceiling of the room. This can be expressed as:
TKQQ Wgenload , (5)

13
where Qgen represents heat generated by any internal or external heat sources such as appliances
or sunlight coming in through windows. KW is the effective thermal conductivity of the walls and
ceiling of the room.
From equations (4) and (5) the temperature in the room being cooled can be solved as:
)}/(2{2
)}/(2{)/( 2
LANKKNSI
TLANKKIALNQT
W
HWgen
C
. (6)
The total rate of energy consumption by the TEC (QTE) is the sum of Qp and the rate at
which heat is generated within the TEC due to its electrical resistance. It is given by [10]:
TSI
A
LINQTE
22 . (7)
Lastly, the COP is given by the ratio of Qp/QTE. Using equations (4) and (7) the COP is
expressed as follows:
A
LITSI
L
ATK
A
LISIT
COPC
2
2
2
1
. (8)
Fig. 3 shows plots of TC, Qp, and COP as a function of current I, as computed from the
equations above. The following values, which are typical of commercially available TECs, were
used for the various quantities in the equations: S = 2x10⁻⁴
V/K, K = 3 W/mK, N = 127, =
2.5x10⁻⁴
ohm-cm. TH was taken to be 37°C (i.e. 310K) and a 4W internal heat source was
assumed.
It can be seen that the temperature in the room decreases with I and reaches a minimum
value at about I = 6.5 amps. At this current the cooling power of the system reaches its maximum
value of about 20W. If I increases beyond this value the temperature rises as the TEC begins to
lose its ability to pump heat due to increasing resistive heating. The COP is also a function of I,
decreasing rapidly with increasing I. Therefore, from this theory, it is found that in order to
maximize the efficiency of a thermoelectric air conditioner it should be operated at as low a
current as possible. In other words, a high efficiency thermoelectric air conditioner should be
designed to achieve a maximum cooling power much larger than the maximum heat load it is
expected to handle. In the example shown here, in order to maintain an indoor temperature of
27°C (i.e. T = 10°C), a current of 1.3A is needed. At this current, the system's cooling power is

14
about 2W, which is roughly one tenth of its maximum possible value. The associated COP is
about 2.
0
2
4
6
8
0
5
10
15
20
25
30
35
40
45
0 2 4 6 8 10 12
CO
P
Ro
om
Tem
pe
ratu
re, T
c (
C)
&C
oo
lin
g P
ow
er,
Qp
(W
)
Current, I (Amp)
Qp
Tc
COP
Fig. 3. Theoretically calculated plots of indoor temperature (blue line), cooling power (grey, dashed), and COP
(black) as a function of current passed through a single-stage thermoelectric air conditioning system. An indoor heat
load of 4W and an outdoor temperature of 37°C are assumed.
2.2 Two-stage Cascaded Thermoelectric Cooling
In this section a two-stage thermoelectric cooling system is analyzed, and it is shown that such a
system can, when operated optimally, can have a much higher COP than a single stage unit. Fig.
4 shows a diagram of a two stage cascaded thermoelectric cooling module. In this section the
theoretical behavior of such a module is described.
ICIH
TCQgen
QwallTH
Fig. 4 Diagram showing a two-stage thermoelectric cooling system.
The expressions for the various heat flow rates for the structure shown in Fig. 4 are as
follows. Qpc is the heat pumped by the cold side of the upper TEC, Qrc is the heat exiting the

15
bottom surface of the upper TEC, Qph is the heat pumped by the lower TEC, and Qrh is the heat
exiting the bottom surface of the lower TEC.
CMCCCpc TT
L
KA
A
LITSINQ (
2
12 2 , (9)
CMCMCrc TT
L
KA
A
LITSINQ (
2
12 2 , (10)
MHHMHph TT
L
KA
A
LITSIMQ (
2
12 2
, (11)
MHHHHrh TT
L
KA
A
LITSIMQ (
2
12 2
, (12)
where N is the number of thermoelectric pairs in the upper TEC, M is the number of pairs in the
lower TEC, TM is the temperature at the boundary between the upper and lower TECs, IC is the
current through the upper TEC, and IH is the current through the lower TEC. Other symbols have
the same meanings as described in the previous section. By equating Qrc to Qph it is possible to
solve for TM. The result is:
NML
KANIMIS
NTMTL
KA
A
LNI
A
LMI
T
CH
CHCH
M
22
222
. (13)
This expression for TM can be substituted in equation (9) resulting in the following expression for
Qpc:
))(/(22
/422
222
2
NMLKANIMIS
NTMTLKANNIMINKRI
A
LNTNIQ
CH
CHCH
CCCpc
. (14)
Then, by equating this expression for Qph to Qload (equation 5), TC can be solved for. The result
is:
WC
genHWHCHC
CKLKANDKNSNI
QTKDTLKAMNDNIMINKRIA
LN
T
/2/42
//4/2
22
2222
. (15)
Once TC and TM are found, Qpc and Qrh can be evaluated using equations (9) and (12). Finally the
COP of this two-stage cascaded system can be found from:
pcrh
pc
QCOP
. (16)

16
Fig. 5 shows a 3-d surface and a contour plot of TC as a function of the currents IC and IH
as computed from equation (15). The numerical values of the various quantities were the same as
in the previous section.
0.2
5
1.5
2.7
5
4
5.2
5
6.5
7.7
5
90.0
5.0
10.0
15.0
20.0
25.0
30.0
35.0
40.0
45.0
50.0
0.251.5
2.754
5.256.5 Ic (A)
Tc
Ih (A)
(a) 0
.25
1.5
2.7
54
5.2
56
.57
.75
9
0.25 1.25 2.25 3.25 4.25 5.25 6.25
Ih (
A)
Ic (A)
40.0-50.0
30.0-40.0
20.0-30.0
10.0-20.0
0.0-10.0
(b)
Fig. 5. Theoretically calculated variation of cold side temperature TC with currents in the upper and lower TECs. (a)
is a 3-d surface plot and (b) is a contour plot of the data. Outside air temperature of 37°C and a 4W internal heat
source are assumed.

17
As with the single stage case, TC drops as IC and IH increase, reaching a minimum point,
beyond which it begins to increase as resistive heat from the TEC begin to dominate. However,
what is more interesting is that there are now multiple combinations of IC and IH that can result in
the same TC. For example, the blue band on the contour plot of Fig. 5(b) contains all possible
combinations of IC and IH that will result in TC between 20°C and 30°C. It is possible that
amongst all of these possible combinations, some pairs of IC and IH values will result in
significantly higher COP than a single stage system. Fig. 6 shows a 3-d surface plot of the
corresponding COP values as a function of currents IC and IH. As for the single-stage system,
COP drops rapidly with increasing values of current.
A more detailed analysis of COP done using the solver function in Excel shows that
setting IC = 0.92 A and IH = 0.78 A results in the highest COP of 3.72 while maintaining the
internal temperature at 27°C, i.e. 10°C below outside air temperature. This value is considerably
larger than the COP of about 2 that was obtained for a single-stage system under the same
conditions. It should be noted that by optimizing the currents such a thermoelectric air
conditioning system can be operated with its COP constantly maximized, even under varying
values of heat load, TH and TC. Such a control mechanism that adapts with changing thermal
conditions is very complex to implement in vapor compression systems.
0.2
5
0.5
0.7
5
1
1.2
5
1.5
1.7
5
2
0.0
2.0
4.0
6.0
8.0
10.0
12.0
14.0
16.0
18.0
20.0
0.250.5
0.751
1.251.5
1.75
Ic (A)
CO
P
Ih (A)
18.0-20.0
16.0-18.0
14.0-16.0
12.0-14.0
10.0-12.0
8.0-10.0
6.0-8.0
4.0-6.0
2.0-4.0
0.0-2.0
Fig. 6. 3-d surface plot of COP versus IC and IH for the two-stage system described in this section.

18
2.3 Design Innovations Based on Theoretical Analysis
In this section the main takeaways from the theoretical analysis presented above are summarized.
First, it is noted that the electrical power consumed by a thermoelectric cooling system to
maintain a constant temperature difference, T, is strongly dependent on the heat load, Qload.
With decreasing Qload, the power consumption decreases. In reality, the heat load itself cannot be
controlled, but one way to reduce the effective heat load on each TEC module is to use multiple
modules operating simultaneously. Since each module pumps a fraction of the total heat load, the
overall power consumption, and hence the efficiency of the system, is improved, compared to
having a single module handle the total heat load. Fig. 7 illustrates this "divide and conquer"
approach. In this figure the theoretically calculated variation of TC for with input power is plotted
for the single-stage system described in Section 2.1. TH = 37°C and Qgen = 4W are used as
before. Results from two cases are shown, one for a single TEC module and a second with four
modules connected in series. It is seen that for any value of TC the 4-module system requires
much less input power, i.e. has a much higher COP.
0
5
10
15
20
25
30
35
40
0 10 20 30 40 50
Input Power, Pin (W)
Ro
om
Tem
pera
ture
, T
c (
C) 1 TEC Module
4 TEC Modules
Fig. 7. Theoretically calculated TC as a function of input power for TH = 37C and Qgen = 4W.
A second technique to improve the effective COP of a thermoelectric cooling system is
based on that fact that for a given heat load and cold side temperature, its energy consumption
depends on the temperature of it hot side. Using a water-cooled active heat sink it should be
possible to lower the hot side temperature of the TEC module, thus reducing its energy
consumption. Existing thermoelectric cooling units typically use passive heat sinks such as large

19
metal fins with or without a fan attached to them. These approaches are not very effective in
conducting away all the heat pumped by the TEC from its hot surface. Fig. 8 shows the approach
that is used in this project. It consists of placing a metal block with an inlet and an outlet for
water, between the TEC and a finned metal heat sink. The detailed theory of heat conduction by
water cooled heat sinks is complicated and not covered in this study. However, it is known that
water cooled heat sinks can be ten times more effective than air cooled ones [11].
Water in
Water out
Water cooled
heat sink
TEC
Fan
Hot side
Metal fin passive
heak sink
Water in
Water out
Water cooled
heat sink
TEC
Fan
Hot side
Metal fin passive
heak sink
Fig. 8. Diagram showing how an active water cooled heat sink is used to control the temperature of the hot side of
the TEC.
The third technique to improve the effective COP of a thermoelectric cooling system is to
use TEC modules in cascade. As shown in Section 2.2, such a system has, in theory, a much
higher COP than a single-stage system.
2.4 Theoretical Calculations and Hypothesis
In this section a hypothesis is developed from theory for the objective of this project. Typically
15% of a home's floor area is covered with windows. Normal solar intensity can be taken to be
1000 W/m2. Therefore, the peak total solar power expected to enter through windows of a typical
home is 150 W/m2 of floor area. The model home used in this study has a floor area of 40 x 40
cm2. Thus, the solar heat load on such a home can be estimated to be 24W. In order to maintain a
steady temperature inside the home the air conditioner will have to pump out a total of 24 watts.
This assumes that all of the solar energy entering the room is trapped inside the room.
In order to come up with a reasonable hypothesis regarding the project objective that the
TEC system must have a COP that is 20% higher than that of a similar vapor compression unit,
some additional assumptions are needed. A COP of 2 is assumed for a vapor compression air
conditioner. This is typical of small commercially available units. The TEC system must then

20
have a COP of 2.4 or higher. The equations of Section 2 were set up in an Excel calculator to
help design the kind of thermoelectric cooling system that will be required to pump out 24 watts
and the associated COP. It was found that for a single-stage design with one TEC module, it
would require 15W of input power to attain a T of 8°C. This implies a COP of 1.6 which does
not meet the objective. Next, with a single-stage system consisting of 4 serially connected TEC
modules it was found that 8W would be required to attain a T of 8°C, resulting in a COP of 3,
which meets the project objective. Lastly, using a two-stage system, the theoretical calculations
showed that under optimum current combinations, about 4W of input power would be needed to
attain a T of 8°C, which implies a COP of 6. Therefore, based on the theoretical calculations it
is hypothesized that the project objective can be met by using a two-stage design, if it is ensured
that the TEC's hot side temperature is equal to the outside air temperature. It is noted that the
energy consumed by the pump used in the water cooled heat sink is not considered in these
calculations because it expected to be operated on solar power.
3. Experimental Setup and Procedures
3.1 Variables
The independent variables of this project are the type of air conditioning system used,
(thermoelectric / vapor compression). For the thermoelectric system, the number of modules and
number of stages are also independent variables. The dependent variable is the energy consumed
by each type of air conditioning system under identical heat load conditions. The heat load, the
difference maintained by air conditioners between room and outside air temperature, and the
volume of space being cooled are kept constant, i.e. these are the control variables.
3.2 Apparatus Used
A scale model home with outside dimensions of 60cm x 60cm x 60cm is constructed out of foam
board. 10 cm thick insulation is placed on the inside of its walls, floor, and ceiling. A bank of
resistors with an equivalent resistance of 80 ohms is placed in the center of the model home and
connected to a variable ac power source (variac) to act as the heat load. It is assumed that the
electric power consumed by the resistors is equal to the heat load. The heat load can be changed

21
by changing the variac output voltage. For example, when the variac is set to supply 44 volts, a
power output of 24.2 watts results from the resistors. The exact relation between the heat load
and variac output voltage is given as
80
2
acheat
VQ (17)
where Vac is the variac output voltage. Electronic thermometers are placed both inside and
outside the house. The house is fitted with the thermoelectric cooling unit on one side, and with a
small vapor compression unit on the opposite side. Temperatures inside and outside the house, as
well as the energy consumed by the air conditioners are measured and logged electronically. A
Velleman PCS-10 logger is used for recording the temperatures and a "Watts Up Pro" unit is
used for recording the electric energy used by vapor compression unit. The thermoelectric
system is driven by adjustable DC power supplies and its energy usage is found by monitoring
the voltage and current supplied by the power supplies. Fig. 9 shows a diagram of the setup with
the connections for the thermometers, thermostat, and data loggers.
To control the vapor compression unit, a programmable thermostat is used. The
temperatures sensed inside and outside the house are inputted to the thermostat, which turns off
the system when the inside temperature drops to a preset value below the outside temperature.
For the thermoelectric unit, the input electrical power is adjusted manually till the desired room
temperature is attained.
Insulated
walls, roof,
and floor
Thermometer
(outside air)
AC (VC)
Thermometer
(inside air)
Data logger (temperature) Thermostat Data logger (energy)
AC (TE)
Heate
r
VVariac
Insulated
walls, roof,
and floor
Thermometer
(outside air)
AC (VC)
Thermometer
(inside air)
Data logger (temperature) Thermostat Data logger (energy)
AC (TE)
Heate
r
VVVVariac
Fig. 9. Diagram showing equipment used to monitor energy usage by different air conditioning units.

22
Details of the thermoelectric cooling unit are shown in Fig. 10. Fig. 10(a) is a diagram of
the single stage design. Four model TEC modules, each rated at 72 watts maximum cooling
power, are connected in series as shown. They are placed on a water cooled heat sink and held in
place by two 1/8 inch thick aluminum plates. Nylon sleeves and washers are used with the
clamping screws to ensure that the top and bottom plates are thermally insulated from each other.
A fan is attached to the top plate to help circulate cold air (not shown in the diagram to keep
clarity). Fig. 10(b) is shows the design of the two-stage cascaded thermoelectric unit. A fifth
TEC module is used here. It is placed on top of the upper aluminum plate and held in place by
the fan. Fig. 10(c) shows a photograph of the final assembled unit.
Top Al plate
Active heat sink
TEC module
Clamping screw
Bottom Al plate
(a)
2nd stage
TEC module
(b) (c)
Fig. 10. (a) Diagram of the single-stage, quad-module thermoelectric cooling system, (b) diagram of the two-stage
cascaded thermoelectric system, and (c) photograph of fully assembled cascaded thermoelectric cooling unit used in
this project.

23
3.3 Measurement Procedures
The heating resistors and air conditioning unit are turned on and the outside and inside
temperatures are monitored till they become stable. After that the data loggers are turned on and
temperature and energy usage are logged for a period of 20 minutes. After twenty minutes the
data from the loggers are transferred to a computer and saved for analysis later.
4. Experimental Results
4.1 Energy Consumption of Vapor Compression System
In this set of measurements, the amount of energy consumed by a traditional vapor compression
air conditioner to cool the scale model home described previously is measured under different
T. Although the project objectives are for T = 8°C, measurements are done for several T
values to get a more complete picture of the performance of the system around the target
operating conditions.
Fig. 11 shows the power and energy consumed over time by the vapor compression
system under a 24W internal heat load while maintaining an average T of 10°C, 5.9°C, and
0.7°C. The step-like shape seen in the graph of energy versus time is because the air-conditioner
turns off when the home has cooled to the desired temperature and turns back on when the
temperature rises above the set point temperature. Whenever the air conditioner is off, energy
consumption also stops increasing, resulting in the flat portions of the "steps" in Fig. 11.
Fig. 12 shows the temperature variation inside the home as a function of time under the
same conditions as described above. It is seen that the temperature varies above and below some
average value as the thermostat turns the system on and off. The T values used here are based
on the difference between the outside temperature and the average inside temperature over the 20
minute measurement duration (which is the reason why they are somewhat irregular).

24
0
5
10
15
20
25
30
0 2 4 6 8 10 12 14 16 18 20
time (min)
En
erg
y U
sed
(W
h)
DT = 0.7C
DT = 5.9C
DT = 10C
Fig. 11. Energy consumed as a function of time by the vapor compression air conditioner over a 20 minute duration
for three different T settings, each with a heat load of 24W.
8.0
13.0
18.0
23.0
0 2 4 6 8 10 12 14 16 18 20
Time (min)
Tem
pera
ture
(C
)
DT = 0.7C
DT = 5.9C
DT = 10C
Fig. 12. Temperature inside home as a function of time for the vapor compression air conditioner for different T
values.
Fig. 13 is a graph that shows a summary of results from all experiments of this set. The
graph shows electric energy used as a function of indoor temperature for an internal heat load of
24W and an outdoor temperature of 21°C. For convenience, the results obtained from the 20
minute measurements are multiplied by 3 and presented as energy consumed in an hour. The
gray line denotes the best linear fitting to the measured data. As expected, the energy consumed
by the system decreases as T decreases. For an indoor temperature of 13°C, corresponding to a
T of 8°C as required by the project objective, the vapor compression system consumes 70Wh of
energy in one hour.

25
0.0
10.0
20.0
30.0
40.0
50.0
60.0
70.0
80.0
90.0
100.0
4 6 8 10 12 14 16 18 20 22
Temperature in Room (C)
En
erg
y U
sed
in
On
e H
ou
r (W
h)
Qgen = 24W
Fig. 13. Summary of energy used over one hour by the vapor compression system as a function of indoor
temperature setting. Outside temperature = 21°C. The gray line is a linear equation fitted to the measured data. The
vertical dotted line is at 13°C which is the target indoor temperature for energy usage comparison.
4.2 Energy Consumption of Single Stage Thermoelectric Systems
In this set of measurements the energy consumed by single stage thermoelectric air conditioners
to cool the scale model home is measured. As with the vapor compression system, measurements
are done at several indoor temperatures and each measurement is done over a 20 minute time
span. The energy consumed during this period is multiplied by three to estimate the hourly
energy usage of the system.
Fig. 14 shows the energy consumed over time by a single-stage, single-module
thermoelectric system under a 24W internal heat load while maintaining a T of about 10°C,
5°C, and 0°C. Unlike in the vapor compression system an on-off type thermostat is not used in
this case. The current through the system is adjusted till the desired temperature is reached inside
the home. Once the desired temperature is achieved the system runs on its own while the
temperatures and power consumption information are logged. Unlike in the vapor compression
system, the graph of energy versus time is smooth, i.e. not step-like. Fig. 15 shows the
temperature variation inside the home when cooled by a thermoelectric system.
Fig. 16 is a graphical summary of results from all experiments on a single-stage single-
module system. The graph shows measured indoor temperature as a function energy input.
Outdoor temperature is kept constant at 21°C and internal heat load is 24W. The gray lines

26
denote the best linear fitting to the measured data. As expected, as the energy input into the
system increases, the indoor temperature decreases. In theory, the inside temperature should
increase if input power is increased beyond a point, but the system was not pushed to that limit.
[Note: Results from thermoelectric air conditioning systems are plotted differently than those
from vapor compression system because of the difference in how the two systems are controlled.
While in the vapor compression system the desired indoor temperature is set on the thermostat
and the energy usage is observed, in the thermoelectric systems the input current, which is
equivalent to the input power, is set to a certain value and the resulting indoor temperature is
observed. Thus it is more convenient to plot the input power on the x-axes when dealing with
thermoelectric systems.]
0
5
10
15
20
25
30
35
40
0 2 4 6 8 10 12 14 16 18 20
Time (min)
En
erg
y U
sed
(W
h)
DT = 5C
DT = 10C
DT = 0C
Fig. 14. Energy consumed as a function of time by the single-stage, single-module, thermoelectric air conditioner
over a 20 minute duration for three different T settings, each with a heat load of 24W.
8.0
13.0
18.0
23.0
0 2 4 6 8 10 12 14 16 18 20
Time (min)
Tem
pera
ture
(C
)
DT = 5C
DT = 10C
DT = 0C
Fig. 15. Temperature inside home as a function of time for the single-stage, single-module, thermoelectric air
conditioner over a 20 minute duration for different T settings.
27
4.0
6.0
8.0
10.0
12.0
14.0
16.0
18.0
20.0
22.0
0.0 20.0 40.0 60.0 80.0 100.0 120.0
Energy Used (Wh)
Tem
pera
ture
in
Ro
om
(C
)
Qgen = 24W
Fig. 16. Measured variation of indoor temperature versus electrical energy used over one hour by a single-stage
single-module thermoelectric system. Outside temperature = 21°C. The gray line is a quadratic equation fitted to the
measured data. The horizontal dotted line at 13°C represents the target indoor temperature.
It is found from the data of Fig. 16 that about 90Wh of energy is consumed by the single-
stage, single-module thermoelectric system to keep the indoor temperature of the model house at
8°C below outside air temperature. This is significantly higher than the 70Wh consumed by the
vapor compression system under the same conditions. Obviously, such a system does not meet
the objectives of this project. However, it was observed in Section 2.3 that, in theory, by using
multiple TEC modules in series, the energy usage of a thermoelectric system can be reduced
significantly as it reduces the heat load on each module. This concept was tested next using four
TEC modules (quad-module) in series.
Fig. 17 shows the summary results obtained from the quad-module, single-stage system
shown previously in Fig. 10(a). It is seen that to maintain an indoor temperature of 13°C, about
0.9A of current needs to be passed through the TEC modules. The energy consumed over one
hour at this current is about 50W. This meets the project objective of developing a
thermoelectric system that uses 20% less energy than a similar vapor compression system under
the same operating conditions.

28
4
6
8
10
12
14
16
18
20
22
0 0.2 0.4 0.6 0.8 1 1.2 1.4
Current, I (A)
Tem
pera
ture
in
Ro
om
(C
)
0
10
20
30
40
50
60
70
80
90
En
erg
y U
sed
(W
h)
Temp in Room
Energy Used
Fig. 17. Measured variation of indoor temperature (blue) and energy consumed in one hour (red) versus electrical
current input for a single-stage quad-module thermoelectric system. Outside temperature = 21°C. The horizontal
dotted line at 13°C represents the target indoor temperature.
4.3 Energy Consumption of Two-Stage Cascaded Thermoelectric Systems
Although the project objective was met with a single-stage, quad-module thermoelectric system,
additional experiments were done using a dual-stage cascaded system to confirm if additional
gains in efficiency would be possible as indicated by theory. The system shown earlier in Fig.
10(b) and 10(c) was assembled and tested under identical conditions of 21°C outside temperature
and 24W heat load.
Fig. 18(a) shows plots of indoor temperature as a function of current IH in the lower layer
of the cascaded arrangement for several values of current IC in the upper layer (IH and IC refer to
the currents shown earlier in Fig. 4). As expected from theory, the plots have a parabolic shape;
once the current exceeds a critical value, the room temperature begins to rise due in increased
resistive losses in the TEC. But, more importantly, it can be seen by following the dotted line
that the target temperature of 13°C can be obtained by several possible combinations of IC and
IH.
Fig. 18(b) shows the associated temperature versus energy consumption data. The shapes
of the plots are as expected, and, again, it is seen that the target temperature can be attained by
multiple combinations of IC and IH. From the available data, the minimum energy required to
obtain the target 13C inside temperature is at IC = 0.5A and IH = 0.8A. At these currents the

29
hourly energy used is about 40Wh. This represents a 40% lower energy usage than the vapor
compression system.
4
6
8
10
12
14
16
18
20
22
0 0.5 1 1.5 2 2.5
Current Ih (A)
Tem
pera
ture
in
Ro
om
, T
c (
C)
Ic = 0.25A
Ic = 0.5A
Ic = 1A
Ic = 2A
(a)
4
6
8
10
12
14
16
18
20
22
0 40 80 120 160 200 240 280 320 360
Energy Used (Wh)
Tem
pera
ture
in
Ro
om
, T
c (
C)
Ic = 0.25A
Ic = 0.5A
Ic = 1A
Ic = 2A
(b)
Fig. 18. Measured variation of indoor temperature versus (a) electrical current IH, and (b) versus hourly energy use
for a dual-stage cascaded thermoelectric system. Outside temperature = 21°C. The horizontal dotted line at 13°C
represents the target indoor temperature.
5. Discussion
It was seen in the previous section that a dual-stage cascaded thermoelectric air conditioning
system can be significantly more energy efficient than a similarly sized vapor compression

30
system. The experimentally observed behaviors showed trends similar to what was predicted by
theory, but a closer comparison would be useful in validating the results.
Fig. 19 is a comparison of theoretical and experimentally measured values of indoor
temperature as a function of energy input for the dual-stage thermoelectric system. The
experimental data are the same as shown in Fig. 18 and the theoretical data is obtained from the
equations of section 2.2 with the same inputs as used in the experiments. It can be seen that
although there is reasonable similarity in trends between experiment and theory, there is a large
difference between the numerical values. Two main reasons for this are (a) while the theory is
based on 1-d cascade structure and heat flow, in reality it is a 3-d effect, and (b) while the theory
assumed that the TEC cold side is at the same temperature as the indoor air, in reality the air
temperature is likely to be significantly higher.
0
5
10
15
20
25
0 25 50 75 100 125 150
Energy Used (Wh)
Tem
pera
ture
in
Ro
om
(C
) Theory (Ic = 0.5A)
Expt (Ic = 0.5A)
Theory Ic = 1A
Expt Ic = 1A
Fig. 19. Comparison of energy usage of vapor compression and thermoelectric air conditioning systems as a
function of T with a heat load of 24W.
6. System Cost Comparisons
In real-world use, cost is a very important factor. Even though it is found that thermoelectric air
conditioners used with IR filtering and active heat sinks can be made to consume less energy and
are therefore less expensive to operate, if the cost of purchasing and installing such a system is
high then it is unlikely to be accepted widely.
Table 2 is a summary of the costs involved in the two types of systems considered in this
project. It is seen that the thermoelectric system is about 40% less expensive than the vapor
compression system.
The system costs given above are for a very small model home. To be of practical value it
is important to consider how the costs mentioned above would increase as the system is scaled to

31
a larger size cooling area. This is discussed next. The scope is limited to window mounted room
air conditioners. The heat pumping power of commercially available vapor compression window
air conditioners range from 1500 W to 7500 W. Purchase prices of several of these units are
obtained from a market survey. Fig. 18 shows the dependence of purchase price on the cooling
power. It is observed that the price increases roughly linearly at the rate of 8.5 cents per watt. A
similar cost per watt of cooling power can be estimated for TEC based systems as follows. At
wholesale rates, TEC modules such as the one used in this project cost $3 each. These modules
have an optimum heat pumping power of about 20 watts. The cost of the active heat sink used in
this project is mainly due to its motor. Since the motor is large enough to cool 100 TEC modules
the heat sink cost can be reduced to $0.2 per TEC. From these assumptions it is estimated that at
current market prices for TEC modules, practical TEC based air conditioners will cost about 16
to 20 cents per watt of cooling power.
Table 2. Comparison on system costs.
Vapor Compression Air Conditioner Thermoelectric Air Conditioner
A/C unit $55.00 TEC module $5 x 4
Water cooled heat sink $20 Passive heat sink $2
TOTAL $55.00 TOTAL $42.00
0
200
400
600
800
1000
1200
0 1000 2000 3000 4000 5000 6000 7000 8000
Cooling Power Qp (W)
Co
st
($)
Fig. 20. Dependence of purchase price of vapor compression air conditioners on cooling power found from a market
survey (dots). Dashed line represents estimated dependence of cost per cooling watt for TEC systems based on
current market prices.
32
7. Future Work
The primary advantage of a thermoelectric air conditioning system is that its cooling power can
be adapted to the existing heat load and temperatures by controlling the current through the
modules. In case of a dual stage cascaded system there is even more flexibility because the
current in each stage can be varied separately. One of the main items that will be addressed in
future is a control system that can automatically take into consideration the existing heat load
and temperatures and set the currents such that energy efficiency of the system is maximized.
8. Conclusions
In conclusion, a novel thermoelectric based air conditioning system was demonstrated using
commercially available components. The objectives of the project were successfully met. It was
found that with a dual-stage cascaded design it is possible to construct a thermoelectric air
conditioner that is significantly more energy efficient than a similarly sized vapor compression
system. At current market prices the purchase cost of a practical thermoelectric air conditioner is
expected to be a little more than a comparable vapor compression unit.
33
9. References
1. American Council for an Energy Efficient Economy Website. Internet: aceee.org/topics/air-
conditioners, 2012 [Oct. 01, 2012].
2. US Department Energy, Energy Inform. Administration, "Annual Energy Review 2011," Internet:
www.eia.gov/totalenergy/data/annual/pdf/aer.pdf., Sep. 2012 [Oct. 15, 2012].
3. Marsicek, G., Klein, S., Nellis, G., "Feasibility of Combined Solar/Heat Pump Systems for Net-Zero
Buildings," International Building Performance Simulation Association SimBuild Conference.
[Online]. Available: http://www.ibpsa.us/simbuild2012/Papers/SB12_TS03a_3_Marsicek.pdf
4. Rowe, D. M., Editor, CRC Handbook of Thermoelectrics, CRC Press, 1995
5. Nolas, G. S., Sharp, J., Goldsmid H. J., Thermoelectrics – Basic Principles and New Materials
Developments, Springer, 2001.
6. Li, J., Liu, W., Zhao, L., Zhou, M., "High-performance Nanostructured Thermoelectric Materials,"
NPG Asia Materials, vol. 2, pp. 152-158, 2010.
7. Harman, T. C., Walsh, M. P., laforge, B. E., Turner, G. W., "Nanostructured Thermoelectric
Materials," Journal of Electronic Materials, vol. 34, pp. L19-L22, 2005.
8. Johnson, D. A., Bierschenk, J., "Latest Developments in Thermoelectrically Enhanced Heat Sinks,"
Electronics Cooling. [Online]. Available: http://www.electronics-cooling.com/2005/08/latest-
developments-in-thermoelectrically-enhanced-heat-sinks. [Aug. 1, 2005].
9. Winkler, J., "Laboratory Test Report for Fujitsu 12RLS and Mitsubishi FE12NA Mini-Split Heat
Pumps," Internet: www.nrel.gov/docs/fy11osti/52175.pdf, Sep. 2011 [Oct. 01, 2012].
10. Goldsmid, H. J., Douglas, H. W., "The Use of Semiconductors in Thermoelectric Refrigeration,"
British Journal of Applied Physics, vol. 5, pp. 386 - 390, 1954.
11. Brown, D. R., Dirks, J. A., Fernandez, N., Stout, T. B., " Prospects of Alternatives to Vapor
Compression Technology for Space Cooling and Food Refrigeration Applications," Internet:
www.pnl.gov/main/publications/external/technical_reports/pnnl-19259.pdf, Mar. 2010 [Oct. 10,
2012].
12. A.Melero, D.Astrain, J.G.Viin, L.Aldave, J.Albizua, and C.Costa, "Application of Thermoelectricity
and Photovoltaic Energy to Air Conditioning," Proc. 22nd International Conference on
Thermoelectrics, pp. 627-630, 2003.
13. H. Lai, Y. Pan, and J. Chen, "Optimum Design on the Performance Parameters of a Two-Stage
Combined Semiconductor Thermoelectric Heat Pump," Semiconductor Sci. Technol., vol. 19, pp. 17
– 22, 2004.

34
14. M. Olivares-Robles, F. Vazquez, and C. Ramirez-Lopez, "Optimization of Two-Stage Peltier
Modules: Structure and Exergetic Efficiency," Entropy, vol. 14, pp. 1539 – 1552, 2012.
15. R.E. Simons and R. C. Chu, "Application of Thermoelectric Cooling to Electronic Equipment: A
Review and Analysis," Proc. 16th IEEE SEMI-THERM Symposium, pp. 1-4, 2000.
16. Karim, O., Creiber, J. C., Gillot, C., Schaffer, C., Mallet, B., Gimet, E., "Heat Transfer Coefficient for
Water Cooled Heat Sink: Application for Standard Power Modules Cooling at High Temperature,"
Proc. Of 32nd Power Electronics Specialists' Conf., pp. 1938 - 1943, 2001.
17. O'Brien, B. J., Wallace, C. S., Landecker, K., "Cascading of Peltier Couples for Thermoelectric
Cooling," J. Applied Physics, 27, pp. 820 - 824, 1956.