Embed Size (px)
Citation preview

Context Objectives The Data Tsetse Model Perspectives
Development of a mathematical model for tsetsepopulation dynamic to optimize the control in the
Niayes (Senegal)
A. A. FALL1,2, R. Lancelot1, J. Bouyer1,2, A. Dicko2,3 & M. T.Seck2
1 UMR Controle des Maladies Animales Exotiques et Emergentes (CMAEE)Centre de cooperation internationale en recherche agronomique pour le
developpement (CIRAD)2 Institut Senegalais de Recherches Agricoles (ISRA) (LNERV)
3 Ecole Nationale de la Statistique et de l’Analyse Economique (ENSAE-Senegal)
5 octobre 2011
A. A. FALL1,2, R. Lancelot1, J. Bouyer1,2, A. Dicko2,3 & M. T. Seck2Tsetse population dynamic

Context Objectives The Data Tsetse Model Perspectives
Plan
1 Context
2 Objectives
3 The Data
4 Tsetse Model
5 Perspectives
A. A. FALL1,2, R. Lancelot1, J. Bouyer1,2, A. Dicko2,3 & M. T. Seck2Tsetse population dynamic

Context Objectives The Data Tsetse Model Perspectives
Context
The Senegalese government aims to control trypanosomosisfrom the Niayes region by eradicating the tsetse vector,Glossina palpalis gambiensis
In 2005, the Senegalese government initiated a controlcampaign called �Projet de lutte contre les glossines dans lesNiayes� with a main objective to eradicate tsetse fly in theNiayes area.
A. A. FALL1,2, R. Lancelot1, J. Bouyer1,2, A. Dicko2,3 & M. T. Seck2Tsetse population dynamic

Context Objectives The Data Tsetse Model Perspectives
Study area
Figure: Distribution of tsetse flies in the Niayes areaA. A. FALL1,2, R. Lancelot1, J. Bouyer1,2, A. Dicko2,3 & M. T. Seck2Tsetse population dynamic
Context Objectives The Data Tsetse Model Perspectives
Objectives
Determination of temperatures ”feeled” by tsetse
Establish a mathematical model to optimize the controlmeasures
Estimation of the model parameters by fitting the model tofield data (densities , age structure)
Establish the map of distribution
Establish the metapopulation model using the tsetse map ofdistribution
Optimize the control processes measures for tsetse eradicationin the Niayes
A. A. FALL1,2, R. Lancelot1, J. Bouyer1,2, A. Dicko2,3 & M. T. Seck2Tsetse population dynamic

Context Objectives The Data Tsetse Model Perspectives
The data
According to the Tsetse biology and ecology, the tsetse life cycle isdependent on the environmental and climatic conditions.We focused on the influence of average daily temperature (θt) ontsetse population dynamics.Field meteorological data are available in the study area and will bemodeled using Modis data.
A. A. FALL1,2, R. Lancelot1, J. Bouyer1,2, A. Dicko2,3 & M. T. Seck2Tsetse population dynamic

Context Objectives The Data Tsetse Model Perspectives
Temperature / Modis
date
tem
péra
ture
15202530354045
15202530354045
15202530354045
cadda
févr.-09 août-09 févr.-10 août-10
ean
juil.-09 janv.-10 juil.-10 janv.-11
ka
2007 2008 2008 2009 2009 2010 2010
carmel
févr.-09 août-09 févr.-10 août-10
haddad
2007 2008 2008 2009 2009 2010
sall
juil.-09 janv.-10 juil.-10 janv.-11
temp_air lstnight lstday
Figure: correlation between air temperature and soil temperature
A. A. FALL1,2, R. Lancelot1, J. Bouyer1,2, A. Dicko2,3 & M. T. Seck2Tsetse population dynamic

Context Objectives The Data Tsetse Model Perspectives
Temperature soil/air
air temperature (°C)
soil
tem
pera
ture
(°C
)
23
24
25
26
27
22 24 26 28
date
tem
pera
ture
(°C
)
22°
24°
26°
28°
air soil
juin-08 sept.-08 déc.-08 mars-09 juin-09 sept.-09 déc.-09 mars-10
Figure: correlation between air temperature and soil temperature(Haddad)
A. A. FALL1,2, R. Lancelot1, J. Bouyer1,2, A. Dicko2,3 & M. T. Seck2Tsetse population dynamic
Context Objectives The Data Tsetse Model Perspectives
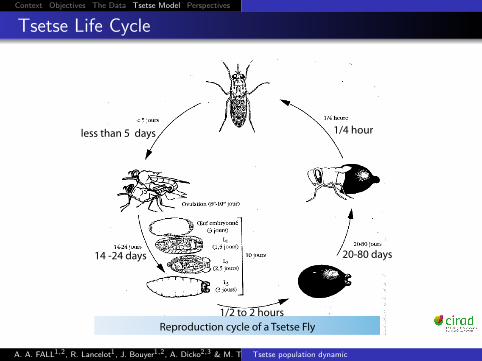
Tsetse Life Cycle
less than 5 days 1/4 hour
14 -24 days 20-80 days
Reproduction cycle of a Tsetse Fly1/2 to 2 hours
Figure: elimination des glossines dans la zone des Niayes et La PetiteCote
A. A. FALL1,2, R. Lancelot1, J. Bouyer1,2, A. Dicko2,3 & M. T. Seck2Tsetse population dynamic
Context Objectives The Data Tsetse Model Perspectives
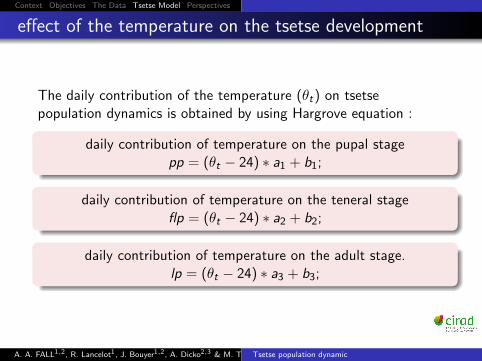
effect of the temperature on the tsetse development
The daily contribution of the temperature (θt) on tsetsepopulation dynamics is obtained by using Hargrove equation :
daily contribution of temperature on the pupal stagepp = (θt − 24) ∗ a1 + b1;
daily contribution of temperature on the teneral stageflp = (θt − 24) ∗ a2 + b2;
daily contribution of temperature on the adult stage.lp = (θt − 24) ∗ a3 + b3;
A. A. FALL1,2, R. Lancelot1, J. Bouyer1,2, A. Dicko2,3 & M. T. Seck2Tsetse population dynamic

Context Objectives The Data Tsetse Model Perspectives
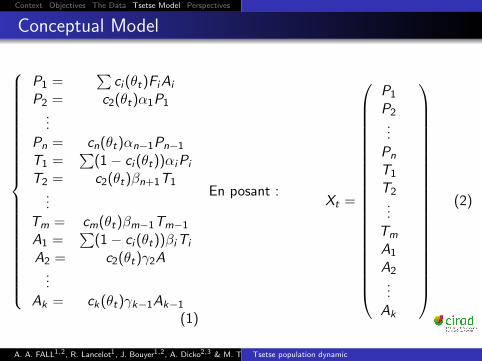
Conceptual Model
P1α1
αiαi-1αn-1
ci=1
clcl+1
ci+1=1
cj=1
PiP2 Pi+1 Pn
T1β1
βjβj-1βm-1TjT2 Tj+1 Tm
A1γ1
γiγl-1γm-1AlA2 Al+1 Ak
cn=1
cj=1
cm=1
Figure: Conceptual Model
A. A. FALL1,2, R. Lancelot1, J. Bouyer1,2, A. Dicko2,3 & M. T. Seck2Tsetse population dynamic
Context Objectives The Data Tsetse Model Perspectives
Conceptual Model
P1 =∑
ci (θt)FiAi
P2 = c2(θt)α1P1...
Pn = cn(θt)αn−1Pn−1
T1 =∑
(1 − ci (θt))αiPi
T2 = c2(θt)βn+1T1...
Tm = cm(θt)βm−1Tm−1
A1 =∑
(1 − ci (θt))βiTi
A2 = c2(θt)γ2A...
Ak = ck(θt)γk−1Ak−1
(1)
En posant :Xt =
P1
P2...
Pn
T1
T2...
Tm
A1
A2...
Ak
(2)
A. A. FALL1,2, R. Lancelot1, J. Bouyer1,2, A. Dicko2,3 & M. T. Seck2Tsetse population dynamic

Context Objectives The Data Tsetse Model Perspectives
Conceptual Model
X(t+1) = Aθt .Xt where Aθt is equal to
0 . . . 0 cj (θt )Fj 0 . . . ck (θt )Fk
c1(θt )α1 0
.
.
. 0 . . . . . . 00 c2(θt )α2 0 0 . . . . . . 0
0 0 ci (θt )αi 0 . . . . . . 0
.
.
.. . .
.
.
.. . . . . . 0 0
0 0
.
.
.
.
.
.
.
.
.
.
.
.
.
.
.(1 − c1(θt ))α1 . . . (1 − ci (θt ))αi 0 . . . 0
0 0 0 cj (θt )β1 0 . . . 0
.
.
.
.
.
.
.
.
.
.
.
.
.
.
.
.
.
.
.
.
.0 0 0 (1 − cj (θt ))β1 . . . (1 − cj+1(θt ))βj 0 . . . 00 0 . . . 0 ck−1(θt )γk−1 0 00 0 0 . . . 0 ck (θt )γk 0
(3)
A. A. FALL1,2, R. Lancelot1, J. Bouyer1,2, A. Dicko2,3 & M. T. Seck2Tsetse population dynamic

Context Objectives The Data Tsetse Model Perspectives
Aθt is temperature dependent.
as the mortality is temperature-dependent
the fecundity is temperature-dependent because the time takento produce larva is function of the temperature .
A. A. FALL1,2, R. Lancelot1, J. Bouyer1,2, A. Dicko2,3 & M. T. Seck2Tsetse population dynamic

Context Objectives The Data Tsetse Model Perspectives
0.00
0.01
0.02
0.03
0.04
0.05
0.06
0.07
0.08
0 1 2 3 4
Figure: histogram of the frequencies of flies by parity group produce bythe model
A. A. FALL1,2, R. Lancelot1, J. Bouyer1,2, A. Dicko2,3 & M. T. Seck2Tsetse population dynamic

Context Objectives The Data Tsetse Model Perspectives
Figure: histogram of the frequencies of flies by parity group on the fielddata
A. A. FALL1,2, R. Lancelot1, J. Bouyer1,2, A. Dicko2,3 & M. T. Seck2Tsetse population dynamic
Context Objectives The Data Tsetse Model Perspectives
0
5
10
15
20
25
30
35
0 100 200 300 400 500 600 700 800
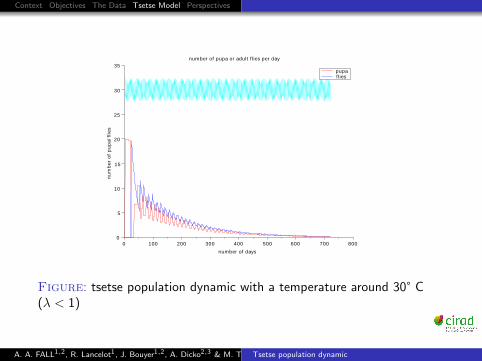
number of pupa or adult f lies per day
number of days
nu
mb
er o
f p
up
a/fl
ies
pupaflies
Figure: tsetse population dynamic with a temperature around 30° C(λ < 1)
A. A. FALL1,2, R. Lancelot1, J. Bouyer1,2, A. Dicko2,3 & M. T. Seck2Tsetse population dynamic

Context Objectives The Data Tsetse Model Perspectives
0
5
10
15
20
25
30
35
40
0 100 200 300 400 500 600 700 800
number of pupa or adult f lies per day
number of days
nu
mb
er o
f p
up
a/fl
ies
pupaflies
Figure: tsetse population dynamic with a temperature around 25° C(λ > 1)
A. A. FALL1,2, R. Lancelot1, J. Bouyer1,2, A. Dicko2,3 & M. T. Seck2Tsetse population dynamic

Context Objectives The Data Tsetse Model Perspectives
Perspectives
parameters estimation (in progress...)
sensivity analysis and uncertainty analysis
Tsetse distribution map of suitable habitat
A. A. FALL1,2, R. Lancelot1, J. Bouyer1,2, A. Dicko2,3 & M. T. Seck2Tsetse population dynamic

Context Objectives The Data Tsetse Model Perspectives
FIN
Thanks for your attention ! ! !...
A. A. FALL1,2, R. Lancelot1, J. Bouyer1,2, A. Dicko2,3 & M. T. Seck2Tsetse population dynamic