Embed Size (px)
Citation preview

DEVELOPMENT OF A CASH FLOW MANAGEMENTMODELby LEON KAPLAN: MUNICIPALITIES PROJECT LEADER
Gauteng Department of FinanceMunicipal PPP Conference
18 FEBRUARY 2010

AGENDA
• Background• The SAICA Developed/Facilitated Cash Flow
Model for municipalities• Application of the CFM to Capital Projects• Way forward


BACKGROUND
BACKGROUND: MOTIVATION FOR DEVELOPING A CASH FLOW MANAGEMENT MODEL
• SAICA’s response to ‘Cash Crunch’ & Municipal needs for meaningful Management Information • Reduced household disposable incomes (unemployment/increased
tariffs etc)• Increase bad debts and reduced collection rates (consumer boycotts)• Unrelated Income & expenses (Reduced Revenue and Actual
Collections v Budgeted Expenditure)• Grants (‘ring-fencing’)• Capex v. Opex?..(service delivery!)
• Balance Sheet Projections• Risk of unidentified Cash Flow viability (unreliable/non-existent cash
flow projections; timing of cash flows)
5

Cash Flow Model….. features• 12 step process utilising wide range of MS Excel functions (including
explanatory notes for first time users)
• Daily, Weekly, Monthly and Yearly Cash Flow Projections
• ‘Flash’ report for Management with relevant indicators (early warning system for potential future financing/cash challenges; basis for assessing and developing an adjustments budget (eg: based on reduced revenue receipts)
• Debtors collection rates to be based on previous year’s actuals rather than budget
• Distinguishes between “own funding” and grant funding which requires to be ring-fenced
• Tracking Capital Projects (% complete v funding needs)

Cash Flow Modelling process…Inputs
• Assistance from Budget office to complete 3 year MTREF
• Assumptions used in model to be historically accurate and achievable based on the current economic climate (Adjustment budgets catered for)
• Regular (daily, weekly) updating of the system to maintain the model
• Active engagement with the cash flow management reports by CFO and senior management to inculcate new financial discipline of on-going cash flow management and forecasting
• Capital Projects data input
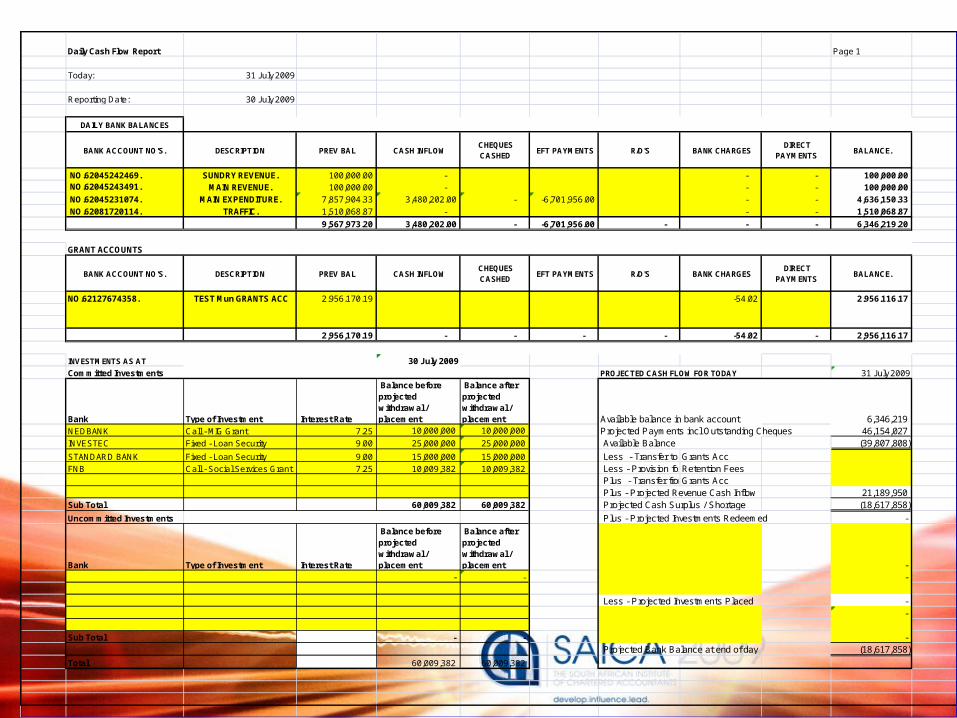
Daily Cash Flow Report Page 1
Today: 31 July 2009
Reporting Date: 30 July 2009
DAILY BANK BALANCES
BANK ACCOUNT NO'S. DESCRIPTION PREV BAL CASH INFLOW CHEQUES CASHED
EFT PAYMENTS R/D'S BANK CHARGES DIRECT
PAYMENTS BALANCE.
NO.62045242469. SUNDRY REVENUE. 100,000.00 - - - 100,000.00 NO.62045243491. MAIN REVENUE. 100,000.00 - - - 100,000.00
NO.62045231074. MAIN EXPENDITURE. 7,857,904.33 3,480,202.00 - -6,701,956.00 - - 4,636,150.33
NO.62081720114. TRAFFIC. 1,510,068.87 - - - 1,510,068.87
9,567,973.20 3,480,202.00 - -6,701,956.00 - - - 6,346,219.20
GRANT ACCOUNTS
BANK ACCOUNT NO'S. DESCRIPTION PREV BAL CASH INFLOW CHEQUES CASHED
EFT PAYMENTS R/D'S BANK CHARGES DIRECT
PAYMENTS BALANCE.
NO.62127674358. TEST Mun GRANTS ACC 2,956,170.19 -54.02 2,956,116.17
2,956,170.19 - - - - -54.02 - 2,956,116.17
INVESTMENTS AS AT 30 July 2009
Committed Investments PROJECTED CASH FLOW FOR TODAY 31 July 2009
Bank Type of Investment Interest Rate
Balance before projected withdrawal / placement
Balance after projected withdrawal / placement Available balance in bank account 6,346,219
NEDBANK Call - MIG Grant 7.25 10,000,000 10,000,000 Projected Payments incl Outstanding Cheques 46,154,027 INVESTEC Fixed - Loan Security 9.00 25,000,000 25,000,000 Available Balance (39,807,808)
STANDARD BANK Fixed - Loan Security 9.00 15,000,000 15,000,000 Less - Transfer to Grants AccFNB Call - Social Services Grant 7.25 10,009,382 10,009,382 Less - Provision for Retention Fees
Plus - Transfer fromGrants AccPlus - Projected Revenue Cash Inflow 21,189,950
Sub Total 60,009,382 60,009,382 Projected Cash Surplus / Shortage (18,617,858)
Uncommitted Investments Plus - Projected Investments Redeemed -
Bank Type of Investment Interest Rate
Balance before projected withdrawal / placement
Balance after projected withdrawal / placement -
- - -
Less - Projected Investments Placed - -
Sub Total - - - Projected Bank Balance at end of day (18,617,858)
Total 60,009,382 60,009,382

Application of the CFM to Capital Projects
• Caters for ‘Own’, ‘Grant’ and ‘Loan’ funded projects
• Budgeted figures for projects obtained from the municipality’s Capital Budget
• The model highlights monthly actuals v. monthly budget & total budget
• The model allocates the timing of expected Capital Grants receipts and payments (daily; monthly)
• The model highlights surplus funds (including Grant funding) to be ‘ring-fenced’ for short term investment
• Multi-year funding is tracked

Capital Projects : Grant funding inflow
2009/2010
CAPITAL GRANTS FUNDING RECEIPTS
Date Project
Source of Funding MIG Actual Receipts MIG Actual Receipts MIG Actual ReceiptsMIG Actual ReceiptsMIG Actual Receipts MIG Actual ReceiptsBudget 1,616,274 1,616,274 780,955 780,955 530,849 530,849 5,458,064 5,458,064 3,779,442 3,779,442 1,140,447 1,140,447
Jul 269,379 269,379 130,159 130,159 88,475 88,475 909,677 909,677 629,907 629,907 190,075 190,075Aug 269,379 269,379 130,159 130,159 88,475 88,475 909,677 909,677 629,907 629,907 190,075 190,075Sep 269,379 269,379 130,159 130,159 88,475 88,475 909,677 909,677 629,907 629,907 190,075 190,075Oct 269,379 269,379 130,159 130,159 88,475 88,475 909,677 909,677 629,907 629,907 190,075 190,075Nov 269,379 269,379 130,159 130,159 88,475 88,475 909,677 909,677 629,907 629,907 190,075 190,075Dec 269,379 269,379 130,159 130,159 88,475 88,475 909,677 909,677 629,907 629,907 190,075 190,075JanFebMarAprMayJun
1,616,274 1,616,274 780,955 780,955 530,849 530,849 5,458,064 5,458,064 3,779,442 3,779,442 1,140,447 1,140,447
KAGISO CEMETERY UPGRADERURAL CEMETERIES UPGRADE KAGISO REGIONAL PARK LUSAKA EXT 2&3 RURAL WATER & SAN NEW M'DRIFT RESERVOIR

Capital Projects : Grant funding outflow
2009/2010Grant Funded Capital Projects
Month ProjectBudget Actual ExpenditureBudget Actual Expenditure Budget Actual ExpenditureBudget Actual ExpenditureBudget Actual Expenditure
Source of Funding MIG MIG MIG MIG MIGBudget 1,616,274 780,955 530,849 5,458,064 3,779,442 Rollover - - - - Total Budget 1,616,274 1,616,274 780,955 780,955 530,849 530,849 5,458,064 5,458,064 3,779,442 3,779,442
Jul 269,379 269,379 130,159 130,159 88,475 88,475 909,677 909,677 629,907 629,907 Aug 269,379 269,379 130,159 130,159 88,475 88,475 909,677 909,677 629,907 629,907 Sep 269,379 269,379 130,159 130,159 88,475 88,475 909,677 909,677 629,907 629,907 Oct 269,379 269,379 130,159 130,159 88,475 88,475 909,677 909,677 629,907 629,907 Nov 269,379 269,379 130,159 130,159 88,475 88,475 909,677 909,677 629,907 629,907 Dec 269,379 269,379 130,159 130,159 88,475 88,475 909,677 909,677 629,907 629,907 JanFebMarAprMayJun
1,616,274.00 ######### 780,955.00 780,955.00 530,849.00 530,849.00 5,458,064.00 ########## ########## 3,779,442.00 Return to top of Exp Page
KAGISO CEMETERY UPGRADERURAL CEMETERIES UPGRADE KAGISO REGIONAL PARK LUSAKA EXT 2&3 RURAL WATER & SAN

WAY FORWARD……CFM ‘vision’

WAY FORWARD
• Phase 1 Roll-out to remaining Gauteng municipalities SAICA Endorsement
• Phase 2: Future Improvements ( subject to funding) Development of Grants Registers Web based portal for Gauteng Municipalities to input Cash Flows Integration with Municipal financial systems to import daily Cash Flows Usage of common chart of accounts (NT GFS codes) for reporting purposes &
consolidation aligned to the new NT reporting Regulations NT Endorsement and ‘National’ roll-out

CONTACT DETAILS
Leon Kaplan (Municipalities Project Leader)
Colleen Robinson (Municipalities Project Co-ordinator)

Q & A

THANKS