Embed Size (px)
Citation preview

Development Economics
Slides 5
Debraj Ray
Warwick, Summer 2014
Aspirations, uneven growth and the potential for conflict.
“[T]hose made to wait unconscionably long for ‘trickle-down’ —people with dramatically raised but mostly unfulfillable aspirations— have become vulnerable to demagogues promising national re-generation. It is this tiger of unfocused fury, spawned by globalcapitalism in the ‘underdeveloped’ world, that Modi has sought toride from Gujarat to New Delhi.”
Pankaj Mishra, “Narendra Modi and the new face of India,” The Guardian,May 16, 2014.
0-0

Uneven Growth and the Social Backlash
Roots
Divergence (increasing returns, imperfect credit markets)
Sectoral change (agriculture/industry, domestic/exports)
Globalization (sectors with comparative advantage)
Corruption (rent-seeking with rapid growth)
Reactions
Occupational choice (slow, imprecise, intergenerational)
Cross-sector percolation (demand patterns, inflation)
Political economy (person-based votes, wealth-based lobbying )
0-1

Uneven Growth and Aspirations
The lives of others are on display:
Aspirations and frustrations are socially generated.
Hirschman’s tunnel effect.
Unclear if this exposure leads to betterment or to despair.
On top of that, an ever-faster treadmill:
The great acceleration: UK, 1780, 58; US, 1839, 47; Japan,1885, 34, Brazil, 1961, 18, Korea, 1966, 11, China, 1980→, 7–9.
. . . which leads us to the topic of this lecture:
Growth, aspirations and the potential for conflict.
0-2

Aspirations
Appadurai (2004), Ray (1998, 2006), Genicot-Ray (2013)
An aspiration is a reference point a to evaluate current andfuture personal outcomes z.
z
w(a, z)
a
0-3

Aspirations are, in turn, influenced by achievements of others.
a = Ψ(y, s),
where s = social outcomes and y = current personal outcome.
(incomes, occupations, achievements)
This generates a two-way process:
aspirations affects the behavior of every individual or group
behavior feeds back on aspirations
0-4

For instance, what happens when aspirations increase?
level effects and marginal effects
z
w(a, z)
a a’z z’
0-5

Simplest model:
maxk
w(z, a)− c(k, y),
where z = f (k).
Theorem. For given y, there is a unique threshold value of abelow which “aspirations are satisfied” (z ≥ a), and above whichthey are frustrated (z < a).
Once aspirations are frustrated, chosen wealth declines as aspi-rations continue to grow.
“The French found their position all the more intolerable as itbecame better.”
Alexis de Tocqueville
0-6

The Salience Question
Uneven growth −→ conflict, but along what lines?
Religion, ethnicity, geography, occupation, class?
The Marxian answer:
class
example: Maoist violence in rural India
But the argument is problematic.
Conflict is usually over directly contested resources.
0-7

Directly Contested Resources
Labor markets
Ethnic or racial divisions, immigrant vs native
Agrarian land
Rwanda, Darfur, Chattisgarh
Real estate
Gujarat, Bengal
Business resources
Kyrgystan, Ivory Coast, Malaysia . . .
0-8

Contestation ⇒ conflict between economically similar groups
Some counterarguments:
bauxite/land in Maoist violence
agrarian/industrial land in Singur and Nandigram.
⇒ class violence, but exception rather than the rule.
The implications of direct contestation:
Ethnic markers.
Instrumentalism as opposed to primordialism (Huntington, Lewis)
An aside:
This is only one view of why ethnic markers may be salient
0-9

Hindu-Muslim Conflict
based on Mitra and Ray (2014)
Recurrent episodes of violence
Partition era of the 1940s, and earlier
Continuing through the second half of the twentieth century.
∼ 1,200 riots, 7,000 deaths, 30,000 injuries over 1950–2000.
Numbers may look small relative to Indian population
Don’t capture displacement, segregation and widespread fear.
0-10

Some Ethnographic Literature
Thakore (1993) on Bombay riots [land]
Das (2000) on Calcutta riots [land]
Rajgopal (1987) and Khan (1992) on Bhiwandi and Meerut riots[textile sector]
Engineer (1994) and Khan (1991) on Jabbalpur, Kanpur, Morad-abad [competition in bidis, brassware]
Upadhyaya (1992) on Varanasi riots [sari dealers]
Wilkinson (2004) on Varanasi [wholesale silk trade]
Field et al (2009) on Ahmedabad [housing]
0-11

Engineer (1987) on Meerut riots:
“If [religious zeal] is coupled with economic prosperity, as has hap-pened in Meerut, it has a multiplying effect on the Hindu psyche.The ferocity with which business establishments have been de-stroyed in Meerut bears testimony to this observation. Entire rowsof shops belonging to Muslims . . . were reduced to ashes.”
Das (2000) on Calcutta riots:
“[I]t appears that that ‘promoters’ played a crucial role in inflamingthe riot whose victims . . . were slum-dwellers. Their obvious aimwas to clear the bustees [or slums] for construction projects. . . Theexpectation was that once such people could be forced to abandontheir establishments the realtors would have ‘an easy way to rakein the fast buck’. . . What actually took place in 1992 was a land-grabbing riot under a communal garb.”
0-12

Quick Summary of the Theory
Two groups. Each has potential victims and aggressors.
Random encounters that can be escalated on “ethnic grounds”.
(processions, murder, rape, pigs)
Aggressors decide whether to engage in violence.
Victims buy security against attacks.
Aggression and defense technologies:
could be based on physical capital or human beings
human if overwhelmingly based on human effort from own group
0-13

Proposition
Assume human technologies for attack and defense.
Under a proportional increase in group income:
Attacks instigated by group members unambiguously decline.
Attacks perpetrated on group members increase.
Extensions to non-human technologies discussed in paper.
0-14

Data
Conflict data. Varshney-Wilkinson (TOI 1950-1995)
our extension (TOI 1996-2000).
Income data. National Sample Survey Organization (NSSO)consumer expenditure data.
Rounds 38 (1983), 43 (1987-8) and 50 (1993-94).
Controls. Various sources, in particular Reports of the ElectionCommission of India.
Three-period panel at the regional level; 55 regions.
0-15

0-16

0-17

Empirical Specification
Baseline: We use the Poisson specification:
E[Counti,t∣∣Xit, ri] = ri exp(X
′itβ + τt)
where X includes
expenditures (as income proxies) both for Hindu and Muslim.
time-varying controls.
ri are regional dummies; τt are time dummies.
Other Specifications:
Negative binomial to allow for mean count 6= variance.
Plain vanilla OLS (on log count).
0-18

Casualties, 5-Year Average Starting Just After
[Poiss] [Poiss] [NegBin] [NegBin] [OLS] [OLS]
H Exp ∗∗∗-7.87 ∗∗∗-6.82 ∗∗-2.79 -3.31 ∗∗-9.15 ∗-8.46(0.005) (0.003) (0.093) (0.131) (0.033) (0.085)
M Exp ∗∗∗5.10 ∗∗∗4.67 ∗∗2.64 ∗∗3.87 ∗∗∗6.89 ∗∗∗ 9.52(0.000) (0.001) (0.040) (0.023) (0.006) (0.009)
Pop 4.28 3.91 0.62 0.74 -3.87 -1.23(0.468) (0.496) (0.149) (0.132) (0.614) (0.877)
RelPol ∗5.55 ∗5.57 0.72 1.09 6.00 6.86(0.054) (0.056) (0.763) (0.715) (0.470) (0.408)
Gini H -5.426 4.121 -14.473(0.317) (0.521) (0.342)
Gini M 3.399 -5.952 -11.073(0.497) (0.362) (0.451)
Lit, Urb Y Y Y Y Y Y
Mus exp ↑ 1% ⇒ Cas ↑ 3–5%. Opp for Hindu exp.
0-19

Killed and Riot Outbreaks, 5-Year Average Starting Just After
[Poiss] [NegBin] [OLS]Kill Riot Kill Riot Kill Riot
H exp -0.07 -2.12 -2.25 ∗-5.37 -4.27 ∗∗-6.30(0.976) (0.393) (0.293) (0.069) (0.339) (0.019)
M exp 0.85 ∗2.49 ∗∗3.69 ∗∗4.16 ∗∗6.42 ∗∗∗6.42(0.636) (0.067) (0.030) (0.016) (0.043) (0.006)
Pop ∗-6.03 0.26 0.83 0.30 -3.31 -0.03(0.071) (0.900) (0.170) (0.823) (0.549) (0.995)
RelPol 1.31 0.26 0.10 ∗4.58 4.17 2.73(0.659) (0.875) (0.970) (0.085) (0.556) (0.603)
GiniH -2.63 -2.69 6.32 4.56 -8.77 -8.99(0.686) (0.617) (0.389) (0.484) (0.445) (0.366)
GiniM 4.58 -1.11 -11.24 -9.14 -15.06 -11.93(0.505) (0.790) (0.121) (0.153) (0.235) (0.199)
Lit, Urban Y Y Y Y Y Y
0-20

The Use of Hindu-Muslim Expenditure Ratios
[Poiss] [NegBin] [OLS]Cas Kill Riot Cas Kill Riot Cas Kill Riot
M/H ∗∗∗4.78 0.80 ∗2.44 ∗∗3.88 ∗∗3.55 ∗∗4.29 ∗∗∗9.36 ∗6.19 ∗∗∗6.34(0.000) (0.640) (0.089) (0.011) (0.014) (0.010) (0.010) (0.051) (0.006)
Pop 4.76 -5.68 0.49 0.75 0.84 0.32 -1.19 -3.32 -0.00(0.417) (0.101) (0.804) (0.105) (0.162) (0.821) (0.880) (0.548) (1.000)
Pce -3.36 0.09 -0.19 0.69 1.40 -1.41 0.51 1.59 -0.25(0.208) (0.971) (0.915) (0.671) (0.540) (0.471) (0.918) (0.703) (0.933)
RelPol ∗5.36 1.21 0.30 1.15 0.14 ∗4.56 6.87 4.26 2.74(0.061) (0.681) (0.856) (0.658) (0.961) (0.060) (0.405) (0.546) (0.600)
GiniH -4.53 -1.90 -2.21 4.20 6.33 4.73 -14.08 -8.26 -8.80(0.413) (0.774) (0.681) (0.499) (0.413) (0.485) (0.352) (0.471) (0.372)
GiniM 4.05 4.77 -0.90 -6.15 -11.17 -9.08 -10.80 -14.89 -11.69(0.421) (0.482) (0.832) (0.310) (0.127) (0.136) (0.468) (0.244) (0.213)
Lit, Urb Y Y Y Y Y Y Y Y Y
0-21

Contemporaneous Relation Reflected For Different Lags
[1] [2] [3] [4] [5] [6]Cas-2 Cas-1 Cas Cas+1 Cas+2 Cas+3
H exp 0.98 0.10 -0.11 ∗∗∗-6.83 ∗∗∗-11.11 ∗∗∗-10.23(0.687) (0.968) (0.959) (0.003) (0.000) (0.001)
M exp -0.15 -0.68 ∗2.36 ∗∗∗4.67 ∗∗∗6.40 ∗∗∗8.32(0.915) (0.624) (0.085) (0.001) (0.000) (0.000)
Pop 5.18 7.36 ∗∗7.84 3.90 5.47 4.48(0.187) (0.117) (0.018) (0.507) (0.385) (0.410)
RelPol -2.35 -0.87 ∗∗5.99 ∗∗5.63 ∗∗5.70 ∗∗∗6.40(0.440) (0.786) (0.038) (0.038) (0.038) (0.008)
BJP Y Y Y Y Y Y
Lit, Urb Y Y Y Y Y Y
Ginis Y Y Y Y Y Y
See paper for other variations, e.g:
lagged conflict as regressor, political controls, urban only.
0-22

Endogeneity
Reverse causation? Anecdotal evidence on who suffers:
1985–1987 526 Hindu-Muslim incidents in 10 states.
Muslims were 12% of the population, but suffered
60% of the 443 deaths
45% of the 2667 injuries
73% of the estimated property damage
from Wilkinson (2004), who quotes the 9th and 10th AnnualReports of the Minorities Commission (1988 and 1989).
[Previous regression on different lags in line with this]
0-23

Omitted Variables? Possible concerns:
Gulf funding of conflict:
Correlated via remittances with Muslim expenditure.
Income changes driven by recovery from past conflict
Combined with periodic upsurges of violence.
Instrument: Occupational Groupings
18 broad occupational categories from the NSS.
Construct average returns for Hindus and Muslims in each.
Use NSS national expenditure averages to do this.
Use regional employment to get H- and M-indices by region.
0-24

Discussion: Category breadth and the exclusion restriction.
(1) Agricultural Production and Plantations, (2) Livestock Produc-tion, (3) Fishing, (4) Mining and Quarrying (Coal; Crude Petroland Natural Gas; Metal Ore; Other), (5) Manufacture of FoodProducts and Inedible Oils, (6) Manufacture of Beverages, To-bacco and Tobacco products, (7) Manufacture of Textiles (Cot-ton; Wool, Silk, Artificial; Jute, Veg. Fibre; Textile Products), (8)Manufacture of Wood and Wooden Products, (9) Manufacture ofPaper, Paper Products, Publishing, Printing and Allied Industries,(10) Manufacture of Leather, and of Leather and Fur Products,(11) Manufacture of Rubber, Plastic, Petroleum, Coal ; Chemicalsand Chemical Products, (12) Manufacture of Non-Metallic MineralProducts, (13) Basic Metal and Alloy Industries, (14) Manufac-ture of Metal Products and Parts, except Machinery and TransportEquipments, (15) Manufacture of Machinery, Machine Tools andParts except Electrical Machinery, (16) Manufacture of ElectricalMachinery, Appliances, Apparatus and Supplies and Parts, (17)Manufacture of Transport Equipments and Parts and (18) OtherManufacturing Industries.
18 sectors to partition the entire labor force of India.
0-25

IV regressions with H- and M-indices
First Stage Second StageCas Kill Riot Cas Kill Riot
M/H ind ***0.78 ***0.78 ***0.76(0.001) (0.001) (0.002)
M/H ***26.83 ***24.97 ***16.59(0.004) (0.006) (0.010)
Pce *-0.59 *-0.60 *-0.54 13.99 14.79 7.21(0.079) (0.082) (0.089) (0.131) (0.115) (0.188)
Pop -0.16 -0.17 -0.22 3.81 1.71 3.40(0.453) (0.445) (0.311) (0.651) (0.818) (0.528)
RelPol **-0.47 **-0.48 *-0.41 12.24 10.78 5.40(0.046) (0.042) (0.087) (0.174) (0.195) (0.348)
GiniH ***-1.29 ***-1.28 ***-1.37 1.82 8.22 1.10(0.002) (0.003) (0.001) (0.921) (0.593) (0.928)
GiniM ***2.77 ***2.79 ***2.77 **-67.18 **-72.74 **-44.73(0.000) (0.000) (0.000) (0.031) (0.015) (0.033)
BJP Y Y Y Y Y Y
Lit, Urb Y Y Y Y Y Y
0-26
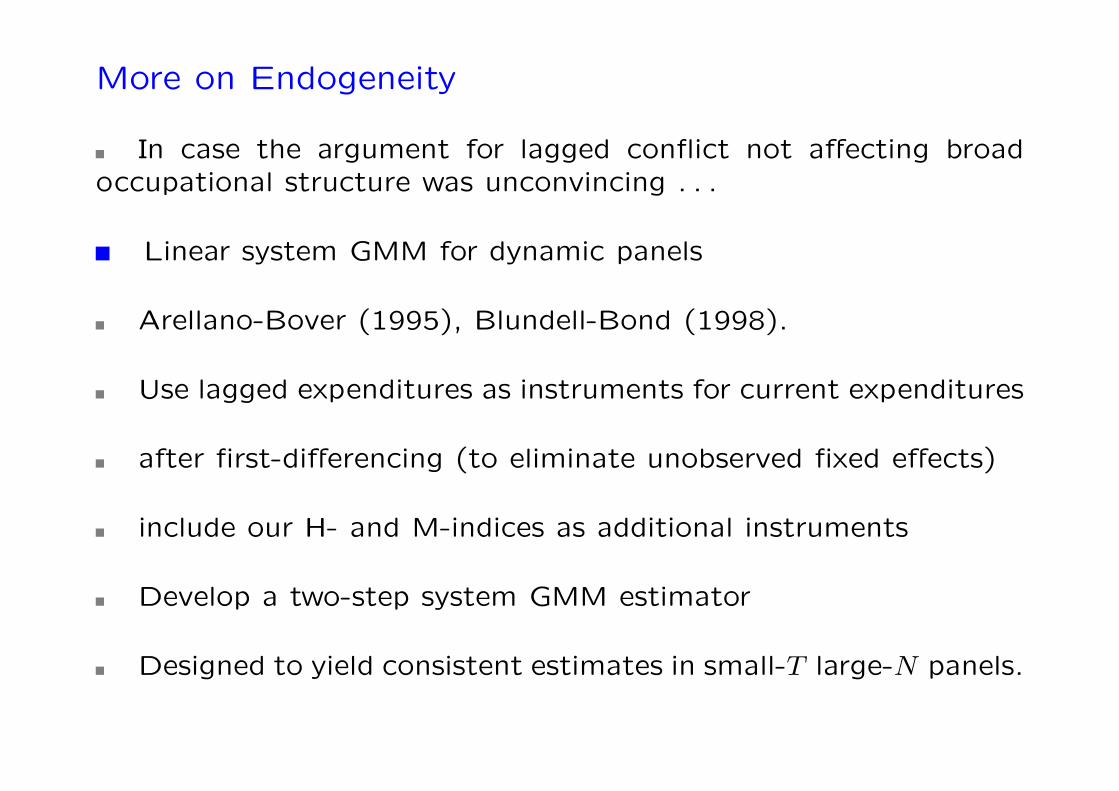
More on Endogeneity
In case the argument for lagged conflict not affecting broadoccupational structure was unconvincing . . .
Linear system GMM for dynamic panels
Arellano-Bover (1995), Blundell-Bond (1998).
Use lagged expenditures as instruments for current expenditures
after first-differencing (to eliminate unobserved fixed effects)
include our H- and M-indices as additional instruments
Develop a two-step system GMM estimator
Designed to yield consistent estimates in small-T large-N panels.
0-27

GMM with lagged expenditure and H-M-indices
[1]Casualties
[2]Casualties
[3]Casualties
[4]Casualties
[5]Killed
[6]Outbreak
HExp ***-14.09 -2.11 -4.71 0.63(0.008) (0.726) (0.234) (0.423)
MExp **10.26 **11.43 ***9.49 **1.36(0.035) (0.013) (0.000) (0.029)
M/H *8.59 **11.52(0.085) (0.035)
Pce ***-2.38 **9.52(0.003) (0.010)
Pop **2.42 **2.29 ***4.49 ***4.68 ***4.06 ***0.84(0.038) (0.013) (0.000) (0.000) (0.000) (0.000)
RelPol 7.73 *9.70 2.84 0.07 0.81 0.15(0.270) (0.054) (0.586) (0.989) (0.836) (0.825)
LagCas -0.12 -0.11(0.369) (0.416)
LagKill -0.09(0.460)
LagOut ***0.31
Controls Y Y Y Y Y Y
0-28

A General Malaise?
A counter-view:
Rise in Muslim income (controlling for Hindu) just a proxy foroverall Hindu stagnation.
Could imply an increase in social unrest quite generally
(not just in Hindu-Muslim conflict)
Concomitant rise in Hindu-Muslim conflict is just a byproductof this overall uptick in social unease
Therefore not interpretable as directed violence.
Test by using GOI dataset on Crime in India
Has data on “all riots”.
(Doesn’t publish data on religious violence!)
0-29

Effect of group incomes on all riots:
[1]Poisson
[2]Poisson
[3]Neg. Bin.
[4]Neg. Bin.
[5]OLS
[6]OLS
HExp ***0.75 -0.53 0.37(0.007) (0.448) (0.467)
MExp -0.19 -0.12 -0.12(0.301) (0.607) (0.617)
M/H -0.23 -0.09 -0.12(0.202) (0.702) (0.642)
Pce *0.52 -0.68 0.39(0.072) (0.243) (0.287)
Pop 0.06 0.06 0.50 0.52 0.73 0.70(0.910) (0.912) (0.221) (0.149) (0.314) (0.336)
RelPol *-0.64 *-0.62 0.20 0.17 0.12 0.14(0.051) (0.056) (0.721) (0.744) (0.839) (0.815)
GiniH **-1.63 *-1.56 0.85 0.84 0.19 0.14(0.046) (0.058) (0.594) (0.562) (0.902) (0.928)
GiniM -0.74 -0.76 0.35 0.36 0.61 0.55(0.307) (0.293) (0.717) (0.671) (0.441) (0.495)
Lit, Urb Y Y Y Y Y Y
0-30
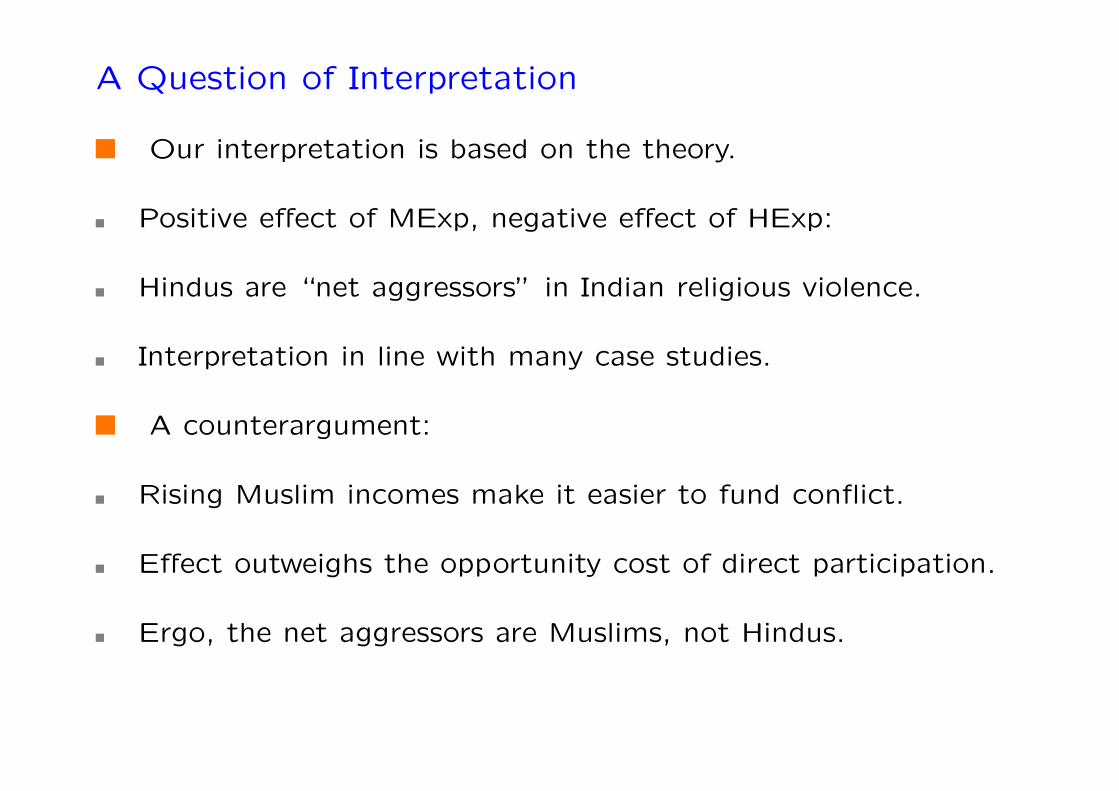
A Question of Interpretation
Our interpretation is based on the theory.
Positive effect of MExp, negative effect of HExp:
Hindus are “net aggressors” in Indian religious violence.
Interpretation in line with many case studies.
A counterargument:
Rising Muslim incomes make it easier to fund conflict.
Effect outweighs the opportunity cost of direct participation.
Ergo, the net aggressors are Muslims, not Hindus.
0-31

Funding of conflict reasonable (on both sides).
But does it explain what we observe?
1. Recall: HExp enters negatively.
So if funding is responsible, the corresponding effect is obliter-ated and reversed for Hindu groups.
Possible, but in light of the fact that Muslims are by far thelarger losers in outbreaks of violence, unlikely.
2. Gulf funding.
Taken out by the time fixed effect + instrument.
3. “Internal funding” by local groups:
Examine this in two ways.
0-32

Internal Funding: Theory
Proposition. An increase in group incomes that causes boththe funding requirement f and aggressor income z to rise in equalproportion, must reduce attacks perpetrated by members of thatgroup.
(Formal argument uses constant-elasticity utility.)
Counterargument to Proposition. Either:
Paid attackers not from the same religious group, or
Funding pays for non-human inputs into violence.
0-33

Dealing with the counterargument:
Proposition. Suppose that f is unchanging with z.
Then, as z goes up: participation −→ peace −→ funding.
z
d(z)
m(z)
u(z)
Implication: the positive coefficient on M-Exp should be height-ened for relatively rich regions.
0-34

OLS Poisson[1]All
[2]Non-Low
[3]Non-High
[4]All
[5]Non-Low
[6]Non-High
HExp *-8.46 **-10.06 *-10.21 ***-6.82 **-5.13 ***-7.18(0.085) (0.037) (0.061) (0.003) (0.019) (0.003)
MExp ***9.52 ***10.55 **9.15 ***4.67 **3.31 ***4.80(0.009) (0.004) (0.021) (0.001) (0.015) (0.001)
Pop -1.23 -3.47 -2.25 3.91 -4.33 3.62(0.877) (0.630) (0.784) (0.496) (0.118) (0.538)
RelPol 6.68 5.60 5.79 *5.57 1.83 *5.43(0.408) (0.588) (0.505) (0.056) (0.366) (0.071)
GiniH -14.47 -16.79 -13.97 -5.43 2.01 -5.66(0.342) (0.328) (0.388) (0.317) (0.719) (0.295)
GiniM -11.07 -17.32 -9.56 3.40 5.47 3.95(0.451) (0.250) (0.549) (0.497) (0.222) (0.429)
Lit, Urb Y Y Y Y Y Y
0-35

A Summary
Economic development fundamentally uneven.
Large effects on aspirations.
Occupational choice is a slow process.
So conflict predicted under uneven development.
Us and Them, profoundly contextual.
Direct contestability creates antagonism across similar groups.
And non-class conflict, including ethnic conflict, may be focal.
A research agenda in development economics cannot ignorethis question of salience.
0-36