Embed Size (px)
Citation preview

Development and
Evaluation of Longitudinal
Joint Sealant in Illinois
PHYSICAL RESEARCH REPORT NO. 168April 2019ORIGINAL REPORT NO. - PHYSICAL RESEARCH REPORT NO. I2004-01
ORIGINAL RELEASE DATE - January 2004

The Illinois Department of Transportation (IDOT) is continually looking for ways to improve long-term performance of pavements. One particular area of concern is the rapid deterioration of longitudinal joints in hot-mix asphalt (HMA) pavements. In 2001, IDOT performed several field trials on construction projects that were already underway. These trials included installing two different longitudinal joint sealant products for short segments to determine the constructability of the treatment. This report was published as an internal department report to capture the information for monitoring purposes. Additional projects were constructed using the materials from this report to evaluate them over longer test sections. A report on those additional projects was prepared and published separately, also as an internal department report. This treatment has seen exceptional performance in Illinois and a third report will be developed to document the long-term performance of these materials. This report is now being released externally to share the information from the early projects with other states. No revisions have been made to the content of the original report during this release.

Technical Report Documentation Page
1. Report No.
FHWA/IL/PRR-168 [I2004-01]2. Government Accession No. 3. Recipient's Catalog No.
4. Title and Subtitle
EVALUATION OF LONGITUDINAL JOINT SEALANT IN ILLINOIS5. Report Date
April 2019 [January 2004]6. Performing Organization Code
7. Author(s)
Laura Shanley, P.E.
8. Performing Organization Report No.
Physical Research Report No. 168 [I2004-01]
9. Performing Organization Name and Address 10. Work Unit ( TRAIS)
Illinois Department of Transportation
Bureau of Materials and Physical Research
11. Contract or Grant No.
126 East Ash Street
Springfield, Illinois 62704-4766
12. Sponsoring Agency Name and Address
Illinois Department of Transportation
Bureau of Materials and Physical Research
13. Type of Report and Period Covered
Final Report
June 2001 – November 2002
126 East Ash Street
Springfield, Illinois 62704-4766
14. Sponsoring Agency Code
15. Supplementary Notes
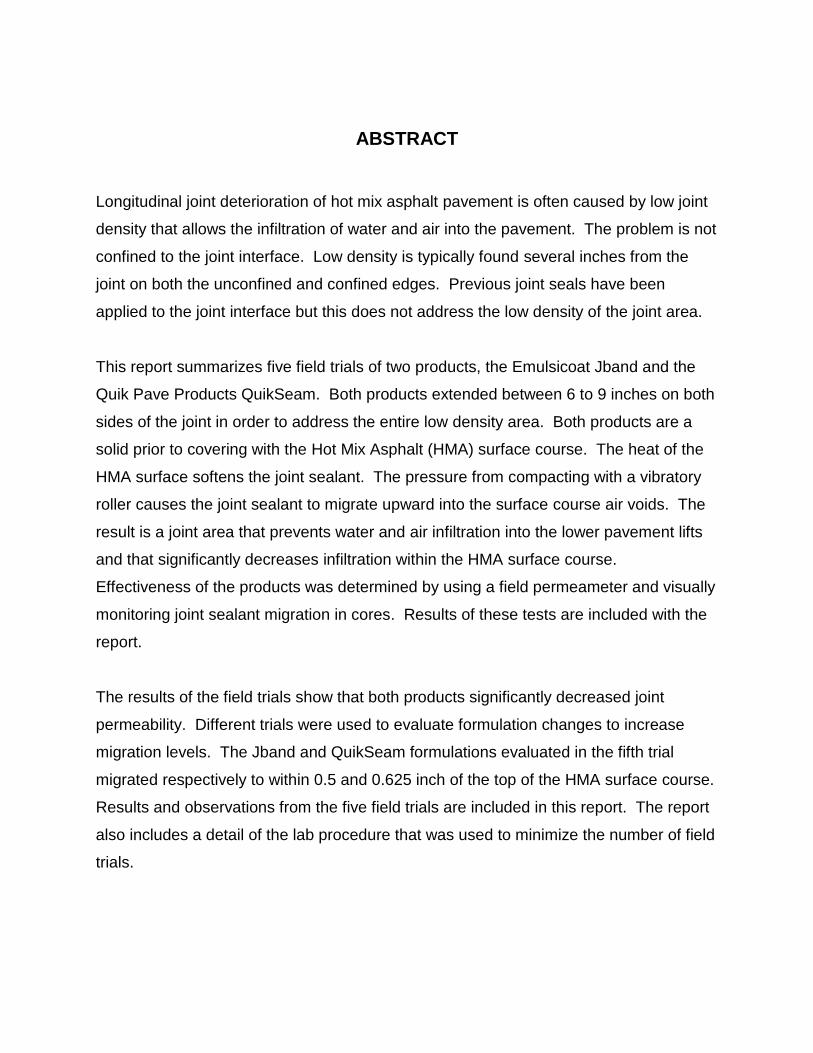
16. Abstract
Longitudinal joint deterioration of hot mix asphalt pavement is often caused by low joint density that allows the infiltration of water and air into the
pavement. The problem is not confined to the joint interface. Low density is typically found several inches from the joint on both the unconfined and
confined edges. Previous joint seals have been applied to the joint interface but this does not address the low density of the joint area.
This report summarizes five field trials of two products, the Emulsicoat Jband and the Quik Pave Products QuikSeam. Both products extended between 6
to 9 inches on both sides of the joint in order to address the entire low density area. Both products are a solid prior to covering with the Hot Mix Asphalt
(HMA) surface course. The heat of the HMA surface course softens the joint sealant. The pressure from compacting with a vibratory roller causes the
joint sealant to migrate upward into the surface course air voids. The result is a joint area that prevents water and air infiltration into the lower pavement
lifts and that significantly decreases infiltration within the HMA surface course. Effectiveness of the products was determined by using a field permeameter
and visually monitoring joint sealant migration in cores. Results of these tests are included with the report.
The results of the field trials show that both products significantly decreased joint permeability. Different trials were used to evaluate formulation changes
to increase migration levels. The Jband and QuikSeam formulations evaluated in the fifth trial migrated respectively to within 0.5 and 0.625 inch of the top
of the HMA surface course. Results and observations from the five field trials are included in this report. The report also includes a detail of the lab
procedure that was used to minimize the number of field trials.
17. Key Words
Joint sealant, joint deterioration, joint distress,permeability, density, longitudinal joints, Jband,QuikSeam, field permeameter.
18. Distribution Statement
No restrictions.
19. Security Classif. (of this report)
Unclassified
20. Security Classif. (of this page)
Unclassified
21. No. of Pages 22. Price
Form DOT F 1700.7 (8-72) Reproduction of completed page authorized
Final Report
Evaluation of Longitudinal Joint Sealant in Illinois
By:
Laura Shanley, PE
Bituminous Implementation Engineer
Illinois Department of Transportation
Bureau of Materials and Physical Research
Springfield, Illinois 62704
External Release Date: April 2019Original Internal Release Date: January 2004
ABSTRACT
Longitudinal joint deterioration of hot mix asphalt pavement is often caused by low joint
density that allows the infiltration of water and air into the pavement. The problem is not
confined to the joint interface. Low density is typically found several inches from the
joint on both the unconfined and confined edges. Previous joint seals have been
applied to the joint interface but this does not address the low density of the joint area.
This report summarizes five field trials of two products, the Emulsicoat Jband and the
Quik Pave Products QuikSeam. Both products extended between 6 to 9 inches on both
sides of the joint in order to address the entire low density area. Both products are a
solid prior to covering with the Hot Mix Asphalt (HMA) surface course. The heat of the
HMA surface softens the joint sealant. The pressure from compacting with a vibratory
roller causes the joint sealant to migrate upward into the surface course air voids. The
result is a joint area that prevents water and air infiltration into the lower pavement lifts
and that significantly decreases infiltration within the HMA surface course.
Effectiveness of the products was determined by using a field permeameter and visually
monitoring joint sealant migration in cores. Results of these tests are included with the
report.
The results of the field trials show that both products significantly decreased joint
permeability. Different trials were used to evaluate formulation changes to increase
migration levels. The Jband and QuikSeam formulations evaluated in the fifth trial
migrated respectively to within 0.5 and 0.625 inch of the top of the HMA surface course.
Results and observations from the five field trials are included in this report. The report
also includes a detail of the lab procedure that was used to minimize the number of field
trials.

TABLE OF CONTENTS
CONTENTS PAGE
Abstract ........................................................................................................ ii
Disclaimer / Acknowledgment ...................................................................... iv
List of Figures ............................................................................................... v
List of Tables ................................................................................................ vii
Executive Summary ..................................................................................... 1
Introduction .................................................................................................. 6
Testing ......................................................................................................... 9
Lab Permeameter ................................................................................ 9
Field Permeameter ............................................................................... 11
Density Testing .................................................................................... 13
Migration Measurement........................................................................ 13
Field Trials .................................................................................................... 18
IL 121/10 Lincoln Illinois ....................................................................... 18
IL 40 ..................................................................................................... 23
Retention Pond .................................................................................... 30
Lakes at Riverbend Subdivision ........................................................... 33
US 51 ................................................................................................... 36
Lab Procedure .............................................................................................. 48
Conclusions .................................................................................................. 54
Recommendations ....................................................................................... 58
References ................................................................................................... 59
Appendix A – US 51 Test Results ................................................................ A-1
Appendix B – Lab Procedure ....................................................................... B-1

iv
DISCLAIMER
The contents of this paper reflect the views of the author who is responsible for the facts
and accuracy of the data presented herein. The contents do not necessarily reflect the
official views, or policies, of the Illinois Department of Transportation or the Federal
Highway Administration. This report does not constitute a standard, specification, or
regulation.
ACKNOWLEDGEMENTS
The author would like to gratefully acknowledge Quik Pave Products Inc., especially
Harry Hendy, and Emulsicoat, especially Bill Pine, for their effort and material
donations; District 5, especially Scott Lackey, Steve Robinson, and Joel Sherer, for
finding test locations on IL 40 and US 51 and for helping with testing; District 6,
especially Jerry Parsons and Gary Burdine, for volunteering the IL 10/121 test location;
the Bureau of Materials and Physical Research Bituminous Lab, Bill Hayen, Tony
Karas, and Clay Snyder for lab testing; the Bureau of Materials and Physical Research
Chemistry Section , Vickie Prill, Dennis Oehmke, Violet Goodman for testing; and all the
construction personnel that made the projects possible. Also, the assistance of Joe
Rechner with testing and data collection was greatly appreciated along with that of Jim
Trepanier and Tom Zehr. Finally, the author would like to acknowledge the assistance
of Rick Borus, Amy Schutzbach, Jim Trepanier, and Tom Winkelman in manuscript
review.

v
LIST OF FIGURES
PAGE
Figure 1: Unconfined Edge ................................................................ 6
Figure 2: Cold Joint ............................................................................ 7
Figure 3: Roller Bridging at Joint ........................................................ 7
Figure 4: Joint Distress with Sealed Joint .......................................... 8
Figure 5: Low Joint Density Area ....................................................... 8
Figure 6: Preparing Lab Permeameter for Testing ............................. 10
Figure 7: Timing Drop in Water Height of Lab Permeameter ............. 10
Figure 8: Illinois Field Permeameter .................................................. 12
Figure 9: Applying Silicone ................................................................ 12
Figure 10: Measuring Water Fall in Standpipe ..................................... 13
Figure 11: Breaking Cores ................................................................... 14
Figure 12: Joint Sealant Migration ....................................................... 15
Figure 13: Migration is Marked ............................................................ 15
Figure 14: Core Sectioning (Core Folded in Half) ................................ 16
Figure 15: IR Analysis .......................................................................... 17
Figure 16: Sample Placement .............................................................. 18
Figure 17: Samples after Paving First Lane ......................................... 19
Figure 18: Joint Sealant Elasticity ........................................................ 19
Figure 19: Final Mat Showing Sample Locations ................................. 20
Figure 20: Testing Layout and Permeability Results ............................ 21
Figure 21: Field Permeameter Water Resurfaces along the Joint ....... 21
Figure 22: Plastic Backing Did Not Melt ............................................... 22
Figure 23: IL 121/10 Permeability Results ........................................... 23
Figure 24: IL 40 Paving over Joint Sealant Formulations ..................... 24
Figure 25: IL 40 after Coring Test Locations ........................................ 25
Figure 26: IL 40 Joint Testing Detail .................................................... 25
Figure 27: IL 40 Mainline Testing ......................................................... 28
Figure 28: IL 40 Joint Sealant Migration .............................................. 29
vi
Figure 29: Retention Pond Paving ....................................................... 30
Figure 30: Jband Placement ................................................................ 31
Figure 31: Jband after Placement ........................................................ 31
Figure 32: Retention Pond Test Layout ............................................... 32
Figure 33: Retention Pond Joint Variability .......................................... 33
Figure 34: Subdivision Jband Testing .................................................. 33
Figure 35: Subdivision Testing Layout ................................................. 34
Figure 36: Subdivision Control Permeability ........................................ 35
Figure 37: Subdivision Permeability Summary .................................... 36
Figure 38: US 51 Test Section Layout ................................................. 37
Figure 39: US 51 Jband Placement ..................................................... 38
Figure 40: US 51 Paving over Jband ................................................... 38
Figure 41: US 51 QuikSeam Placement .............................................. 39
Figure 42: US 51 Second Application of QuikSeam ............................ 39
Figure 43: QuikSeam Typical Layout ................................................... 40
Figure 44: US 51 Jband Applied at Median ......................................... 40
Figure 45: US 51 Jband Median Placement ........................................ 41
Figure 46: Joint Sealant Tracking ........................................................ 41
Figure 47: Joint Sealant Softens under HMA Surface.......................... 42
Figure 48: US 51 Joint Sealant Testing Layout .................................... 43
Figure 49: Joint Sealant Normal Distributions ...................................... 45
Figure 50: Jband Migration .................................................................. 46
Figure 51: QuikSeam Formula 1 Migration .......................................... 46
Figure 52: QuikSeam Formula 2 Migration .......................................... 47
Figure 53: Joint Sealant Mold and Sample .......................................... 49
Figure 54: 5005 Bottom View ............................................................... 50
Figure 55: 5005 Side View ................................................................... 51
Figure 56: 5005 after Splitting .............................................................. 51
Figure 57: 4004 vs. 5005 ..................................................................... 52
Figure 58: 4004 Side View ................................................................... 52
Figure 59: 4004 after Splitting .............................................................. 53

vii
LIST OF TABLES
PAGE
Table 1: IL 40 Test Results ............................................................... 26
Table 2: Subdivision Permeability Results ........................................ 34
Table 3: US 51 Average Test Results ............................................... 44

1
EXECUTIVE SUMMARY
Longitudinal joint deterioration of Hot Mix Asphalt (HMA) pavement has been observed
as a problem throughout Illinois. The problem at the longitudinal joint is the low density
that allows the infiltration of water and air into the pavement. The infiltration of water
may affect the durability of the pavement by causing stripping which can lead to
cracking and raveling. Infiltration of air can produce a higher rate of oxidation that
causes the asphalt binder to become brittle and increases the potential for cracking.
The infiltration of water and air can shorten the life-span of the pavement.
The problem of longitudinal joint deterioration is not confined to the joint interface. Low
density is typically found several inches from the joint on both the unconfined and
confined edges. Previous joint seals have been applied to the joint interface but this
does not address the low density of the surrounding joint area.
Two products, the Emulsicoat Jband and the Quik Pave Products QuikSeam, were
evaluated to determine the potential in minimizing joint deterioration. Both products
extended between 6 to 9 inches on both sides of the joint in order to address the entire
low density area. Both products are a solid prior to covering with the HMA surface. The
heat of the HMA surface softens the joint sealant. The pressure from compacting with a
vibratory roller causes the joint sealant to migrate upward into the surface voids. The
result is a joint area that prevents water and air infiltration into the lower pavement lifts
and that significantly decreases infiltration within the HMA surface course.
Five field trials were used to evaluate various formulations of the two products. The
formulation was changed after each trial to improve migration height into the HMA
surface course. Changes made to the joint sealant formulations were the sole
responsibility of the Supplier. The Illinois Department of Transportation (IDOT)
specified the desired result of the product but was not involved in determining what
changes to make to the formulations. The goal was to create a product that would
soften and melt upwards into the HMA surface course, but would remain stiff enough to
2
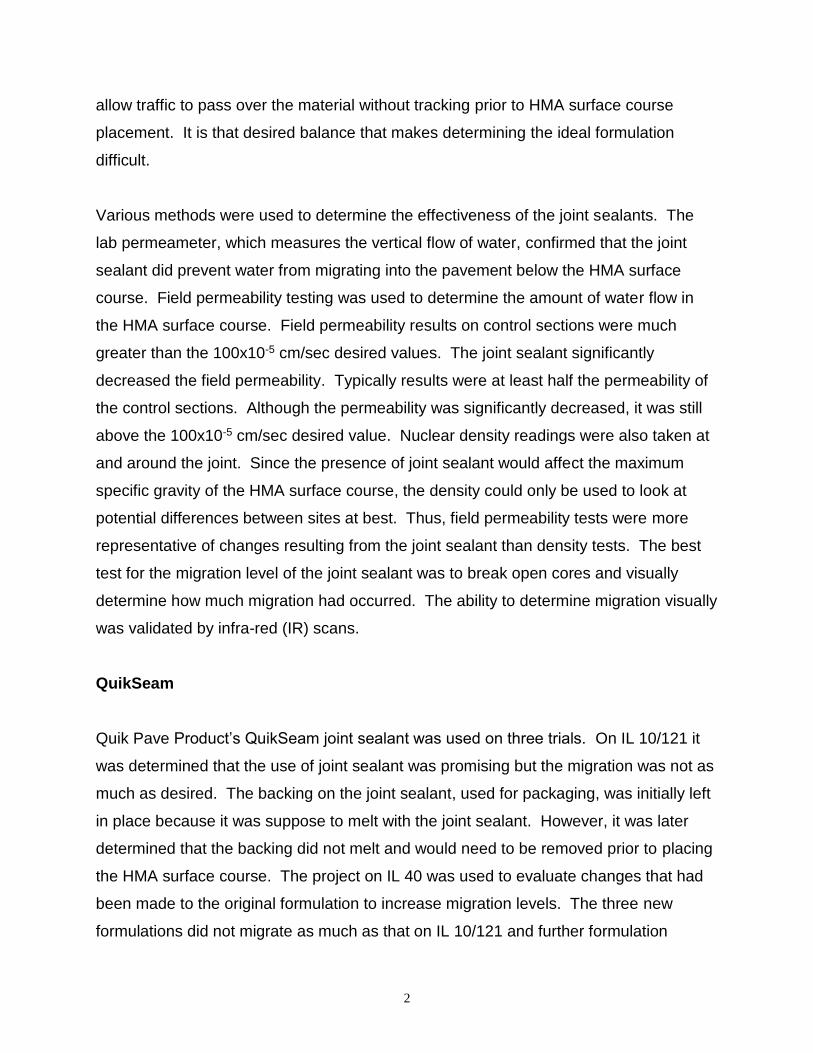
allow traffic to pass over the material without tracking prior to HMA surface course
placement. It is that desired balance that makes determining the ideal formulation
difficult.
Various methods were used to determine the effectiveness of the joint sealants. The
lab permeameter, which measures the vertical flow of water, confirmed that the joint
sealant did prevent water from migrating into the pavement below the HMA surface
course. Field permeability testing was used to determine the amount of water flow in
the HMA surface course. Field permeability results on control sections were much
greater than the 100x10-5 cm/sec desired values. The joint sealant significantly
decreased the field permeability. Typically results were at least half the permeability of
the control sections. Although the permeability was significantly decreased, it was still
above the 100x10-5 cm/sec desired value. Nuclear density readings were also taken at
and around the joint. Since the presence of joint sealant would affect the maximum
specific gravity of the HMA surface course, the density could only be used to look at
potential differences between sites at best. Thus, field permeability tests were more
representative of changes resulting from the joint sealant than density tests. The best
test for the migration level of the joint sealant was to break open cores and visually
determine how much migration had occurred. The ability to determine migration visually
was validated by infra-red (IR) scans.
QuikSeam
Quik Pave Product’s QuikSeam joint sealant was used on three trials. On IL 10/121 it
was determined that the use of joint sealant was promising but the migration was not as
much as desired. The backing on the joint sealant, used for packaging, was initially left
in place because it was suppose to melt with the joint sealant. However, it was later
determined that the backing did not melt and would need to be removed prior to placing
the HMA surface course. The project on IL 40 was used to evaluate changes that had
been made to the original formulation to increase migration levels. The three new
formulations did not migrate as much as that on IL 10/121 and further formulation

3
changes were needed. Both the IL 10/121 and IL 40 consisted of small joint sealant
samples less than 3 feet in length. The third trial on US 51 consisted of 100-foot test
sections and two different formulations were evaluated. The material on the US 51
project was applied in two 9-inch wide applications. The first application consisted of
placing a 9-inch strip so that approximately 2 inches of joint sealant would remain
exposed after the first lane was paved. The second application was placed adjacent to
the first application and lapped up onto the edge of the first lane paved to allow for more
joint sealant at the joint interface. The downside of two applications was the additional
labor. The upside of two applications was the additional material at the joint. The best
migration of the QuikSeam occurred on US 51 with one of the formulations migrating to
within 5/8 inch of the top of the HMA surface. The surface was 1 ½ inches thick so the
original 3/16 inch of material migrated to a height of approximately 7/8 inch.
Jband
Emulsicoat’s Jband product was used on three trials. The initial trial was placed under
the flooring surface course of a retention pond in Indiana. The Jband material did
migrate high enough in some areas to cause flushing. Since the HMA surface course
material used for the retention pond had lower voids and higher asphalt content than
typical IDOT HMA surface course mixtures, the results of the Jband on this project were
inconclusive. The project at the Lakes at Riverbend subdivision in Mahomet, Illinois
was used to evaluate Jband when using a conventional IDOT HMA surface course.
Approximately 525 feet of Jband was applied at the centerline joint. While the Jband
did decrease permeability, the migration height into the surface was not as high as
desired. The Jband did not appear to have tracking problems but the project was also
done in the cool weather of November which may have been a factor. The third project
on US 51 consisted of two 100-foot test sections. One test section consisted of placing
Jband 12 inches wide while the other section consisted of placing Jband 18 inches
wide. The best migration of the Jband was observed on the US 51 project as the Jband
migrated to within ½ inch of the top of the HMA surface. The surface was 1 ½ inches
thick so the original 3/16 inch of material migrated to a height of approximately 1 inch.

4
Lab Procedure
Field trials were very time and labor intensive. A lab procedure was developed based
on the material and migration levels of the Jband at the Lakes at Riverbend subdivision.
The lab procedure was a good tool to determine if formulation changes were worth
taking to the field. Several joint sealant formulations were never tested in the field
because the lab procedure indicated there would be little, if any, additional migration
from previous formulations. Since the joint sealant migration is sensitive to construction
practices, the lab procedure is only a relative measurement of change and not directly
related to field migration. The lab procedure helped to determine the formulations that
were used on US 51. The migrations of both the QuikSeam and the Jband were better
than experienced on previous trials. Further verification of the lab procedure to better
predict other potential formulations and products is recommended.
Conclusion
Overall, it was determined that the joint sealant was more effective in decreasing
permeability than applying an extra bituminous prime coat or applying nothing at all.
Construction practices may affect migration. The amount of heat transferred from the
overlying HMA surface course and the pressure applied by the rollers have a large
affect on the amount of joint sealant migration that occurs. The heat provides the ability
for the joint sealant to melt and the pressure provides the necessary force to promote
migration. However, the ability of the various joint sealants to withstand traffic without
tracking still remains a concern. An evaluation of tracking would be more effective with
larger test sections. Thus a demonstration project utilizing a longer test section to fully
evaluate constructability issues is recommended. Additional formulation adjustment to
maximize migration while minimizing tracking is also recommended. Based on the
previous trials, a larger scale test section would help to better evaluate placement and
construction issues. It is not recommended to implement the use of joint sealant until
constructability issues and cost effectiveness are evaluated. Finally, performing yearly

5
visits to the various field trials to monitor and document performance is also
recommended.

6
INTRODUCTION
Longitudinal joint deterioration of Hot Mix Asphalt (HMA) pavement has been observed
as a problem throughout Illinois. The problem at the longitudinal joint is the low density
that allows the infiltration of water and air into the pavement. The infiltration of water
may affect the durability of the pavement by causing stripping, which can lead to
cracking and raveling. Infiltration of air can produce a higher rate of oxidation that
causes the asphalt binder to become brittle and increases the potential for cracking.
The infiltration of water and air can shorten the life-span of the pavement. Joints are
especially susceptible to low density for several reasons: 1) The first lane placed has
an unconfined edge that can push outwards when rolling, as shown if Figure 1. Pushing
out produces a thinner mat in the joint area and the lack of confinement makes
achieving density difficult. 2) When a lane is placed against a previously placed lane
that has been allowed to cool, a cold joint with poor adhesion is formed. Cold joints
often result in a natural cracking location (Figure 2), since the material does not meld
together. 3) Bridging may occur at the joint if the two matching lanes are uneven. If
the joint is uneven or if the roller goes too far over onto the previously placed mat, the
roller may lose contact with the material at the joint so compaction cannot occur. Figure
3 exaggerates the bridging effect.
Figure 1: Unconfined Edge
Pushed
Outward
7
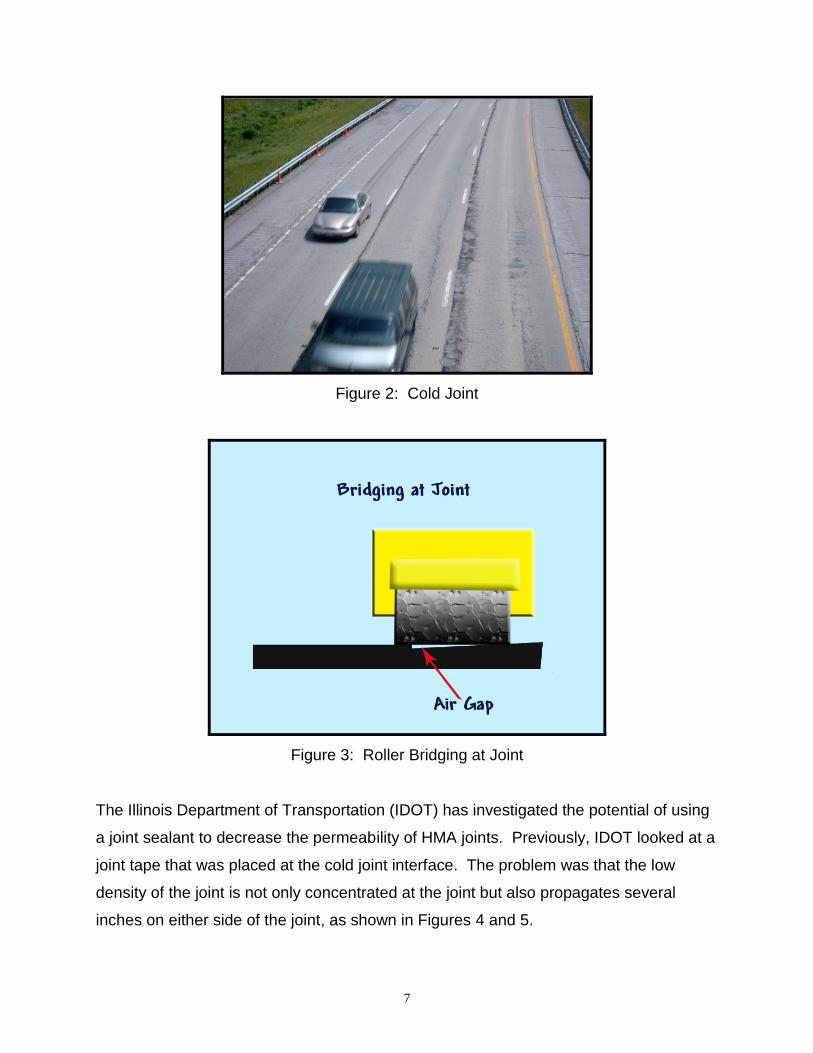
Figure 2: Cold Joint
Figure 3: Roller Bridging at Joint
The Illinois Department of Transportation (IDOT) has investigated the potential of using
a joint sealant to decrease the permeability of HMA joints. Previously, IDOT looked at a
joint tape that was placed at the cold joint interface. The problem was that the low
density of the joint is not only concentrated at the joint but also propagates several
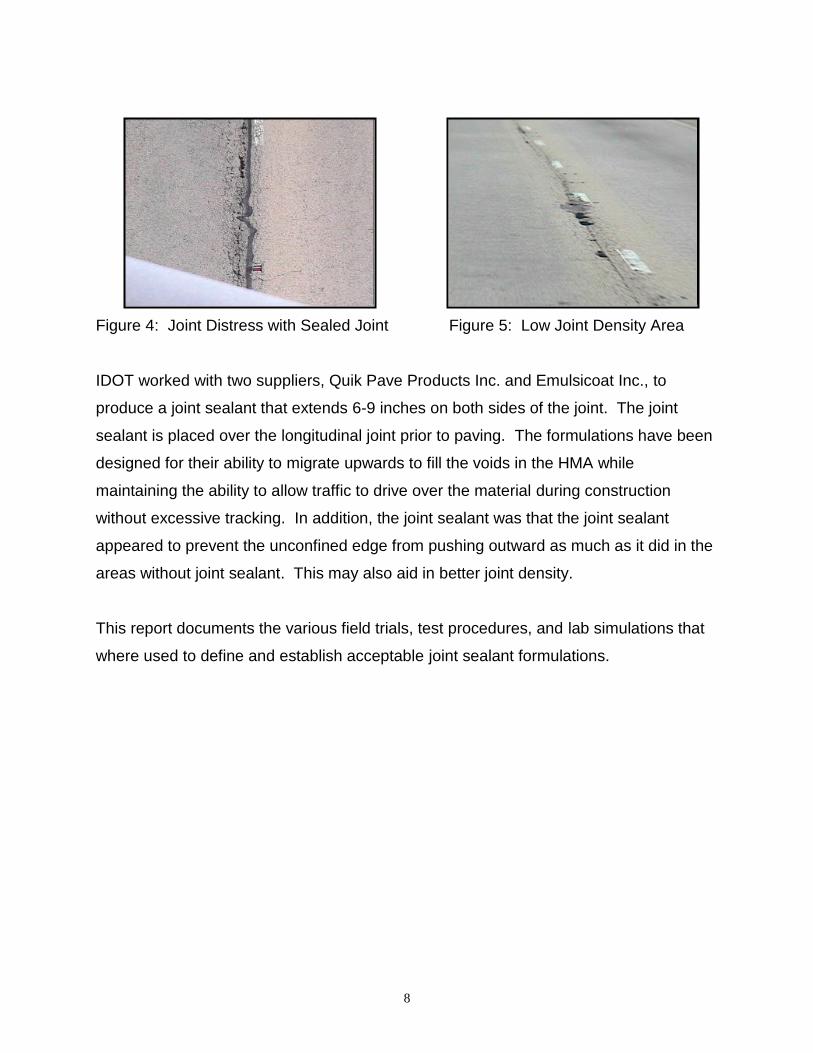
inches on either side of the joint, as shown in Figures 4 and 5.
8
Figure 4: Joint Distress with Sealed Joint Figure 5: Low Joint Density Area
IDOT worked with two suppliers, Quik Pave Products Inc. and Emulsicoat Inc., to
produce a joint sealant that extends 6-9 inches on both sides of the joint. The joint
sealant is placed over the longitudinal joint prior to paving. The formulations have been
designed for their ability to migrate upwards to fill the voids in the HMA while
maintaining the ability to allow traffic to drive over the material during construction
without excessive tracking. In addition, the joint sealant was that the joint sealant
appeared to prevent the unconfined edge from pushing outward as much as it did in the
areas without joint sealant. This may also aid in better joint density.
This report documents the various field trials, test procedures, and lab simulations that
where used to define and establish acceptable joint sealant formulations.

9
TESTING
LAB PERMEAMETER
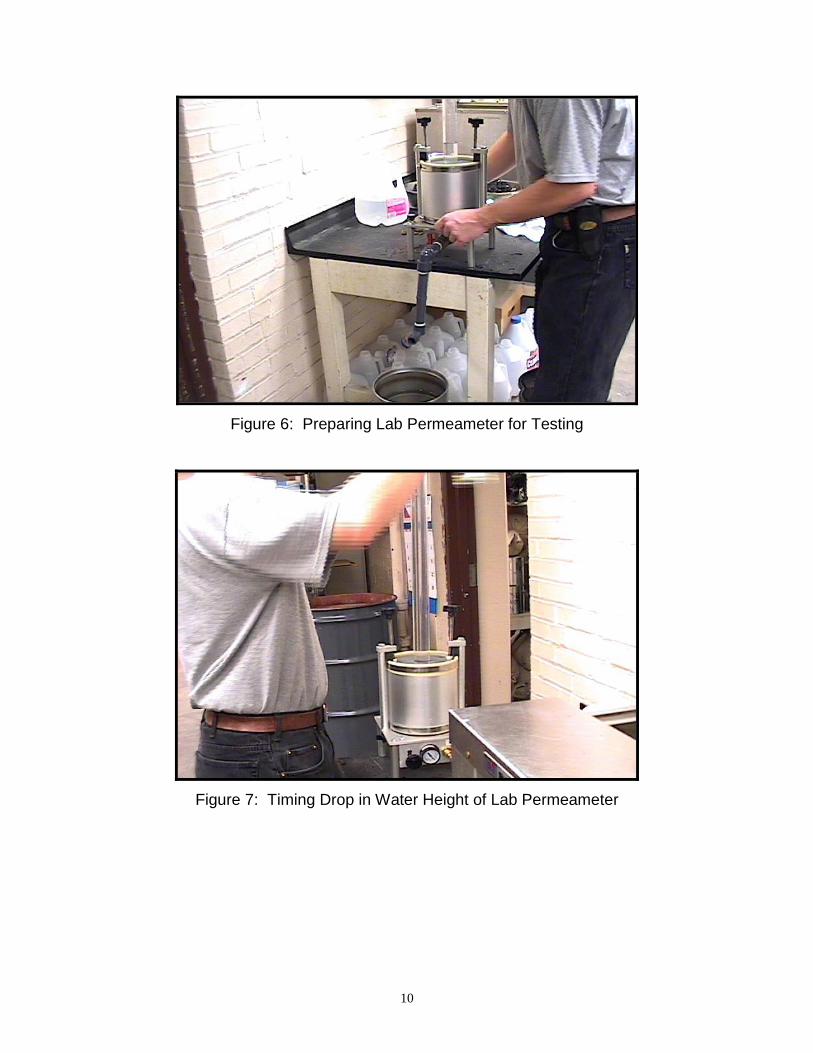
The lab permeameter is a falling head device that measures the drop in water level with
time using Equation 1 to determine the pavement permeability. An apparatus designed
from the Florida prototype was purchased by IDOT to investigate permeability in Illinois,
as shown in Figures 6 – 7. A 6-inch diameter specimen is placed in the device. A
rubber membrane between the specimen and cylinder wall is inflated to prevent water
from flowing out of the sides of the specimen. The lab permeameter measures vertical
flow through a specimen. The lab permeameter was used in earlier trials of joint sealant
to demonstrate that the joint sealant would prevent water infiltration of the base
material.
[Equation 1]
where:
k = coefficient of permeability, cm/sec (x10-5) a = inside cross section of standpipe, cm2 L = lift thickness, cm A = cross section of contact area that water can flow into the pavement, cm2 t = elapsed time between h1 and h2 h1 = initial head, cm h2 = final head, cm
2
1lnh
h
At
aLk
10
Figure 6: Preparing Lab Permeameter for Testing
Figure 7: Timing Drop in Water Height of Lab Permeameter
11
FIELD PERMEAMETER
The field permeameter is a falling head device that measures the drop in water level
with time using equation 1, just like the lab permeameter. A large difference between
the field permeameter and the lab permeameter is that the lab permeameter only
measures vertical flow through a specimen while the field permeameter allows both
vertical and horizontal flow. The Illinois field permeameter was developed using three
different diameter standpipes, as per an early National Center for Asphalt Technology
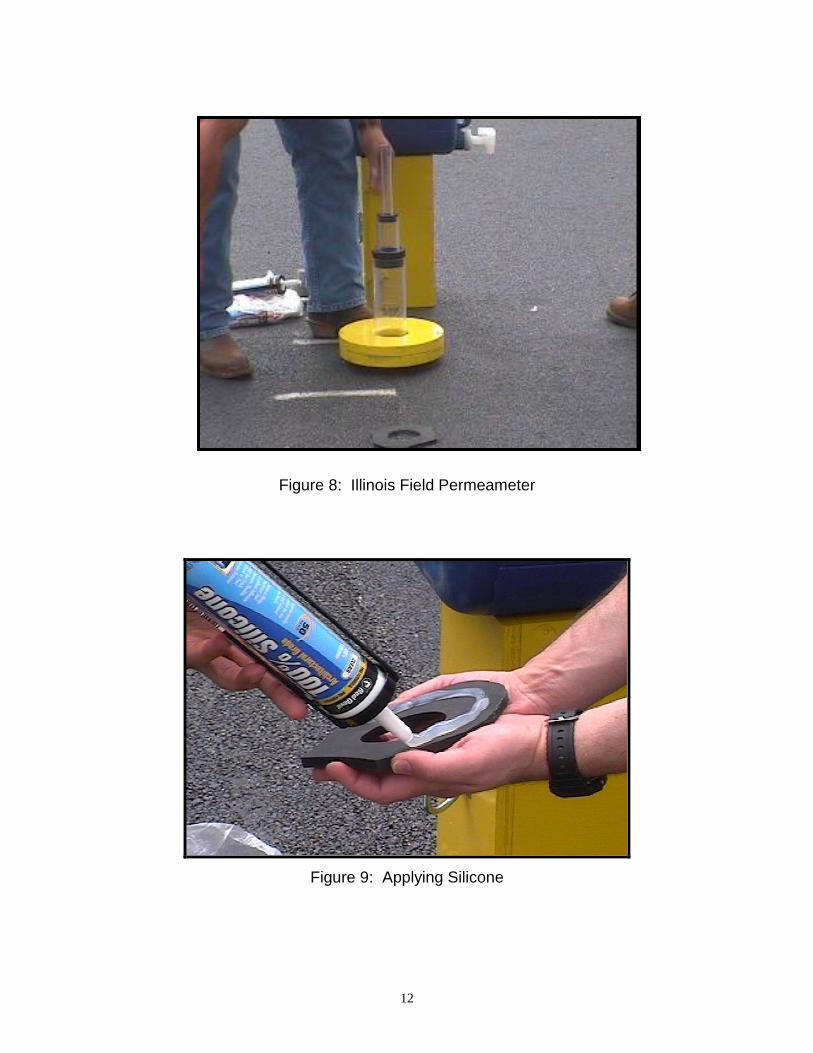
(NCAT) prototype. The Illinois permeameter is shown in Figure 8. Silicone is used to
seal a neoprene gasket to the pavement as shown in Figure 9. Two 10-pound weights
are placed over the base to ensure that no water is able to escape under the apparatus
or between the pavement and the neoprene gasket. The three different sized
standpipes allow the device to measure low, medium, and high permeability levels.
Each standpipe is marked for specific height changes.
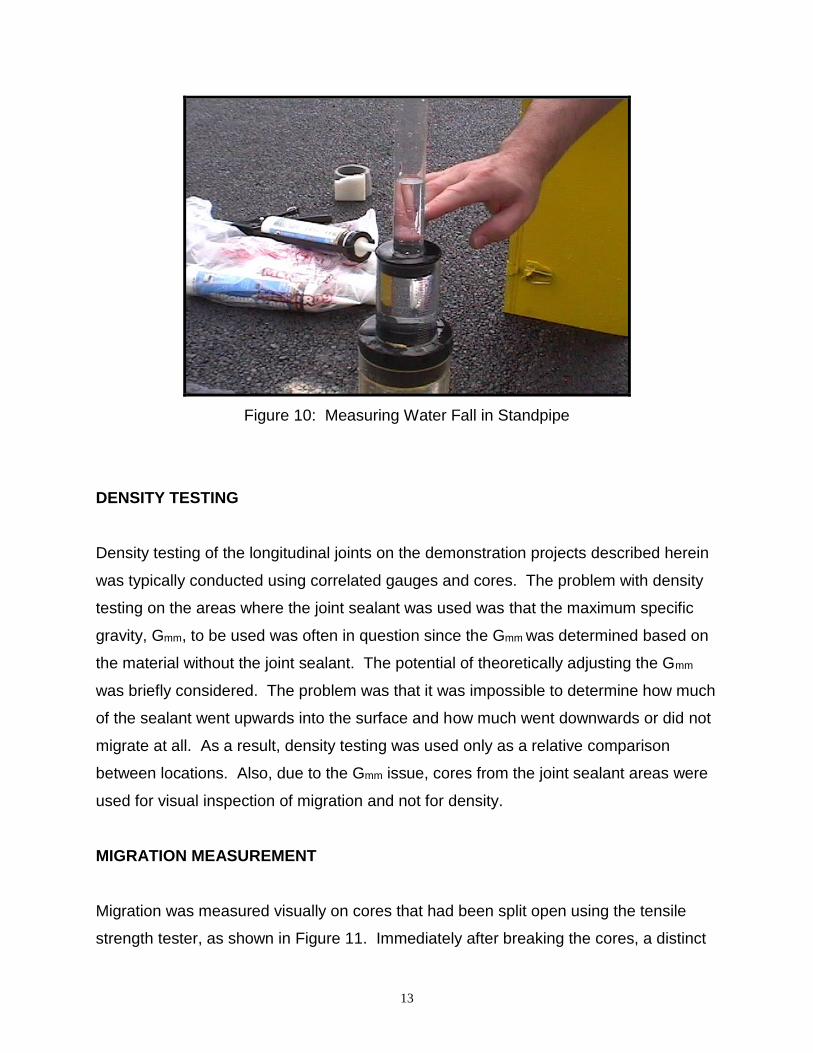
Figure 10 illustrates the top standpipe being used to determine permeability of a low
permeability pavement. When the drop in height is too quick to measure in the top
standpipe, the middle or bottom standpipe is used depending on the level of
permeability. It is possible to use a larger standpipe than necessary, but it increases
the time to run a test.
12
Figure 8: Illinois Field Permeameter
Figure 9: Applying Silicone
13
Figure 10: Measuring Water Fall in Standpipe
DENSITY TESTING
Density testing of the longitudinal joints on the demonstration projects described herein
was typically conducted using correlated gauges and cores. The problem with density
testing on the areas where the joint sealant was used was that the maximum specific
gravity, Gmm, to be used was often in question since the Gmm was determined based on
the material without the joint sealant. The potential of theoretically adjusting the Gmm
was briefly considered. The problem was that it was impossible to determine how much
of the sealant went upwards into the surface and how much went downwards or did not
migrate at all. As a result, density testing was used only as a relative comparison
between locations. Also, due to the Gmm issue, cores from the joint sealant areas were
used for visual inspection of migration and not for density.
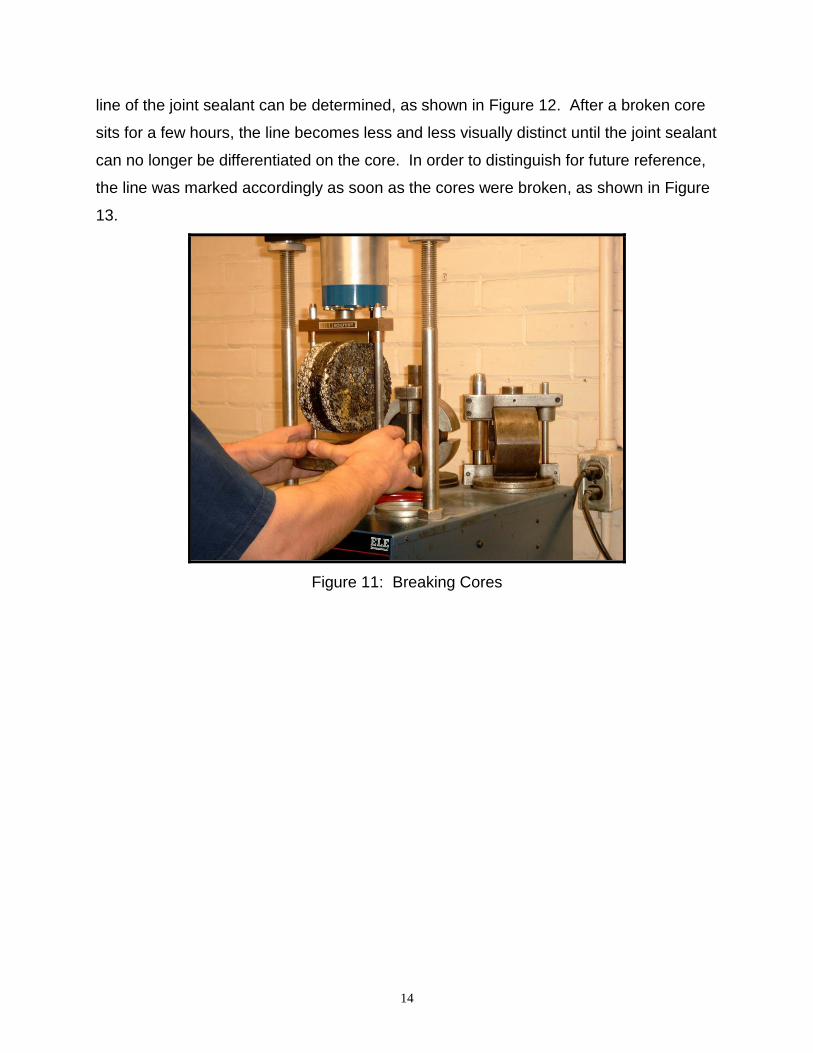
MIGRATION MEASUREMENT
Migration was measured visually on cores that had been split open using the tensile
strength tester, as shown in Figure 11. Immediately after breaking the cores, a distinct
14
line of the joint sealant can be determined, as shown in Figure 12. After a broken core
sits for a few hours, the line becomes less and less visually distinct until the joint sealant
can no longer be differentiated on the core. In order to distinguish for future reference,
the line was marked accordingly as soon as the cores were broken, as shown in Figure
13.
Figure 11: Breaking Cores

15
Figure 12: Joint Sealant Migration
Figure 13: Migration is Marked
Migration

16
It was a concern that the actual migration may be greater than what the visual
appearance indicated. Infra-red (IR) spectra scans were used to verify that the actual
migration could be determined visually. The resultant spectra, or graphical
representation, is unique for each substance and is based on specific functional groups
in its molecular structure. It is considered as the substance’s fingerprint.
Three cores containing different joint sealant formulations and a control core sample
without joint sealer were used for the IR scan. Core samples that contain joint sealer
were broken open and marked at the level of visual migration. For each core, a six-
gram sample was taken from the top section, middle section, and between the visual
lines of migration, as shown in Figure 14. Each sample was dissolved in 10 ml of TCE
(trichloroethylene). The solution was mixed and centrifuged at high speed for 10
minutes to completely separate out the aggregates and other fines. Two to three drops
of clear supernatant liquid were placed on a KBr plate, dried in the oven at 75C for 10
minutes, and then analyzed using a Fourier Transform Infra-Red (FTIR) spectrometer.
Neat samples of the joint sealant were also analyzed in the same manner.
Top Section
Middle Section
Visual Joint
Sealant Migration
Top Section
Middle Section
Top of Pavement
Top of Pavement
Figure 14: Core Sectioning (Core Folded in Half)
17
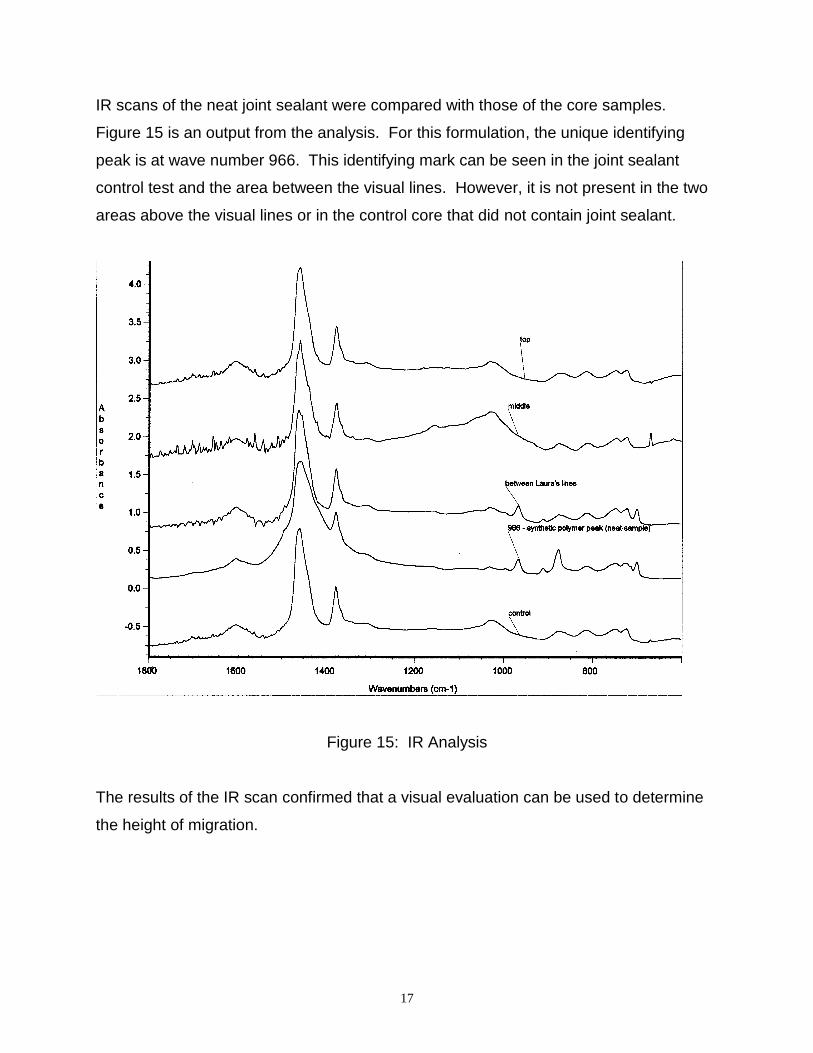
IR scans of the neat joint sealant were compared with those of the core samples.
Figure 15 is an output from the analysis. For this formulation, the unique identifying
peak is at wave number 966. This identifying mark can be seen in the joint sealant
control test and the area between the visual lines. However, it is not present in the two
areas above the visual lines or in the control core that did not contain joint sealant.
Figure 15: IR Analysis
The results of the IR scan confirmed that a visual evaluation can be used to determine
the height of migration.
18
FIELD TRIALS
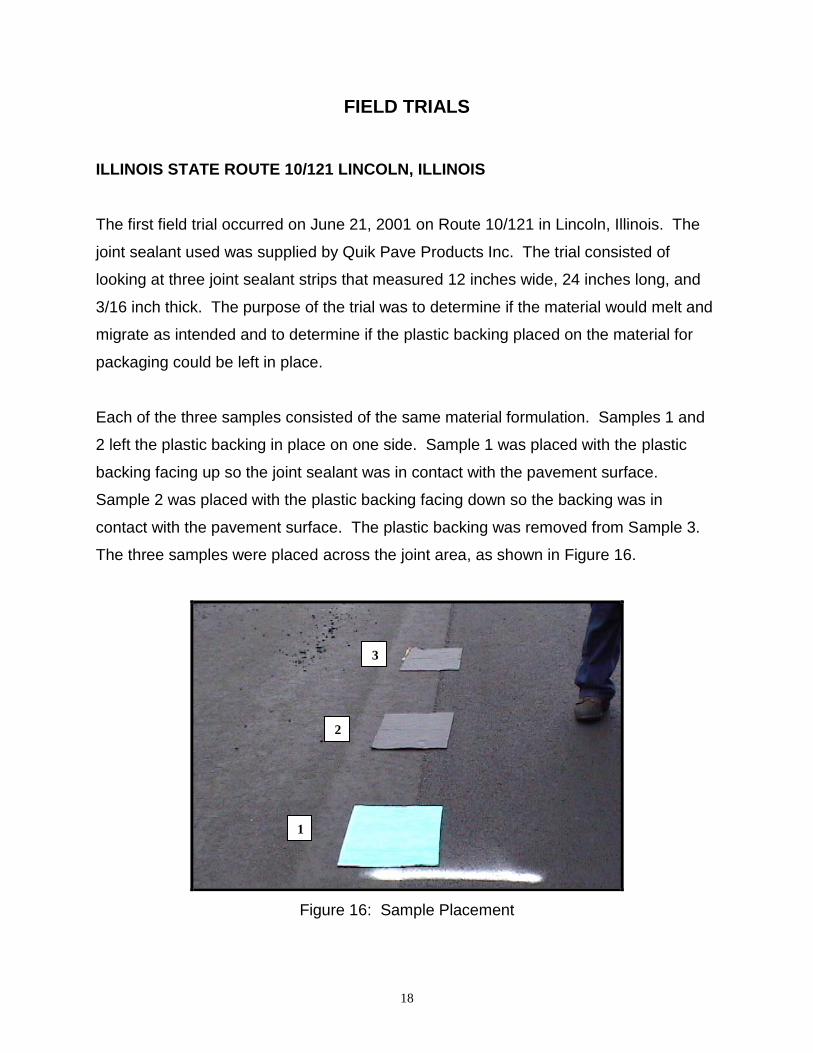
ILLINOIS STATE ROUTE 10/121 LINCOLN, ILLINOIS
The first field trial occurred on June 21, 2001 on Route 10/121 in Lincoln, Illinois. The
joint sealant used was supplied by Quik Pave Products Inc. The trial consisted of
looking at three joint sealant strips that measured 12 inches wide, 24 inches long, and
3/16 inch thick. The purpose of the trial was to determine if the material would melt and
migrate as intended and to determine if the plastic backing placed on the material for
packaging could be left in place.
Each of the three samples consisted of the same material formulation. Samples 1 and
2 left the plastic backing in place on one side. Sample 1 was placed with the plastic
backing facing up so the joint sealant was in contact with the pavement surface.
Sample 2 was placed with the plastic backing facing down so the backing was in
contact with the pavement surface. The plastic backing was removed from Sample 3.
The three samples were placed across the joint area, as shown in Figure 16.
Figure 16: Sample Placement
1
3
2

19
Half of the joint sealant was paved over as the first lane was placed. Figure 17
illustrates the affect of the unconfined mat pushing out under the weight of the roller.
Sample 2 (plastic backing side down) acted as a slip plane between lifts and allowed
the mat to push out. Sample 1 (plastic backing side up) had a small effect in preventing
the mat from pushing out. While, sample 3 (no plastic backing) had the largest effect in
preventing the typical push out resulting from an unconfined edge.
Figure 17: Samples after Paving First Lane
The material did become softer from the heat of the HMA. The elasticity of the material
indicates the presence of polymers, as shown in Figure 18.
Figure 18: Joint Sealant Elasticity
1
2
3
20
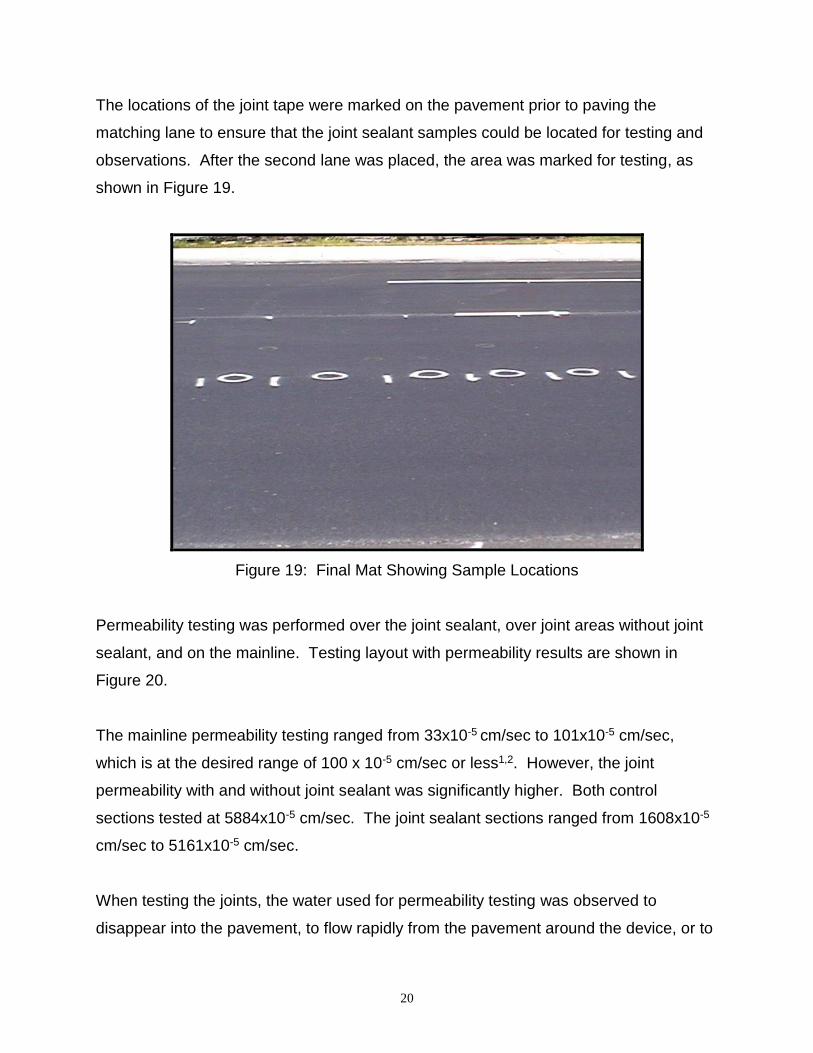
The locations of the joint tape were marked on the pavement prior to paving the
matching lane to ensure that the joint sealant samples could be located for testing and
observations. After the second lane was placed, the area was marked for testing, as
shown in Figure 19.
Figure 19: Final Mat Showing Sample Locations
Permeability testing was performed over the joint sealant, over joint areas without joint
sealant, and on the mainline. Testing layout with permeability results are shown in
Figure 20.
The mainline permeability testing ranged from 33x10-5 cm/sec to 101x10-5 cm/sec,
which is at the desired range of 100 x 10-5 cm/sec or less1,2. However, the joint
permeability with and without joint sealant was significantly higher. Both control
sections tested at 5884x10-5 cm/sec. The joint sealant sections ranged from 1608x10-5
cm/sec to 5161x10-5 cm/sec.
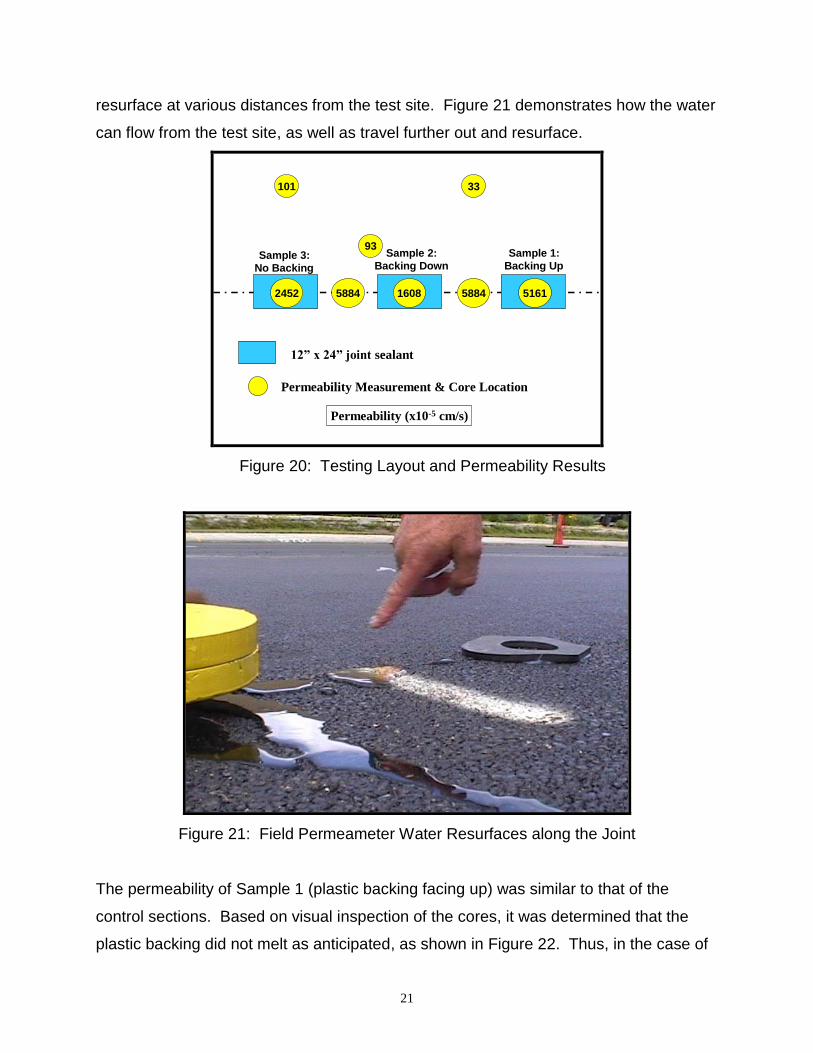
When testing the joints, the water used for permeability testing was observed to
disappear into the pavement, to flow rapidly from the pavement around the device, or to
21
resurface at various distances from the test site. Figure 21 demonstrates how the water
can flow from the test site, as well as travel further out and resurface.
2452
101 33
93
12” x 24” joint sealant
Permeability Measurement & Core Location
Permeability (x10-5 cm/s)
16085884 51615884
Sample 3:
No Backing
Sample 2:
Backing Down
Sample 1:
Backing Up
Figure 20: Testing Layout and Permeability Results
Figure 21: Field Permeameter Water Resurfaces along the Joint
The permeability of Sample 1 (plastic backing facing up) was similar to that of the
control sections. Based on visual inspection of the cores, it was determined that the
plastic backing did not melt as anticipated, as shown in Figure 22. Thus, in the case of
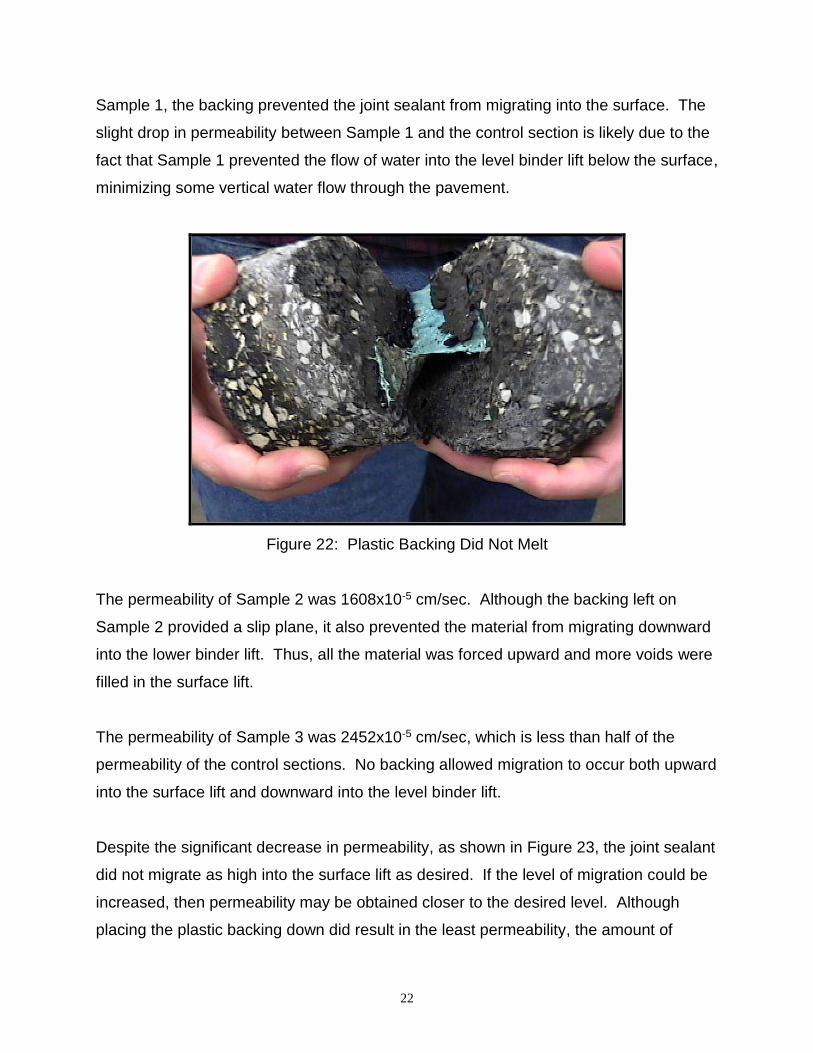
22
Sample 1, the backing prevented the joint sealant from migrating into the surface. The
slight drop in permeability between Sample 1 and the control section is likely due to the
fact that Sample 1 prevented the flow of water into the level binder lift below the surface,
minimizing some vertical water flow through the pavement.
Figure 22: Plastic Backing Did Not Melt
The permeability of Sample 2 was 1608x10-5 cm/sec. Although the backing left on
Sample 2 provided a slip plane, it also prevented the material from migrating downward
into the lower binder lift. Thus, all the material was forced upward and more voids were
filled in the surface lift.
The permeability of Sample 3 was 2452x10-5 cm/sec, which is less than half of the
permeability of the control sections. No backing allowed migration to occur both upward
into the surface lift and downward into the level binder lift.
Despite the significant decrease in permeability, as shown in Figure 23, the joint sealant
did not migrate as high into the surface lift as desired. If the level of migration could be
increased, then permeability may be obtained closer to the desired level. Although
placing the plastic backing down did result in the least permeability, the amount of
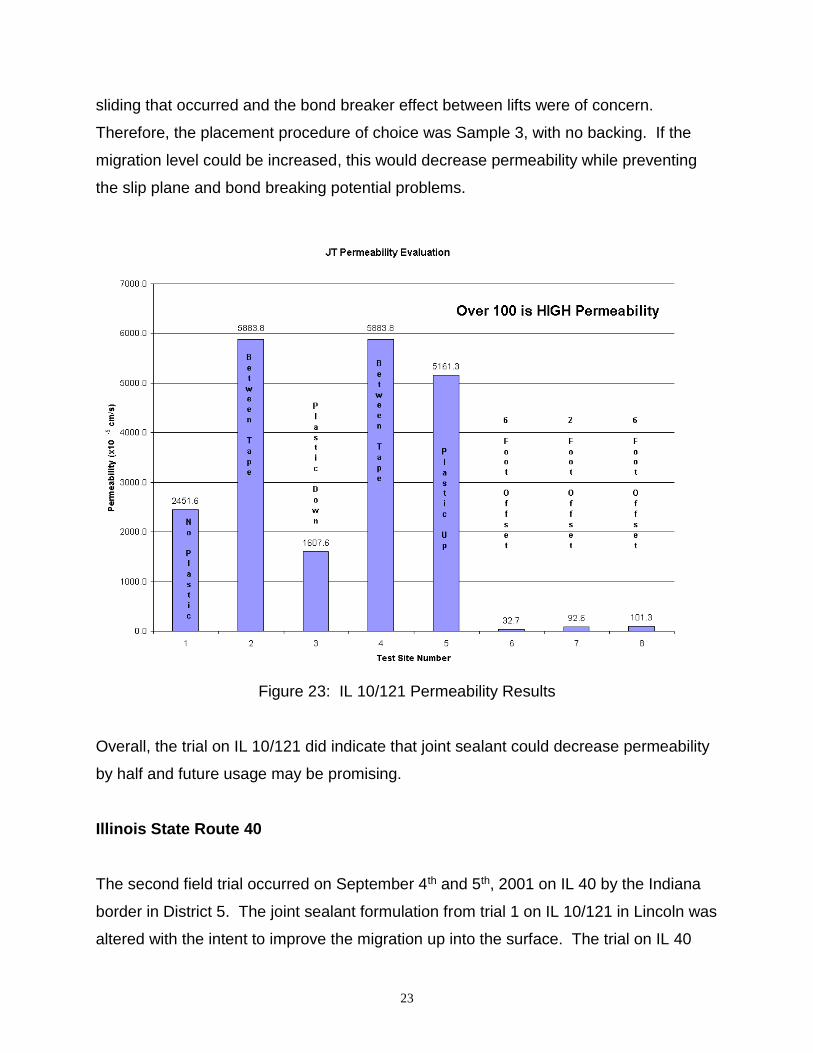
23
sliding that occurred and the bond breaker effect between lifts were of concern.
Therefore, the placement procedure of choice was Sample 3, with no backing. If the
migration level could be increased, this would decrease permeability while preventing
the slip plane and bond breaking potential problems.
Figure 23: IL 10/121 Permeability Results
Overall, the trial on IL 10/121 did indicate that joint sealant could decrease permeability
by half and future usage may be promising.
Illinois State Route 40
The second field trial occurred on September 4th and 5th, 2001 on IL 40 by the Indiana
border in District 5. The joint sealant formulation from trial 1 on IL 10/121 in Lincoln was
altered with the intent to improve the migration up into the surface. The trial on IL 40

24
involved looking at the migration of three different formulations fabricated by Quik Pave
Products Inc. The joint sealant strips measure 12 inches wide, 30 inches long, and 3/16
inch thick. The three formulations were evenly spaced at the test location and are
shown being paved over in Figure 24.
Figure 24: IL 40 Paving over Joint Sealant Formulations
Field permeability, nuclear density, cores, and lab permeability were tested, as well as
observing the height of joint sealant migration within the cores. To minimize the effect
on traffic, two coring set-ups were used to obtain the cores. The test site after coring is
shown in Figure 25. Figure 26 represents the testing layout detail at the joint. Table 1
contains the corresponding test results.
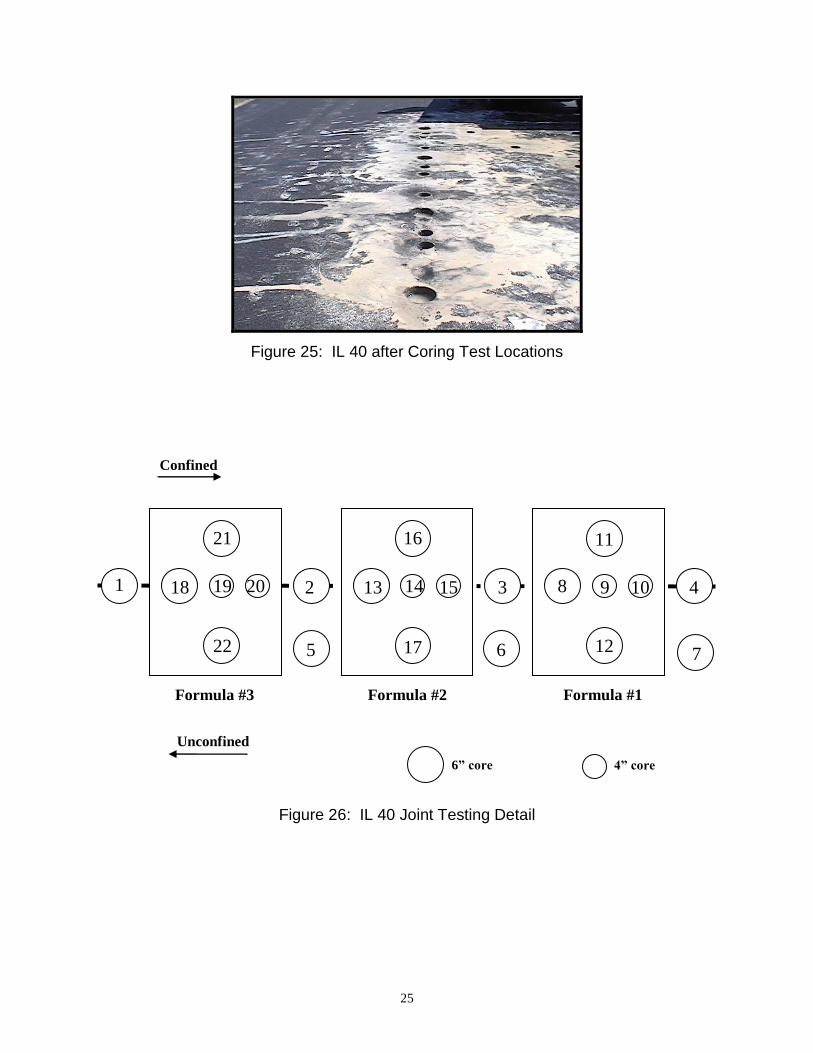
25
Figure 25: IL 40 after Coring Test Locations
Figure 26: IL 40 Joint Testing Detail
Confined
6” core 4” core
Unconfined
Formula #3 Formula #2 Formula #1
1 19 18 20
21
22
2
5
13 14 15
16
17
3
6
8 9 10
11
12
4
7
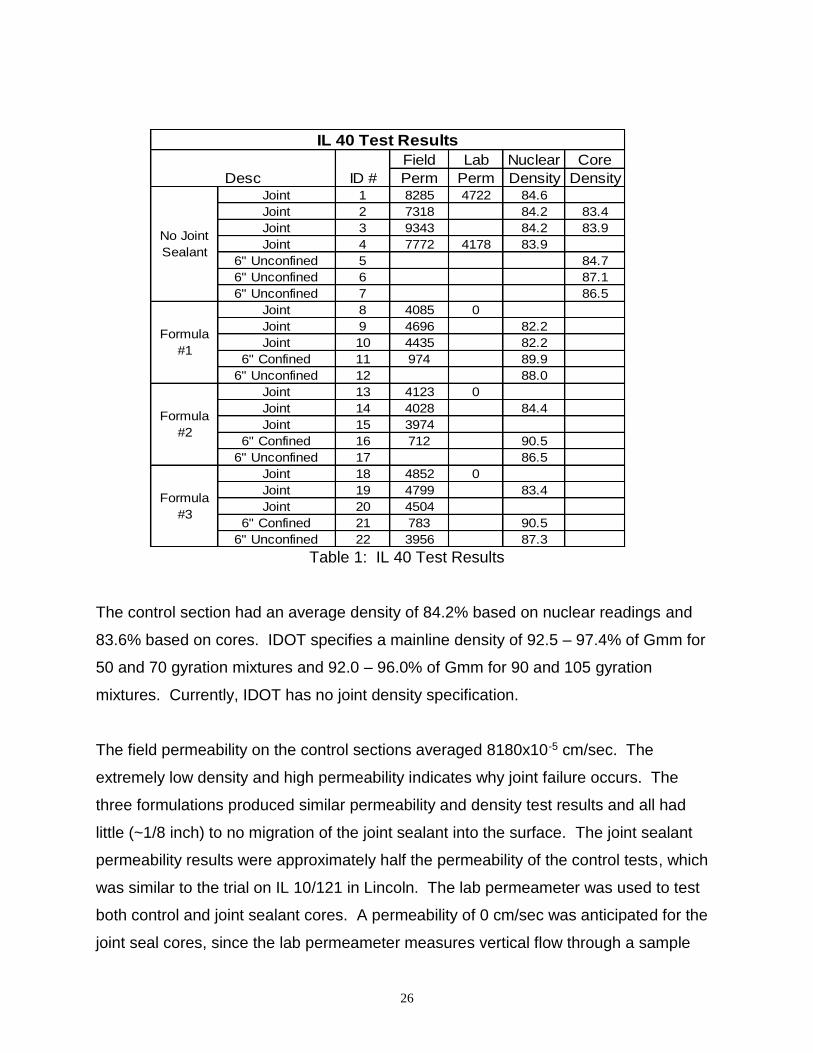
26
Table 1: IL 40 Test Results
The control section had an average density of 84.2% based on nuclear readings and
83.6% based on cores. IDOT specifies a mainline density of 92.5 – 97.4% of Gmm for
50 and 70 gyration mixtures and 92.0 – 96.0% of Gmm for 90 and 105 gyration
mixtures. Currently, IDOT has no joint density specification.
The field permeability on the control sections averaged 8180x10-5 cm/sec. The
extremely low density and high permeability indicates why joint failure occurs. The
three formulations produced similar permeability and density test results and all had
little (~1/8 inch) to no migration of the joint sealant into the surface. The joint sealant
permeability results were approximately half the permeability of the control tests, which
was similar to the trial on IL 10/121 in Lincoln. The lab permeameter was used to test
both control and joint sealant cores. A permeability of 0 cm/sec was anticipated for the
joint seal cores, since the lab permeameter measures vertical flow through a sample
Field Lab Nuclear Core
Perm Perm Density DensityJoint 1 8285 4722 84.6
Joint 2 7318 84.2 83.4
Joint 3 9343 84.2 83.9
Joint 4 7772 4178 83.9
6" Unconfined 5 84.7
6" Unconfined 6 87.1
6" Unconfined 7 86.5
Joint 8 4085 0
Joint 9 4696 82.2
Joint 10 4435 82.2
6" Confined 11 974 89.9
6" Unconfined 12 88.0
Joint 13 4123 0
Joint 14 4028 84.4
Joint 15 3974
6" Confined 16 712 90.5
6" Unconfined 17 86.5
Joint 18 4852 0
Joint 19 4799 83.4
Joint 20 4504
6" Confined 21 783 90.5
6" Unconfined 22 3956 87.3
IL 40 Test Results
No Joint
Sealant
Desc
Formula
#1
Formula
#2
Formula
#3
ID #

27
and the joint sealant prevents vertical flow through the bottom of the core, regardless of
migration level. At the very least, the joint sealant does prevent water from infiltrating
lower levels of the pavement. The lab permeability results on the control sections were
a little more than half of the field permeability results. This demonstrates that both
vertical and horizontal flow contribute significantly to a pavement’s permeability.
The data between tests taken 6 inches off the centerline supports that there are
differences between the unconfined and confined edges. The data also supports the
concerns of low density and high permeability not only located at the joint interface, but
at several inches on each side of the joint as well. The average density of the
unconfined test sites over the joint sealant was 87.3%, while the average density on the
confined test sites over the joint sealant was 90.3%. Due to safety issues, only one
permeability test was taken on the unconfined 6-inch offset. The average field
permeability of the unconfined 6-inch offset was 3956x10-5 cm/sec while the average
confined 6-inch offset field permeability was 823x10-5 cm/sec. Just as with the Lincoln
trial, the ability to determine density of the joint sealant areas is a concern. The joint
sealant affects the maximum specific gravity so that the density may be somewhat
higher than what was determined using the maximum specific gravity of the mix. The
density may help with relative locations, but the permeability data is considered to be
more indicative of variations.
Mainline testing was also performed, as shown in Figure 27. The tests were taken at 2,
4, 6, 8, and 10 feet from the centerline, as specified in Figure 27. The core density
ranged from 92.4% to 94.7% with an average of 93.7%. The permeability ranged from
0 to 117x10-5 cm/sec with an average of 42x10-5 cm/sec. With the exception of the
117x10-5 cm/sec test result, the permeability results were below the 100x10-5 cm/sec
desired limit. Even the 117x10-5 cm/sec test result was not too far from the desired limit.

28
SEE JOINT DETAIL LAYOUT
2
4
6
8
10
2
4
6
8
10
Legend
• Field Permeability (x10-5 cm/sec)
• Nuclear Density
• Core Density
Test Location
16
94.3
93.9
49
94.2
62
92.7
93.5
0
93.4
94.7
0
93.4
94.4
0
94.5
94.2
117
93.7
94
92.8
37
93.1
42
92.4
Confined
Unconfined
N
Figure 27: IL 40 Mainline Testing
The migration of the joint sealant within the cores is shown in Figure 28. The joint
sealant had little (~1/8 inch) to no migration into the surface. The joint sealant material
migrated less in this trial than on IL10/121 in Lincoln. In fact, the material was more of a
distinct thick elastic layer on the bottom of the core which made it difficult to completely
split into separate halves. It appeared that the modifications made to the formulations
were in the wrong direction.
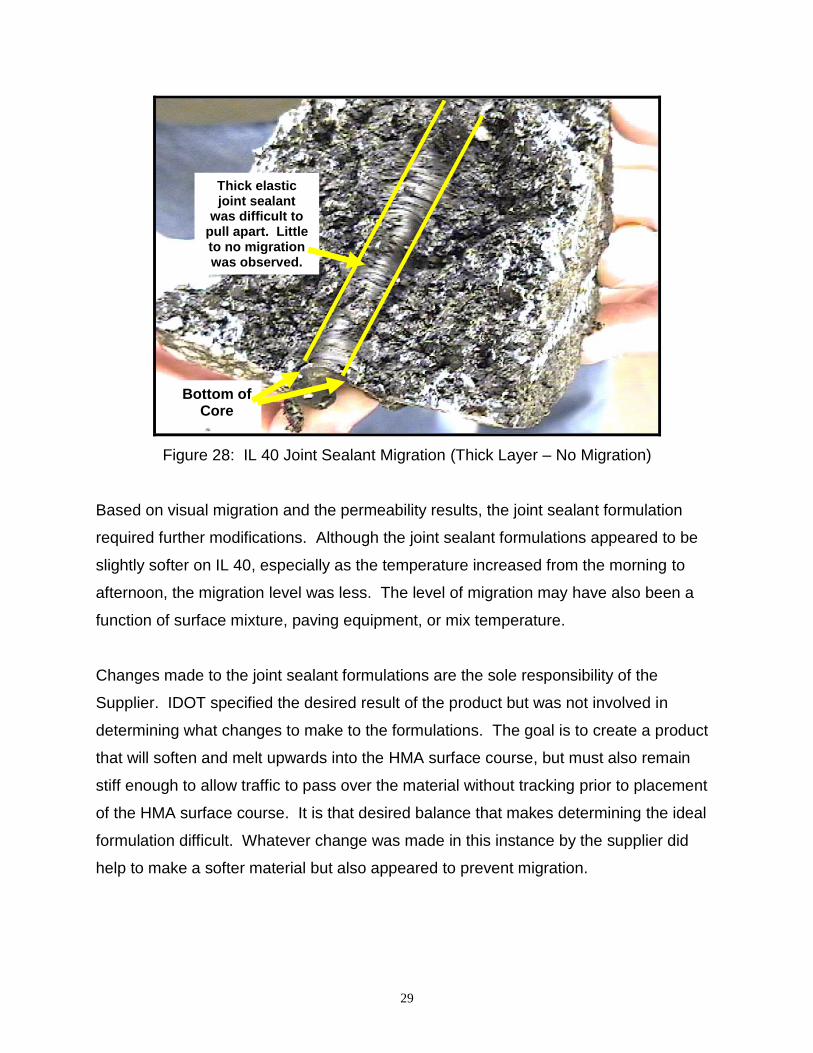
29
Figure 28: IL 40 Joint Sealant Migration (Thick Layer – No Migration)
Based on visual migration and the permeability results, the joint sealant formulation
required further modifications. Although the joint sealant formulations appeared to be
slightly softer on IL 40, especially as the temperature increased from the morning to
afternoon, the migration level was less. The level of migration may have also been a
function of surface mixture, paving equipment, or mix temperature.
Changes made to the joint sealant formulations are the sole responsibility of the
Supplier. IDOT specified the desired result of the product but was not involved in
determining what changes to make to the formulations. The goal is to create a product
that will soften and melt upwards into the HMA surface course, but must also remain
stiff enough to allow traffic to pass over the material without tracking prior to placement
of the HMA surface course. It is that desired balance that makes determining the ideal
formulation difficult. Whatever change was made in this instance by the supplier did
help to make a softer material but also appeared to prevent migration.
Thick elastic joint sealant
was difficult to pull apart. Little to no migration was observed.
Bottom of Core
30
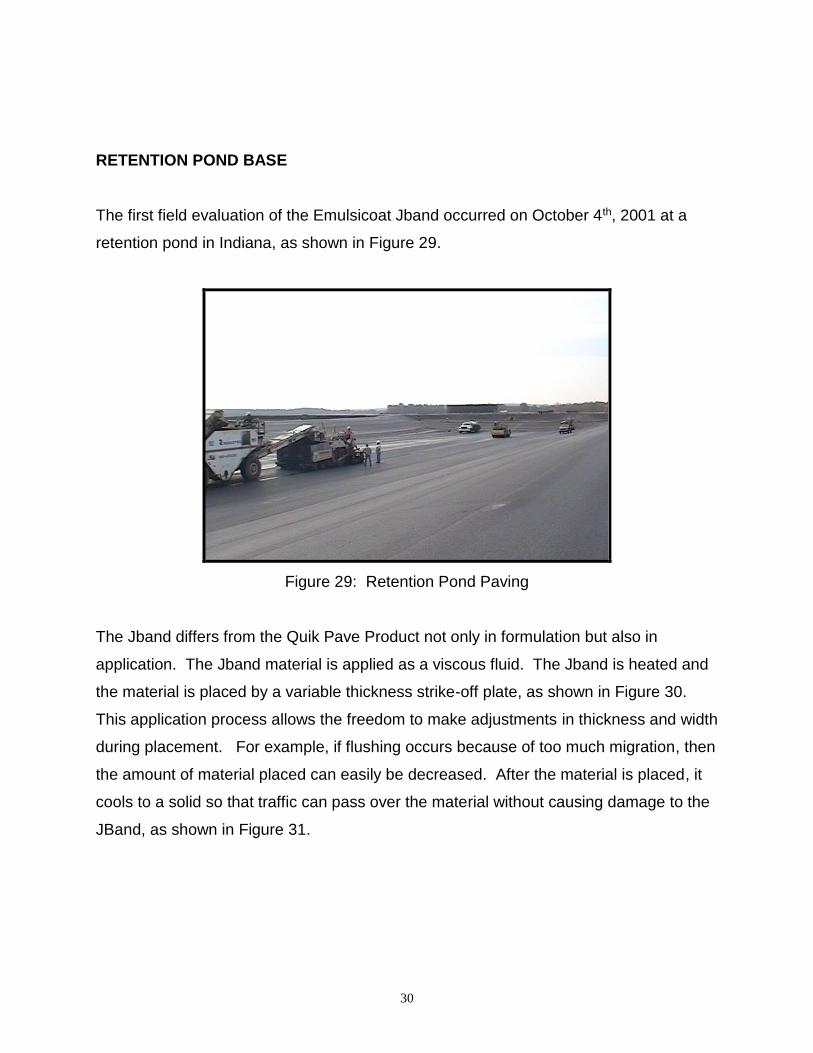
RETENTION POND BASE
The first field evaluation of the Emulsicoat Jband occurred on October 4th, 2001 at a
retention pond in Indiana, as shown in Figure 29.
Figure 29: Retention Pond Paving
The Jband differs from the Quik Pave Product not only in formulation but also in
application. The Jband material is applied as a viscous fluid. The Jband is heated and
the material is placed by a variable thickness strike-off plate, as shown in Figure 30.
This application process allows the freedom to make adjustments in thickness and width
during placement. For example, if flushing occurs because of too much migration, then
the amount of material placed can easily be decreased. After the material is placed, it
cools to a solid so that traffic can pass over the material without causing damage to the
JBand, as shown in Figure 31.

31
Figure 30: Jband Placement
Figure 31: Jband after Placement
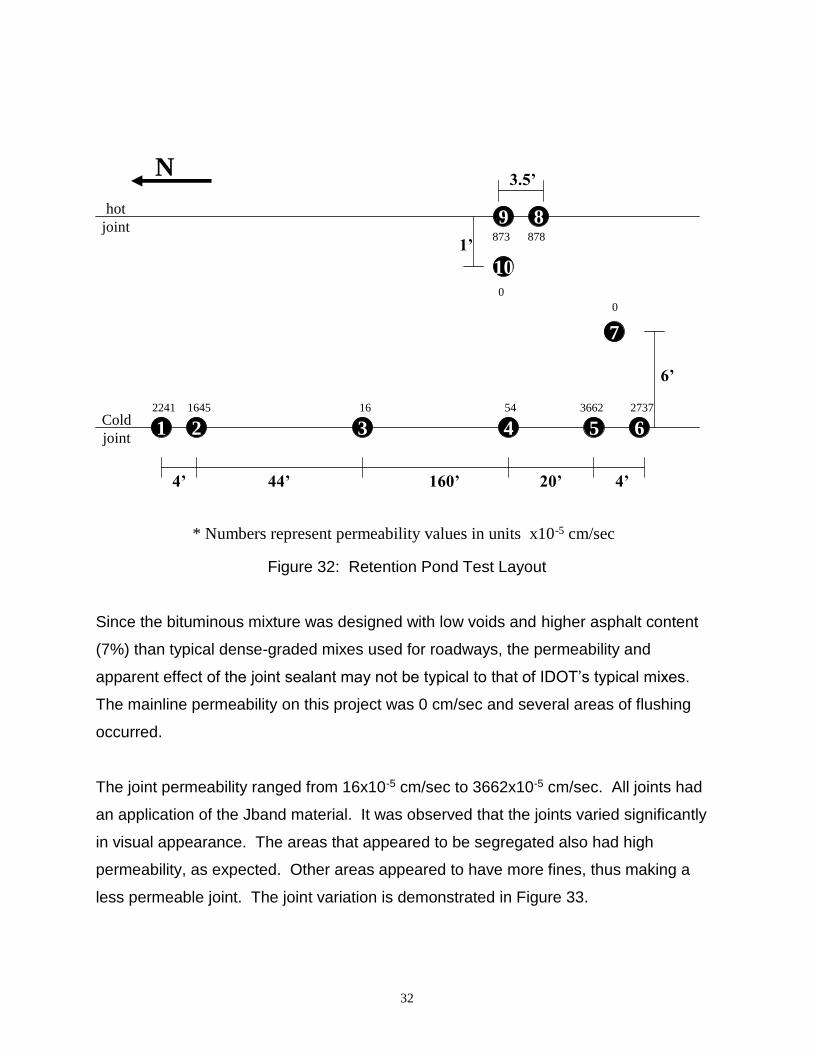
Permeability tests were taken on cold joints, hot joints, and mainline locations, as shown
in Figure 32. No cores were taken.
Jband
32
1 2 3 4
7
5 6
89
10
4’ 44’
3.5’
160’ 20’ 4’
1’
6’
N
* Numbers represent permeability values in units x10-5 cm/sec
Cold
joint
hot
joint
2241 1645 16 54 3662 2737
0
878873
0
Figure 32: Retention Pond Test Layout
Since the bituminous mixture was designed with low voids and higher asphalt content
(7%) than typical dense-graded mixes used for roadways, the permeability and
apparent effect of the joint sealant may not be typical to that of IDOT’s typical mixes.
The mainline permeability on this project was 0 cm/sec and several areas of flushing
occurred.
The joint permeability ranged from 16x10-5 cm/sec to 3662x10-5 cm/sec. All joints had
an application of the Jband material. It was observed that the joints varied significantly
in visual appearance. The areas that appeared to be segregated also had high
permeability, as expected. Other areas appeared to have more fines, thus making a
less permeable joint. The joint variation is demonstrated in Figure 33.

33
Figure 33: Retention Pond Joint Variability
Since the Retention Pond mixture was different than IDOT’s typical mixture, a more
applicable mix needed to be used to evaluate the Jband.
LAKES AT RIVERBEND SUBDIVISION
The second field trial of the Emulsicoat Jband occurred on November 2, 2001 in the
Lakes at Riverbend subdivision in Mahomet, Illinois, as shown in Figure 34.
Figure 34: Subdivision Jband Testing
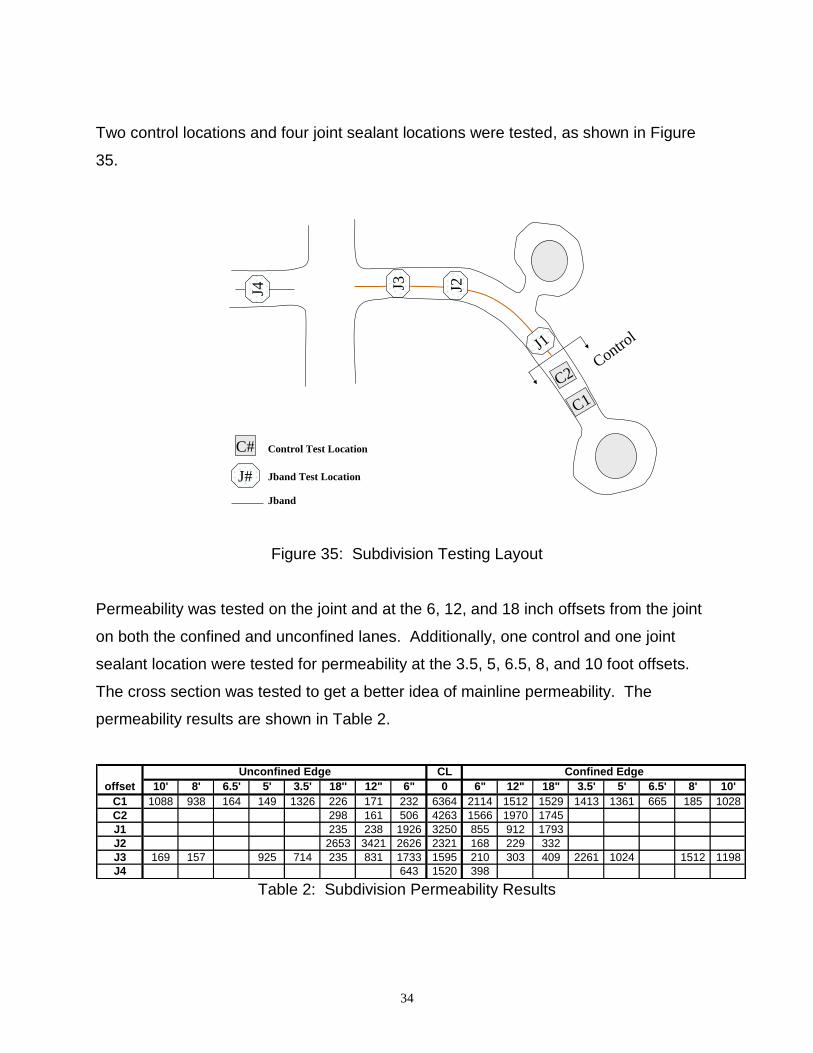
34
Two control locations and four joint sealant locations were tested, as shown in Figure
35.
C1
C2
J1
J3 J2J4
Control
J#
C# Control Test Location
Jband Test Location
Jband
Figure 35: Subdivision Testing Layout
Permeability was tested on the joint and at the 6, 12, and 18 inch offsets from the joint
on both the confined and unconfined lanes. Additionally, one control and one joint
sealant location were tested for permeability at the 3.5, 5, 6.5, 8, and 10 foot offsets.
The cross section was tested to get a better idea of mainline permeability. The
permeability results are shown in Table 2.
CL
10' 8' 6.5' 5' 3.5' 18'' 12" 6" 0 6" 12" 18" 3.5' 5' 6.5' 8' 10'
C1 1088 938 164 149 1326 226 171 232 6364 2114 1512 1529 1413 1361 665 185 1028
C2 298 161 506 4263 1566 1970 1745
J1 235 238 1926 3250 855 912 1793
J2 2653 3421 2626 2321 168 229 332
J3 169 157 925 714 235 831 1733 1595 210 303 409 2261 1024 1512 1198
J4 643 1520 398
offset
Unconfined Edge Confined Edge
Table 2: Subdivision Permeability Results

35
The project was located in a subdivision, so IDOT density requirements were not in
effect. The mainline density across the mat was likely significantly lower than IDOT
requirements, as implied by the high permeability levels. All test data exceeded the
desired 100x10-5 cm/sec desired limit. The control section contradicts the expectation
that the unconfined edge would have lower density than the confined edge. However, it
appears that the problem was in the lack of compactive effort in rolling the confined
edge and half of the mat, since the low density spans from the joint all the way to the 5
foot offset. The control sections appear to be similar, as shown in Figure 36, which was
expected since the two locations were only 40 feet apart.
Cross Section D5 Subdivision
0
1000
2000
3000
4000
5000
6000
7000
10' 6.5' 3.5' 12" 0 12" 3.5' 6.5' 9.5'Offset
Perm
eab
ilit
y
(x1
0-5
cm
/sec)
Control 1 Control 2
Figure 36: Subdivision Control Permeability
As was expected, the Jband test sites did have higher permeability on the unconfined
versus the confined edge. When the J4 test site was paved, the joint was matched
almost immediately after placing the first lane, resulting in better test results due to the
hot joint.
Overall, the joint permeability was reduced by over half when using the joint sealant.
The average joint permeability of the two control sections was 5313x10-5 cm/sec. The
average joint permeability of the four joint sealant locations was 2172x10-5 cm/sec. The
test results of the various locations are shown in Figure 37.

36
Cross Section D5 Subdivision
0
1000
2000
3000
4000
5000
6000
7000
10' 8' 6.5' 5' 3.5' 18'' 12" 6" 0 6" 12" 18" 3.5' 5' 6.5' 8' 9.5'
Permeability
Control 1 Control 2 Joint Sealant 1 Joint Sealant 2 Joint Sealant 3
Figure 37: Subdivision Permeability Summary
U.S. Highway 51
The fifth field trial was the first to evaluate the two joint sealant products side by side.
The project occurred September 4th and 5th, 2002 on US 51 at the South side of
Decatur, Illinois.
The evaluation included one formulation of Emulsicoat’s Jband placed at 12 inches wide
in one test location and 18 inches wide in another test location. Quik Pave Products
Inc. provided two formula variations of their product in two applications of 9 inch wide
bands. A double prime test section was also evaluated, as well as several control
sections located between the different joint sealant products. Both Emulsicoat and Quik
Pave Products Inc. provided their material free of charge. The project test section
layout is shown in Figure 38.
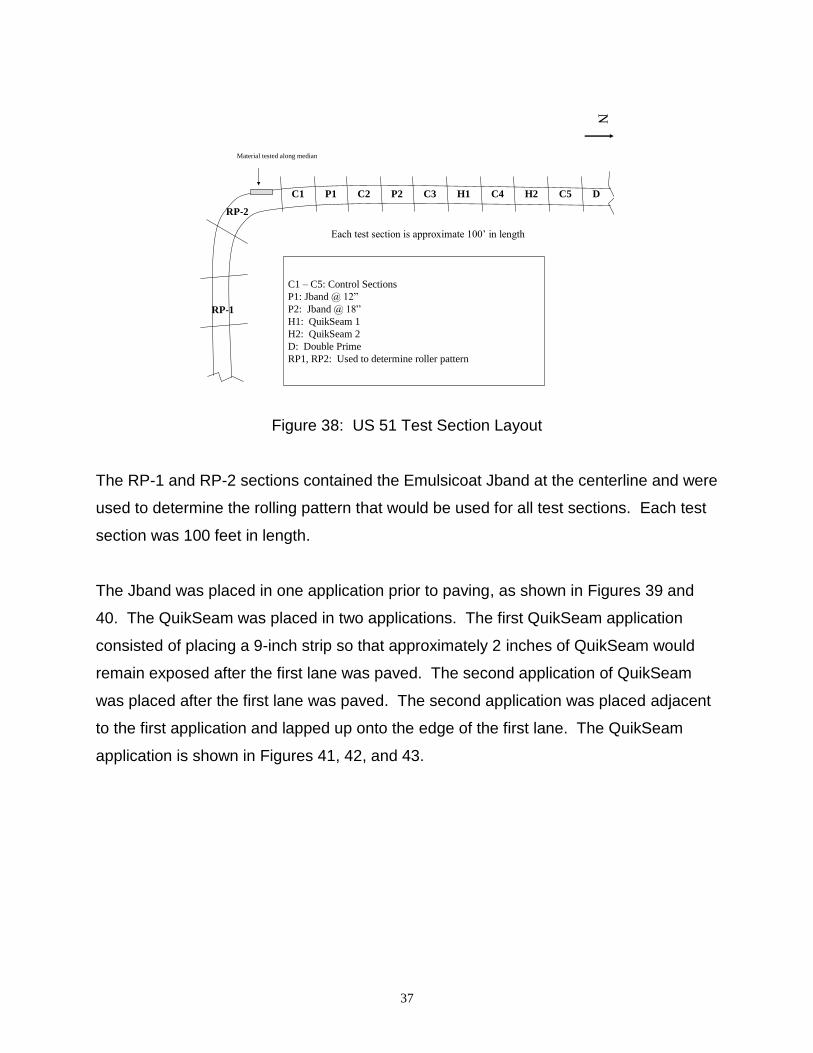
37
RP-1
C1 C4P2P1 C3
RP-2
C2 H1 H2 C5 D
N
Each test section is approximate 100’ in length
Material tested along median
C1 – C5: Control Sections
P1: Jband @ 12”
P2: Jband @ 18”
H1: QuikSeam 1
H2: QuikSeam 2
D: Double Prime
RP1, RP2: Used to determine roller pattern
Figure 38: US 51 Test Section Layout
The RP-1 and RP-2 sections contained the Emulsicoat Jband at the centerline and were
used to determine the rolling pattern that would be used for all test sections. Each test
section was 100 feet in length.
The Jband was placed in one application prior to paving, as shown in Figures 39 and
40. The QuikSeam was placed in two applications. The first QuikSeam application
consisted of placing a 9-inch strip so that approximately 2 inches of QuikSeam would
remain exposed after the first lane was paved. The second application of QuikSeam
was placed after the first lane was paved. The second application was placed adjacent
to the first application and lapped up onto the edge of the first lane. The QuikSeam
application is shown in Figures 41, 42, and 43.

38
Figure 39: US 51 Jband Placement
Figure 40: Paving over Jband
39
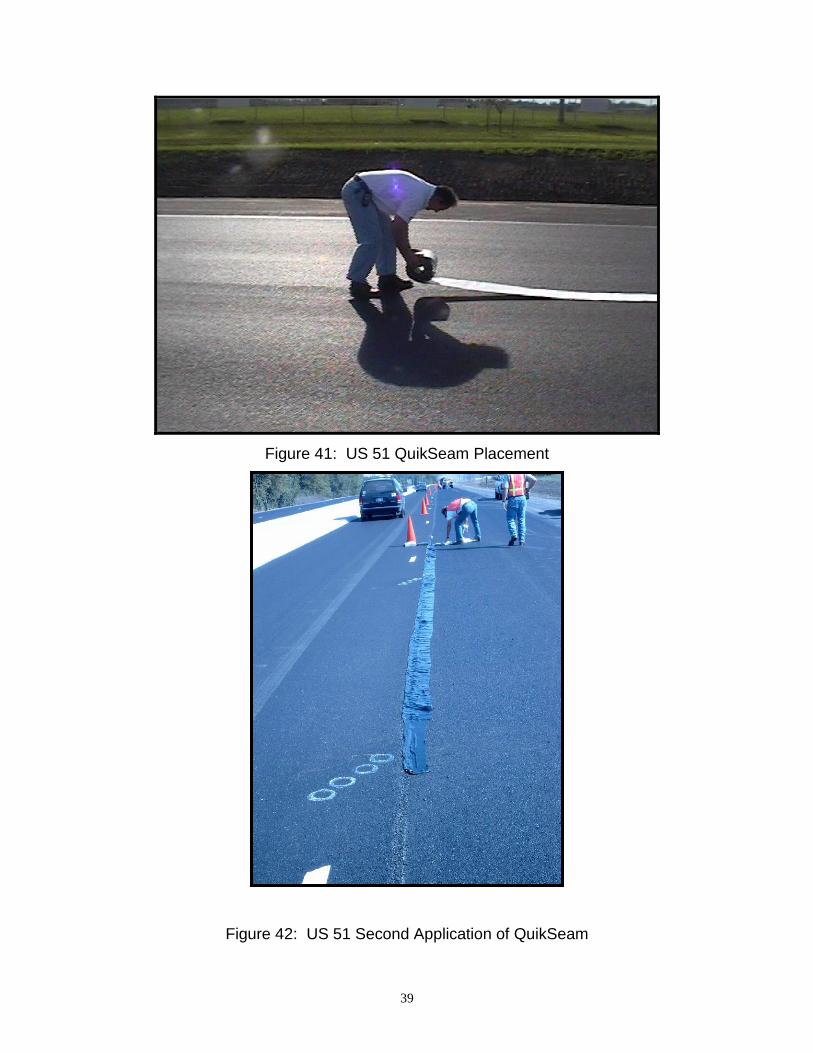
Figure 41: US 51 QuikSeam Placement
Figure 42: US 51 Second Application of QuikSeam
40
Figure 43: QuikSeam Typical Layout
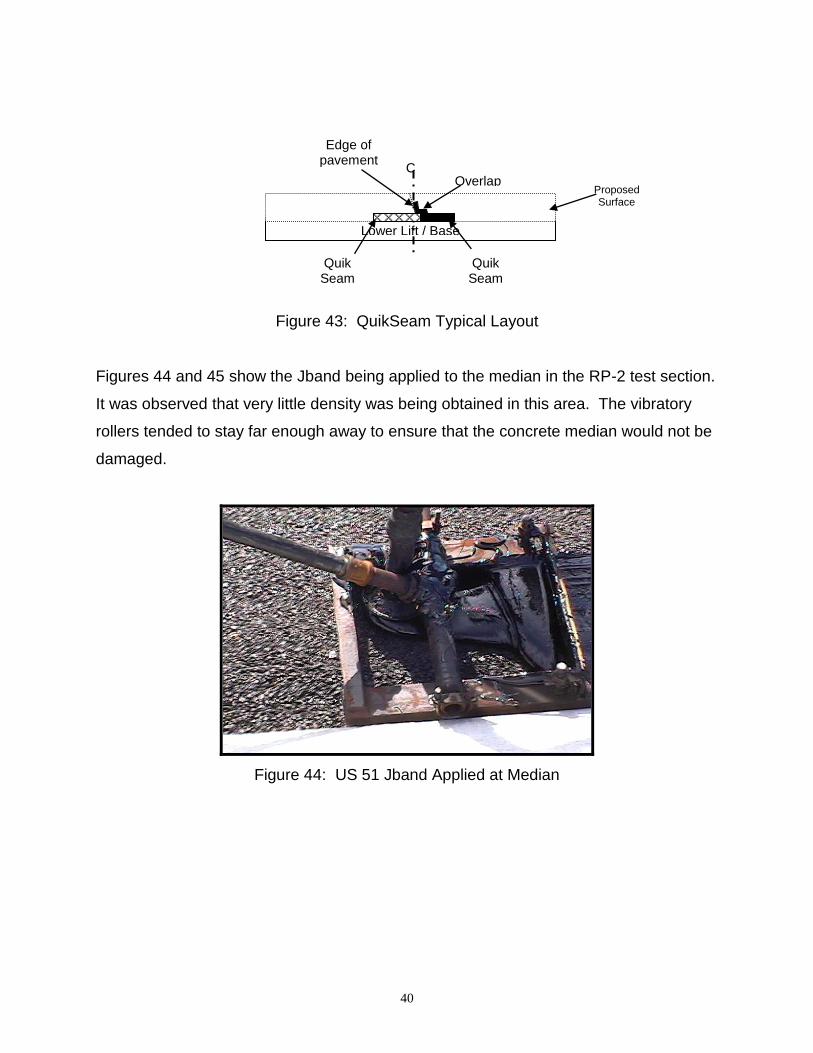
Figures 44 and 45 show the Jband being applied to the median in the RP-2 test section.
It was observed that very little density was being obtained in this area. The vibratory
rollers tended to stay far enough away to ensure that the concrete median would not be
damaged.
Figure 44: US 51 Jband Applied at Median
Edge of pavement first pass Overlap
CL
Proposed Surface
Lower Lift / Base
Quik Seam First Strip
Quik Seam
Second Strip
41
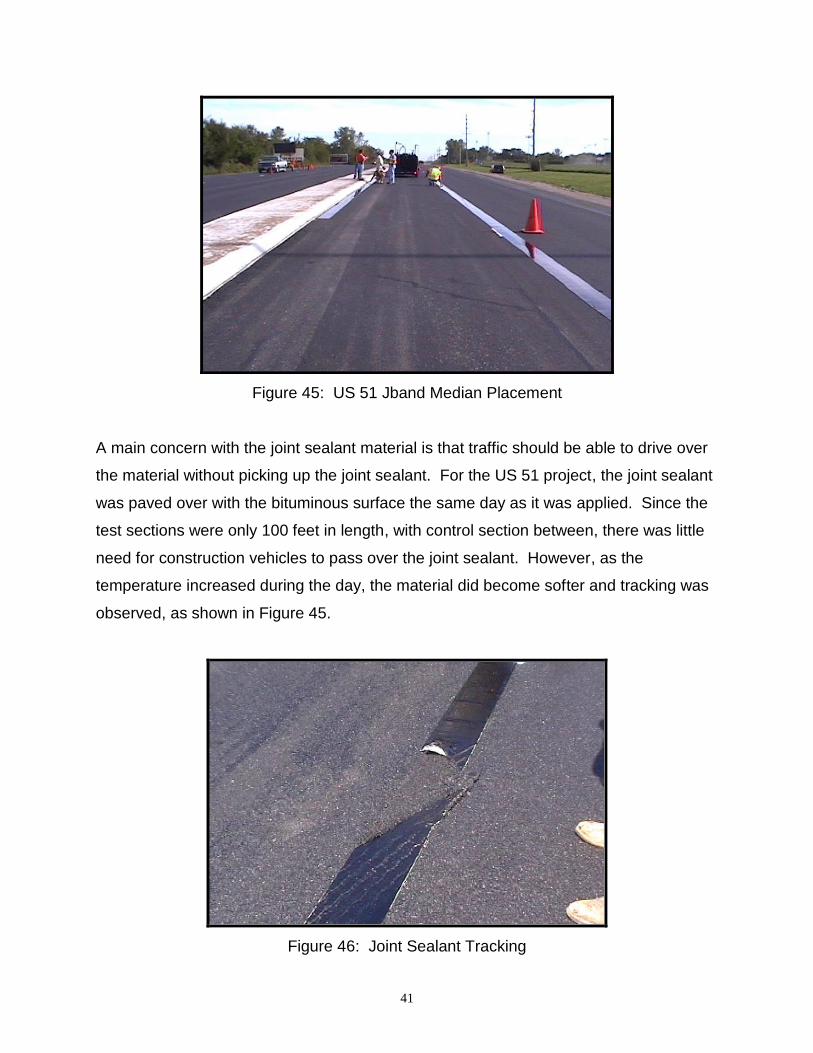
Figure 45: US 51 Jband Median Placement
A main concern with the joint sealant material is that traffic should be able to drive over
the material without picking up the joint sealant. For the US 51 project, the joint sealant
was paved over with the bituminous surface the same day as it was applied. Since the
test sections were only 100 feet in length, with control section between, there was little
need for construction vehicles to pass over the joint sealant. However, as the
temperature increased during the day, the material did become softer and tracking was
observed, as shown in Figure 45.
Figure 46: Joint Sealant Tracking
42
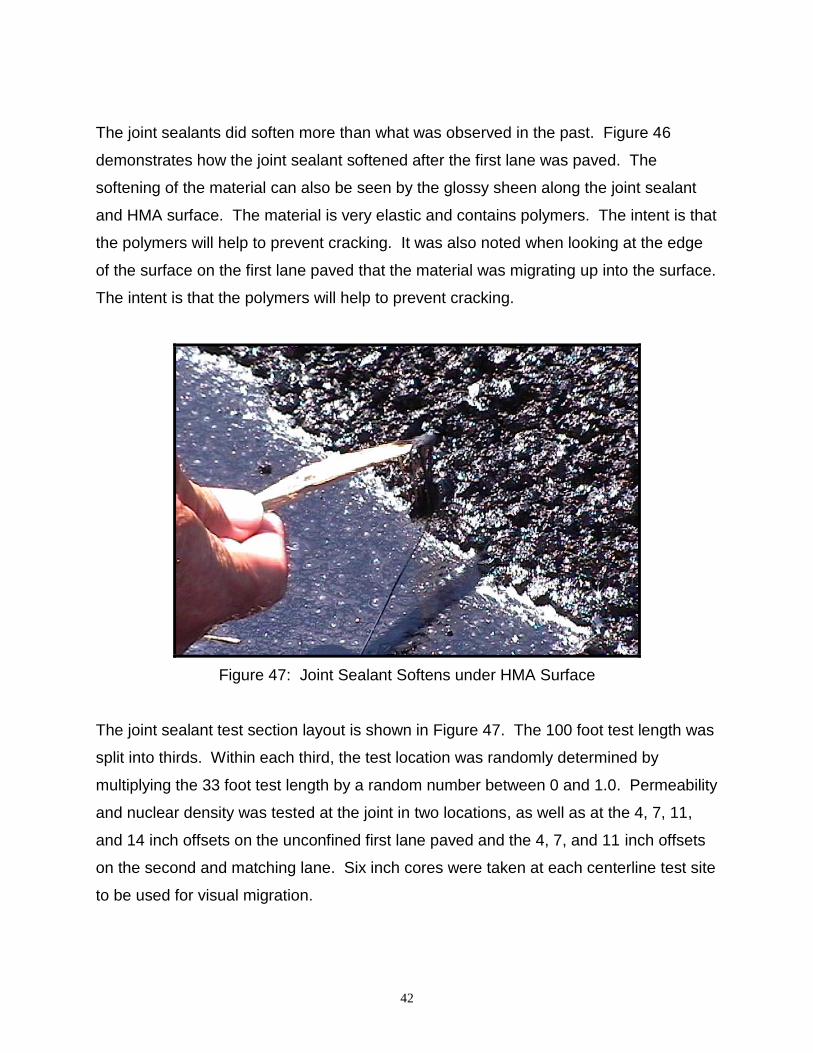
The joint sealants did soften more than what was observed in the past. Figure 46
demonstrates how the joint sealant softened after the first lane was paved. The
softening of the material can also be seen by the glossy sheen along the joint sealant
and HMA surface. The material is very elastic and contains polymers. The intent is that
the polymers will help to prevent cracking. It was also noted when looking at the edge
of the surface on the first lane paved that the material was migrating up into the surface.
The intent is that the polymers will help to prevent cracking.
Figure 47: Joint Sealant Softens under HMA Surface
The joint sealant test section layout is shown in Figure 47. The 100 foot test length was
split into thirds. Within each third, the test location was randomly determined by
multiplying the 33 foot test length by a random number between 0 and 1.0. Permeability
and nuclear density was tested at the joint in two locations, as well as at the 4, 7, 11,
and 14 inch offsets on the unconfined first lane paved and the 4, 7, and 11 inch offsets
on the second and matching lane. Six inch cores were taken at each centerline test site
to be used for visual migration.

43
3 test locations randomly located within
each third of the control length.
P
Permeability & nuclear density
Core, Permeability & nuclear
density
Joint Sealant Section Length = TL
TL / 3 = 33 TL / 3 = 33 TL / 3 = 33
P
14”
18” or 24”
100 feet
4”7”
11”
4”7”
11”
Joint Sealant
Figure 48: US 51 Joint Sealant Testing Layout
Due to time constraints, the number of control locations was less than that of the joint
sealant locations. The control section layout was similar to that of the joint sealant
except that, instead of having three test locations within a test section, there was only
one. It was determined that it was more important to have control tests between each
joint sealant test location to monitor the potential change that may be due to location
than to have one of three control test locations. Five control sections were tested. The
test sites were determined randomly by multiplying a random number between 0 and
1.0 to the 100 foot sections.
A summary of the permeability, density, and migration levels of each material is shown
in Table 3. The Emulsicoat Jband data contains both the 12 and 18 inch width results
since little difference was observed between the two. For all test site data, see
Appendix A. The “Distance from Top” column represents how close to the surface the
material migrated. The lower the value, the more migration occurred. The unconfined
first lane was tested at 14, 11, 7, and 4 inch offsets. The confined matching joint lane
was tested at 11, 7, and 4 inch offsets. The 14 inch offset was not tested on the
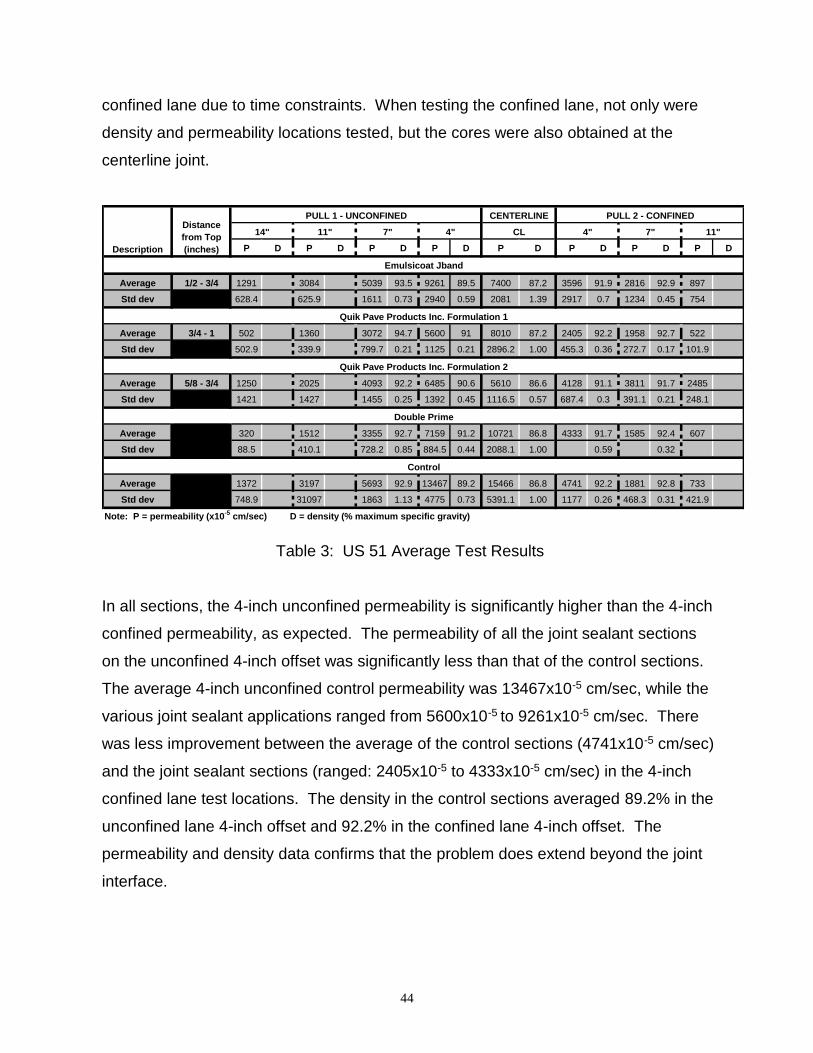
44
confined lane due to time constraints. When testing the confined lane, not only were
density and permeability locations tested, but the cores were also obtained at the
centerline joint.
P D P D P D P D P D P D P D P D
Average 1/2 - 3/4 1291 3084 5039 93.5 9261 89.5 7400 87.2 3596 91.9 2816 92.9 897
Std dev 628.4 625.9 1611 0.73 2940 0.59 2081 1.39 2917 0.7 1234 0.45 754
Average 3/4 - 1 502 1360 3072 94.7 5600 91 8010 87.2 2405 92.2 1958 92.7 522
Std dev 502.9 339.9 799.7 0.21 1125 0.21 2896.2 1.00 455.3 0.36 272.7 0.17 101.9
Average 5/8 - 3/4 1250 2025 4093 92.2 6485 90.6 5610 86.6 4128 91.1 3811 91.7 2485
Std dev 1421 1427 1455 0.25 1392 0.45 1116.5 0.57 687.4 0.3 391.1 0.21 248.1
Average 320 1512 3355 92.7 7159 91.2 10721 86.8 4333 91.7 1585 92.4 607
Std dev 88.5 410.1 728.2 0.85 884.5 0.44 2088.1 1.00 0.59 0.32
Average 1372 3197 5693 92.9 13467 89.2 15466 86.8 4741 92.2 1881 92.8 733
Std dev 748.9 31097 1863 1.13 4775 0.73 5391.1 1.00 1177 0.26 468.3 0.31 421.9
Note: P = permeability (x10-5
cm/sec) D = density (% maximum specific gravity)
Description
Distance
from Top
(inches)
PULL 1 - UNCONFINED CENTERLINE PULL 2 - CONFINED
14" 11" 7" 4" CL 4" 7" 11"
Control
Emulsicoat Jband
Quik Pave Products Inc. Formulation 1
Quik Pave Products Inc. Formulation 2
Double Prime
Table 3: US 51 Average Test Results
In all sections, the 4-inch unconfined permeability is significantly higher than the 4-inch
confined permeability, as expected. The permeability of all the joint sealant sections
on the unconfined 4-inch offset was significantly less than that of the control sections.
The average 4-inch unconfined control permeability was 13467x10-5 cm/sec, while the
various joint sealant applications ranged from 5600x10-5 to 9261x10-5 cm/sec. There
was less improvement between the average of the control sections (4741x10-5 cm/sec)
and the joint sealant sections (ranged: 2405x10-5 to 4333x10-5 cm/sec) in the 4-inch
confined lane test locations. The density in the control sections averaged 89.2% in the
unconfined lane 4-inch offset and 92.2% in the confined lane 4-inch offset. The
permeability and density data confirms that the problem does extend beyond the joint
interface.
45
As before, the density reported in the joint sealant testing locations were calculated
using the maximum specific gravity of the mix without joint sealant. Therefore, density
results in the joint sealant areas should not be considered as absolutes but better used
to indicate differences. All permeability tests were greater than the 100x10-5 cm/sec
maximum desired level.
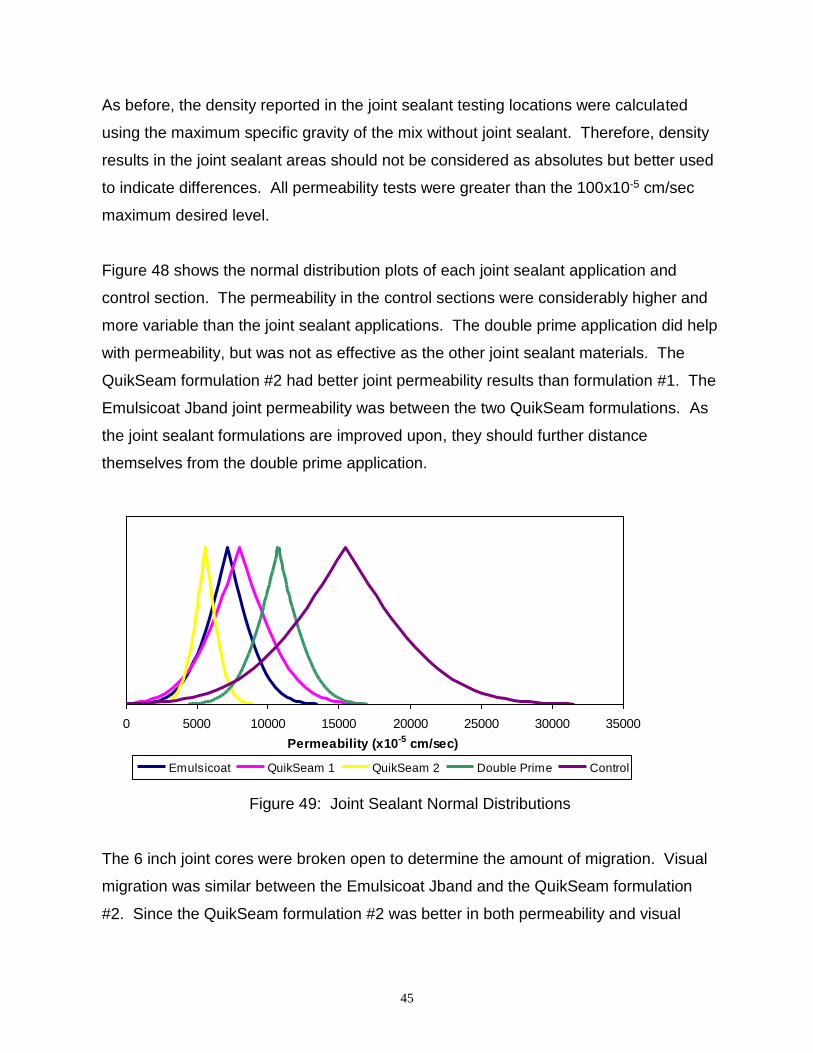
Figure 48 shows the normal distribution plots of each joint sealant application and
control section. The permeability in the control sections were considerably higher and
more variable than the joint sealant applications. The double prime application did help
with permeability, but was not as effective as the other joint sealant materials. The
QuikSeam formulation #2 had better joint permeability results than formulation #1. The
Emulsicoat Jband joint permeability was between the two QuikSeam formulations. As
the joint sealant formulations are improved upon, they should further distance
themselves from the double prime application.
0 5000 10000 15000 20000 25000 30000 35000
Permeability (x10-5 cm/sec)
Emulsicoat QuikSeam 1 QuikSeam 2 Double Prime Control
Figure 49: Joint Sealant Normal Distributions
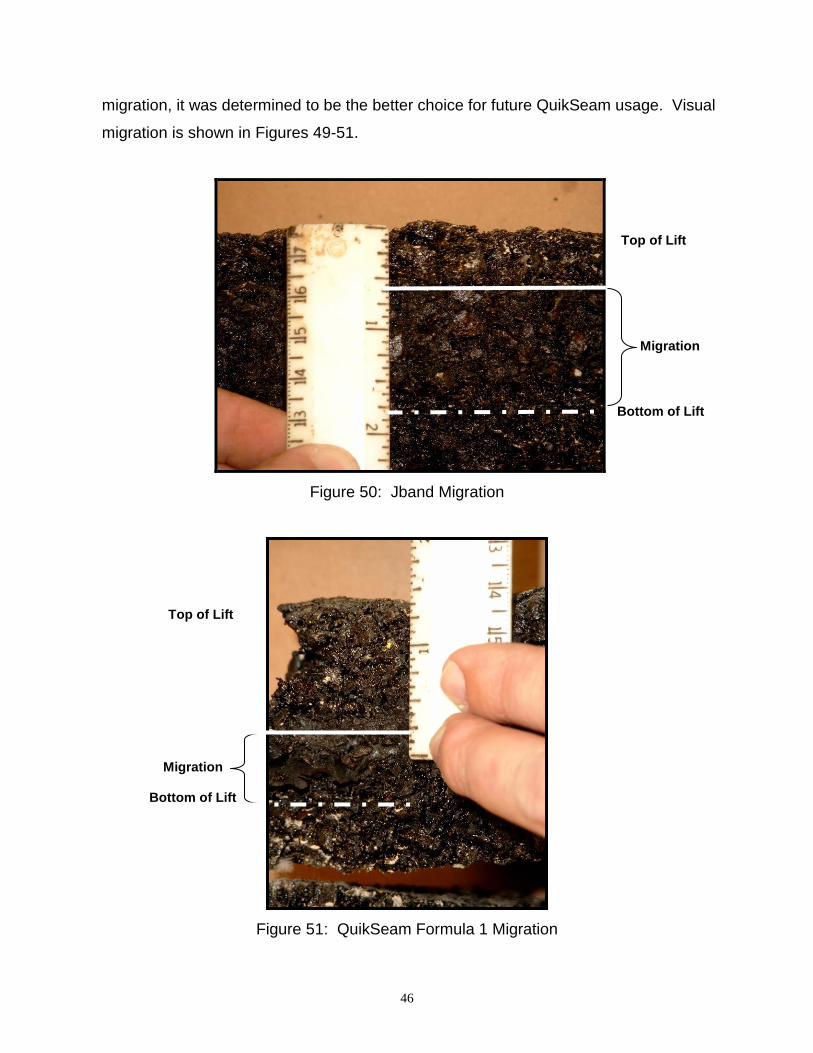
The 6 inch joint cores were broken open to determine the amount of migration. Visual
migration was similar between the Emulsicoat Jband and the QuikSeam formulation
#2. Since the QuikSeam formulation #2 was better in both permeability and visual
46
migration, it was determined to be the better choice for future QuikSeam usage. Visual
migration is shown in Figures 49-51.
Figure 50: Jband Migration
Figure 51: QuikSeam Formula 1 Migration
Bottom of Lift
Top of Lift
Migration
Bottom of Lift
Top of Lift
Migration

47
Figure 52: QuikSeam Formula 2 Migration
Overall, the joint sealant applications did show improvement over that of the control
section. Based on the collected test data, double prime did help with the joint, but not
as effectively as the other joint sealant applications appeared to help. The Jband and
QuikSeam formula #2 appeared similar. The QuikSeam formula #2 would be the
formulation of choice over that of the QuikSeam formula #1. More migration was
observed on US 51 than has been observed on past trials. Although more migration is
desired, using the products on a larger scale to evaluate constructability should be
included in further investigations.
Bottom of Lift
Top of Lift
Migration

48
LAB PROCEDURE
Field trials took a large amount of time and effort to coordinate and perform testing. The
trials on IL 10/121, IL 40, the Indiana retention pond, and at the Lakes at the Riverbend
subdivision were all performed to try to evaluate joint sealant formula changes. The
conclusion of each of the trials was that further formulation changes were required and
additional field trials would be needed. A lab procedure that could better predict which
formulations should be taken to the field was desired.
The lab procedure utilizes the gyratory compactor to simulate field conditions. A filler
specimen compacted to a height of 3 ½ inches (88.9mm) at 4% air voids is used to
simulate a binder base. The filler specimen is then saw cut to a height of 3 inches
(76.2mm) to ensure a flat, uniform surface. The filler specimen is placed into a room
temperature gyratory mold with the sawed face up. Two paper discs are placed on the
3 inch filler face to prevent the material from migrating down. This is done so that the
surface and sealant material can be easily removed for observation and allows the filler
specimen to be used on multiple trials. A 6 inch diameter of joint seal at the desired
thickness (typically 3/16 inch) is placed on the paper discs. Since the Emulsicoat Jband
was sent in pint and quart cans, the joint sealant was heated, poured into a 6-inch mold,
and cooled to room temperature (Figure 52).

49
Figure 53: Joint Sealant Mold and Sample
The predetermined amount of surface mix that will produce a 1 ½ inch (38.1mm) lift at
14% air voids is added on top of the joint sealant. It was determined to target 14% air
voids because the average joint density previously observed was approximately 86%.
The temperature of the surface mixture is 150°F. Earlier trials were heated as high as
300°F, but the results produced much more migration than was observed in the field.
(The reason for this may be that the heat and pressure may be more concentrated in
the gyratory mold than what was experienced in the field.) Various temperatures were
tested until the 150°F temperature was concluded upon. The mold is then placed in the
gyratory compactor for 10 gyrations. The number of gyrations was also determined
based on past migration. The specimens are then removed from the mold and allowed
to cool. Once cooled, the surface lift is broken open and the visual height of migration is
recorded.
The procedure was developed by using material sampled on the Lake at Riverbend
subdivision and the visual height of migration measured in the cores as a base line. In

50
other words, the procedure was set when the height of the migration in the lab
compacted specimen matched that of the field core migration. This procedure is not a
guarantee since the amount of field compaction and environmental conditions can vary
project to project and the procedure was based on only one project. However, it did
prove to be a useful tool in determining if formula changes were an improvement over
previous formulas and in minimizing the number of unsuccessful field trials necessary to
achieve the desired product. The lab procedure is detailed in Appendix B.
The lab procedure helped rule out several intermediate formulations before those that
were finally used on US 51. Two such formulations were designated 5005 and 4004.
The lab trials showed that the 5005 material did not soften much, thus not migrating up
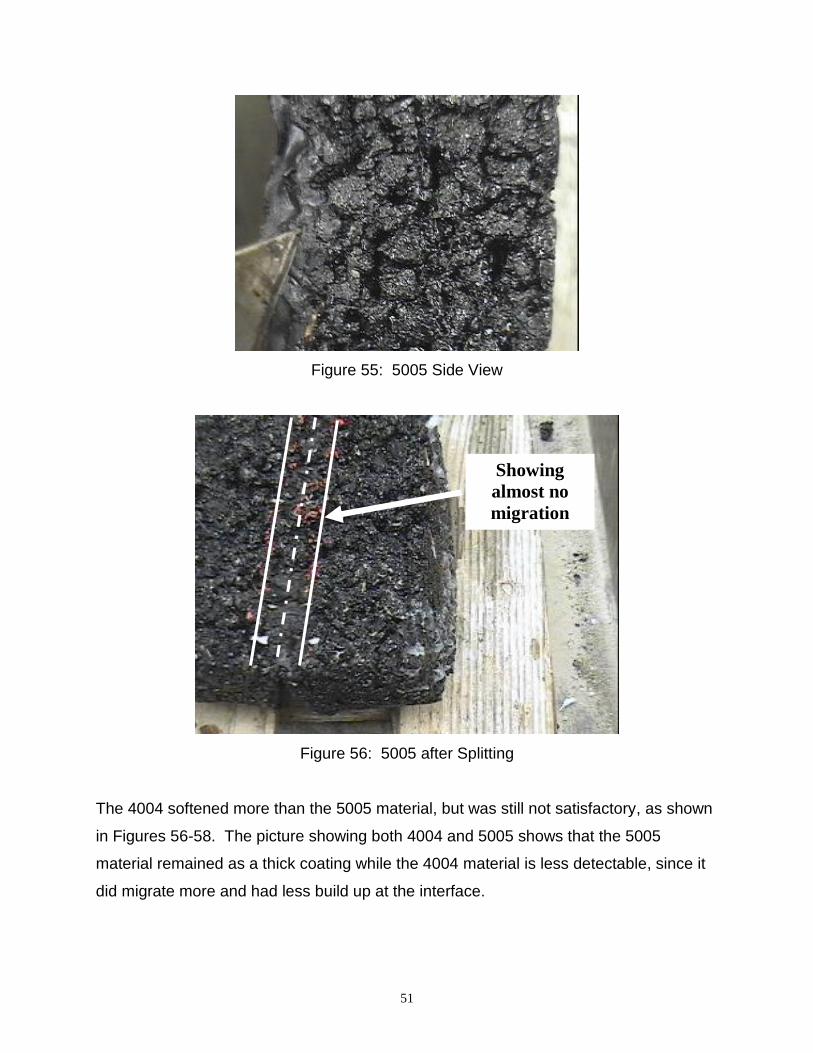
into the sample, as shown in Figures 53 - 55.
Figure 54: 5005 Bottom View
51
Figure 55: 5005 Side View
Figure 56: 5005 after Splitting
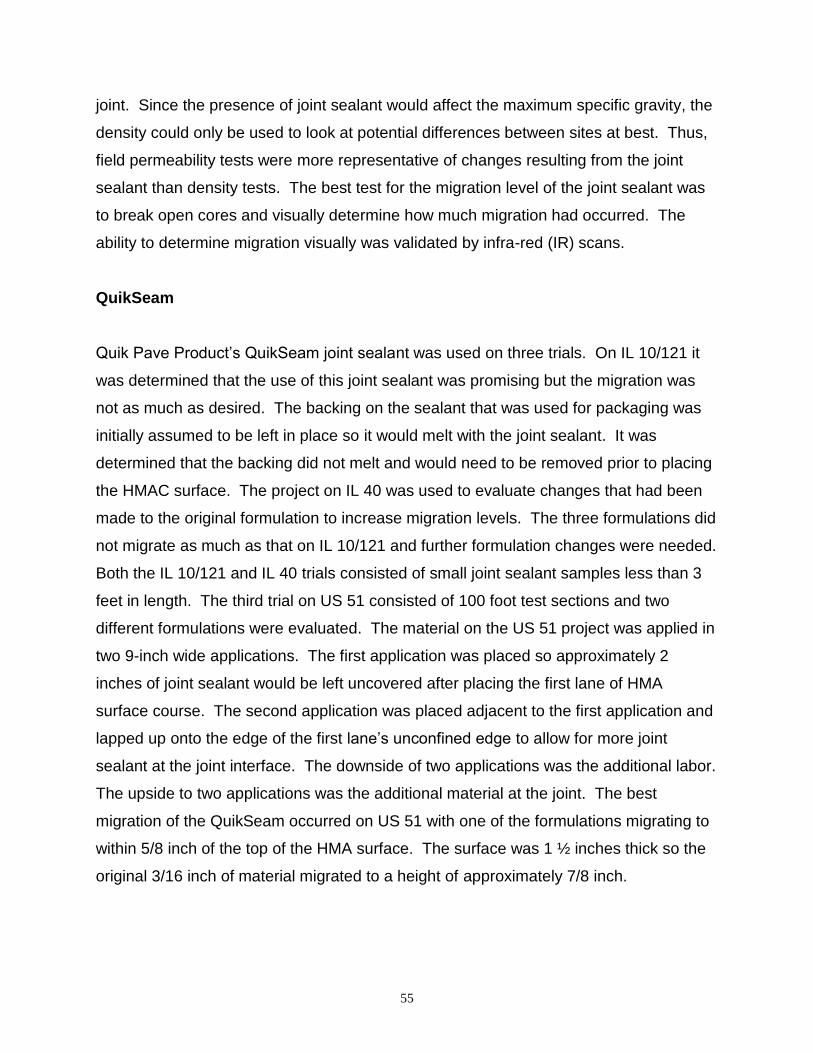
The 4004 softened more than the 5005 material, but was still not satisfactory, as shown
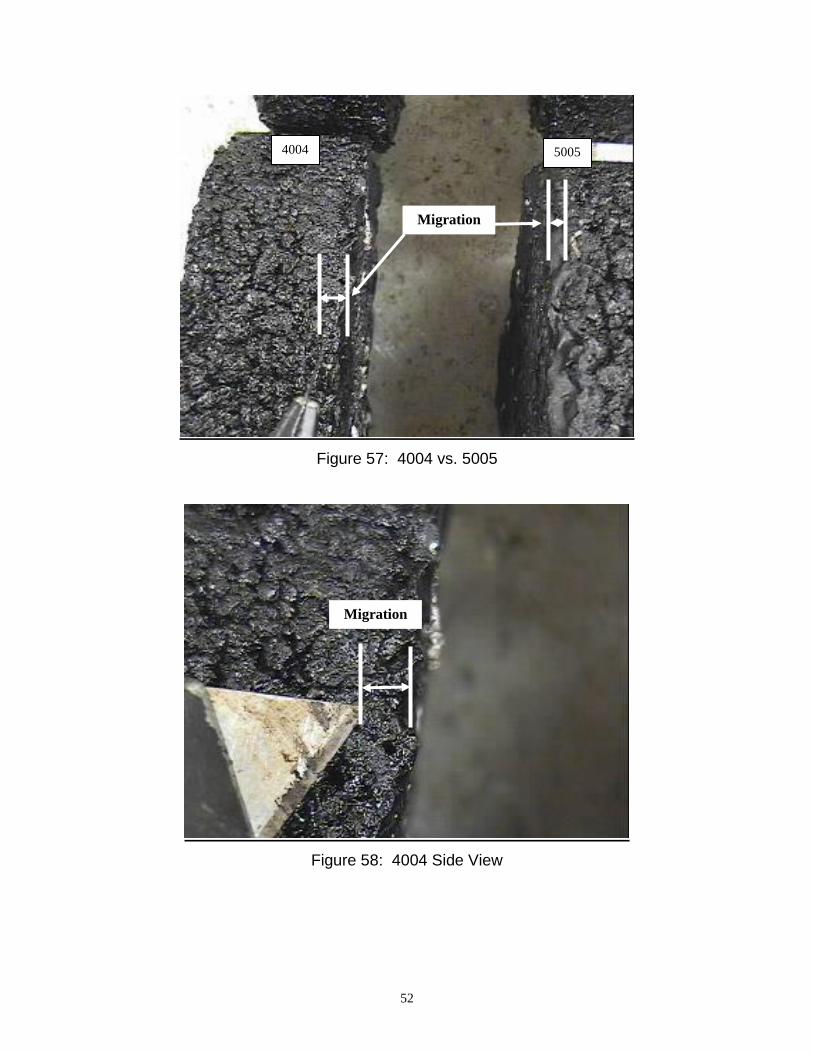
in Figures 56-58. The picture showing both 4004 and 5005 shows that the 5005
material remained as a thick coating while the 4004 material is less detectable, since it
did migrate more and had less build up at the interface.
Showing
almost no
migration
52
Figure 57: 4004 vs. 5005
Figure 58: 4004 Side View
4004 5005
Migration
Migration

53
Figure 59: 4004 after Splitting
The lab procedure proved to be a helpful tool in that it helped determine if a joint sealant
is worth field testing. However, the procedure is just a tool. If the conditions vary from
the project used to determine the procedure, then the lab procedure will be less
representative of what is observed in the field. The lab procedure did show how heat
and pressure are critical in maximizing migration. The difference in 50°F and 10
gyrations was the difference between the gyratory sample flushing and the gyratory
sample producing very little migration. Thus, field practice to apply compactive effort as
soon as possible is critical in maximizing joint sealant migration.

54
CONCLUSIONS
The various projects tested confirmed that joint density is typically less than 90% of the
maximum specific gravity of the HMA surface mixture. The low density allows the
infiltration of water and air, which accounts for the premature distresses commonly
observed in bituminous joints. The problem is not confined to the joint interface. Low
density was typically found 4 to 6 inches out on both sides of the joint. The unconfined
side of the joint typically had lower density than the confined side, as would be
expected. Although the density of the confined edge was higher than that of the
unconfined edge, the density and permeability were still at undesirable levels.
The two joint sealant products chosen for testing, Emulsicoat’s Jband and Quik Pave
Product’s QuikSeam, were placed on the pavement prior to placing the HMA surface.
Both products extended between 6 to 9 inches on both sides of the joint in order to
address the entire low density joint area. Both products are a solid prior to covering
with the HMA surface. The heat of the HMA surface softens the joint sealant. The
pressure from compacting with a vibratory roller causes the joint sealant to migrate
upward into the high voided HMA surface course. The result is a joint area that
prevents water and air infiltration into the lower pavement lifts and that significantly
decreases permeability in the HMA surface course.
Various methods were used to determine the effectiveness of the joint sealants. The
lab permeameter did not detect changes based on migration levels into the surface.
However, the lab permeameter did confirm that the joint sealant did prevent water form
migrating into the pavement below the HMA surface. Field permeability testing was
used to determine the amount of water flow in the HMA surface. Field permeability
results on control sections were much greater than the 100x10-5 cm/sec desired values.
The joint sealant significantly decreased the field permeability by typically showing at
least a 50% reduction in permeability versus the results in the control sections.
Although the permeability was significantly decreased, it was still above the 100x10-5
cm/sec desired value. Nuclear density readings were also taken at and around the
55
joint. Since the presence of joint sealant would affect the maximum specific gravity, the
density could only be used to look at potential differences between sites at best. Thus,
field permeability tests were more representative of changes resulting from the joint
sealant than density tests. The best test for the migration level of the joint sealant was
to break open cores and visually determine how much migration had occurred. The
ability to determine migration visually was validated by infra-red (IR) scans.
QuikSeam
Quik Pave Product’s QuikSeam joint sealant was used on three trials. On IL 10/121 it
was determined that the use of this joint sealant was promising but the migration was
not as much as desired. The backing on the sealant that was used for packaging was
initially assumed to be left in place so it would melt with the joint sealant. It was
determined that the backing did not melt and would need to be removed prior to placing
the HMAC surface. The project on IL 40 was used to evaluate changes that had been
made to the original formulation to increase migration levels. The three formulations did
not migrate as much as that on IL 10/121 and further formulation changes were needed.
Both the IL 10/121 and IL 40 trials consisted of small joint sealant samples less than 3
feet in length. The third trial on US 51 consisted of 100 foot test sections and two
different formulations were evaluated. The material on the US 51 project was applied in
two 9-inch wide applications. The first application was placed so approximately 2
inches of joint sealant would be left uncovered after placing the first lane of HMA
surface course. The second application was placed adjacent to the first application and
lapped up onto the edge of the first lane’s unconfined edge to allow for more joint
sealant at the joint interface. The downside of two applications was the additional labor.
The upside to two applications was the additional material at the joint. The best
migration of the QuikSeam occurred on US 51 with one of the formulations migrating to
within 5/8 inch of the top of the HMA surface. The surface was 1 ½ inches thick so the
original 3/16 inch of material migrated to a height of approximately 7/8 inch.

56
Jband
Emulsicoat’s Jband was used on three trials. The initial trial was on a retention pond
base in Indiana. The Jband material did migrate high enough in some areas to cause
flushing. Since the HMA surface material used on the retention pond had lower voids
and higher asphalt content than typical IDOT HMA surface mixtures, the results of the
Jband on this project were inconclusive. The project at Lakes at Riverbend subdivision
in Mahomet, Illinois was used to evaluate Jband when using a conventional IDOT HMA
surface. Approximately 525 feet of Jband was applied at the centerline joint. The
Jband did decrease permeability. The migration height into the surface was not as high
as desired; however, with increased migration the permeability could be further
decreased. The Jband did not appear to have tracking problems but the project was
also done in the cool weather of November, which could contribute to the lack of
tracking. The third project on US 51 consisted of two 100 foot test sections. One test
section consisted of placing Jband 12 inches wide while the other placed Jband 18
inches wide. The best migration of the Jband was observed on the US 51 project, as
the Jband migrated to within ½ inch of the top of the HMA surface. The surface was 1
½ inches thick so the original 3/16 inch of material migrated to a height of approximately
1 inch.
Lab Procedure
Field trials were very time and labor intensive. A lab procedure was developed based
on the material and migration levels of the Jband at the Lakes at Riverbend subdivision.
The lab procedure was a good tool to determine if formulation changes were worth
taking to the field. Several joint sealant formulations were never tested in the field
because the lab procedure indicated there would be little, if any, additional migration
from what had been observed with previous formulations. Since the joint sealant
migration is sensitive to construction practices, the lab procedure is only a relative
measurement of change and not directly related to field migration. The lab procedure
helped to determine the formulations that were used on US 51. The migrations of both
57
the QuikSeam and the Jband were better than experienced on previous trials, as both
came to within ½ inch of the top of the HMA surface.
Overall, it was determined that the joint sealant was more effective in decreasing
permeability than applying an extra bituminous prime coat or applying nothing at all.
Construction practices as well as environmental and climatic condition may affect
migration. Heating the joint sealant and applying pressure are very important to the
amount of joint sealant migration that occurs. The heat provides the ability for the joint
sealant to melt and the pressure provides the necessary force to promote migration.
The ability of the various joint sealants to withstand traffic without tracking still remains a
concern. An evaluation of tracking would be more effective with larger test sections.
Further formulation changes may be needed for both products. Based on the previous
trials, a larger scale test section would help to better evaluate placement and
construction issues.

58
RECOMMENDATIONS
1. Additional formulation changes to maximize migration while minimizing tracking
is recommended.
2. A demonstration project utilizing a longer test section to fully evaluate
constructability issues is recommended.
3. Investigating how heat and pressure affect sealant migration through various
rolling patterns is recommended.
4. Further verification of the lab procedure to better predict the performance of other
potential joint sealants is recommended.
5. A cost analysis for the benefits of joint sealant versus the cost of the joint sealant
is recommended.
6. Performing yearly follow-up visits to the various field trials to monitor and
document performance observations is recommended.
7. Implementing widespread use of joint sealant prior to evaluating constructability
issues is not recommended.
59
REFERENCES
1. R.B. Mallick, L.A. Cooley, Jr., M.R. Teto, R.L. Bradbury, and D. Peabody. “An Evaluation of Factors Affecting Permeability of Superpave Designed Pavements.” Prepared for Presentation and Publication at the 80th Annual Meeting of the Transportation Research Board. January 2001.
2. L.A. Cooley, Jr., E.R. Brown, and S. Maghsoodloo. “Development of Critical Field Permeability and Pavement Density Values for Coarse Graded Superpave Pavements.” Journal of the Transportation Research Board. No. 1761,2001.

A - 1
APPENDIX A
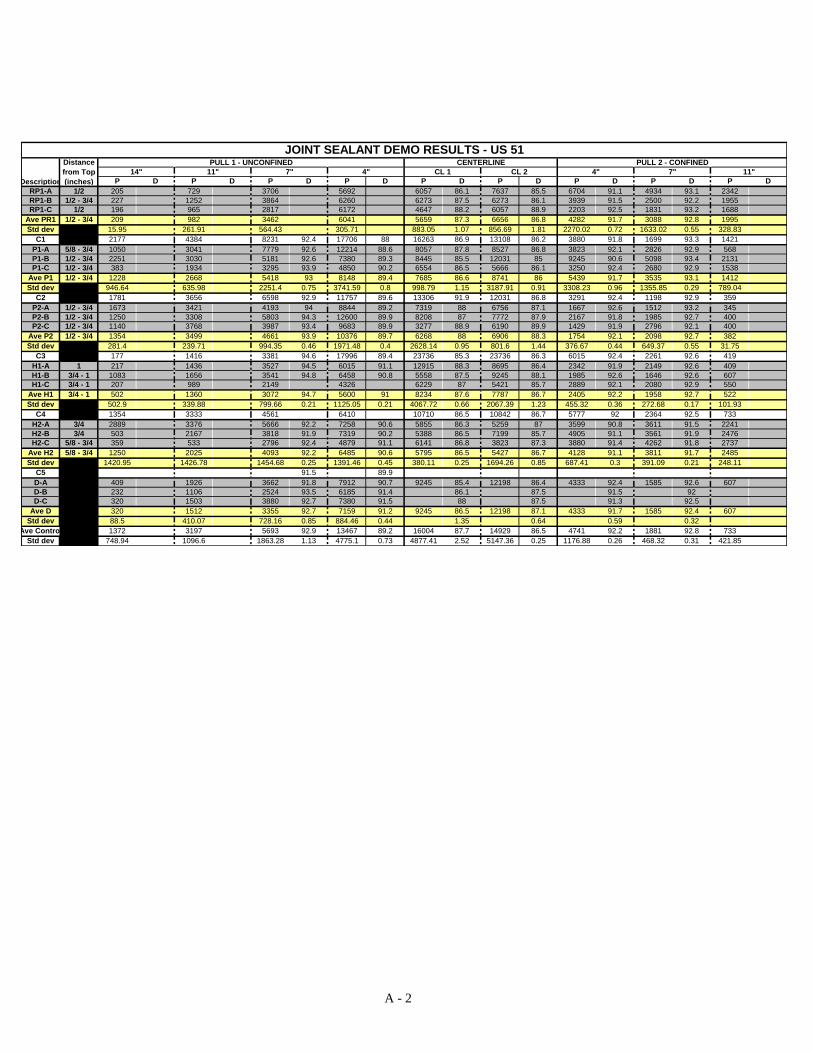
A - 2
P D P D P D P D P D P D P D P D P D
RP1-A 1/2 205 729 3706 5692 6057 86.1 7637 85.5 6704 91.1 4934 93.1 2342
RP1-B 1/2 - 3/4 227 1252 3864 6260 6273 87.5 6273 86.1 3939 91.5 2500 92.2 1955
RP1-C 1/2 196 965 2817 6172 4647 88.2 6057 88.9 2203 92.5 1831 93.2 1688
Ave PR1 1/2 - 3/4 209 982 3462 6041 5659 87.3 6656 86.8 4282 91.7 3088 92.8 1995
Std dev 15.95 261.91 564.43 305.71 883.05 1.07 856.69 1.81 2270.02 0.72 1633.02 0.55 328.83
C1 2177 4384 8231 92.4 17706 88 16263 86.9 13108 86.2 3880 91.8 1699 93.3 1421
P1-A 5/8 - 3/4 1050 3041 7779 92.6 12214 88.6 8057 87.8 8527 86.8 3823 92.1 2826 92.9 568
P1-B 1/2 - 3/4 2251 3030 5181 92.6 7380 89.3 8445 85.5 12031 85 9245 90.6 5098 93.4 2131
P1-C 1/2 - 3/4 383 1934 3295 93.9 4850 90.2 6554 86.5 5666 86.1 3250 92.4 2680 92.9 1538
Ave P1 1/2 - 3/4 1228 2668 5418 93 8148 89.4 7685 86.6 8741 86 5439 91.7 3535 93.1 1412
Std dev 946.64 635.98 2251.4 0.75 3741.59 0.8 998.79 1.15 3187.91 0.91 3308.23 0.96 1355.85 0.29 789.04
C2 1781 3656 6598 92.9 11757 89.6 13306 91.9 12031 86.8 3291 92.4 1198 92.9 359
P2-A 1/2 - 3/4 1673 3421 4193 94 8844 89.2 7319 88 6756 87.1 1667 92.6 1512 93.2 345
P2-B 1/2 - 3/4 1250 3308 5803 94.3 12600 89.9 8208 87 7772 87.9 2167 91.8 1985 92.7 400
P2-C 1/2 - 3/4 1140 3768 3987 93.4 9683 89.9 3277 88.9 6190 89.9 1429 91.9 2796 92.1 400
Ave P2 1/2 - 3/4 1354 3499 4661 93.9 10376 89.7 6268 88 6906 88.3 1754 92.1 2098 92.7 382
Std dev 281.4 239.71 994.35 0.46 1971.48 0.4 2628.14 0.95 801.6 1.44 376.67 0.44 649.37 0.55 31.75
C3 177 1416 3381 94.6 17996 89.4 23736 85.3 23736 86.3 6015 92.4 2261 92.6 419
H1-A 1 217 1436 3527 94.5 6015 91.1 12915 88.3 8695 86.4 2342 91.9 2149 92.6 409
H1-B 3/4 - 1 1083 1656 3541 94.8 6458 90.8 5558 87.5 9245 88.1 1985 92.6 1646 92.6 607
H1-C 3/4 - 1 207 989 2149 4326 6229 87 5421 85.7 2889 92.1 2080 92.9 550
Ave H1 3/4 - 1 502 1360 3072 94.7 5600 91 8234 87.6 7787 86.7 2405 92.2 1958 92.7 522
Std dev 502.9 339.88 799.66 0.21 1125.05 0.21 4067.72 0.66 2067.39 1.23 455.32 0.36 272.68 0.17 101.93
C4 1354 3333 4561 6410 10710 86.5 10842 86.7 5777 92 2364 92.5 733
H2-A 3/4 2889 3376 5666 92.2 7258 90.6 5855 86.3 5259 87 3599 90.8 3611 91.5 2241
H2-B 3/4 503 2167 3818 91.9 7319 90.2 5388 86.5 7199 85.7 4905 91.1 3561 91.9 2476
H2-C 5/8 - 3/4 359 533 2796 92.4 4879 91.1 6141 86.8 3823 87.3 3880 91.4 4262 91.8 2737
Ave H2 5/8 - 3/4 1250 2025 4093 92.2 6485 90.6 5795 86.5 5427 86.7 4128 91.1 3811 91.7 2485
Std dev 1420.95 1426.78 1454.68 0.25 1391.46 0.45 380.11 0.25 1694.26 0.85 687.41 0.3 391.09 0.21 248.11
C5 91.5 89.9
D-A 409 1926 3662 91.8 7912 90.7 9245 85.4 12198 86.4 4333 92.4 1585 92.6 607
D-B 232 1106 2524 93.5 6185 91.4 86.1 87.5 91.5 92
D-C 320 1503 3880 92.7 7380 91.5 88 87.5 91.3 92.5
Ave D 320 1512 3355 92.7 7159 91.2 9245 86.5 12198 87.1 4333 91.7 1585 92.4 607
Std dev 88.5 410.07 728.16 0.85 884.46 0.44 1.35 0.64 0.59 0.32
Ave Control 1372 3197 5693 92.9 13467 89.2 16004 87.7 14929 86.5 4741 92.2 1881 92.8 733
Std dev 748.94 1096.6 1863.28 1.13 4775.1 0.73 4877.41 2.52 5147.36 0.25 1176.88 0.26 468.32 0.31 421.85
11"CL 1 CL 2 4" 7"
JOINT SEALANT DEMO RESULTS - US 51
Description
Distance
from Top
(inches)
PULL 1 - UNCONFINED CENTERLINE PULL 2 - CONFINED
14" 11" 7" 4"

B - 1
APPENDIX B
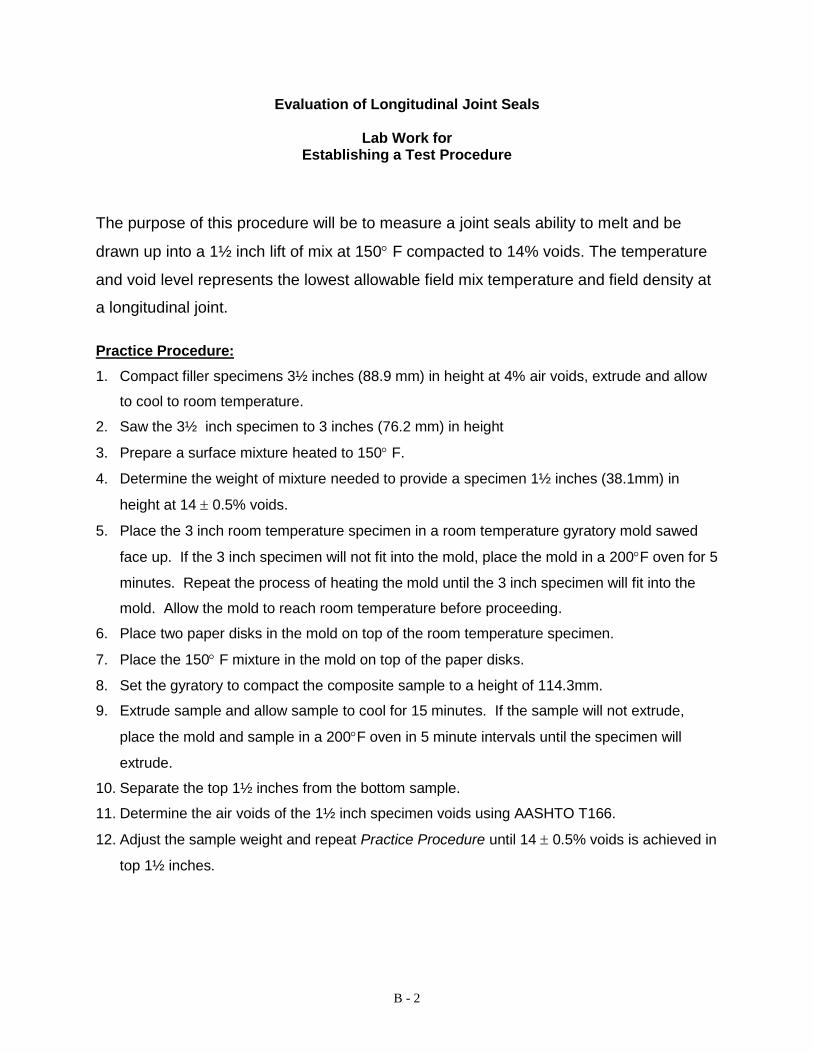
B - 2
Evaluation of Longitudinal Joint Seals
Lab Work for Establishing a Test Procedure
The purpose of this procedure will be to measure a joint seals ability to melt and be
drawn up into a 1½ inch lift of mix at 150 F compacted to 14% voids. The temperature
and void level represents the lowest allowable field mix temperature and field density at
a longitudinal joint.
Practice Procedure:
1. Compact filler specimens 3½ inches (88.9 mm) in height at 4% air voids, extrude and allow
to cool to room temperature.
2. Saw the 3½ inch specimen to 3 inches (76.2 mm) in height
3. Prepare a surface mixture heated to 150 F.
4. Determine the weight of mixture needed to provide a specimen 1½ inches (38.1mm) in
height at 14 0.5% voids.
5. Place the 3 inch room temperature specimen in a room temperature gyratory mold sawed
face up. If the 3 inch specimen will not fit into the mold, place the mold in a 200F oven for 5
minutes. Repeat the process of heating the mold until the 3 inch specimen will fit into the
mold. Allow the mold to reach room temperature before proceeding.
6. Place two paper disks in the mold on top of the room temperature specimen.
7. Place the 150 F mixture in the mold on top of the paper disks.
8. Set the gyratory to compact the composite sample to a height of 114.3mm.
9. Extrude sample and allow sample to cool for 15 minutes. If the sample will not extrude,
place the mold and sample in a 200F oven in 5 minute intervals until the specimen will
extrude.
10. Separate the top 1½ inches from the bottom sample.
11. Determine the air voids of the 1½ inch specimen voids using AASHTO T166.
12. Adjust the sample weight and repeat Practice Procedure until 14 0.5% voids is achieved in
top 1½ inches.

B - 3
Procedure using Joint seal:
1. Compact filler specimens 3½ inches (88.9 mm) in height at 4% voids, extrude and allow to
cool to room temperature.
2. Saw the 3½ inch filler specimen to 3 inches (76.2 mm) in height.
3. Prepare the polymer surface mixture and heat to 150 F.
4. Use predetermined weight of mixture to provide a specimen 1½ inches (38.1mm) in height
at 14 0.5% voids.
5. Weigh and record the sample weight of sealant to be used to obtain desired thickness.
(Typically 3/16 inch = ~ 100g) Note: Have samples prepared before next step.
6. Place the 3 inch room temperature specimen in a room temperature gyratory mold with the
sawed face up. If the 3 inch specimen will not fit into the mold, place the mold in a 200F
oven for 5 minutes. Repeat the process of heating the mold until the 3 inch specimen will fit
into the mold. Allow the mold to reach room temperature before proceeding.
7. Place two paper disks on top of the 3 inch specimen.
8. Place a 6 inch diameter sample of joint seal in the mold on top of the paper disks.
9. Place the 150 F mixture in the mold on top of the joint seal.
10. Set the gyratory to compact the composite sample to 10 gyrations and compact.
11. Extrude sample and allow sample to cool for 15 minutes.
12. Separate the top 1½ inch specimen from the bottom 3 inch specimen.
13. Split the 1½ inch specimen using the indirect tensile compression head.
14. Visually observe and record the distance the joint seal migrated upward.