Embed Size (px)
Citation preview

Development and evaluation of a
crosswalk between Health Assessment Questionnaire
Disability index and SF-36 physical functioning scale in rheumatoid arthritis
Martijn A.H. Oude Voshaar,

Introduction
Multitude of measures for a single domain - 26 physical function questionnaires in RA*
Barrier to the interpretation of study results
Health Assessment Questionnaire Disability Index - 20 items - 0 (without any difficulty ) – 3 (Unable to do)
- Total score: 0-3; Higher scores indicate more disability
SF-36 Physical functioning scale - 10 items - 1 (Yes, limited a lot) – (3 No, not limited at all ) - Total score: 0-100, Higher scores indicate better functioning
*Oude Voshaar MA, Ten Klooster PM, Taal E, van de Laar MA. Measurement properties of physical function scales validated for use in
patients with rheumatoid arthritis: A systematic review of the literature. Health Qual Life Outcomes. 2011;9:99.

Basic process of developing an IRT-based crosswalk
‘Concurrent item
calibration’
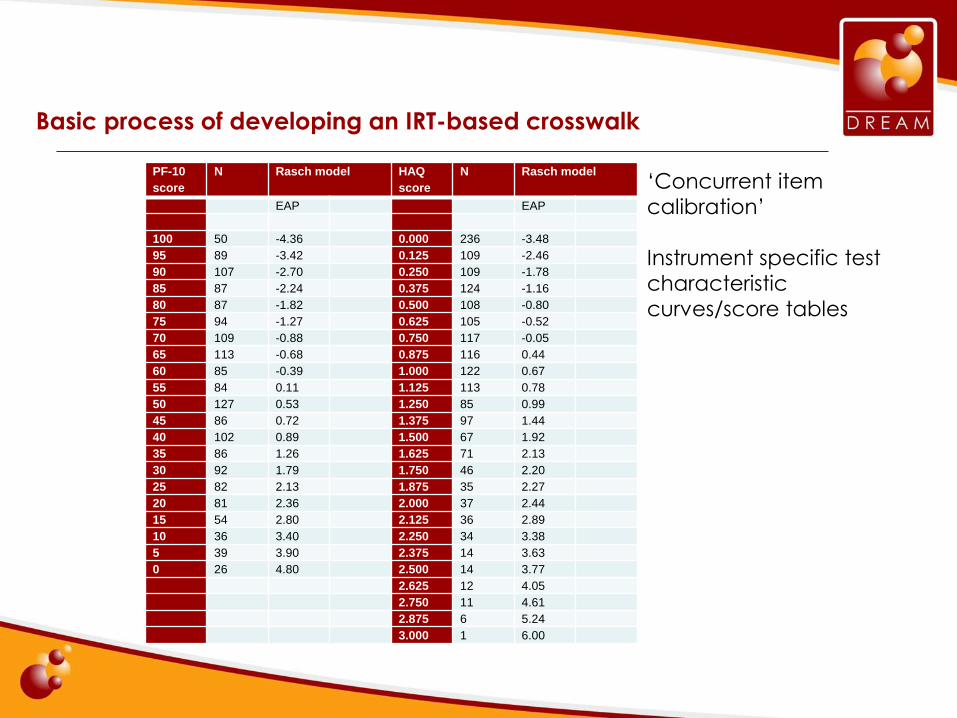
Basic process of developing an IRT-based crosswalk
‘Concurrent item
calibration’
Instrument specific test
characteristic
curves/score tables
PF-10
score
N Rasch model HAQ
score
N Rasch model
EAP EAP
100 50 -4.36 0.000 236 -3.48
95 89 -3.42 0.125 109 -2.46
90 107 -2.70 0.250 109 -1.78
85 87 -2.24 0.375 124 -1.16
80 87 -1.82 0.500 108 -0.80
75 94 -1.27 0.625 105 -0.52
70 109 -0.88 0.750 117 -0.05
65 113 -0.68 0.875 116 0.44
60 85 -0.39 1.000 122 0.67
55 84 0.11 1.125 113 0.78
50 127 0.53 1.250 85 0.99
45 86 0.72 1.375 97 1.44
40 102 0.89 1.500 67 1.92
35 86 1.26 1.625 71 2.13
30 92 1.79 1.750 46 2.20
25 82 2.13 1.875 35 2.27
20 81 2.36 2.000 37 2.44
15 54 2.80 2.125 36 2.89
10 36 3.40 2.250 34 3.38
5 39 3.90 2.375 14 3.63
0 26 4.80 2.500 14 3.77
2.625 12 4.05
2.750 11 4.61
2.875 6 5.24
3.000 1 6.00

Basic process of developing an IRT-based crosswalk
‘Concurrent item
calibration’
Instrument specific test
characteristic curves/
score tables
Summed score linking*
*Orlando M, Sherbourne CD, Thissen D.
Summed-score linking using item response
theory: Application to depression
measurement. Psychological Assessment.
2000;12(3):354.
PF-10
score
N Rasch model HAQ
score
N Rasch model
EAP EAP
100 50 -4.36 0.000 236 -3.48
95 89 -3.42 0.125 109 -2.46
90 107 -2.70 0.250 109 -1.78
85 87 -2.24 0.375 124 -1.16
80 87 -1.82 0.500 108 -0.80
75 94 -1.27 0.625 105 -0.52
70 109 -0.88 0.750 117 -0.05
65 113 -0.68 0.875 116 0.44
60 85 -0.39 1.000 122 0.67
55 84 0.11 1.125 113 0.78
50 127 0.53 1.250 85 0.99
45 86 0.72 1.375 97 1.44
40 102 0.89 1.500 67 1.92
35 86 1.26 1.625 71 2.13
30 92 1.79 1.750 46 2.20
25 82 2.13 1.875 35 2.27
20 81 2.36 2.000 37 2.44
15 54 2.80 2.125 36 2.89
10 36 3.40 2.250 34 3.38
5 39 3.90 2.375 14 3.63
0 26 4.80 2.500 14 3.77
2.625 12 4.05
2.750 11 4.61
2.875 6 5.24
3.000 1 6.00
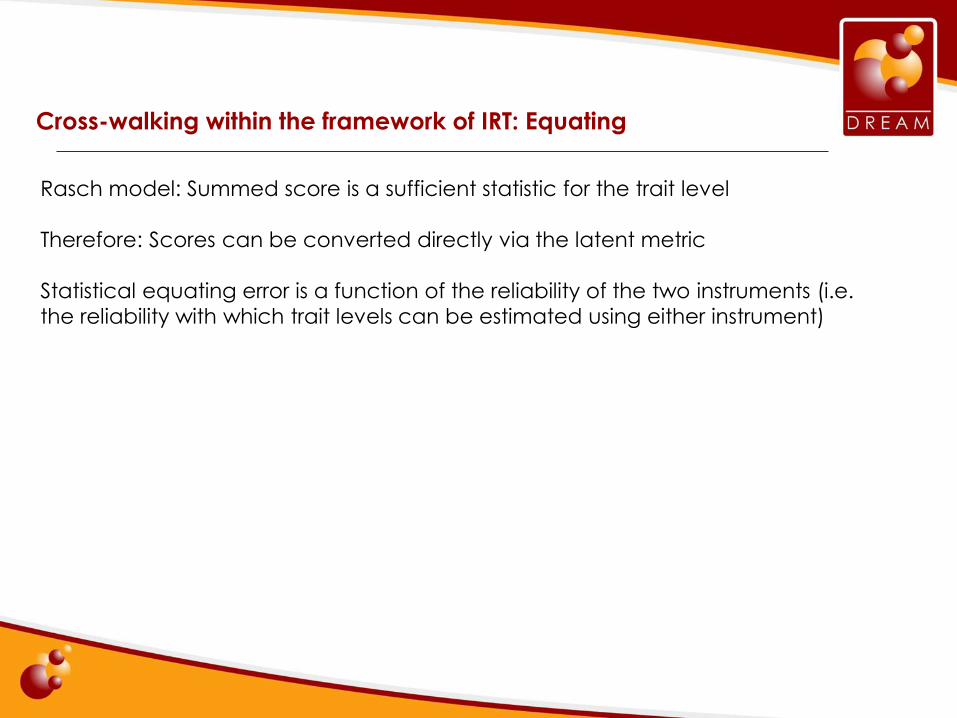
Cross-walking within the framework of IRT: Equating
Rasch model: Summed score is a sufficient statistic for the trait level
Therefore: Scores can be converted directly via the latent metric
Statistical equating error is a function of the reliability of the two instruments (i.e.
the reliability with which trait levels can be estimated using either instrument)
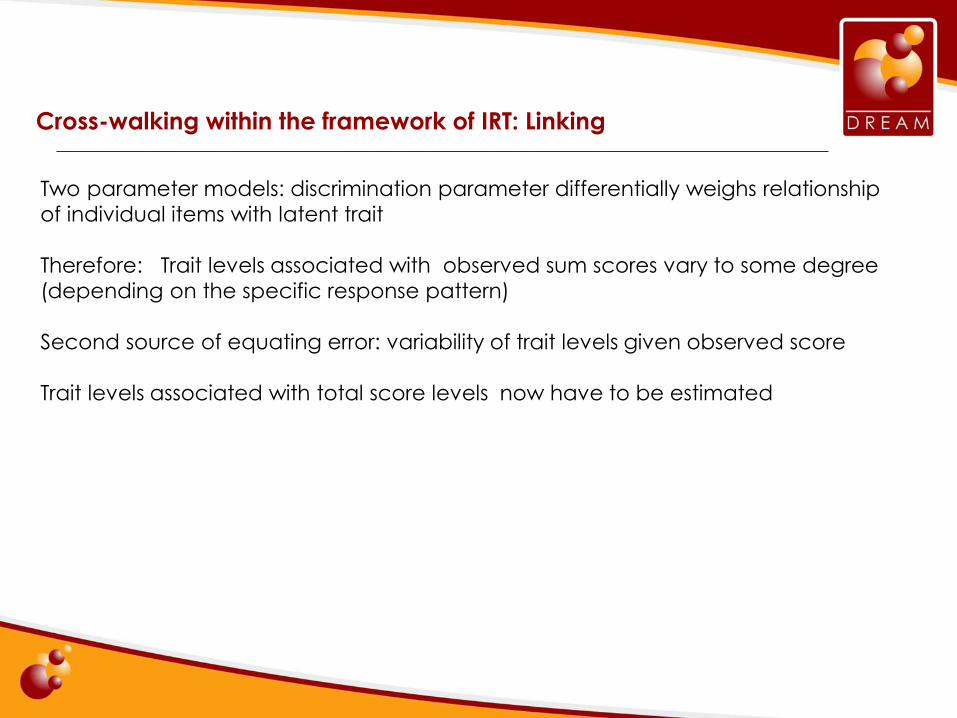
Cross-walking within the framework of IRT: Linking
Two parameter models: discrimination parameter differentially weighs relationship
of individual items with latent trait
Therefore: Trait levels associated with observed sum scores vary to some degree
(depending on the specific response pattern)
Second source of equating error: variability of trait levels given observed score
Trait levels associated with total score levels now have to be estimated

Cross-walking within the framework of IRT: Further generalization of
the linking approach
Two instruments measure different yet highly correlated constructs
Two-dimensional IRT model where the responses pertain to instrument specific
latent dimensions
Third source of equating error related to the correlation between the latent
variables

Methods
• Baseline data DREAM registry
• HAQ-ADI & SF-36 Pf-10 data jointly calibrated
• 3 crosswalks developed and evaluated
- Model fit (item level LM statistics*)
- Precision (ICC, two-way mixed effects model with absolute agreement for
single measurements (type A,1)
• Cross-validation in US NDB data
- Rheumatoid arthritis
- Systemic lupus erythematosus
- Fibromyalgia
*Glas CA. Modification indices for the 2-PL and the nominal response model. Psychometrika. 1999;64(3):273-94.

Patient characteristics of the calibration sample
Calibration
sample
(n=1791)
Sex, % female 69.2
Age in years, mean (SD) 56.54 (13.31)
HAQ-SDI (0-3), mean (SD)* 1.08 (0.71)
PF-10 (0-100), mean (SD) 53.89 (26.35)
DAS28, mean (SD)* 4.28 (1.51)
VAS Pain (0-100), mean (SD)* 43.38 (26.23)
VAS General Health (0-100), mean
(SD)*
44.49 (26.48)

Model fit: Rasch model
β1 (SD) β2 (SD) β3 (SD) L.M. p E.S.
Dressing -0.25 (0.05) 1.54 (0.06) 4.26 (0.12) 7.03 0.03 0.03
Rising -0.06 (0.05) 1.94 (0.06) 6.68 (0.28) 9.02 0.01 0.03
Eating -1.13 (0.06) 1.29 (0.05) 3.27 (0.08) 7.86 0.02 0.03
Walking 0.00 (0.05) 1.62 (0.06) 4.01 (0.11) 7.58 0.02 0.05
Hygiene -0.48 (0.06) -0.50 (0.05) 2.53 (0.06) 11.84 0.00 0.06
Reaching -0.73 (0.06) 0.97 (0.05) 3.33 (0.08) 3.40 0.18 0.02
Grasping -0.74 (0.06) -0.89 (0.05) 3.72 (0.08) 11.41 0.00 0.05
Activities -1.55 (0.06) 0.13 (0.05) 2.84 (0.08) 3.12 0.21 0.03
Vigorous activities -3.94 (0.09) -1.23 (0.05) 24.69 0.00 0.04
Moderate activities -2.20 (0.07) 1.68 (0.05) 7.01 0.03 0.02
Lifting or carrying groceries -2.17 (0.07) 1.44 (0.05) 5.54 0.06 0.02
Climbing several flights of stairs -1.06 (0.06) 1.55 (0.06) 8.92 0.01 0.03
Climbing one flight of stairs -0.17 (0.06) 2.85 (0.07) 18.63 0.00 0.03
Bending, kneeling or stooping -2.02 (0.06) 1.18 (0.05) 5.15 0.08 0.03
Walking more than a mile -0.97 (0.05) 0.94 (0.06) 3.26 0.20 0.03
Walking several blocks 0.13 (0.07) 2.36 (0.08) 100.71 0.00 0.07
Walking one block 0.71 (0.06) 3.12 (0.09) 24.39 0.00 0.03
Bathing and dressing self 0.28 (0.05) 3.94 (0.09) 1.26 0.53 0.01

Relative precision: Intraclass correlation coefficient (95% ci)
Rasch
model
Two-parameter
model
Multi-dimensional
model
Precision of predicted
HAQ-ADI scores
0.737 (0.714 to 0.758)
0.739 (0.716 to 0.760)
0.737 (0.715 to 0.759)
Precision of predicted
PF-10 scores
0.738 (0.716 to 0.759)
0.736 (0.714 to 0.758)
0.744 (0.721 to 0.764)

Crosswalk
HAQ alternative disability index (ADI)
Observed
HAQ-ADI
score
Predicted
PF-10
score
Observed
PF-10
score
Predicted
HAQ-ADI
score 0.000 95 100 0.000
0.125 90 95 0.000
0.250 80 90 0.125
0.375 75 85 0.125
0.500 70 80 0.250
0.625 65 75 0.375
0.750 60 70 0.500
0.875 50 65 0.625
1.000 45 60 0.625
1.125 45 55 0.875
1.250 40 50 0.875
1.375 35 45 1.000
1.500 30 40 1.250
1.625 25 35 1.375
1.750 20 30 1.500
1.875 20 25 1.625
2.000 20 20 1.875
2.125 15 15 2.125
2.250 10 10 2.250
2.375 10 5 2.625
2.500 5 0 2.750
2.625 5
2.750 0
2.875 0
3.000 0

Patient characteristics National Data bank rheumatic diseases
FM (n= 3776) SLE (n=1609) RA (n=29020)
Age (SD) 53.44 (12.25) 47.55 (13.23) 58.15 (13.65)
Disease duration, years
(SD)
13.20 (10.38) 13.45 (10.33) 12.28 (10.91)
Sex, % female 94.2% 88% 77%
PCS (SD) 31.69 (8.96) 37.20 (11.35) 36.06 (10.79)
MCS (SD) 41.29 (12.31) 44.31 (11.66) 48.15 (11.65)
HAQ-ADI (SD) 0.95 (0.62) 0.58 (0.59) 0.84 (0.69)
PF-10 (SD) 50.56 (26.86) 65.25 9(29.28) 59.20 (28.81)

Precision Rasch Crosswalk in NDB data
ICC (95% CI) Mean difference
(SD)
LOA
(SD
RA
HAQ-ADI 0.77 (0.76 to 0.77) 0.01 (0.49) -0.95 to 0.97
PF-10 0.78 (0.77 to 0.78) 1.03 (18.54) -35.30 to 37.37
FM
HAQ-ADI 0.72 (0.69 to 0.74) -0.09 (0.51) -1.00 to 0.91
PF-10
0.73 (0.71 to 0.75) -2.53 (18.64) -39.06 to 34.00
SLE
HAQ-ADI 0.76 (0.73 to 0.79) -0.11 (0.46) -1.01 to 0.79
PF-10 0.78 (0.75 to 0.80) -3.28 (17.92) -38.40 to 31.84

Precision across total HAQ-ADI score levels
-2
-1,75
-1,5
-1,25
-1
-0,75
-0,5
-0,25
0
0,25
0,5
0,75
1
1,25
1,5
1,75
2
0 0,25 0,5 0,75 1 1,25 1,5 1,75 2 2,25 2,5 2,75 3

Thank you for your attention
My research is supported by a grant of the dutch
Arthritis Association