Embed Size (px)
Citation preview

Development and Demonstration of an In-Vehicle Lane Departure Warning System using Standard GPS Technology
M.I. Hayee, Principal Investigator Department of Electrical Engineering University of Minnesota
JUNE 2021
Research Project Final Report 2021-17
Office of Research & Innovation • mndot.gov/research

To request this document in an alternative format, such as braille or large print, call 651-366-4718 or 1-800-657-3774 (Greater Minnesota) or email your request to [email protected]. Please request at least one week in advance.

Technical Report Documentation Page 1. Report No.
MN 2021-17 2. 3. Recipients Accession No.
4. Title and Subtitle
Development and Demonstration of an In-Vehicle Lane Departure Warning System using Standard GPS Technology
5. Report Date
June 2021 6.
7. Author(s)
S. Chowdhury, Md T. Hossain, M. I. Hayee 8. Performing Organization Report No.
9. Performing Organization Name and Address
Electrical Engineering University of Minnesota Duluth 1049 University Drive Duluth, MN 55812
10. Project/Task/Work Unit No.
CTS #2019014 11. Contract (C) or Grant (G) No.
(c)1003325 (wo)75
12. Sponsoring Organization Name and Address
Minnesota Local Road Research Board Minnesota Department of Transportation Office of Research & Innovation 395 John Ireland Boulevard, MS 330 St. Paul, Minnesota 55155-1899
13. Type of Report and Period Covered
Final Design Report 14. Sponsoring Agency Code
15. Supplementary Notes
https://www.mndot.gov/research/reports/2021/202117.pdf 16. Abstract (Limit: 250 words)
A lane departure warning system (LDWS) has significant potential to reduce crashes on roads. Most existing commercial LDWSs use some kind of image processing techniques with or without Global Positioning System (GPS) technology and/or high-resolution digital maps to detect unintentional lane departures. However, the performance of such systems is compromised in unfavorable weather or road conditions, e.g., fog, snow, or irregular road markings. Previously, we proposed and developed an LDWS using a standard GPS receiver without any high-resolution digital maps. The previously developed LDWS relies on a road reference heading (RRH) of a given road extracted from an open-source, low-resolution mapping database to detect an unintentional lane departure. This method can detect true lane departures accurately but occasionally gives false alarms, i.e., it can issue lane departure warnings even when a vehicle is within its lane. The false alarms occur due to the inaccuracy of how the RRH originated from an inherent lateral error in open-source, low-resolution maps. To overcome this problem, we proposed and developed a novel algorithm to generate an accurate RRH for a given road using a vehicle’s past trajectories on that road. The newly developed algorithm that generates an accurate RRH for any given road has been integrated with the previously developed LDWS and extensively evaluated in the field for detection of unintentional lane departures. The field test results showed that the newly developed RRH Generation algorithm significantly improved the performance of the previously developed LDWS by accurately detecting all true lane departures while practically reducing the frequency of false alarms to zero.
17. Document Analysis/Descriptors
Lane lines, Driver support systems, Roadway guidance markers, Dedicated short range communications
18. Availability Statement
No restrictions. Document available from: National Technical Information Services, Alexandria, Virginia 22312
19. Security Class (this report)
Unclassified 20. Security Class (this page)
Unclassified 21. No. of Pages 46
22. Price
DEVELOPMENT AND DEMONSTRATION OF AN IN-VEHICLE LANE
DEPARTURE WARNING SYSTEM USING STANDARD GPS
TECHNOLOGY
FINAL REPORT
Prepared by:
Shahnewaz Chowdhury
Department of Electrical Engineering
University of Minnesota
Md Touhid Hossain
Department of Electrical Engineering
University of Minnesota
M.I. Hayee
Department of Electrical Engineering
University of Minnesota
June 2021
Published by:
Minnesota Department of Transportation
Office of Research & Innovation
395 John Ireland Boulevard, MS 330
St. Paul, Minnesota 55155-1899
This report represents the results of research conducted by the authors and does not necessarily represent the views or policies
of the Minnesota Department of Transportation or University of Minnesota. This report does not contain a standard or specified
technique.
The authors, the Minnesota Department of Transportation, and University of Minnesota do not endorse products or
manufacturers. Trade or manufacturers’ names appear herein solely because they are considered essential to this report.

ACKNOWLEDGMENTS
The authors wish to acknowledge those who made this research possible. The study was funded by the
Minnesota Department of Transportation (MnDOT) and Minnesota Local Road Research Board (LRRB).

TABLE OF CONTENTS
CHAPTER 1: Introduction ...................................................................................................................... 1
1.1 Background ......................................................................................................................................... 1
1.2 Objectives ........................................................................................................................................... 2
1.3 Methodology and System Architecture .............................................................................................. 3
CHAPTER 2: Road Reference Heading Generation ................................................................................ 5
2.1 RRH Generation Algorithm ................................................................................................................. 5
2.1.1 Identification of Various Sections ............................................................................................... 7
2.1.1.1 Identification of Straight Sections ............................................................................................ 8
2.1.1.2 Identification of Curve Sections ............................................................................................... 8
2.1.1.3 Identification of Transition Sections ........................................................................................ 9
2.1.2 Characterization of Various Sections ........................................................................................ 10
2.1.2.1 Characterization of Straight Section ...................................................................................... 10
2.1.2.2 Characterization of Curve Section .......................................................................................... 12
2.1.2.3 Characterization of Transition Section ................................................................................... 12
2.1.3 Combining All Sections to Generate a Composite RRH ............................................................. 12
2.2 Effect of Non-standard Trajectories on RRH .................................................................................... 14
2.2.1 Effect of Lane Change on Characterization of a Straight Section ............................................. 16
2.2.2 Effect of Lane Change on Characterization of a Curve Section: ................................................ 17
2.2.3 Altered Road Segment .............................................................................................................. 19
CHAPTER 3: V2V Communication For Transferring RRH ...................................................................... 20
3.1 Why V2V Communication ................................................................................................................. 20
3.2 V2V Handshake Protocol .................................................................................................................. 21
3.2.1 Implementation of V2V Handshake Protocol ............................................................................ 23
3.3 Transfer of RRH DATA Using V2V Communication ........................................................................... 25

CHAPTER 4: Field Tests, Results, and Conclusions ............................................................................... 28
4.1 Field Tests and Results ...................................................................................................................... 28
4.2 Conclusions and Future Work .......................................................................................................... 32
REFERENCES ....................................................................................................................................... 33

LIST OF FIGURES
Figure 1.1 Conceptual diagram showing how recorded past trajectory (black dashed line) of a given
vehicle can serve as reference direction of travel to detect its own unintentional lane departure in future
(black dotted line). ........................................................................................................................................ 3
Figure 1.2 Architectural diagram of the proposed LDWS. ............................................................................ 4
Figure 2.1 The conceptual diagram showing heading and differential heading of a road with two straight
sections and a curve section including transition sections ........................................................................... 5
Figure 2.2 Vehicle heading vs. distance for (a) the complete road segment and (b) a small portion of the
road segment highlighted by a dashed red circle. The picture of Google Map of the relevant portion of
the road is shown on the top. ....................................................................................................................... 6
Figure 2.3 Standard deviation of heading and differential heading using n-point calculation method for
varying values of n. ....................................................................................................................................... 6
Figure 2.4 (a) Vehicl e heading and (b) differential heading vs. distance for the entire trajectory. The
picture of Google Map of the relevant portion of the road is shown on the top......................................... 7
Figure 2.5 (a) Vehicl e heading and (b) differential heading vs. distance for a small portion of the
trajectory of Figure 2.4. This portion includes a part of first straight section, S1, T1, C1, T2, and a part of
S2. .................................................................................................................................................................. 9
Figure 2.6 (a) RMSHE and |ALS| vs. PAH for the straight section S1 showing optimal value of PAH, and
(b) a surface plot of |ALS| vs. IH and PAHS for the curve section C1 showing optimal combination of IH
and PAHS values .......................................................................................................................................... 11
Figure 2.7 Screenshot of a typical output file containing optimized parameters of each section in a
composite RRH ............................................................................................................................................ 13
Figure 2.8 (a) Heading of average composite RRH and three individual composite RRH obtained from
three different vehicle trajectories of 4.2 km segment of Interstate I-35, and (b) zoomed portion of (a)
highlighted by red dashed circle ................................................................................................................. 14
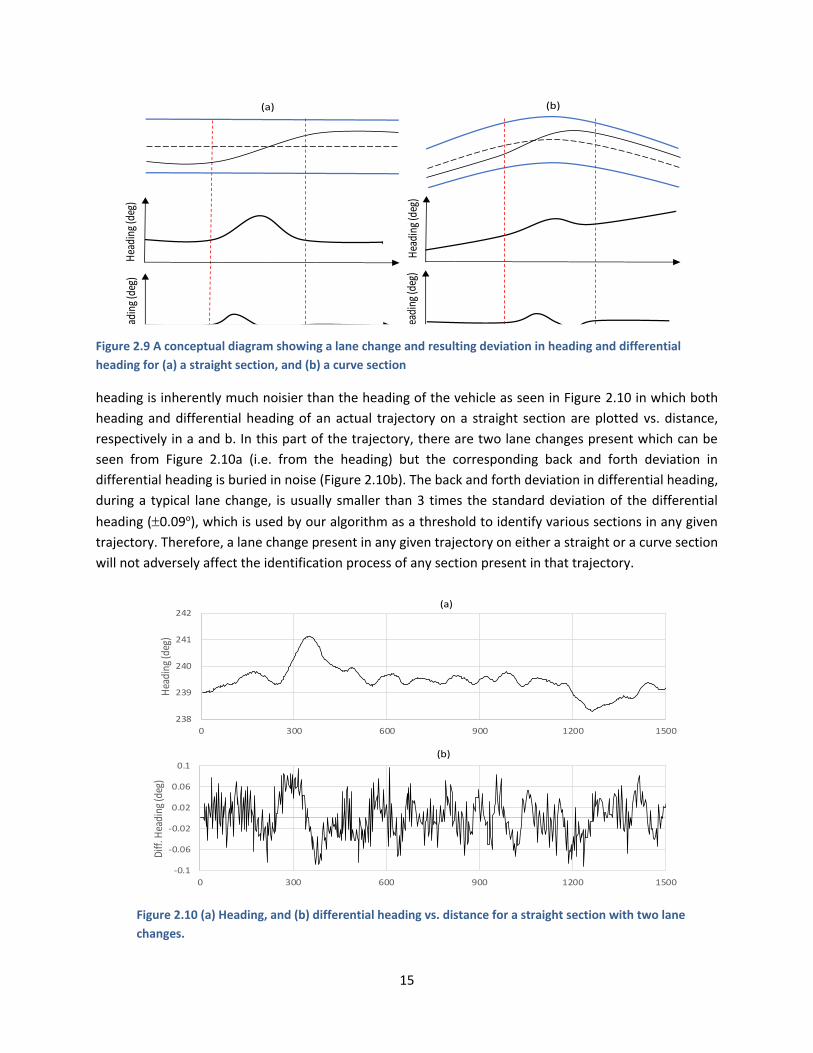
Figure 2.9 A conceptual diagram showing a lane change and resulting deviation in heading and
differential heading for (a) a straight section, and (b) a curve section ...................................................... 15
Figure 2.10 (a) Heading, and (b) differential heading vs. distance for a straight section with two lane
changes. ...................................................................................................................................................... 15
Figure 2.11 Heading error vs. distance for a straight section with three lane changes ............................. 16
Figure 2.12 Heading error vs. Distance for a curve section with one lane changes present in the middle of
the section. ................................................................................................................................................. 18

Figure 2.13 Heading error vs. distance for a curve section of Rice Lake Rd., without any lane change .... 19
Figure 3.1 A scenario illustrating V2V handshake protocol where (a) a vehicle VR in need of road
reference heading (RRH) broadcasts a REQUEST to all neighboring vehicles within its V2V
communication range, (b) all potential candidate vehicle (c olored in green) send a REPLY message back
to the requesting vehicle and (c) the requesting vehicle VR sends a SELECT message to receive RRH from
the most suitable potential candidate vehicle (V 1) ..................................................................................... 22
Figure 3.2 Flow chart of the V2V handshake protocol for a vehicle in need to receive RRH data of a given
road from the most suitable neighboring vehicle on that road ................................................................. 25
Figure 3.3 Screenshot of a typical RRH data file ......................................................................................... 26
Figure 3.4 Screenshot of the console of the DSRC device in the transmitter vehicle (left bubble box)
showing a text file of RRH data stored in the device and screenshot of the console of the DSRC device in
the receiving vehicle (right bubble box) when the RRH data is received via DSRC based V2V
communication. .......................................................................................................................................... 27
Figure 4.1 (a) Vehicl e heading and RRH vs traveled distance for one test trial, (b) ALS versus traveled
distance of the corresponding test trial trajectory, and (c) ALS versus distance on the same 4.2 km
segment of Interstate I-35 for four typical trial trajectories with no lane change ..................................... 29
Figure 4.2 A comparison between two LDWSs using a selected trajectory where the previous LDWS
issues false alarm (the red trajectory crosses the threshold line three times in absence of any lane
changes, indicating three false alarms). The blue trajectory does not cross the threshold line using the
new RRH and no false alarm is issued ......................................................................................................... 30
Figure 4.3 (a) Goo gle Earth view of a travel trajectory of a 4.2 km road segment on the interstate I-35
and (b) Zoomed portion of (a) high lighted by red dashed circle illustrating a typical V2V communication
scenario for transferring RRH data of that road segment .......................................................................... 31
LIST OF ABBREVIATIONS
RRH Road Reference Heading
PAH Path Average Heading
PAS Path Average Slope
PADH Path Average Differential Heading
ALS Accumulated Lateral Shift
ADAS Advance Driver Assistance Systems

EXECUTIVE SUMMARY
A lane departure warning system (LDWS) is a critical element among several other advanced driver-
assistance systems (ADAS) that has significant potential to reduce roadway departure crashes. The
majority of these crashes include a single vehicle running off the road and crashing into the roadside as
well as head-on crashes between two opposing vehicles. Generally, LDWSs use image-processing or
optical-scanning techniques to detect an unintentional lane departure. Most of the camera-based systems
use different image-processing techniques such as a linear parabolic lane model or the extended edge-
linking algorithm, both of which extract the lane markings from consecutive picture frames to calculate
lateral shift of a vehicle. Some of the LDWSs can also detect the lane markings under varying lighting
conditions. Similarly, optical scanning systems, which are comprised of a linear array of infrared
transmitting devices to scan the lateral area of the highway for lane marking, are inherently independent
of the varying lighting conditions.
Although advanced camera and optical sensor-based systems can be somewhat immune to varying
lightening conditions, they work as expected only in favorable weather and road conditions. Their
performance deteriorates when road conditions are not favorable, such as extensively worn or missing
pavement markings, or harsh weather conditions, e.g., snow or severe rain, resulting in an inaccurate lane
departure detection. Moreover, some systems use Global Positioning System (GPS) receivers in
conjunction with the lane-level resolution digital maps to improve efficiency of a camera-based system,
thereby making the overall system more complex and expensive to implement. To alleviate this problem,
previously, the project developed an LDWS that uses a standard GPS receiver and low-resolution maps
obtained from a commonly available digital mapping database without using any camera-based image
processing. The proposed system used the low-resolution digital maps to extract a road reference heading
(RRH) for any given road so that the current trajectory of any given vehicle on that road could be compared
to the RRH of that road to detect an unintentional lane departure. That system was developed and tested
in the field to evaluate its effectiveness. The field tests proved this system was effective enough to detect
any unintentional lane departure; however, occasionally it produced false alarms, i.e., it produced false
warning even when a vehicle was within its lane.
To alleviate this problem, a second phase of the project (to be discussed in this report) was proposed to
develop an enhanced LDWS for which the needed RRH was not extracted from a low-resolution digital
map but from a vehicle’s past trajectories on the same road. The enhanced LDWS extracts RRH of any
given road from a vehicle’s past trajectories on that road using a novel algorithm without the need of any
digital maps of the given road. The newly proposed RRH Generation algorithm generates RRH for any
given road using a vehicle’s one or more past trajectories on that road acquired by a standard GPS
receiver. Once a RRH for a given road is generated, it is used to detect any future unintentional lane
departure of a vehicle using the previously developed lane departure detection algorithm. The novelty of
the newly developed enhanced LDWS comes from the fact that an accurate RRH is generated from a
vehicle’s past trajectories on any given road instead of extracting it from digital road maps.
The process of converting a vehicle’s trajectory into a useful RRH works in three stages. In the first stage,
a vehicle’s GPS trajectory on any given road segment is used to identify any straight, curved, and transition
sections present in that road segment. There could be multiple straight, curved and transition sections
present in any segment of a road for which the GPS trajectory is available. In the second stage, each
identified section is characterized by a set of optimized parameters defining a RRH value at each point on
that road section. In the third stage, all individual road sections are combined to obtain a composite RRH
for that road segment. Once a RRH for any given road segment is generated, it is stored in a vehicle’s RRH
database and can be used to detect any future unintentional lane departure using the previously
developed lane departure detection algorithm.
While a vehicle is moving on a given road for which the RRH has been previously generated, its trajectory
is acquired in real time by a GPS receiver. At any given time, the lane departure detection algorithm
calculates the vehicle’s current heading and compares it with a previously generated RRH of that road at
that point in time to calculate an instantaneous lateral shift. The instantaneous lateral shift accumulates
over time and if the accumulative lateral shift exceeds a certain threshold, an unintentional lane departure
is detected and an audible warning is issued. The audible warning stops as soon as an unintentional lane
departure is corrected, i.e., the vehicle’s trajectory becomes parallel to the RRH of that road. The lane
departure is also detected in case of intentional lane departure, e.g., in case of a lane change; however,
the distinction between an unintentional and intentional lane departure can be made by using the trigger
initiated by the lane-change signal. After successfully developing the RRH Generation algorithm, it was
integrated in the previously developed LDWS and extensive field tests were performed to evaluate the
system’s efficiency by detection of a variety of lane-departure scenarios on both straight and curved road
segments of I-35 near Duluth, MN. The test results showed that the newly proposed algorithm significantly
improved the performance of the previously proposed lane departure detection method by accurately
detecting all true lane departures while reducing the number of false alarms to zero.
One of the limitations of the newly developed LDWS is that when a vehicle is traveling on a road for the
first time, it will not have the required RRH of that road to detect an unintentional lane departure. To
overcome this problem, the authors also proposed adding a vehicle-to-vehicle (V2V) communication
component to exchange RRH between two vehicles when needed. In this case, a first-time travelling
vehicle can request a RRH for that road from a neighboring vehicle that has traveled on that road before
and has previously generated and stored a RRH for that road. This exchange process can be implemented
either using cellular vehicle-to-vehicle (C-V2V) communication or dedicated short-range communication
(DSRC). Once a RRH is successfully received from a nearby vehicle, it can be stored in the receiving vehicle’s
memory/database for future use. The V2V communication approach can only be successful when the
market penetration of V2V communication-enabled vehicles reaches a critical level, which has not yet
occurred.
As an alternative to the V2V communication approach, the proposed LDWS can also be integrated into
popular smartphone apps, e.g., Waze, Google Maps or Apple Maps, to take advantage of the vast database
of multiple GPS trajectories of the wider road network, which can then be used to generate RRH for almost
any road, making it available for a vehicle to detect its unintentional lane departure on any road even
when the vehicle is being driven on that road for the first time. Please note that the authors have been
approved for a new project to develop a smartphone app for the newly developed LDWS, using a vehicle’s

past trajectories. The successful development of this project will pave the way for integration of the
proposed algorithm into one of the popular smartphone apps.

CHAPTER 1: INTRODUCTION
1.1 BACKGROUND
A lane departure warning system (LDWS) has significant potential to reduce crashes. According to the
American Association of State Highway and Transportation Officials (AASHTO), almost 60% of fatal
accidents are caused by an unintentional lane drifting of a vehicle on major roads (1). Roadway departure
crashes are the greatest contributor to traffic fatalities in the United States. A recent study that compared
crashes with and without an LDWS found that an in-vehicle LDWS was helpful in reducing crashes of all
severities by 18%, those with injuries by 24% and those with fatalities by 86% (2). Systems that predict
the driver’s attentive state and intent of lane change (3-5) and provide map-based route guidance and/or
warning about unintentional lane departure (6-7) are also useful to reduce severe road crashes.
Most available LDWSs rely on image processing technology using a camera or an optical scanning device
to estimate a vehicle’s lateral shift within a lane to detect an unintentional lane departure (8-12). Although
advanced image-processing techniques work well in diminished lighting scenarios (13-14), the
performance of image processing-based LDWSs deteriorates in unfavorable weather and road conditions,
e.g., fog and snow-covered or worn-out road marking signs. To overcome these problems and improve
performance, Global Positioning System (GPS) technology is integrated within vision-based LDWSs.
However, such systems use differential GPS technology and/or inertial navigation sensors as well as high-
resolution digital maps to estimate a vehicle’s lateral shift in its lane, making such systems more complex
and expensive to implement (15).
Previously, we proposed a novel method to accurately detect an unintentional lane departure using a
standard GPS receiver and commonly available open-source, low-resolution digital maps (16). The
previously proposed method estimates a vehicle’s lateral shift by comparing the vehicle’s heading
acquired by a standard GPS receiver and road-reference heading (RRH) extracted from an open-source,
digital map. Although this method works well to successfully detect unintentional lane departure,
occasionally, it generates false alarms, i.e., it wrongfully issues lane departure warnings even when the
vehicle is within its lane (16). The false alarms occur due to inherent error in open-source, digital maps
that result in an error in the corresponding RRH of the given road extracted from such maps. We now
propose another method to generate an accurate RRH for any given road using a vehicle’s past GPS
trajectories on that road without relying on open-source, digital maps.
Previously, many techniques have been proposed to process GPS trajectories to generate a routable road
network or create a complete digital road map using graph and structured learning theory and/or
statistical analysis (17-22). In this report, a novel algorithm is proposed to generate an accurate RRH from
a vehicle’s past GPS trajectories to improve the performance of the previously proposed lane departure
detection method (16). The test results show that the newly proposed algorithm significantly improves
the performance of the previously proposed lane departure detection method by accurately detecting all
true lane departures while practically reducing the frequency of false alarms to zero.
1

One of the limitations of the newly developed LDWS is it requires that the vehicle has traveled on a given
road at least once in the past to successfully generate a RRH for that road from a past vehicle trajectory
that can be stored in a vehicle’s RRH database. This RRH of a given road can then be used for future
unintentional lane departure detection on that road. However, if a vehicle travels on a given road for the
first time, its database will not have the necessary RRH for unintentional lane departure detection. To
overcome this problem, vehicle-to-vehicle (V2V) communication can be used for a vehicle traveling for
the first time on a given road to obtain the needed RRH from a nearby vehicle that has travelled on that
road in the past and has already generated and stored the RRH for that road it its memory. To achieve this
purpose, this part of the proposed project included a provision to add a V2V communication component
in the newly developed LDWS.
The V2V communication approach can only be successful when the market penetration of V2V
communication enabled vehicles has reached a critical level, which has not yet occurred. Furthermore,
the V2V communication approach won’t be effective in the case of an isolated vehicle traveling on a new
route for the very first time even when the market penetration of V2V communicaiton technology has
reached a critical level.
Our proposed LDWS relies on the past trajectories of a vehicle on any given road to generate a RRH for
that road to detect a future unintentional lane departure. Once a vehicle travels on a road, its trajectory
is acquired using a GPS receiver to generate a RRH for that road, which is then stored in the database for
future use. However, while traveling on a road for the first time, a vehicle does not have the necessary
RRH for that road in its database. In this case, the vehicle can request the RRH for that road from a
neighboring vehicle that has traveled on that road before and has previously generated and stored the
RRH for that road. This process can be facilitated either using cellular vehicle-to-vehicle (C-V2V)
communication or via dedicated short-range communication (DSRC). Once a RRH is successfully received
from a nearby vehicle, it can be stored in the receiving vehicle’s memory/database for future use. Both
RRH generation and RRH exchange via V2V communication are explained in great detail in future chapters.
As a better alternative to V2V communication, the proposed LDWS can also be integrated into popular
smartphone apps e.g., Waze, Google Maps or Apple Maps, to take advantage of the vast database of
multiple GPS trajectories that can be used to generate a RRH for almost all roads, making it available for
a vehicle to detect its unintentional lane departure on any road even when the vehicle is being driven on
that road for the first time. Please note that we have just been approved for a new project (third phase)
to develop a smartphone app for our proposed LDWS, using a vehicle’s past trajectories. The successful
development of this project will pave the way for integration of the proposed algorithm into one of the
popular smartphone apps.
1.2 OBJECTIVES
The primary objective of the current project is the design and development of a road reference generation
algorithm that in conjunction with the previously developed lane departure detection method can
accurately detect all unintentional lane departures without generating unnecessary false alarms while the
vehicle is in its lane. In an earlier project, we developed and successfully demonstrated a lane departure
2

warning system using a standard GPS receiver and commonly available low-resolution mapping data. This
system acquires the trajectory of a moving vehicle in real time using a standard GPS receiver and compares
it with a RRH of the road to detect lane departure. In that project, the necessary RRH of the road is
provided by a low-resolution mapping database commonly available in any navigation system. The goal
of the current project is to design, develop and demonstrate an in-vehicle lane departure warning system
that will use an accurate RRH generated from a vehicle’s past trajectories instead of relying on any digital
mapping database.
The secondary objective of the current project is to provide a V2V communication component in the newly
developed LDWS to facilitate exchange of RRH from one vehicle to another when needed. The purpose of
having this objective is to ensure that vehicles travelling on a given road for the first time would be able
to obtain a RRH of that road from one of the neighboring vehicles when needed.
1.3 METHODOLOGY AND SYSTEM ARCHITECTURE
The newly proposed algorithm generates a RRH for any given road using a vehicle’s one or more past
trajectories on that road acquired by a standard GPS receiver. Once a RRH for a given road is generated,
it can be used to detect any future unintentional lane departure of a vehicle as illustrated in Figure 1.1,
where the dashed line represents a vehicle’s past trajectory, which can be used to generate a RRH for the
road to detect a future unintentional lane departure, e.g., as represented by a dotted line in Figure 1.1.
Figure 1.1 Conceptual diagram showing how recorded past trajectory (black dashed line) of a given vehicle can
serve as reference direction of travel to detect its own unintentional lane departure in future (black dotted
line).
The architecture of the proposed system, which combines the previously developed lane departure
detection method and the newly proposed RRH Generation algorithm, is shown in Figure 1.2 where the
GPS receiver acquires longitude and latitude of a moving vehicle’s position in real-time to be used by both
the RRH Generation algorithm and the LDWS. The RRH Generation algorithm uses a sufficient length of a
GPS trajectory on a given road to generate a RRH for that road using the newly developed algorithm. On
the other hand, LDWS works in real-time to detect unintentional lane departure, using the previously
proposed lane departure detection method except that it uses the RRH generated by the RRH Generation
algorithm, using one or more past GPS trajectories as opposed to the RRH extracted from an open-source,
3

low-resolution map used in the previous project. The LDWS can detect an unintentional lane departure of
any vehicle on a given road if the vehicle has been driven on that road at least once before so that the
necessary RRH for that road has already been generated by the RRH Generation algorithm. Please note
that the proposed algorithm is suitable to be integrated into smartphone apps, e.g., Waze, Google Maps,
or Apple Maps, to take advantage of the vast database of multiple GPS trajectories of a broader road
network that could be used to generate a RRH for almost all roads using the proposed algorithm. This can
enable any vehicle to detect an unintentional lane departure on any road even when the vehicle is being
driven on that road for the first time.
Our proposed LDWS relies on the past trajectories of a vehicle on any given road to generate a RRH for
that road to detect a future unintentional lane departure. Once a vehicle travels on a road, its trajectory
is acquired using a GPS receiver to generate a RRH for that road, which is then stored in the database for
future use (Figure 1.2). However, while traveling on a road for the first time, a vehicle does not have the
necessary RRH for that road in its database. In this case, the vehicle can request the RRH for that road
from a neighboring vehicle that has traveled on the road before and has previously generated and stored
the RRH for that road. This process can be facilitated either using cellular vehicle-to-vehicle (C-V2V)
communication or via dedicated short-range communication (DSRC). Once a RRH is successfully received
from a nearby vehicle, it can be stored in the receiving vehicle’s memory/database for future use.
The system architecture of the proposed project as shown in Figure 1.2 also highlights the scope of the
current project as opposed to the overall project. The small black-dashed rectangle (vertical) shows the
scope of the previously developed LDWS project (Phase 1), which was successfully completed two years
ago. The large, black-dashed rectangle (horizontal) represents the scope of the current project (Phase 2).
The scope of the two main objectives of the current project are also marked separately in Figure 1.2. The
blue-highlighted portion of Figure 1.2 enclosed in a blue-dashed boundary captures the scope of the
primary objective, while the red-dashed rectangle represents the scope of the secondary objective of the
current project. The details of the methodology and implementation of both of these objectives will be
described in this report in the next two chapters followed by field tests and results in the last chapter.
RRH Generator Using
Past Vehicle Trajectories
Lane Departure
Warning System
V2V
Communication
Database/Memory to Store Multiple Road Reference Headings
Storing Generated
RRH Using StoredRRH
V2VTx/Rx
Request Missing
RRH
Transmitting stored RRH
Storing Received
RRH
Open SourceMapping Database
Indicate Requested
RRH is Received
RRH from Open
Source Data
Previously Developed Project (Phase 1)
Current Project (Phase 2)
Figure 1.2 Architectural diagram of the proposed LDWS.
4

CHAPTER 2: ROAD REFERENCE HEADING GENERATION
This chapter will highlight the details of primary objective of the current project which is to develop an
algorithm to generate a RRH for any given road using a vehicle’s past trajectories on that road.
2.1 RRH GENERATION ALGORITHM
Any typical road segment may consist of
combinations of many straight and curve road
sections as shown in Figure 2.1 where a conceptual
diagram of a road segment with a curve section
sandwiched by two straight sections is shown.
Usually, a road is not curved abruptly, therefore, a
transition section – however, small - exists
between a straight and a curve section of the road
as illustrated in Figure 2.1(a). The heading at each
point of the road is shown in Figure 2.1(b) and
differential heading is shown in Figure 2.1(c). The
heading for a straight section remains constant
while it changes uniformly for a curve section
Straight
Hea
din
g (d
eg)
Transition Transition
Dif
f. H
ead
ing
(deg
)
Distance (m)
(a)
(b)
(c)
(Figure 2.1b). Similarly, the differential heading for
a straight section remains zero while it has a non- Figure 2.1 The conceptual diagram showing heading
zero constant value for a curve section (Figure and differential heading of a road with two straight
sections and a curve section including transition 2.1c). For sharper curves, the magnitude of non-sections zero value is larger. The vehicle trajectory obtained
by a standard GPS receiver consists of a vehicle
location estimated by a GPS receiver every 100 msec and can be used to obtain heading and differential
heading at any given point on a road. In reality, both heading and differential heading of a given road
derived from a vehicle trajectory acquired by a standard GPS receiver exhibit some fluctuation for both
straight and curve sections. The intensity of this fluctuation is contributed by both inherent GPS error and
driver’s ability to always keep the vehicle in the center of the lane. The dashed lines in Figure 2.1(b) and
2.1(c) indicate the magnitude of such fluctuation for both heading and differential heading.
Our designed algorithm to convert a previously recorded vehicle trajectory acquired by a standard GPS
receiver into a useful road reference works in three stages. In the first stage, various straight, curve and
transition sections present in the road are identified from the given trajectory. In the second stage, each
identified section is characterized by a set of parameters so that it can be used as a RRH value at each
point of the road. In the third and final stage, all individual sections are combined to obtain a composite
RRH for the road. Our algorithm uses vehicle’s differential heading to identify various sections present in
a given road segment for which the trajectory is available. Before all three stages of the algorithm are
described in more detail, it is important to statistically characterize the scale of the spurious fluctuation
5

in both heading and differential heading for a practical vehicle trajectory obtained from a standard GPS
receiver.
Figure 2.2 Vehicle heading vs. distance for (a) the complete road segment and (b) a small portion of the road
segment highlighted by a dashed red circle. The picture of Google Map of the relevant portion of the road is
shown on the top.
A typical vehicle trajectory acquired on the Interstate I-35 south bound (near Duluth, MN) for a ~4 km
segment is given in Figure 2.2 where vehicle heading is plotted versus distance. There are three graphs
shown in Figure 2.2a where heading is calculated using three different methods. The 1-point heading at
any given point is calculated as the heading between that
point and the previous point. The 5-point and 9-point heading
at any given point are calculated as the path average heading
using 5 and 9 points, respectively, including 2 and 4
neighboring points on each side. There are two types of
fluctuation seen in any typical vehicle trajectory. The first type
is a high frequency fluctuation which is caused by GPS
inherent error which is commonly known as GPS noise. The
second type is a low frequency fluctuation which is caused by
vehicle’s wandering within the lane. The magnitude of low
frequency fluctuation remains almost same in all three
0
0.05
0.1
0.15
0.2
0.25
0.3
1 3 5 7 9
Stan
dar
dD
evia
tio
n(d
eg)
'n' for n - point Heading
Heading
Diff. Heading
methods of heading calculations while the GPS noise (high
frequency fluctuation) reduces when more points are included Figure 2.3 Standard deviation of heading and
differential heading using n-point calculationin the heading calculation by taking a moving average. This can method for varying values of n.be seen in Figure 2.2b where a zoomed in portion of the Figure
6

230
240
250
260
270
280
0 600 1200 1800 2400 3000 3600 4200
Hea
ding
(deg
) (a)
(b)
-0.3
-0.2
-0.1
0
0.1
0.2
0.3
0.4
0 600 1200 1800 2400 3000 3600 4200
Diffe
rent
ial H
eadi
ng (d
eg)
Distance(m)
S1
T2
C1T1
T3
T4 T5
T6
S2
S3
S4
C3
C2
2.2a highlighted by a red dashed circle, is shown to illustrate the difference among heading values using
1-point, 5-point and 9-point methods.
The GPS noise (high frequency fluctuation) can be measured by the standard deviation of heading and
differential heading obtained from a vehicle trajectory. The standard deviation of heading using n-point
heading calculation method reduces when n increases as shown in Figure 2.3 where the standard
deviation of n-point heading is plotted for a typical vehicle trajectory on a straight road section. Similarly,
the GPS noise in differential heading significantly reduces with increasing n as shown in Figure 2.3 where
standard deviation of differential heading for the corresponding portion of trajectory is also plotted. As
can be seen from Figure 2.3 that GPS noise exhibiting in both heading and differential heading reduce
with increasing n and the reduction trend saturates around n = 9. Therefore, our algorithm uses 9-point
heading and differential heading calculation method to identify and characterize various road sections
from a given vehicle trajectory. The standard deviation of heading and differential heading is 0.1o and
0.03o, respectively, using 9-point method. After statistically characterizing the scale of fluctuation in
heading and differential heading, all three stages of our designed algorithm i.e., identifying,
characterizing, and combining all characterized sections into a useful road reference are described below
in detail.
2.1.1 Identification of Various Sections
The heading for a straight road section remains constant while it changes uniformly for a curve section.
Similarly, the differential heading for a straight section is zero while it has a non-zero constant value for a
curve section with larger values for sharper curves. A typical vehicle trajectory acquired by a standard GPS
receiver consists of its position coordinates at fixed time intervals (typically every 100 msec). Any two
Figure 2.4 (a) Vehicle heading and (b) differential heading vs. distance for the entire trajectory. The picture of Google
Map of the relevant portion of the road is shown on the top
7

consecutive position coordinates of a moving vehicle on a given road can be used to obtain heading and
differential heading of the road at that point.
The proposed algorithm uses differential heading to identify various sections present in a given road by
first identifying all straight sections where differential heading remains zero followed by curve sections
where differential heading is a non-zero constant. The transition sections are identified at the end.
To illustrate the individual section identification process, heading and differential heading calculated from
a typical GPS trajectory versus distance are shown in Figure 2.4a and 2.4b, respectively. The GPS trajectory
was acquired using a standard GPS receiver with a UBlox LEA-6 chipset on a 4.2 km section of Interstate
I-35 while driving at 70 MPH. The heading at each point of the given road, calculated from a vehicle’s GPS
trajectory, exhibits a high-frequency noise over distance caused by inherent GPS error which is further
accentuated in differential heading values as shown in Figure 2b. This high-frequency noise can be
reduced by moving average method using more than two consecutive GPS points for heading and
differential heading calculation. For the proposed algorithm, a 9-point moving average was used to reduce
the standard deviation of differential heading to 0.03o.
2.1.1.1 Identification of Straight Sections
Although the average differential heading of a straight section is zero, the instantaneous differential
heading at any point of a straight section fluctuates around zero due to GPS noise. This fluctuation remains
within the boundaries of 0.09o or three times the standard deviation of differential heading as shown in
Figure 2.4b. The proposed algorithm identifies straight sections by comparing the differential heading
with a threshold of 0.09o as shown by dashed red line in Figure 2.4b. Whenever the differential heading
exceeds the threshold of 0.09o in either direction, the crossing points are marked as the beginning and
ending points of the straight sections of the road. All such points are shown by vertical blue dashed lines
in Figure 2.4, identifying a total of four straight sections from the given trajectory which are marked as S1,
S2, S3, and S4.
There is no lane change present in the trajectory of Figure 2.4. However, in reality, a vehicle may change
lanes while traveling on a multiple lane road. The lane changes present in any given trajectory may
wrongfully be considered as road curvature on that road. However, the differential heading during any
typical lane change does not exceed the threshold of 0.09o. Therefore, the proposed algorithm can
correctly identify all straight sections of the road even if lane changes are present in a given trajectory.
2.1.1.2 Identification of Curve Sections
To identify a curve section between any two consecutive straight sections, the proposed algorithm
calculates a path average differential heading (PADH) between the ending point of the first and beginning
point of the second of the two consecutive straight sections.
There is usually a curve and two transition sections present between any two consecutive straight
sections. Therefore, the value of calculated PADH between two straight sections will be slightly smaller
than the true PADH value of the curve section alone because its calculation includes the two adjoining
8

transition sections on each side of the curve as illustrated in Figure 2.5, where a zoomed-in portion of the
trajectory of Figure 2.4 is reproduced showing only the first curve section surrounded by two straight
sections (S1 and S2) and corresponding transition sections. To identify the beginning and ending points of
a curve section alone, a set of two points between two consecutive straight sections (one on each side)
are identified where the differential heading value is closest to the calculated PADH.
-0.1
0
0.1
0.2
0.3
0.4
1400 1500 1600 1700 1800 1900 2000 2100
Dif
fere
nti
al H
ead
ing
(deg
)
Distance(m)
230
240
250
260
270
280
1400 1500 1600 1700 1800 1900 2000 2100
Hea
din
g (d
eg)
S1
S2
C1
T1
T2(a)
(b)
PADH of curve & transition sections
PADH of curve section only
Figure 2.5 (a) Vehicle heading and (b) differential heading vs. distance for a small portion of the trajectory of
Figure 2.4. This portion includes a part of first straight section, S1, T1, C1, T2, and a part of S2.
The beginning and ending points of a curve section identified this way will still not be the true beginning
and ending points of the curve because PADH value used to identify these points was calculated for the
curve section including the two transition sections. Therefore, a second iteration of the same routine is
performed by calculating a new PADH value between the two points identified in the first iteration. The
new PADH value calculated in the second iteration is more likely to be closer to the true PADH value of
the curve section alone because it is calculated for the curve section including only the extreme ends of
the transition sections on both sides. This process can be repeated, however, beyond two iterations, the
beginning and ending points of a curve section do not change significantly. Using this method, all curve
sections can be identified in any given GPS trajectory. A total of three curve sections (C1, C2, and C3) were
identified in the given GPS trajectory of Figure 2.4. Please note that the proposed algorithm can correctly
identify all curve sections in a given trajectory even when a lane change is present for the same reason as
explained for a straight section.
2.1.1.3 Identification of Transition Sections
After identifying the beginning and ending points of all straight and curve sections, all remaining portions
of the trajectory are marked as transition sections. The beginning and ending points of any transition
9

section will be the ending and beginning points of adjoining straight and curve sections as shown for the
transition sections T1 and T2 in Figure 2.5. Similarly, all transition sections in any given trajectory are
identified.
2.1.2 Characterization of Various Sections
After identifying all individual sections of the road from a given trajectory, each section is characterized
separately with a proper set of parameters to define RRH at each point of the given road section. Each
straight section is characterized with a path average heading (PAH) as heading remains the same for the
entire length of a straight section. Similarly, heading of a curve section changes uniformly with distance,
therefore, it is characterized with a path average heading slope (PAHS) and an initial heading (IH) i.e., the
heading at the beginning point of the curve section to completely define RRH at each point of the curve
section. For a transition section, heading neither remains the same as in a straight section nor does it
change uniformly with distance as in a curve section suggesting that a transition section should be
characterized as a second-order polynomial. However, the length of a typical transition section is usually
too small to characterize it as a second-order polynomial. Furthermore, the incremental accuracy of RRH
with a second-order characterization is negligibly small. Therefore, the proposed algorithm characterizes
each transition section just like a curve section i.e., with IH and PAHS values. Please note that the PAHS
value of a transition section is different from the PAHS value of the adjoining curve section.
2.1.2.1 Characterization of Straight Section
Each straight section is initially characterized with a PAH value, between the beginning and ending points
of a straight section, calculated using Equation 1:
∑𝑑𝑛ℎ𝑛 𝑃𝐴𝐻 = (1) ∑𝑑𝑛
Where hn is the vehicle heading between any given point n and its previous point, and dn is the distance
between the two points. However, the initially assigned value of PAH for any given straight section may
not be the optimal value. To find the optimal value of PAH for a straight section, the heading error
between the vehicle heading and PAH should be minimized. The value of PAH is varied in small increments
around its initially assigned value and root mean square of heading error (RMSHE) is calculated for each
value of PAH using Equation 2:
2 𝑅𝑀𝑆𝐻𝐸 = √⟨|ℎ𝑛 − ℎ𝑟𝑒𝑓| ⟩ (2)
Where href is the RRH i.e., PAH for a straight section. The RMSHE for the first straight section (S1) of Figure
2.4 is shown in Figure 2.6a for varying values of PAH. The RMSHE remains almost flat for a wide range of
PAH values suggesting that optimal value of PAH is not very sensitive to small changes. Although
minimizing RMSHE would result in an optimized value of href for a given straight section, the objective at
hand is to minimize ALS for each section because ALS is to be used to detect unintentional lane departure.
10
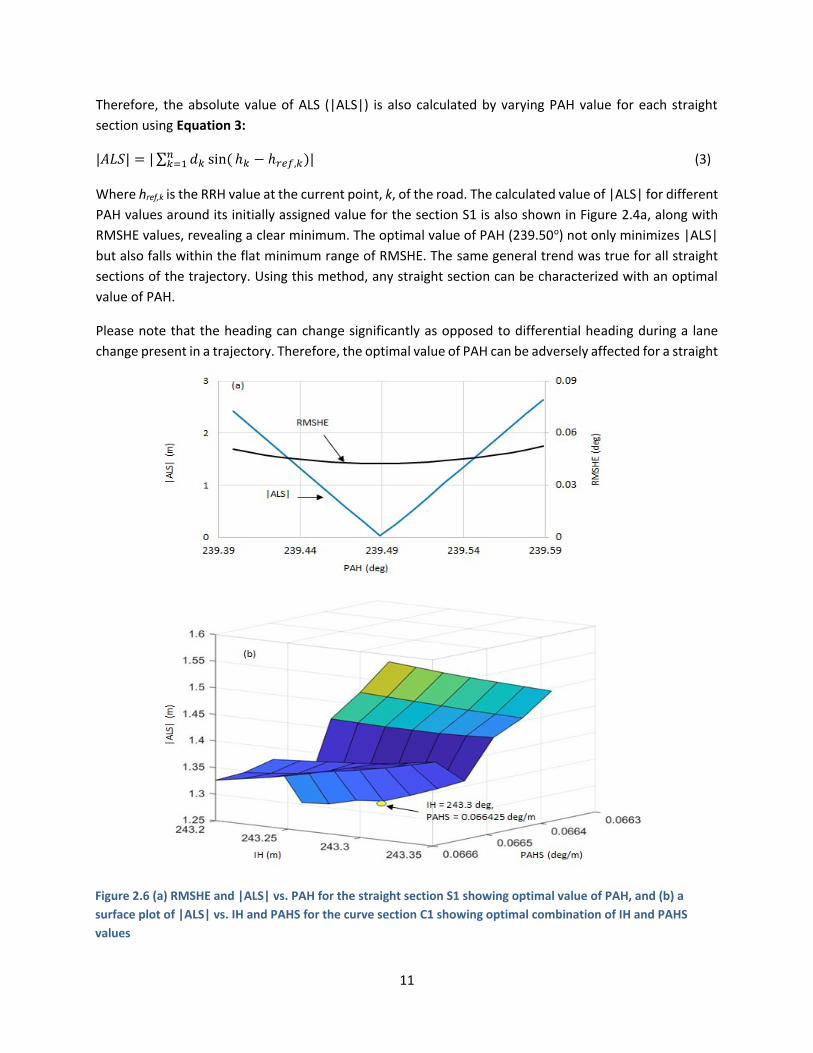
Therefore, the absolute value of ALS (|ALS|) is also calculated by varying PAH value for each straight
section using Equation 3:
𝑛 |𝐴𝐿𝑆| = | ∑𝑘=1 𝑑𝑘 sin( ℎ𝑘 − ℎ𝑟𝑒𝑓,𝑘)| (3)
Where href,k is the RRH value at the current point, k, of the road. The calculated value of |ALS| for different
PAH values around its initially assigned value for the section S1 is also shown in Figure 2.4a, along with
RMSHE values, revealing a clear minimum. The optimal value of PAH (239.50o) not only minimizes |ALS|
but also falls within the flat minimum range of RMSHE. The same general trend was true for all straight
sections of the trajectory. Using this method, any straight section can be characterized with an optimal
value of PAH.
Please note that the heading can change significantly as opposed to differential heading during a lane
change present in a trajectory. Therefore, the optimal value of PAH can be adversely affected for a straight
Figure 2.6 (a) RMSHE and |ALS| vs. PAH for the straight section S1 showing optimal value of PAH, and (b) a
surface plot of |ALS| vs. IH and PAHS for the curve section C1 showing optimal combination of IH and PAHS
values
11

section if a lane change is present. The proposed algorithm can detect the location and span length of
such a lane change and optimize the PAH value excluding the lane change portion of the section.
2.1.2.2 Characterization of Curve Section
As described earlier, each curve section is characterized with two parameters, i.e., IH and PAHS. An initial
value of IH is assigned as the heading at the beginning point of any curve section and the initial value of
PAHS is assigned using Equation 4:
ℎ𝑛−ℎ𝑛−1(∑𝑑𝑛× ) 𝑃𝐴𝐻𝑆 = 𝑑𝑛 (4)
∑𝑑𝑛
Where hn is the heading between any given point n and its previous point, and hn-1 is the heading between
point n-1 and its previous point. After initial values are assigned to both IH and PAHS for a curve section,
they are optimized by minimizing |ALS| by varying both IH and PAHS values in small increments around
their initially assigned values. The optimization process is illustrated in Figure 2.6b, where |ALS| is plotted
versus IH and PAHS as a surface plot for the curve section C1. Please note that the resulting optimal values
of IH and PAHS are 243.30o and 0.066425 deg/m, respectively, and are noticeably different from their
corresponding initially assigned values (243.26o and 0.066475 deg/m). Using the same method, all other
curve sections are optimized. Please note that the optimization of a curve section in the presence of a
lane change is performed the same way as described for straight section.
2.1.2.3 Characterization of Transition Section
As discussed earlier, each transition section is characterized as it is a curve section. Therefore, it should
be initially assigned with two parameters, i.e., IH and PAHS, and their optimization process should be
similar to that of a curve section. However, if both parameters are optimized independently, there is a
possibility of an abrupt change of heading at corner points where transition section adjoins a straight or
a curve section. This is because the end points of any transition section are the same as the beginning
and/or ending points of adjoining straight and/or curve sections. Therefore, the characterization of
transition section is more straightforward. The optimized heading at the ending point of the preceding
straight or curve section is considered as the IH value of the transition section. Similarly, an optimal value
of PAHS for a transition section is calculated using the optimized values of heading at the two end points
of the transition section.
2.1.3 Combining All Sections to Generate a Composite RRH
After identifying and characterizing each section with an optimal set of parameters, all sections are
combined to generate a composite RRH for that road. The typical output file generated by the algorithm
is shown in Figure 2.7, where each row represents an individual section of the road defined by its
beginning and ending points (in terms of latitude and longitude), the optimized parameter values, and the
section type. Please note that an “N” indicates that the corresponding parameter is not applicable to that
section. This file has the necessary information to completely define the RRH at any point along the road
12
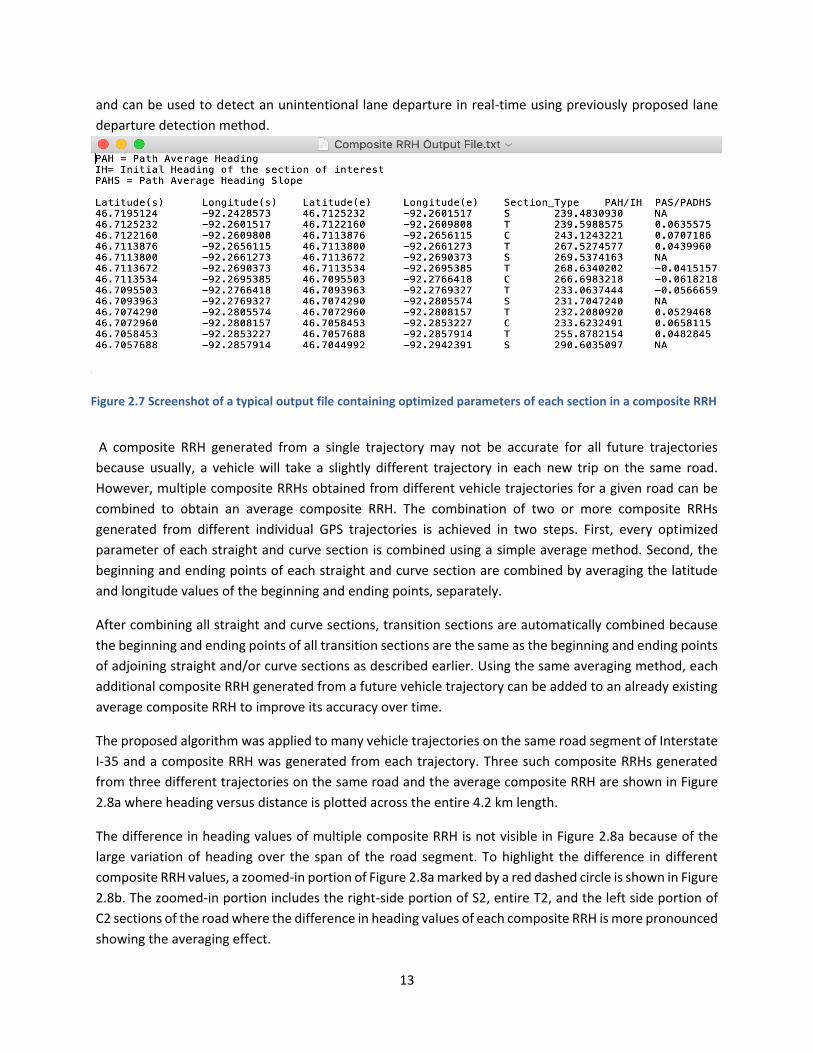
and can be used to detect an unintentional lane departure in real-time using previously proposed lane
departure detection method.
Figure 2.7 Screenshot of a typical output file containing optimized parameters of each section in a composite RRH
A composite RRH generated from a single trajectory may not be accurate for all future trajectories
because usually, a vehicle will take a slightly different trajectory in each new trip on the same road.
However, multiple composite RRHs obtained from different vehicle trajectories for a given road can be
combined to obtain an average composite RRH. The combination of two or more composite RRHs
generated from different individual GPS trajectories is achieved in two steps. First, every optimized
parameter of each straight and curve section is combined using a simple average method. Second, the
beginning and ending points of each straight and curve section are combined by averaging the latitude
and longitude values of the beginning and ending points, separately.
After combining all straight and curve sections, transition sections are automatically combined because
the beginning and ending points of all transition sections are the same as the beginning and ending points
of adjoining straight and/or curve sections as described earlier. Using the same averaging method, each
additional composite RRH generated from a future vehicle trajectory can be added to an already existing
average composite RRH to improve its accuracy over time.
The proposed algorithm was applied to many vehicle trajectories on the same road segment of Interstate
I-35 and a composite RRH was generated from each trajectory. Three such composite RRHs generated
from three different trajectories on the same road and the average composite RRH are shown in Figure
2.8a where heading versus distance is plotted across the entire 4.2 km length.
The difference in heading values of multiple composite RRH is not visible in Figure 2.8a because of the
large variation of heading over the span of the road segment. To highlight the difference in different
composite RRH values, a zoomed-in portion of Figure 2.8a marked by a red dashed circle is shown in Figure
2.8b. The zoomed-in portion includes the right-side portion of S2, entire T2, and the left side portion of
C2 sections of the road where the difference in heading values of each composite RRH is more pronounced
showing the averaging effect.
13

Hea
din
g (d
eg)
Hea
din
g (d
eg)
275
260
245
230
(a)
0 600 1200 1800 2400 3000 3600 4200
272
270
268
266
264
2100 2140 2180 2220 2260 2300
(b)
Composite RRH 1
Composite RRH 2
Composite RRH 3
Avg. Composite RRH
Distance (m)
Figure 2.8 (a) Heading of average composite RRH and three individual composite RRH obtained from three
different vehicle trajectories of 4.2 km segment of Interstate I-35, and (b) zoomed portion of (a) highlighted
by red dashed circle
2.2 EFFECT OF NON-STANDARD TRAJECTORIES ON RRH
So far, we have used vehicle trajectories where a vehicle travelled in the same lane for the entire length
of the trajectory without making any lane change during the travel. This may not be true for all practical
vehicle trajectories. Therefore, it is important to see the effect of a lane change present in a given
trajectory on both identification and characterization of various sections. The scenario of lane change in
case of a straight and a curve section is illustrated in Figure 2.9a and 2.9b, respectively. The top row of
Figure 2.9a and 2.9b shows a vehicle trajectory with a lane change from right-to-left in the middle of the
trajectory on a two-lane road for a straight section and a curve section, respectively. The relative heading
and differential heading of the two trajectories are also shown in Figures 2.9a and 2.9b, respectively, for
both straight and curve section. Whenever a lane change is made from right to left side on a straight or a
curve road section, vehicle heading deviates from its normal value and first increases (or decreases for
case of a lane change from left-to-right) and then changes back to its normal trend as can be seen from
Figure 2.9. Similarly, the differential heading deviates around zero for a straight section and around a non-
zero constant value for a curve section during the span of the lane change. However, the differential
14
(a)
Distance (m)
Hea
ding
(deg
)Di
ff. H
eadi
ng (d
eg)
(b)
Distance (m)
Hea
ding
(deg
)Di
ff. H
eadi
ng (d
eg)
238
239
240
241
242
0 300 600 900 1200 1500
Hea
ding
(deg
)
-0.1
-0.06
-0.02
0.02
0.06
0.1
0 300 600 900 1200 1500
Diff
. Hea
ding
(deg
)
Distance (m)
(a)
(b)
Figure 2.9 A conceptual diagram showing a lane change and resulting deviation in heading and differential
heading for (a) a straight section, and (b) a curve section
heading is inherently much noisier than the heading of the vehicle as seen in Figure 2.10 in which both
heading and differential heading of an actual trajectory on a straight section are plotted vs. distance,
respectively in a and b. In this part of the trajectory, there are two lane changes present which can be
seen from Figure 2.10a (i.e. from the heading) but the corresponding back and forth deviation in
differential heading is buried in noise (Figure 2.10b). The back and forth deviation in differential heading,
during a typical lane change, is usually smaller than 3 times the standard deviation of the differential
heading (0.09o), which is used by our algorithm as a threshold to identify various sections in any given
trajectory. Therefore, a lane change present in any given trajectory on either a straight or a curve section
will not adversely affect the identification process of any section present in that trajectory.
Figure 2.10 (a) Heading, and (b) differential heading vs. distance for a straight section with two lane
changes.
15

After identifying various sections, our algorithm uses heading of a trajectory to characterize each section
separately. Therefore, the characterization of each section may be negatively affected due to deviation in
heading during the span of the lane change in any given section. To explore the potential negative impact
of a lane change present in a given trajectory on the characterization of various sections, we processed a
vehicle trajectory with multiple lane changes using our algorithm. As expected, our algorithm correctly
identified all sections of the given trajectory. After identifying each section, our algorithm characterized
each of the straight and curve sections separately to obtain a road reference. The adverse effect due to
lane change on characterization of both straight and curve sections is discussed below.
2.2.1 Effect of Lane Change on Characterization of a Straight Section
We used the first straight section (S1) of a trajectory which is the longest straight section in this trajectory
(~1,500 m). There was a total of three lane-changes present in this trajectory in the first 1000 m. Our
algorithm assigned this section an optimized value of PAH at first to characterize it which becomes href at
any given point on this straight section.
Hea
din
g E
rro
r
3
2
1
0
-1
-2
-3
-4
After Two Iteration
After One Iteration
0 100 200 300 400 500 600 700 800 900 1000
Distance
Figure 2.11 Heading error vs. distance for a straight section with three lane changes
In this case, the RMSHE (~0.87215o) for the optimized PAH value was almost seventeen times larger as
compared to the usual range of RMSHE (<0.05o) for the optimized PAH values for a typical straight section
extracted from a trajectory without any lane change. This implies that either the curve fitting (or
characterization) for this straight section was totally off by the presence of a lane change(s) in the
trajectory or alternatively the curve fitting was appropriate and the large value of RMSHE is due to the
deviation in heading caused by lane change(s) present in the trajectory. To illustrate this point, the curve
fitting error he = hn – href vs. distance is plotted in Figure 2.11 as blue line. In reality, he should be around
zero throughout the length of the section.
16

The blue line in Figure 2.11 indicates that the characterization of this straight section i.e., href cannot
provide the true reference for this straight section because he is not close to zero for most of the trajectory
in spite of having an average value of zero. This implies that there are at least one or more but odd number
lane changes present in this trajectory.
This is further bolstered by the large value (0.87215o) of RMSHE (or standard deviation) of he. The two
dashed lines highlight the standard deviation threshold which can be used to detect the span of the lane
change. Because there are three lane changes in this trajectory, a second iteration is needed to
characterize this straight section to obtain a true reference.
After detecting the location and span of any lane changes, a second iteration is performed excluding the
lane change portions of the trajectory. The second iteration results in a new PAH characterizing the
straight section with a new RRH. Using this new RRH, he is re-calculated and shown in the same graph of
Figure 2.11.
As can be seen from the yellow line of this figure, he for the new reference is zero at most of the points on
the trajectory except during the lane change portion implying a valid characterization for the straight
section. This second iteration method is needed to truly characterize any straight section with one or more
odd number of lane changes.
2.2.2 Effect of Lane Change on Characterization of a Curve Section:
To explore the negative impact of a lane change on the characterization of a curve section, we used the
first curve section of the trajectory (C1) which is ~400m long. There was only one lane change (right-to-
left) present in the middle of the trajectory on this curve section.
In the first iteration (normal characterization routine), our algorithm assigned this curve section an
optimized value IH and PAHS to characterize it i.e., to completely define RRH at any given point of the
curve section. The he = hn – href is plotted vs. distance for this curve section in Figure 2.12.
The average value of he is almost zero but its RMSHE (or standard deviation) is 0.75o highlighted by two
dashed lines on either side of the average in Figure 2.12. As can be seen from the Figure that he crosses
17

1700 1750 1800 1850 1900 1950
3
2
1
0
1650
-1
-2
-3
2000
Distance (m)
Figure 2.12 Heading error vs. Distance for a curve section with one lane changes present in the middle of the
section.
RMSHE threshold for a span of ~110m in the middle of the curve section. This is the exact location where
the lane change was present in the trajectory implying that the lane change span can be detected by he.
This lane-change present in this trajectory are responsible for the large value of RMSHE of he (0.72135).
However, the instantaneous values of he are still close to zero for those portions of the trajectory where
there is no lane change, implying that the characterization (assigned optimal value of PAHS and IH) of the
curve section is not negatively impacted by a lane change present in the trajectory.
It is evident that presence of any number of lane changes does not affect the characterization of a curve
section. This is due to the fact that curve sections are characterized by PAHS and any number of lane
change can not affect PAHS as differential heading for a single lane first increases and then decreases or
vice versa as shown in Figure 2.9b. So, changes in differential heading cancel out each other and thus have
no negative impact on PAHS.
In summary, lane changes do not affect identification or characterization of a curve or a transition section
of a trajectory. However, odd number of lane changes has negative impact on characterization of a
straight section. The initially value of PAH assigned to a straight section, when lane change portions exists,
is not the true PAH of that straight section. So, our algorithm can detect and exclude those lane change
portions by monitoring the heading error to calculate the true PAH of a straight section. After excluding
those lane change portions, our algorithm continues to follow its normal routine to generate RRH for that
trajectory.
Hea
din
g E
rro
r
18

2.2.3 Altered Road Segment
Hea
din
g E
rro
r (d
eg)
Sometimes, an existing straight or a curve section of any road can be altered from its standard design for
any portion for a number of reasons after it has been designed and constructed.
0.8
0.4
0
-0.4
-0.8
-1.2
-1.6
1450 1550 1650 1750 1850 1950 2050
Distance (m)
Figure 2.13 Heading error vs. distance for a curve section of Rice Lake Rd., without any lane change
Our algorithm can confuse it with a lane change in any trajectory obtained on that altered section. For
example, we noticed such a scenario in the curve section of the Rice Lake Rd in Duluth, MN. The curve
section of the Rice Lake Rd. was recently altered to accommodate a turn signal intersection. This
effectively altered the curvature of the curve section for a span of about 100m adding one more lane on
that portion to accommodate intersection light. We observed a lane change in all trajectories obtained
on that section even when there was a no lane change present. This is illustrated in Figure 2.13 where
heading error, he, between a vehicle trajectory and the extracted road reference is plotted versus
distance.
The standard deviation of he is 0.4o which is large enough to indicate that there is a lane change present
in this section. Using the standard deviation threshold, a lane change span of 100 m can be detected as
seen in Figure 2.13. This is detected as a lane change because the differential heading change is not
significantly large to be detected as a small curvature. However, it is not a real lane change but an altered
curvature of an existing curve section of the road. If a lane change is detected in multiple trajectories at
the same location having a similar span length, it is not likely to be a real lane change. Instead, it is more
likely to be an altered curvature of an existing road. This can happen on a straight road section as well.
We can detect such alterations of the existing road sections and mark its location in our road reference
to avoid false alarms in lane departure detection in future trajectories on that road section. Alternatively,
we can also characterize the altered section as a separate section to avoid false alarms.
19

CHAPTER 3: V2V COMMUNICATION FOR TRANSFERRING RRH
This chapter will capture the details of the second objective of the project which is to facilitate transfer of
RRH from one vehicle to another using V2V communication. The chapter is divided into three sections.
The first section describes the necessity of V2V communication to transfer RRH. The second section
describes the V2V handshake protocol for RRH transfer followed by the third section describing the
implementation details of the V2V handshake protocol and software development.
3.1 WHY V2V COMMUNICATION
To successfully generate the RRH for a given road from a vehicle’s past trajectories on that road, it is
necessary for the vehicle to have traveled on that road for at least once in the past. However, if a vehicle
travels on a given road for the first time, it will not have the necessary RRH for unintentional lane
departure detection. To overcome this problem, V2V communication can be used for a vehicle traveling
for the first time on a given road to obtain the needed RRH from a nearby vehicle which has travelled on
that road in the past and have already generated the RRH for it. To achieve this purpose, we proposed to
add V2V communication provision to the proposed project. This chapter will highlight the work
accomplished to design and develop the V2V communication process needed to exchange RRH between
two vehicles upon need.
The V2V communication approach can only be successful if the market penetration of V2V communication
enabled vehicles reaches a critical level which is not there as of now. As an alternative to V2V
communication, the proposed LDWS can also be integrated into popular smartphone apps e.g., Waze,
Google Maps or Apple Maps, to take advantage of the vast database of multiple GPS trajectories which
can be used to generate RRH for almost all roads making it available for a vehicle to detect its unintentional
lane departure on any road even if the vehicle is driven on that road for the first time. Please note that
we have just been approved for a new project (third phase) to develop a smartphone app for our proposed
LDWS using a vehicle’s past trajectories. The successful development of this project will pave the way for
integration of the proposed algorithm into one of the popular smartphone apps.
Our proposed LDWS relies on the past trajectories of a vehicle on any given road to generate a RRH for
that road to detect a future unintentional lane departure. Once a vehicle travels on a road, its trajectory
is acquired using GPS receiver to generate a RRH for that road which is stored in the database for future
use. However, while traveling on a road for the first time, a vehicle does not have the necessary RRH for
that road in its database. In this case, the vehicle can request the RRH for that road from a neighboring
vehicle which has traveled on that road before and have previously generated and stored the RRH for that
road. This process can be facilitated either using cellular vehicle to vehicle (C-V2V) communication or via
dedicated short-range communication (DSRC). Once a RRH is successfully received from a nearby vehicle,
it can be stored in the receiving vehicle’s memory/database for future use.
20

3.2 V2V HANDSHAKE PROTOCOL
For successful transfer of a RRH from one vehicle to another, proper V2V handshake protocol is required
to identify the most suitable neighboring vehicle to transfer RRH to the vehicle in need. A vehicle will
request a RRH from neighboring vehicles only when it is traveling on a road for the very first time or does
not have the RRH for that road. One such scenario showing a vehicle VR traveling on a 4-lane road for the
first time while not having the RRH for that road is illustrated in Figure 3a. A total of 12 neighboring
vehicles (V1 to V12) are also traveling on the same road (Figure 3a). The vehicle VR will need the RRH for
that road to detect any unintentional lane departure. Therefore, it broadcasts a request for the RRH by
transmitting a message called REQUEST. The REQUEST reaches all nearby vehicles within its
communication range as shown by dashed arrows in Figure 3a. The data of REQUEST includes the direction
of travel of the requesting vehicle (VR) and its location coordinates. The direction of travel is needed to
eliminate those vehicles which are traveling in the opposite direction of the requesting vehicle (VR)
because those vehicles will not stay within the communication range of the requesting vehicle long
enough to complete the handshake protocol to transfer RRH.
All neighboring vehicles receiving the REQUEST will assess if they are traveling in the direction of the
requesting vehicle and if they have the requested RRH to pass on. Any vehicle not having the requested
RRH or traveling in the opposite direction of the requesting vehicle will ignore the REQUEST. Any vehicle
having the requested RRH and traveling in the same direction as the requesting vehicle becomes a
potential candidate vehicle to transfer RRH to the requesting vehicle (VR). There are 4 such potential
candidate vehicles (V1, V3, V4, and V5) shown in green color in the scenario of Figure 3a. The rest of the
vehicles (shown in grey color) are either traveling in the opposite direction or do not have the requested
RRH. There is always a possibility to have more than one potential candidate vehicles to transmit RRH as
in the scenario of Figure 3a. In case of more than one potential candidate vehicles having the needed RRH,
it is important that only one of those vehicles is selected to transfer RRH to avoid broadcast congestion.
Usually, a vehicle which is the nearest to the requesting vehicle should transfer the requested RRH for
most reliable communication. To accomplish this, each potential candidate vehicle calculates its distance
from the requesting vehicle (VR) and transmits a message called REPLY back to the requesting vehicle as
shown by dashed arrows in Figure 3b where the same scenario of Figure 3a is repeated showing
communication paths of REPLY messages from all potential candidate vehicles. The data of each REPLY
message from a potential candidate vehicle includes its distance from the requesting vehicles as well as a
unique identifier (ID) so that the requesting vehicle can distinguish among all potential candidate vehicles.
After receiving the REPLY messages from all potential candidate vehicles, the requesting vehicle, VR selects
one potential candidate vehicle at the shortest distance. Please note that if two or more vehicles are at
the same distance, then the requesting vehicle can randomly select any one of them. After selecting one
of the potential candidate vehicles, the requesting vehicle (VR) sends a message called SELECT back to all
potential candidate vehicles as shown in Figure 3c where the same scenario is repeated showing the
multiple communication paths of the SELECT message to all potential candidate vehicles. The data of the
21
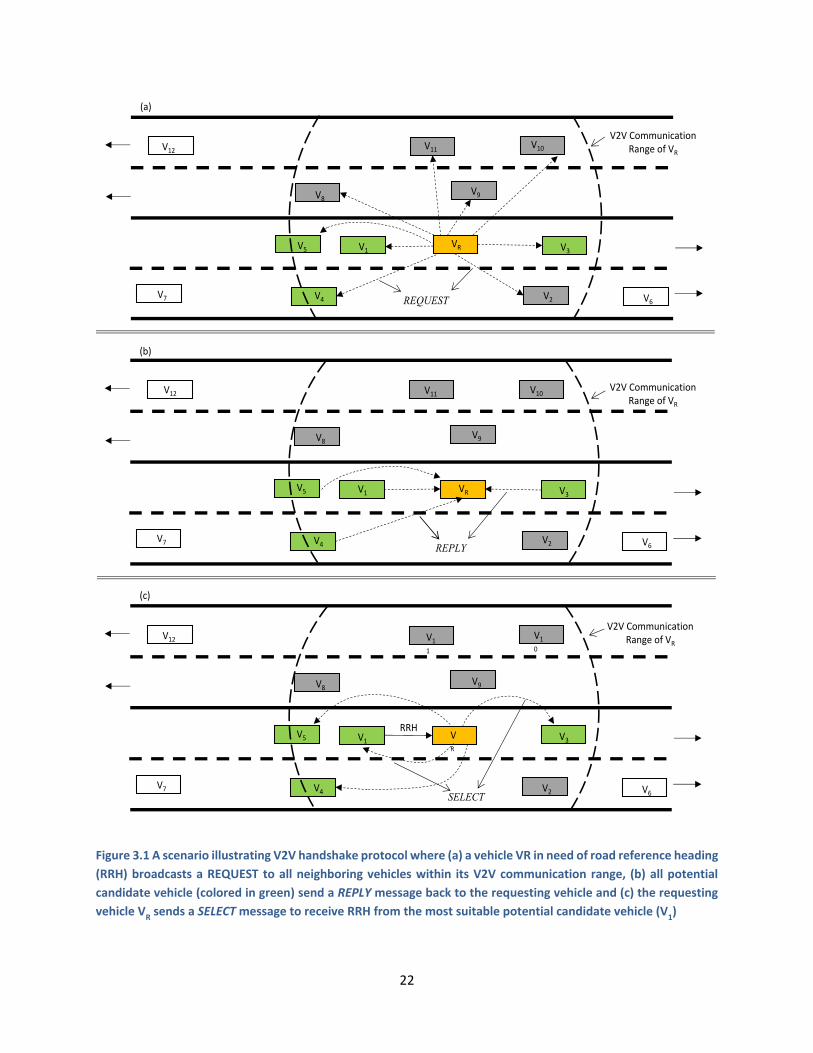
VRV1
V2
V3
V4
V5
V6V7
V8V9
V11V10V12
V2V Communication Range of VR
REQUEST
VRV1
V2
V3
V4
V5
V6V7
V8V9
V11 V10V12V2V Communication
Range of VR
REPLY
VR
V1
V2
V3
V4
V5
V6V7
V8V9
V1
1
V1
0
V12
V2V Communication Range of VR
SELECT
RRH
(a)
(b)
(c)
Figure 3.1 A scenario illustrating V2V handshake protocol where (a) a vehicle VR in need of road reference heading
(RRH) broadcasts a REQUEST to all neighboring vehicles within its V2V communication range, (b) all potential
candidate vehicle (colored in green) send a REPLY message back to the requesting vehicle and (c) the requesting
vehicle VR
sends a SELECT message to receive RRH from the most suitable potential candidate vehicle (V1)
22

SELECT message includes the unique ID of only one potential candidate vehicle which is at the shortest
distance from the requesting vehicle so that all other potential candidate vehicles can ignore this message
except the one whose unique ID is carried in this message. This will complete the V2V handshake protocol
by successfully selecting the most suitable vehicle to transfer RRH to the requesting vehicle. The potential
candidate vehicle with matched unique ID (V1 in case of the given scenario of Figure 3c) can now start
transferring the requested RRH to the requesting vehicle (VR) as shown by a solid arrow from V1 to VR in
Figure 3c. The implementation details of the V2V handshake protocol and transfer of RRH are given in the
next section.
3.2.1 Implementation of V2V Handshake Protocol
After developing the V2V handshake protocol to identify the most suitable vehicle to transfer RRH to a
vehicle in need, we implemented this protocol in our LDWS and did the necessary programming to
successfully demonstrate its functionality. The flowchart of the developed software to implement the
developed V2V handshake protocol is shown in Figure 4. Please note that the software of flowchart given
in Figure 4 will be running in each vehicle in addition to two other software i.e., RRH generation software
as developed under Task 1 of the current project (Phase 2) and the lane departure detection software as
developed in a previous project (Phase 1). The implementation platform of all the developed software is
a DSRC based device which has a built in GPS receiver and necessary processing power to run the
developed software. The software of the flowchart given in Figure 4 to implement the V2V handshake
protocol to transfer RRH from the most suitable neighboring vehicle to the requesting vehicle is explained
below.
1. The vehicle in need of RRH, after receiving a trigger from the LDWS software, broadcasts a
REQUEST message to all nearby vehicles within its DSRC range. The data of the REQUEST
consists of requesting vehicle’s location and direction of travel.
2. All nearby vehicles receiving the REQUEST process its data to check if they have the needed
RRH and traveling in the same direction as the requesting vehicle.
3. Each vehicle having the needed RRH and traveling in the same direction as the requesting
vehicle (potential candidate vehicle) calculates its distance from the requesting vehicle and
sends a REPLY message back to the requesting vehicle. The data of each REPLY message
consists of the calculated distance and a unique identifier (ID) of the corresponding potential
candidate vehicle. At this point, each potential candidate vehicle keeps waiting for the
response back from the requesting vehicle to decide if it will need to transfer RRH to the
requesting vehicle.
23

4. The requesting vehicle in need of RRH receives the REPLY messages from all the potential
candidate vehicles and process all messages to select the closest potential candidate vehicle.
If two or more vehicles are at same distance, then the requesting vehicle can randomly select
any one of them.
5. The requesting vehicle in need of RRH now broadcasts a SELECT message containing the unique
ID of the selected potential candidate vehicle.
6. All potential candidate vehicles process the received unique ID in the SELECT message to see if
it matches with their unique ID. Any potential candidate vehicle not having a match with the
unique ID will come out of the waiting routine and resume the normal operation by starting
over. Please note that for some reason, if a potential candidate vehicle does not receive the
SELECT message, it will assume that it is now out of communication range of the requesting
vehicle and will resume normal operation after waiting for 300 ms (3 DSRC communication
cycles).
7. The potential candidate vehicle with matched unique ID will now start transferring RRH data
to the requesting vehicle. The process of actual transfer of RRH data takes place in next several
cycles of DSRC communication (100 ms each) depending upon the length of data in RRH. The
complete process of RRH data transfer is described later below.
8. The requesting vehicle receives the RRH data and checks received data periodically after every
DSRC communication cycle (100 ms) to evaluate if it has received enough length of RRH data.
For some reason, if the connection between the requesting vehicle in need of RRH and the
selected potential candidate vehicle is lost/interrupted before receiving enough data (e.g., 1
mile), then the requesting vehicle sends the SELECT message again but with the unique ID of
the next closest potential candidate vehicle. However, if the connection between the two
vehicles is lost after enough RRH data has been received by the requesting vehicle, then it will
initiate another REQUEST at a later time upon need to start the whole process again.
24

V2V Communication Starts
Receives Trigger
Broadcasts REQUEST
Receives Message ( RRH Data, REPLY, REQUEST and SELECT )
REQUEST
Vehiclewith Needed RRH and Direction of
Travel
Yes
Calculates Distance to Requesting Vehicle
Transmits Calculated Distance with a unique ID
to Requesting Vehicle
No
SELECT
Yes
Vehicle with Matched
unique ID
Transmits RRH
NoNo
No
Stores RRH and Indicates Reception is Done
Start Receiving RRH within 300 ms
RRH Data
Data Transfer Ends
Or V2V Connection Interrupts
Vehicle Receives Enough
RRH Data
Yes
Yes
REPLY
Selects Closest/NextClosest Vehicle
Broadcasts unique IDof the Closest Vehicle
Vehicle Broadcasteda Request
Yes
No
Yes
No
Figure 3.2 Flow chart of the V2V handshake protocol for a vehicle in need to receive RRH data of a given road from
the most suitable neighboring vehicle on that road
3.3 TRANSFER OF RRH DATA USING V2V COMMUNICATION
The handshake protocol to select the most suitable vehicle to transfer RRH to the vehicle in need is
described above. After the most suitable vehicle is identified and selected, the process to transfer RRH
takes place slowly over next several cycles of DSRC communication depending upon the amount of RRH
data. The data of RRH generated from past vehicle trajectories using our proposed algorithm is included
in a text file containing many rows as shown in Figure 3.3 where a screenshot of a typical RRH data file for
a 4.2 km road segment of the Interstate I-35 is shown. Each row describes an individual section (straight,
curve or transition) of the road and there are 13 sections (rows) in the given text file. Each section is
25

defined by its beginning and ending points (in terms of latitude and longitude), the optimized values of
relevant parameters, and the section type. Please note that an “N” indicates that the corresponding
parameter is not applicable to that section. This text file has the necessary information to completely
define the road reference heading at any point along the road and can be used by LDWS to detect any
unintentional lane departure in real-time. Although each section of the road in RRH data file contains
seven parameters to fully characterize the given section, one of the 7 parameters (Section Type) is not
necessarily needed as it can be deduced from the other parameters. Therefore, in our developed system,
each section is transmitted using only six parameters.
In DSRC based V2V communication, each data transfer cycle is 100 ms and any data transfer can take place
during this cycle. We have implemented RRH data transfer process section by section but in such a way
that only two parameters can be transferred in one communication cycle (100 ms). As there are six useful
parameters in each section of RRH data for any given road, we need three cycles (300 ms or 0.3 s) to
completely transfer one section. Depending upon the number of sections of the road in a RRH text file, it
can take up to a few seconds to complete the RRH transfer process. For example, there are 13 sections in
the RRH text file of Figure 3.4, therefore, it will take 3.9 seconds (13 x 0.3 s) to completely transfer all the
sections of this RRH. After successfully completing the transfer of all the sections present in the RRH data
file, a final message is sent to the receiving vehicle to indicate that all the data has been sent. Please note
that an additional communication cycle (0.1 s) will be needed for the final message indicating the data
transfer completion. For some reason, if the connection is lost before the transfer of RRH data is
completed or before enough RRH data is transferred, our developed software can manage the situation
by restarting the process as described above in the V2V handshake protocol.
Figure 3.3 Screenshot of a typical RRH data file
26

After developing the software for V2V handshake protocol and RRH data transfer, we evaluated this in
the lab by using two DSRC devices to simulate two vehicles, one vehicle without the RRH and the other
with the RRH. One such lab evaluation scenario is illustrated in Figure 3.4 where the vehicle shown as
yellow needs a RRH for a given road and the vehicle shown as green has that RRH. Once the V2V
handshake protocol establishes the connection between the two vehicles (transmitting and receiving),
the transfer of RRH data takes place section by section. The transfer of the RRH data is also illustrated in
Figure 3.4 where the screenshots of the consoles of the two DSRC devices of the two corresponding
vehicles are also shown. The left side console is for the transmitting vehicle’s device and shows the actual
RRH data which is being transmitted to the other vehicle. The right side console is for the device of the
receiving vehicle and shows the actual received RRH data by the receiving vehicle’s device. There are 11
sections in the RRH of the text file used in this lab evaluation which was successfully transmitted in a total
of 3.4 seconds. The transmission of each of the 11 sections in the RRH data file took 0.3 seconds so all 11
sections were successfully transmitted in 3.3 seconds (11 x 0.3 s). The final message (in the form of two
consecutive zeros) took another 0.1 second indicating that the transfer was complete.
Section 1
Section 2
Section 3
Section 4
Section 6
Section 5
Section 7
Section 8
Section 9
Section 10
Section 11
Sections
2
3
5
4
6
7
8
9
10
11
1
RRH data received at the Receiver device RRH text file at the Transmitter device
Vehicle transmitting RRH data Vehicle receiving RRH data
V2V Communication
Figure 3.4 Screenshot of the console of the DSRC device in the transmitter vehicle (left bubble box) showing a
text file of RRH data stored in the device and screenshot of the console of the DSRC device in the receiving
vehicle (right bubble box) when the RRH data is received via DSRC based V2V communication.
27

CHAPTER 4: FIELD TESTS, RESULTS, AND CONCLUSIONS
This chapter will highlight the field test results of the LDWS using a newly developed algorithm to generate
RRH for any given road from a vehicle’s past trajectories on that road for accurate detection of
unintentional lane departure while minimizing the frequency of false alarms.
4.1 FIELD TESTS AND RESULTS
The accuracy of the lane departure detection method depends upon the accuracy of the composite RRH
for that road. To evaluate its accuracy, field tests were performed by driving a test vehicle multiple times
on the same 4.2 km segment of Interstate I-35 for which an average composite RRH was already generated
using the newly proposed algorithm. When a vehicle unintentionally drifts away from its lane, ALS starts
to increase in value (positive or negative), and once its value increases/decreases beyond a certain
threshold (1m), an unintentional lane departure is detected initiating a warning for the driver. Please
note that ALS will also increase in value if a vehicle intentionally changes its lane. An intentional lane
change can be distinguished from an unintentional lane departure by the presence or absence of turn
signal. In case of an intentional lane change, the increase in ALS begins to saturate upon completion of
lane change because the vehicle starts to travel again in parallel to the RRH of the road. As a result of
normal driving behavior, this phenomenon i.e., the saturation of ALS can also occur in case of an
unintentional wandering within a lane while ALS values remain within the 1m threshold. This
phenomenon is used to reset the value of ALS to zero whenever its value begins to saturate either after
completion of a lane change or during normal driving within the lane to detect a future lane change or a
potential unintentional lane departure.
During the field tests, the test vehicle was driven at about speed limit (70 MPH) on this 4-lane freeway (2-
lanes each way) and many back-and-forth lane changes were made intentionally during the field tests. For
safety reasons, intentional lane changes were made to test the accuracy of lane departure detection using
the composite RRH generated by the newly proposed algorithm.
The test vehicle was driven on the same road segment multiple times making many lane changes in each
trip and ALS was calculated in real-time to detect any lane departure. The vehicle heading for one such
test trip vs. distance is plotted along with the RRH of the road segment in Figure 4.1a showing that vehicle
heading deviates from the RRH during each lane change as expected. The corresponding ALS vs. distance
is plotted in Figure 4.1b showing that ALS exceeds 1m threshold during each lane change. A total of ten
right and left lane changes were made in this trip and all lane changes were detected accurately and in a
timely manner. A digital mask for lane departure detection warning signal is plotted as a dashed red line
showing the start and end of each lane change in Figure 4.1b. Lane departure warning signal becomes
active when ALS exceeds the 1m threshold and is deactivated when the vehicle heading becomes parallel
to RRH of the road. In multiple field tests, more than 100 lane changes were made, and each lane change
or lane departure was accurately and timely detected.
28

Figure 4.1 (a) Vehicle heading and RRH vs traveled distance for one test trial, (b) ALS versus traveled distance of
the corresponding test trial trajectory, and (c) ALS versus distance on the same 4.2 km segment of Interstate I-35
for four typical trial trajectories with no lane change
Furthermore, nowhere else along the trajectory, ALS exceeded the threshold i.e., no false alarm was
observed. To evaluate the frequency of the false alarms, the test vehicle was also driven multiple times
on the same road segment without making any lane changes. In more than 10 trips on the 4.2 km long
route, no false alarm was observed as indicated in Figure 4.1c, where ALS is plotted vs. distance for four
such test trips.
It is also important to observe that ALS value along any point on the road remained below 0.3m which is
well below the 1m threshold, even on the curve sections of the road showing that the composite RRH
generated from past vehicle trajectories significantly improves the accuracy of previously proposed lane
departure detection method by practically reducing the frequency of false alarms to zero with a lot of
margins to spare.
29

Figure 4.2 A comparison between two LDWSs using a selected trajectory where the previous LDWS issues false
alarm (the red trajectory crosses the threshold line three times in absence of any lane changes, indicating three
false alarms). The blue trajectory does not cross the threshold line using the new RRH and no false alarm is issued
It is also crucial to make a comparative analysis between the previous LDWS and the new LDWS. To make
this comparison, we selected a particular trajectory with no lane changes, from our previously developed
LDWS, where false warnings were issued for that trajectory. We re-evaluated that particular trajectory
using our newly developed LDWS and observed no false alarm. This comparative analysis is shown in
Figure 4.2 where the horizontal red lines indicates the threshold of 1m. The figure shows that we did not
experience any false alarm but also the stark comparison of the ALS from the two methods (old vs. new
improved method) shows that ALS remains well below the threshold, thus minimizing the probability of
false alarms drastically.
Additionally, after successfully developing and testing V2V handshake protocol and RRH data transfer
software in the lab, we wanted to evaluate both in the field to detect unintentional lane departures. We
used the same road segment to test the V2V handshake protocol and RRH data transfer software. The
complete field test involves driving at least two test vehicles, one of these two vehicles without having
the RRH data file in its DSRC device and running only lane departure warning software while the other
vehicle having the required RRH data file in its DSRC device. The two vehicles should be driven within the
DSRC communication range of each other on the same road.
30

Figure 4.3 (a) Google Earth view of a travel trajectory of a 4.2 km road segment on the interstate I-35 and (b)
Zoomed portion of (a) highlighted by red dashed circle illustrating a typical V2V communication scenario for
transferring RRH data of that road segment
We wanted to drive two test vehicles in close proximity on our test road segment as shown in Figure 4.2b
which is a zoomed-in view of the portion of the I-35 of Figure 4.3a highlighted by the red dashed circle.
However, because of the Covid-19, we were not able to go to the field as it required at least two people
in each of the two vehicles for a prolonged period of time. Instead, we used an innovative method to test
the full operation of all the pieces of our developed software including V2V handshake protocol, RRH data
transfer, and lane departure detection. We had previously acquired and stored multiple GPS trajectories
of a test vehicle on our test road segment. We used two such separate trajectories of two vehicles driven
in close proximity of each other on the test road segment and stored them in two separate DSRC devices.
The two DSRC devices represented two test vehicles traveling on the actual road. Each of the two DSRC
devices was operated normally in the lab except that every new GPS point acquired by the GPS receiver
of the corresponding DSRC device was replaced with one of the GPS points in stored trajectory. By doing
this, each DSRC device appeared to be as it was being driven on the actual road. The DSRC device of one
of the two vehicles (shown as yellow in Figure 4.3b) was running the lane departure detection software
but did not have the corresponding RRH of that road segment so it needed to request RRH from a
neighboring vehicle to detect lane departure and issue an audible warning. The other vehicle (shown as
green in Figure 4.3b) acted as a neighboring vehicle having the necessary RRH data file in its DSRC device.
In this test, only one of the two vehicles (yellow) without the needed RRH data file was tested for lane
departure detection algorithm after successfully receiving the RRH data file from the neighboring vehicle
(green). The results are similar and consistent with our first field test results as shown in Figure 4.1 and
Figure 4.2.
31
4.2 CONCLUSIONS AND FUTURE WORK
We have successfully developed an in-vehicle lane departure warning system (LDWS) using GPS
technology and DSRC based V2V communication to transfer RRH from one vehicle to another. Our newly
designed algorithm can be easily applied to large tracts of vehicle trajectories. Our algorithm first
partitions various sections of the road from the trajectory and then characterizes each section separately
with an optimized set of parameters completely defining heading value at any point on the road. This road
reference when used for our previously designed lane departure detection algorithm, works efficiently to
detect unintentional lane departures while minimizing the number of false alarms to almost zero, which
was the prime goal of the algorithm design. Field tests were performed on two road segments – one on a
highway and the other on a freeway – containing a variety of curves and straight road sections to evaluate
the performance of the newly designed algorithm. The results of the field tests showed that the system
can detect the true lane departures on a straight or a curved road with an accuracy of almost 100%. While
doing the tests, no false alarms or spurious lane departures were detected even on sharp curved sections
of the freeway.
Additionally, to enable proper communication among vehicles to transfer RRH from one vehicle to
another, we have developed the V2V handshake protocol using DSRC devices. According to our developed
V2V handshake protocol, a vehicle in need of RRH can initiate a request to receive a RRH from its
neighboring vehicles and receive from the most suitable neighboring vehicle on the road. Upon receiving
the requested RRH, the vehicle in need can use the received RRH for unintentional lane departure
detection and warning as well as store it in its memory/database for future use. We have used two DSRC
devices simulating the two vehicles in the lab to test the developed V2V handshake protocol and RRH data
transfer software. After developing and extensively testing our software, we have performed field tests
to successfully detect lane departures using the RRH received via DSRC-based V2V communication.
A better alternative to V2V communication is to integrate the developed LDWS into popular smartphone
apps, e.g., Waze, Google Maps or Apple Maps, to take advantage of the vast database of multiple GPS
trajectories that can be used to generate RRH for almost all roads, making it available for a vehicle to
detect its unintentional lane departure on any road even if the vehicle is being driven on that road for the
first time. We have already begun work to devlop a smartphone app for our proposed LDWS using a
vehicle’s past trajectories. The successful development of this project will pave the way for integration of
the proposed algorithm into one of the popular smartphone apps.
32

REFERENCES 1. American Association of State Highway and Transportation Officials (2008). Driving down lane-
departure crashes: A national priority, 11-12.
2. Cicchino, J. (2018). Effects of lane departure warning on police-reported crash rates, Journal of
Safety Research, 66, 61-70.
3. Salvucci, D. D. (2008). Inferring driver intent: A case study in lane-change detection. Proceeding
of Human Factors Ergonomics Society 48th Annual Meeting, 2228–2231.
4. Kuge, N., T. Yamamura & O. Shimoyama (2000). A driver behavior recognition method based on
a driver model framework, Society of Automotive Engineering, 109, 6, 469-476.
5. McCall, J. & M. M. Trivedi (2004). Visual context capture and analysis for driver attention
monitoring. IEEE Conference on Intelligent Transportation Systems, 332–337.
6. Heimes, F. & H. H. Nagel (2002). Towards active machine-vision-based driver assistance for urban
areas. International Journal of Computer Vision, 50, 1, 5–34.
7. Kwon, W. & S. Lee (2002). Performance evaluation of decision making strategies for an embedded
lane departure warning system. Journal of Robotics Systems, 19, 10, 499–509.
8. An, X., M. Wu & H. He (2006). A novel approach to provide lane departure warning using only one
forward-looking camera. International Symposium on Collaborative Technologies and Systems,
356-362.
9. Hsiao, P. & Chun-Wei Yeh (2006). A portable real-time lane departure warning system based on
embedded calculating technique. IEEE 63rd Vehicular Technology Conference, 2982-2986.
10. Yu, B., W. Zhang & Y. Cai (2008). A lane departure warning system based on machine vision. IEEE
Pacific-Asia Workshop on Computational Intelligence and Industrial Application, 197-201.
11. Leng, Y. C. & C. L. Chen (2010). Vision-based lane departure detection system in urban traffic
scenes. 11th International Conference on Control Automation Robotics & Vision, 1875-1880.
12. Lindner, P., E. Richter, G. Wanielik, K. Takagi & A. Isogai (2009). Multi-channel lidar processing for
lane detection and estimation. 12th International IEEE Conference on Intelligent Transportation
Systems, 1-6.
13. McCall, J. C., and M. M. Trivedi (2006). Video-based lane estimation and tracking for driver
assistance: survey, system, and evaluation. IEEE Transactions on Intelligent Transportation
Systems, 7, 1, 20-37.
33

14. Dobler, G., S. Rothe, P. Betzitza & M. Hartleib (2018). Vehicle with optical scanning device for a
lateral road area. US Patent: 6,038,496.
15. Clanton, J. M., D. M. Bevly & A. S. Hodel (2009). A low-cost solution for an integrated multisensor
lane departure warning system. IEEE Transactions on Intelligent Transportation Systems, 10, 1,
47-59.
16. Hussain S., M. Faizan & M.I. Hayee (2018). Real-time relative lane and position identification of
surrounding vehicles using GPS and DSRC based vehicle-to-vehicle communication. Proceedings
of IEEE Conference on Communications, 1-7
17. Cao, L. & J. Krumm (2009). From GPS traces to a routable road map. GIS: Proceedings of the 17th
ACM Sigspatial International Conference on Advances in Geographic Information Systems, 3–12.
18. Guo,T., K. Iwamura & M. Koga (2007). Towards high accuracy road maps generation from massive
GPS Traces data. IEEE International Geoscience and Remote Sensing Symposium, 667-670.
19. Chen, C. & Y. Cheng (2008). Roads digital map generation with multi-track GPS data. International
Workshop on Education Technology and Training & International Workshop on Geoscience and
Remote Sensing, 1, 508-511.
20. Guo, D., S. Liu & H. Jin (2010). A graph-based approach to vehicle trajectory analysis. Journal of
Location Based Services. 4, 183-199.
21. Shi, W., S. Shen & Y. Liu (2009). Automatic generation of road network map from massive GPS,
vehicle trajectories. 12th International IEEE Conference on Intelligent Transportation Systems, 1-
6.
22. Huang, J., M. Deng, J. Tang, S. Hu, H. Liu, S. Wariyo & J. He (2018). Automatic generation of road
maps from low quality GPS trajectory data via structure learning. IEEE Access, 6, 71965 – 71975.
34