Embed Size (px)
Citation preview

Retrospective Theses and Dissertations Iowa State University Capstones, Theses andDissertations
2002
Development and characterization of corn lineswith new starch propertiesYulin JiIowa State University
Follow this and additional works at: https://lib.dr.iastate.edu/rtd
Part of the Agriculture Commons, Food Science Commons, and the Plant Sciences Commons
This Dissertation is brought to you for free and open access by the Iowa State University Capstones, Theses and Dissertations at Iowa State UniversityDigital Repository. It has been accepted for inclusion in Retrospective Theses and Dissertations by an authorized administrator of Iowa State UniversityDigital Repository. For more information, please contact [email protected].
Recommended CitationJi, Yulin, "Development and characterization of corn lines with new starch properties " (2002). Retrospective Theses and Dissertations.521.https://lib.dr.iastate.edu/rtd/521

INFORMATION TO USERS
This manuscript has been reproduced from the microfilm master. UMI films
the text directly from the original or copy submitted. Thus, some thesis and
dissertation copies are in typewriter face, while others may be from any type of
computer printer.
The quality of this reproduction is dependent upon the quality of the
copy submitted. Broken or indistinct print, colored or poor quality illustrations
and photographs, print bleedthrough, substandard margins, and improper
alignment can adversely affect reproduction.
In the unlikely event that the author did not send UMI a complete manuscript
and there are missing pages, these will be noted. Also, if unauthorized
copyright material had to be removed, a note will indicate the deletion.
Oversize materials (e.g., maps, drawings, charts) are reproduced by
sectioning the original, beginning at the upper left-hand corner and continuing
from left to right in equal sections with small overlaps.
ProQuest Information and Learning 300 North Zeeb Road, Ann Arbor, Ml 48106-1346 USA
800-521-0600


Development and characterization of corn lines with new starch properties
by
Yulin Ji
A dissertation submitted to the graduate faculty
in partial fulfillment of the requirements for the degree of
DOCTOR OF PHILOSOPHY
Major: Food Science and Technology
Program of Study Committee: Pamela J. White, Major Professor
Jay-lin Jane Peter Keeling Linda Pollak
Anthony Pometto
Iowa State University
Ames, Iowa
2002
Copyright © Yulin Ji, 2002. All rights reserved.

UMI Number: 3073456
®
UMI UMI Microform 3073456
Copyright 2003 by ProQuest Information and Learning Company. All rights reserved. This microform edition is protected against
unauthorized copying under Title 17, United States Code.
ProQuest Information and Learning Company 300 North Zeeb Road
P.O. Box 1346 Ann Arbor, Ml 48106-1346

ii
Graduate College Iowa State University
This is to certify that the doctoral dissertation of
Yulin Ji
has met the dissertation requirements of Iowa State University
Committee Me ber
Committee Member
Commi ^ ber
C^j ittee Member
Maj Professor
For the Major Program
Signature was redacted for privacy.
Signature was redacted for privacy.
Signature was redacted for privacy.
Signature was redacted for privacy.
Signature was redacted for privacy.
Signature was redacted for privacy.

iii
TABLE OF CONTENTS
ABSTRACT v
CHAPTER 1. GENERAL INTRODUCTION I Introduction 1 Dissertation Organization 2 Cited Literature 2
CHAPTER 2. LITERATURE REVIEW 4 Starch Structure 4 Functional Properties of Starch 9 Effect of Environmental Factors on the Structural and Functional 13 Properties of Starch GEM Project 16 Cited Literature 17
CHAPTER 3. OPTIMIZING A SMALL-SCALE CORN-STARCH 29 EXTRACTION METHOD FOR USE IN THE LABORATORY
Abstract 30 Introduction 31 Materials and Methods 32 Results and Discussion 34 Conclusion 37 Cited Literature 38
CHAPTER 4. THERMAL AND STRUCTURAL PROPERTIES OF 42 UNUSUAL STARCHES FROM DEVELOPMENTAL CORN LINES
Abstract 43 Introduction 44 Materials and Methods 45 Results and Discussion 48 Conclusion 53 Acknowledgement 54 Cited Literature 54
CHAPTERS. STRUCTURE AND FUNCTION OF STARCH FROM 69 ADVANCED GENERATION OF NEW CORN LINES
Abstract 70 Introduction 71 Materials and Methods 72 Results and Discussion 77 Conclusion 85 Acknowledgement 85 Cited Literature 85

iv
CHAPTER 6. GELATINIZATION PROPERTIES OF STARCHES FROM 106 THREE SUCCESSIVE GENERATIONS OF SIX EXOTIC CORN LINES GROWN IN TWO LOCATIONS
Abstract 107 Introduction 108 Materials and Methods 109 Results and Discussion 110 Conclusion 114 Acknowledgement 115 Cited Literature 115
CHAPTER 7. GENERAL CONCLUSIONS 130
ACKNOWLEDGMENTS 132

V
ABSTRACT
The objectives of this research were to evaluate functions and structures of starches
from exotic x adapted inbred lines and exotic breeding crosses (exotic populations x adapted
lines), and to establish relationships between the fine structure and functional properties of
the starches. A secondary objective was to confirm the advancement of selected functional
traits into the next generation of corn.
A small-scale corn-starch extraction procedure optimized in this research was used to
extract starch from com kernels. To optimize the starch extraction procedure, effect of
different starch extraction procedures on starch yield, protein content, and thermal properties
were studied. Starch yield and protein content were significantly altered by the experimental
treatments. Treatments involving more kernels and/or sedimentation rather than
centrifugation, yielded starch with the lowest protein content. Soaking the seeds for less than
24 hrs is preferred if minimizing annealing is desired.
Starches from several developmental lines with unusual thermal properties as
measured on a Differential Scanning Calorimeter (DSC, gelatinization onset temperature
(T0G) < 60°C or range of gelatinization (Ro) > 14°C) were selected for further
characterization. Two independent gelatinization transitions, located in different starch
granules, were found in some starches. All selected starches from the developmental lines had
greater peak viscosity as measured on a Rapid Visco Analyser (RVA) than did starch from
normal corn inbreds Mo 17. Significant differences were observed in starch-granule size
distributions and shape distributions of the selected starches. Measurements with high-
performance anion-exchange chromatography (HPAEC) revealed that all selected unusual
starches had a lower normalized concentration of chains with a degree of polymerization (dp)
of 15-24 and/or a greater normalized concentration of chains with dp of 6-12. Overall chains
with a low T0g had a higher relative concentration of branch chains shorter than dp 13 than
did normal starch. These studies will aid in understanding structure-thermal property
relationships of starches, and in identifying com lines of interest for commercial breeding.
To study the effect of environment and genotype on the gelatinization properties of
starches from developmental com lines, starches from developmental com lines, grown 1)
during three successive generations; and 2) in both temperate and tropical environments,
were evaluated. Unusual thermal properties (low T0c ) were fixed in some progeny lines.

vi
Environmental factors had a significant effect on the thermal properties of starch, and a
significant interaction between environment and genotype was observed. These results
suggest that incorporation of exotic alleles into Corn Belt germplasm is an excellent means to
obtain value-added traits to produce starch with desirable functions.

I
CHAPTER 1. GENERAL INTRODUCTION
Introduction
Starch is the primary source of stored energy in cereal grains. Although the amount
of starch contained in grains varies, it is generally between 60 and 75% of the weight of the
grain and provides 70-80% of the calories consumed by humans worldwide (Thomas and
Atwell 1999). Starch is a valuable ingredient to the food industry. Apart from the nutritional
role, starch products function as thickeners of liquid foods, as binding agents in solid foods,
as texturizers (to obtain a certain mouth feeling texture), as "fillers" both in liquid foods and
powdered foods and as film forming agents.
To improve starch functionality and expand the usefulness of starch, starch is usually
chemically modified (such as by cross-linking and/or substitution). However, due to
increased consumer and environmental concern, no new derivatives or degree of substitution
will be allowed anytime soon even for nonfood applications (BeMiller 1997). A greater
potential for the manufacture of modified starches with improved functionalities lies in the
use of raw materials from previously uncharacterized plant genotypes. This approach might
be especially valuable to the food industries because the corn starch could be used in the
manufacture of "all natural" foods.
Exotic (non-Corn Belt Dent) germplasm may be an excellent source for improving
quality and, possibly, improved agronomic performance, because much of the corn grown
outside the United States is consumed directly by humans and has undergone centuries of
selection for flavors, aromas, and textures (Tracy 1990). Exotic germplasm is usually
considered to include unadapted domestic populations and foreign temperate, tropical, and
semi-tropical populations. The introgression of adapted germplasm with useful genes from
exotic com has successfully altered com traits and broadened the genetic base through the
Germplasm Enhancement of Maize (GEM) project (Pollak and Salhuana 1999).
Several novel GEM adapted by exotic breeding crosses were targeted in our research,
because these new crosses can produce starches with improved functional properties, which
may have potential applications in food industry. To fully utilize the potential of these GEM
materials, it is essential to further characterize the structural and functional properties of
starch produced. To produce inbred lines that can be released and used commercially as

2
breeding lines from these GEM crosses, it is necessary to continue to develop and select
lines to genetically "fix" the unusual thermal properties, and evaluate the performance of the
selected lines at the different environments.
In this dissertation, development and characterization of com lines with new starch
properties will be presented.
Dissertation Organization
This dissertation is composed of seven parts. The general introduction and a literature
review are followed by four papers. The first paper "Optimizing a single-kernel corn-starch
extraction method for use in the laboratory" discusses the effect of different starch extraction
procedures designed for use in the laboratory on yield, protein content, and thermal
properties of com starch. The procedure optimized in this paper was used in research
conducted within the rest of the dissertation. The second and third papers, "Thermal and
structural properties of unusual starches from developmental com lines" and "Structure and
function of starch from advanced generation of new com lines" respectively, focus on
characterization of functions and structures of starches from exotic and exotic x adapted
inbred lines, and establishment of relationships between the fine structure and functional
properties of the starches. The objectives of the fourth paper, "Gelatinization properties of
starches from three successive generations of six new com lines grown in two locations",
were to evaluate the intra- and interpopulation variability in thermal properties of starches
from exotic and exotic by adapted novel com lines and their derivatives when grown 1)
during two successive years in the same location; and 2) in both temperate (Ames, I A) and
tropical (Puerto Rico) environments. The dissertation concludes with a chapter of "General
conclusion".
Literature Cited
BeMiller, J. N. 1997. Starch modification challenges and prospects. Starch/Stârke.
49:127-131.
Pollak, L. M., and Salhuana, W. 1998. Lines for improved yield and value-added traits
results from GEM. Ann. Com Sorgh. Ind. Res. Conf. 53: 143-158.
Thomas, D., & Atwell, W. A. 1999. Matching starches to application. Page 1 in: Starches.

3
Thomas, D., and Atwell, W. A. Eagan Press: St. Paul, Minnesota, USA
Tracy, W. F. 1990. Potential contributions of five exotic maize populations to sweet
corn improvement. Crop Sci. 30:918-923.

4
CHAPTER 2. LITERATURE REVIEW
Starch Structure
Starches from different botanical sources and even from different varieties within a
source differ in their properties. The key to understanding the structure-function
relationships, the physico-chemical, functional, and even the nutritional properties of starch
from various botanical sources is to be found in the chemical structure and composition of
the starches, as well as in the organization within the starch granules.
Much progress has been made learning about the understanding of the three
dimensional structure of starch. We now have the basic structural information that explains
many of its characteristics. One of the low energy conformations of the flexible amylosic
chain leads to single strands that readily form rigid double helices. In turn, these pairs
associate in pairs that nest together, stabilized by hydrogen bonding and van der Waals
forces. Finally, these pairs associate to give the A or B structures, depending on their chain
length and water content. The branched amylopectin easily forms the double helices,
although the branching itself appears to occur in amorphous zones (Imberty et al 1991).
Important aspects of starch structure remain unanswered, and "starch remains a beautifully
mysterious substance" (BeMiller 1997a).
Amylose and Amylopectin, the Constituent Polymers
Starch granules are typically composed of two types of glucose polymers with
different sizes and shapes: amylose and amylopectin. Amylose, the smaller of the two
fractions (103-106 Da; DP 500-5000), possesses very few branches, 9-20 per molecule with
chain lengths of between 4 and >100 glucose units (Hizukuri et al 1981). Amylopectin, the
larger (107-109 Da) fraction, is highly branched, 4-5% of its linkages being a (l->6) branch
linkages (Manners 1989, Oats 1997).
Structurally and functionally, amylopectin is the more important of the two fractions,
because, alone, it is sufficient to generate granules, as occurs in mutant starches that are
devoid of amylose. The fine structure of amylopectin has been the subject of many studies
and several models have been proposed. In the last 20 years, the "cluster" model proposed
by Nikuni (1969) and French(1972), modified by Robin et al (1974) and later reviewed by
Linkback (1984), has generally been accepted. In this model, chains in the amylopectin are

5
classified according to their linkage to the rest of the molecule. The chains include only one
C chain, which carries the sole reducing end group; B chains, which are linked to the C chain
via the potential reducing end-groups; and A chains, which are linked to B chains in the same
way as are A chains and are unbranched. B chains can participate in more than one
crystalline amylopectin side-chain clusters, and be classified further to B1-B4 by the number
of side chain cluster in which the chain participates (Hizukuri 1986).
After being debranched by using an enzyme such as isoamylase, many amylopectin
molecules give a bimodal distribution of chain lengths with degree of polymerization (d.p.)
~40-60 and 15-20, with the shorter chains being the most abundant (Jane et al 1999). The
ratio by weight of short to long chains varies between 3:1 and 12:1 depending on the source
of the amylopectin (Hizukuri 1985). The major variations in the fine structure of
amylopectin are size of molecules, the type of distribution of chain lengths, the ratio of short
to long chains, and the chain length.
The amylopectin molecules are fairly large flat discs. Self diffusion data from pulsed-
field gradient 1H-NMR indicated that, in DMSO, amylopectin molecules are planar with an
axial ratio greater than 6 and that, in water, they are more spherical (Callaghan and Lelievre
1986). Sedimentation coefficient studies showed that amylopectin has an elongated
ellipsoidal, flat-sheet or disc-like structure with semi-major and semi-minor axes of 45 and
1.2 nm, respectively, giving a rather linear shape (Callaghan and Lelievre 1987, Lelievre et
al 1986).
Starch Granule Structure
The starch granule is nature's chief way to store energy in green plants over long
period of time. The granule is well suited to this role. The constituent macro molecules of
granules are packaged in a highly ordered and compact manner, resulting in a inert,
insoluble-to-water structure but one which is still accessible to the plant's metabolic
enzymes. Native granules have crystallinity between 15 and 45% (Zobel 1988) and can yield
X-ray diffraction patterns, generally of low quality. The amylopectin is predominantly
responsible for the granule's crystallinity. The starch granule is a spherocrystalline assembly
of amylopectin molecules oriented radially with their non-reducing ends towards the outer
surface (BeMiller 1997b). Granule crystallinity is believed to result from clustered
amylopectin chains of DP ca. 15 (Hizukuri 1985).

6
The internal structure of granules can be described by three levels of organization:
the granule 'growth ring', the 'super-helical' structure blocklet, and stacks of lamellae (Fig
2) (Gallant et al 1997). At the lowest level of organization, starch granule are a mosaic of
alternating semi-crystalline 'soft material' and crystalline shells 'hard material' which are
between 120 and 400 nm thick (French 1984, Yamaguch et al 1979). The organization of
starch polymers in the semi-crystalline shells is poorly understood. It is evident, however,
from solid state l3C NMR studies (Gidley and Bociek 1985) that the level of helical order in
starch granules is often significantly greater than the extent of crystalline order.
Consequently, it appears that much of the amylopectin in semi-crystalline shells is in the
double helical form, although it is not crystalline (Gallant et al 1997). The crystalline shell
has been intensively studied and the structure within this part is well understood. It is
generally believed that the crystalline shell consists of interleaved amorphous and crystalline
'lamellae' (with average thickness 9-10 nm) (Jenkins et al 1993, Oostergetel and van
Bruggen 1989), which represents the crystalline (ordered double helical side chain clusters)
and amorphous regions (branching regions) of the amylopectin molecules according to the
models of Robin et al. (1974) and French (1984). Each amylopectin side-chain cluster can
contain between 9-17 double helical chains, each with about three turns of the double helix.
The amylopectin side chain cluster within the crystalline lamellae are not uniform with
respect to their size (diameter ca 5-15 nm), shape (on average around 10 nm wide by 9-10
nm long) or density (Gallant et al 1997, Jenkins and Donald 1995, Oostergetel and van
Bruggen 1993).
With the introduction of high-resolution microscopic techniques, substantial evidence
was collected supporting the hypothesis for the existence of a second level of granule
structure, between that of the growth rings' and the lamellae, termed the 'blocklet' (Baldwin
et al 1996, Gallant et al 1997). The blocklets' play an important role in the structure and
organization of crystalline and possibly semi-crystalline granule shells. The blocklet has
more or less spherical structures, possibly corresponding to the superclusters' and/or 'super-
helices' structure formed by organization of the crystalline and amorphous lamella. The
blocklets range in diameter from around 20 to 500 nm depending on starch type, location in
the granule and possible amylose. Blocklet size is generally large in the B

7
crystal pattern and is generally smaller in the semi-crystalline shells of the granule (Gallant
etal 1997).
Corn, sorghum, and millet (all in the Panicoideae subfamily of the Graminae family)
starch granules were found to have pores, randomly distributed over their surfaces, which are
openings to channels that connect a central cavity to the external environment (Fannon et al
1992). These pores were often observed to be clustered. Pores were also found along the
equatorial groove of large granules of wheat, rye, and barley starches. None were seen on
any granules of rice, oat, potato, or tapioca (cassava) starches. The channels within starch
granules are believed to be comprised of semi-crystalline or amorphous starch polymers, and
formed at the junction zones between the more crystalline blocklets (Gallant et al 1997).
Channels and related pores are believed to be formed naturally. The pores may be the initial
sites of enzyme attack during germination and/or openings that allow enzyme molecules
direct access to the granule interior (Fannon et al 1992). The central cavity may be formed
by crystallization of amylopectin molecules and concurrent shrinkage of the matrix as the
granule grows and develops (Huber and BeMiller 2000).
The exact location of amylose, lipid and protein within granules is still not certain.
Results of a series of crosslinking studies indicated that amylose molecules randomly
interspersed among the amylopectin molecules as individual radial molecules with an
increasing concentration of amylose (in non-mutant starches) towards the granule exterior
(Jane and Shen 1993, Kasemsuwan and Jane 1994, Morrison and Gadan 1987). The location
of amylose with respect to amylopectin in the amorphous and/or crystalline regions is
dependent on the botanical source of the starch. In wheat starch, amylose is mainly found in
the amorphous region, but in potato starch it may be partly co-crystallized with amylopectin
(Blanshard 1987). Size is an important criterion. Large amylose molecules participate in
double helices with amylopectin, whereas smaller amylose molecules, located at the granule
periphery, are able to leach from the granule (Jane and Shen 1993, Kasemsuwan and Jane
1994).
Two Types of Crystallite Structures, A and B
Two types of crystallite structures, A and B, have been identified in starch granules
by wide angle X-ray scattering (WAXS), which can be distinguished by the packing
configuration of double helices and water content. Another proposed type, the C pattern of

8
native starch, is now thought to be a combination of A and B patterns: the B polymorphs are
in the center of the granule and are surrounded by the A polymorphs (Bogracheva et al
1998).
Both unit cells A and B contain two helices (12 glucose residues) and their packing is
shown in Figure I. In both unit cells, double helices associate in pairs that are nested
together and stabilized by hydrogen and van der Waals' bonds. The most recent model for A-
type structure describes a face-centered monoclinic unit cell incorporating 12 residues
located in two left-handed chains that contain four water molecules between the helices
(Sarko and Wu 1978). The structure of B-type starches is more clearly defined and
composed of a basic repeat unit in which chains are packed in a hexagonal array. The unit
cell has two left-handed, parallel-stranded, double helices that are arrayed in parallel,
forming a hexagonal unit cell. There is much more space available for water in the unit cell
of the B-structure than the A-structure. The unit cell contains 36 water molecules (hydration
of 27%), among which half of the water is tightly bound to the double helices and the other
half is centered on a 6-fold screw axis that is parallel to the c-axis (Buleon et al 1998, Imbety
et al 1991).
The pairing of double helices is a common structural element in both A- and B-
polymorphs and the lateral distances between the helices are nearly identical, which suggests
a possibility of interconversion of the two structures. Under low humidity and high
temperature, an irreversible transition from B starch to the A form can be accomplished by
the removal of the water and rearrangement of the pairs of double helices to fill the void left
while remaining in the solid state as fibers or granules. On the other hand, it appears that the
reverse transition can not take place without a gelatinized intermediate that would disrupt the
crystalline architecture of the dense A form (Imbety et al 1991).
These crystalline natures of starch probably depend on both the amylopectin chain
length and environmental condition during plant growth (soybean and sweet potato)
(Hizukuri 1969). In general, amylopectin molecules of A-types starches have shorter chains
in both the long-and short-chain fractions and larger amounts of short-chain fractions than
those of the B-type starches (Jane et al 1999, Hizukuri 1985). In addition, Pfannemuller
(1987) and Gidley and Bulpin (1987) showed that amylosic fragments with DP < 10 did not
crystallize, whereas the A form resulted from chains with DP from 10 to 12; chains longer

9
than 12 yielded B form crystals. Chains longer than DP 50 did not form the single crystals
formed by the shorter chains but instead resulted in tangled networks.. Retrograded starch
also gives a B diffraction pattern.
Gidley and Bulpin (1987) have proposed that the chain length effect is a result of the
different losses of entropy upon crystallization. An alternate explanation is based on a
comparison of the ways that the A and B forms might occur. Single strands of amylose can
associate with other single strands as long as their DP is greater that nine. Next, two double
helices are paired to form the stable duplex described earlier. If there is enough water to fill
the central cavity, and if the duplexes are long enough to organize those water molecules in a
stable column, then the B form occurs. Otherwise, the pseudo-hexagonal A form results, with
its less favorable packing energy (Imberty et al 1991).
The chain lengths of amylopectin of the C-type starches were intermediate and it is
inferred that these starches possibly yield any type of crystalline structure depending on the
environment temperature and other factors, whereas the A and B-type starches are insensitive
to temperature (Hizukuri 1985).
In in vitro experiments, B starch crystallizes in pure water and low temperatures,
while A starch requires dehydrating conditions, such as addition of alcohol or salt or/and
increased temperature (Buleon et al 1984, Imberty et al 1991, Ring et al 1987)
Functional Properties of Starch
When subject to thermal treatments such as heating or freezing in an aqueous
environment starches undergo a range of physicochemical transitions (Fig 3) (Jane 1997).
When starch granules are equilibrated in water at room temperature, they undergo limited
reversible swelling, which is assumed to be related to swelling of the amorphous areas of the
granule (Blanshard 1987, French 1984). When starch-water suspensions are heated, at
temperatures specific for a given starch, the crystalline structure melts and the starch
granules swell to a high degree (Cooke and Gidley 1992, Doublier 1987). This phase
transition is called gelatinization. With continue heating, granules continue to swell, become
fragile, and eventually burst, especially if some shear force is applied. The resulting paste is
a discontinuous phase of swollen granules and /or granule remnants (fragments) in a
continuous phase of polymer solution. On cooling, some starch molecules partially

10
reassociate to form a network by association of the linear starch fractions, termed gelling.
Sometimes the gel starts settling as a precipitate from the solution due to rétrogradation. The
phase transitions of starch define and explain differences in physical properties of starches
and their behavior in food products, and they are extremely important in food processing.
For example the application of starch as a raw material usually requires the prior disruption
of the inert granule structure. Whereas gelling is desirable in most foods, rétrogradation is
troublesome, especially when the starch paste is subject to freezing and thawing operations.
Gelatinization
Gelatinization is a cooperative process (Dnovan 1979, Evans and Haisman 1982,
Marchant and Blanshard 1978). In excess water content, starch granules begin to swell and
imbibe water when energy is applied to break some of the intermolecular hydrogen bonds in
amorphous regions. Before the temperature reaches the beginning of gelatinization,
amorphous region continue to swell and the segmental mobility of the amorphous phase is
greatly increased (Bogracheva et al 1998), which destabilizes the crystallites and results in
the disruption of the less stable crystallites. The disruption of crystallinity always begin from
the hilum area of the granule, which suggests that the less stable crystallites are arranged in
this area (French 1984). The disruption of crystallinity in a particular area of the granule
increases the swelling capacity of this area. The swollen disrupted parts of the granule have a
much higher water content than the amorphous part of undistributed areas, and these swollen
areas will decrease the melting temperature of neighboring crystallites based on the "theory
of melting point depression" developed by F lory (1953), It is evident that the swelling of
disturbed areas accelerates the process of disruption of neighboring crystallites, and that this
process is rapidly propagated along the granule.
Studies on the semi-crystalline synthetic polymers suggest that the changes in the
melting temperature can have two major causes: a decrease of crystalline lamellae thickness
and an increase of surface free energy for faces of crystalline lamellae due to an increase of
structural defects (Protserov et al 2002). The second point is very relevant because it is
believed that the dissociation of polymer crystals begins from their defects. Generally,
gelatinization temperature is a qualitative measure of starch crystallite structure (effectively
double helix length), whereas gelatinization enthalpy is a quantitative measure of the overall
crystallinity (quality x quantity) (Morrison 1995, Tester and Morrison 1990a). It is concluded

11
that the low-gelatinization temperature starches have less crystallinity and less perfect
crystallites than the high-gelatinization temperature starches due to minor structural
differences in their amylopectin. Factors that will affect the gelatinization temperature of
native starches include glass transitions of amorphous regions, amylose/amylopectin ratio,
the type of crystalline unit, the length of amylopectin double helices and the surface entropy
of starch crystalline lamellae (Gerald et al 2000, Matveev et al 2001, Protserov et al. 2002,
S afford et al 1998, Tester et al. 1999, Wang et al 1998).
The swelling power of starch depends on the capacity of starch molecules to hold
water via hydrogen bonding (Lee and Osman 1991). Interpretation of the swelling behavior
of starches is complicated because so many factors are involved. The intact structure of the
amylopectin molecules is very important to the swelling power because swelling power of
starch granules was almost completely lost after one day of lintnerization. Both the
amorphous and crystalline segments of A- and B-chains will contribute to swelling power
when heated beyond the point where crystallinity is lost. Amylose acts both as a diluent and
as an inhibitor of swelling, especially in the presence of lipids (natural components of waxy
cereal starch granules), which can form insoluble complexes with some of the amylose
molecules during swelling and gelatinization (Tester and Morrison 1990b). In addition to the
large granule size, the negative charges carried by the phosphate monoester contribute to the
high swelling power of potato starch (Jane et al 1999, Lim et al 1994).
In addition to structural factors, swelling and gelatinization of starch also can be
affected by annealing. Annealing is a process in which starch granules are held in an excess
amount of water at a temperature slightly below the gelatinization temperature for a
relatively long time, which allows limited molecular reorganization and formation of a more
organized structure of lower free energy (Knutson 1990). Annealing delays the gelatinization
(Fisher and Thompson 1997, Knustson 1990) and decreases swelling power and solubility of
starch (Eerlingen et al 1997). Krueger et al (1987) studied annealing of commercial com
starch and observed that annealing narrowed the gelatinization temperature range, increased
peak gelatinization temperature, and increased the enthalpy of gelatinization. These
researchers concluded that annealing caused structural changes in the starch granules that
affected their amorphous-crystalline relationships, forcing the granules into a more
crystalline orientation. These observations, however, were not supported by X-ray diffraction

12
studies. Nakazawa et al (1984) studied annealing of starch by holding starch water mixtures
(50 and 30% starch) at constant temperature for 5 min to 140 hr, and investigating their
thermal behavior using DSC. These researchers observed a gradual shift in the endotherm
peak temperature to a higher temperature with progressive annealing. The X-ray diffraction
patterns of annealed starch, however, showed gradual loss of crystallinity with progressive
annealing. The bi-phasic nature of the endotherm at intermediate hydration was gradually
lost on annealing, and a single sharper endotherm was formed. These authors concluded that
in a bi-phasic endotherm, the high-temperature endotherm represented melting of starch
crystallites, whereas the low-temperature endotherm corresponds to melting of the starch's
amorphous region of starch. Marchant and Blanshard (1978) also studied starch annealing
and reported loss of birefringence and reduction of X-ray crystallinity, but an increase in
enthalpy of gelatinization as measured by DSC.
Rétrogradation
Rétrogradation is a reorganization process that occurs after heating with water.
During the initial phase of rétrogradation, two or more starch chains may form a simple
juncture point, which may then develop into more extensively ordered regions. Ultimately,
under favorable conditions, a crystalline order appears (Thomas and Atwell 1999).
Rétrogradation involves both amylose and amylopectin, with linear amylose molecules
having a greater tendency to reassociate and form hydrogen bonds than larger, clustered
amylopectin molecules. The linear amylose molecule can be involved in more than one
crystallite result in stiffened gel, whereas the cluster shape of amylopectin result in fewer
intermolecular interactions and soft gels. Once formed, amylose gels generally require
autoclave temperatures (110-160°C) for reversal. Temperatures required to solubilize
amylopectin gels can vary from room temperature to 95°C, depending on the degree of
molecular association or crystallization that had developed (Zobel 1988).
The rate of rétrogradation depends on a number of variables, including the structures
of amylose and amylopectin, ratio of amylose to amylopectin, temperature, starch
concentration, botanical source of the starch, and presence and concentration of other
ingredients.

13
Effect of Environmental Factors on the Structural and Functional Properties of Starch
Individual properties of starch depend both on the genetic background of the plant
and on environmental factors. It is evident that "reliance on a particular cultivar for a given
food application (because of perceived quality attributes of the starch) is of limited value,
unless the different environmental effects experienced during starch deposition are
documented and understood" (Tester 1997). Environmental effects on the granule-size
distribution of starch, the crystallization of amylopectin, amount of free and lipid complexed
amylose, molecular structure of the starch polymers and associated properties of starch
granules (similar genotypes) have been repoted (Asaoka et al 1989, Fergason and Zube
1962, Hizukuri 1969, Shi et al 1994). However, opinions vary on the significance of the role
of genetic and environmental factors in the total variability of starch properties. One reason
for this might be that those different genotype respond differently to environmental factors.
Effect of Environmental Factors on the Structure of Starch
The environment has a strong effect on the starch-granule size-distribution of wheat
and barley. In both wheat and barley, greater temperatures have been associated with
reductions in number of B granules, shifting the ratio in favor of A granules (Bhullar and
Jenner 1985, MacLeod and Duffus 1988, Tester et al 1991). When other stresses were
present, the numbers of A granules also were reduced by high temperatures, but
proportionately fewer than those of B granules (Tester et al 1991). Depending on growing
conditions, the mean volume of A granules within a cultivar varied one and half times and
the mean volume of B granules by two times (Morrison and Scott 1986). Wheat cultivars
have showed considerable variation in the sensitivity of B granule fraction to environmental
stresses ( Blumenthal et al 1995).
The amylose content of starch granules also is affected by the environmental
temperature. In maize and rice, higher growth temperatures tended to cause a reduction in
amylose contents (Asaoka et al 1985a, Asaoka et al 1985b, Asaoka et al 1987, Asaoka et al
1989, Fergason and Zuber 1962) in potato there is little effect of growth temperature,
whereas in wheat, amylase concentration tends to increase with temperature (Tester et al
1995, Shi et al 1994). Environmental effects on the amylose content of sweet potato starch
appear to be variable (Tian et al 1991). The composition of barley starch was reported to be
affected to some extent by environment. Tester et al. (1991) reported that in barley there was

14
little effect of growth temperature on the amylose content of normal or waxy cultivars of this
cereal. However, they showed that when a high amylose cultivar (Glacier Pentlandfield) was
grown at 15 rather than 10°C, there was a 27% decrease in the total amylose content of the
starch, although there was little change between 15 and 20°C.
The lipid content of starch is also affected by the growth temperature. The lipid
content tended to increase in waxy, normal, high amylose barley as a function of
temperature. Tester et al. (1991) showed that cultivars grown at 20 rather than 10°C
contained about 50% more lipid (as lysophospholipid). This increase was associated with an
increase in the LAM to F AM ratio. Similar results were reported for wheat (Shi et al 1994)
although there is some seasonal variability (Tester et al 1995).
It has been reported that environmental variation during starch biosynthesis affects
the branching pattern of the constituent starch polymers. In rice, an elevated environmental
temperature led to a reduction in the size of amylose molecules and increased amylopectin
chain lengths (Asaoka et al 1985a, Asaoka et al 1985b, Asaoka et al 1987, Asaoka et al 1989)
. Furthermore, the higher temperature increased the amount of long B chains of amylopectin
and decreased that of short B chains as compared with the lower temperature (Dehass and
Goering 1972, Morrison et al 1986). In wheat, elevated growth temperatures reportedly
increased the proportion of amylopectin unit chains with a DP of 10-16 but reduced the
proportions of unit chains with a DP of 17-21 (Shi et al 1994).
Environmental temperature was reported to have large effects on the X-ray
diffraction pattern for sweet potato (Hizukuri 1969). It was clearly shown that a change in
crystalline structure from A type to B type occurred with decreasing environmental
temperature.
A possible reason for the changes in the composition and structure of starch polymers
is the regulated starch biosynthesis, which results from the different stability or temperature
preference of starch metabolizing enzymes, including starch synthase (Jenner et al 1993,
Keeling et al 1993) or starch branching enzymes (Inouchi et al 2000, Lu et al 1996, Takeda
et al 1993). For example, isoforms of the branching enzyme, BE I and BE II, in maize
endosperm showed different optimum temperatures as well as a different preference of chain
length they transfer ( i.e., BE II has a lower optimum temperature and transfers shorter
chains than BE I ) (Guan et al 1997, Lu et al 1996). Lowering the temperature could increase

15
the relative activity of BE II to BE I, which leads to the increase in the proportion of shorter
chains in the amylopectin.
The reason for the increase of lipid content with higher temperature in barley is not
clear, nor indeed is any role of lipid in the biosynthesis of starch granules in cereal grains.
Whereas it is tempting to speculate that the lipid controls and regulates the biosynthesis of
amylose, and maintains the amylose to amylopectin ratio, this ratio is largely independent of
temperature, for example, potato starches which contain no lipid (Tester 1997).
Effect of Environment on Functional Properties of Starch
The functional properties of starch were reported to be sensitive to the
environmental temperature under which the starch granule was produced. The gelatinization
temperatures and enthalpies of gelatinization of starches from waxy, normal and high
amylose barley (Tester et al 1991), wheat (Shi et al 1994, Tester et al 1995) and rice starches
are all increased as growth temperature is elevated. Similar effects have been reported for
maize starch where planting dates, environmental temperature and day length have been
studied as variables (Campbell et al 1994). Pasting temperatures also increased for potato,
sweet potato and soybean seedling starch as a function of increasing environmental
temperature.
It is not yet certain if environmental conditions directly affect the formation of
double helices or, more probably, the association of these double helices into a crystalline
region. Increased gelatinization temperature may be caused by changes in double helix
lengths. The hypothesis has been, in part, confirmed by work (Moates et al 1997), where it
was shown that the increase in the degree of polymerisation of amylose in spherolitic
crystals leads to an increase in their dissociation temperature. In addition, it is hypothesized
that elevated growth temperature directly enhances crystallite formation in viro. Double
helix formation during starch synthesis is probably driven by thermodynamic forces alone,
with similarities to the physical processes, that operate during rétrogradation in food
systems, and will, therefore, be operating in conjunction with, but not driven by, specific
synthesis steps active during the deposition of starch. If we assume that double helix
formation is spontaneous upon starch synthesis because this is the most thermodynamically
favorable state, it seems unlikely that growth temperature increases the number of double
helices, but probably more likely influences conformational reorganization within both the

16
crystalline and amorphous zones as a consequence of growth temperatures to facilitate the
association of the double helices. Firm evidence to support these hypotheses is lacking
(Tester 1997).
GEM Project
Corn is the major source of starch produced worldwide. The center of origin was
probably Mexico or Guatemala, with domestication occurring about 5000 B.C (Pollak and
White 1995). Corn is extremely important to the U.S. economy because of the amount
produced, and its value for domestic and export use.
In corn, like in all crops, improvement by line-hybrid development is usually
followed by a decrease in genetic diversity. Goodman (1985) reported that < 1% of the U. S.
commercial maize germplasm base could be considered as foreign exotic germplasm
(tropical plus temperate) and even less may be expected from the domestic exotic germplasm
(open-pollinated varieties). The narrowing genetic base of maize leads to concerns about
corn's genetic vulnerability to changes in environmental and agronomic conditions, and new
insect and disease pressures (Crossa and Gardner 1987, Kuckuck et al 1991). Tracy
emphasized the importance of exploring exotic (non-Corn Belt Dent) germplasm for
improving quality and, possibly, improved agronomic performance, because much of the
corn grown outside the United States is consumed directly by humans and has undergone
centuries of selection for flavors, aromas, and textures (Tracy 1990). Exotic germplasm is
usually considered to include unadapted domestic populations and foreign temperate,
tropical, and semi-tropical populations. Geadelmann (1984) suggested that incorporation of
exotic strains into adapted germplasm would increase the available genetic variability and
give rise to additional heterotic vigor, lessening chances for a yield plateau. The
introgression of adapted germplasm with useful genes from exotic com has successfully
altered corn traits and broadened the genetic base through the GEM project (Pollak and
Salhuana 1999).
The GEM project, a coordinated and cooperative effort among public and private
sectors, was launched with the objective of providing the corn industry with materials
developed by using germplasm enhancement of useful exotic germplasm and ultimately
improving and broadening the germplasm base of com hybrids grown by American farmers.

17
Traits targeted for improvement are agronomic productivity, disease and insect resistance,
and value-added characteristics (Pollak and Salhuana 1999).
GEM is the successor to the Latin American Maize Project (LAMP) (Salhuana et al
1998), which was the first coordinated international effort to deal with the evaluation of the
genetic resources of a major world crop (Salhuana et al 1998). The LAMP was launched in
1987 by the U.S. Department of Agriculture, Agriculture Research Services (USDA-ARS)
and 11 Latin American countries with funding from Pioneer Hi-Bred International (Johnston,
IA). The primary goal of LAMP was to evaluate and maintain the irreplaceable corn
germplasm bank of Latin America and the United States. LAMP evaluated over 12,000
accessions grown at 70 locations in the United States and Latin America. Screening used in
LAMP was based on the yield potential and agronomic characteristics. The results of LAMP
indicate that there are accessions (native and foreign) that show good yield potential on
which enhancement can be initiated in order to improve yield, agronomic characteristics and
adaptability before being incorporated into breeding programs. Of these LAMP accessions,
270 were selected as potential sources of high yields, with 51 chosen to initiate GEM (Singh
et al 2001a).
Starch represents nearly 70% of the dry weight of the mature corn kernels and is the
most economically important component. Therefore, to further evaluate the starch quality of
the GEM materials is essential to the fully utilize these materials. Only a small amount of
data has been collected on the compositional, thermal, milling and structural properties of
seed and starch from GEM material (Campbell et al 1995, Singh et al 2001a, Singh et al
2001b, White et al 1990). Significant variability in these properties of starch among the
GEM accessions was found because of the diverse genetic background. The GEM accessions
possessing unusual properties might be useful in developing new lines with unique starches
for added value or additional uses.
Literature Cited
Asaoka, M., Okuno, K., and Fuwa, H. 1985a. Effect of environmental temperature at
the milky stage on amylose content and fine structure of amylopectin of waxy and
nonwaxy endosperm starches of rice (Oryza sativa L.). Agric. Biol. Chem. 49:373-
379.

18
Asaoka, M., Okuno, K., and Fuwa, H. 1985b. Genetic and environmental control of
starch properties in rice seeds. Pages 29-38 in: Approach to research on cereal
carbohydrates. Hill R. D. and Munck, L., Eds. Elservier: Amsterdam.
Asaoka, M., Okuno, K.., Hara, K., Oba, M., and Fuwa, H. 1989. Effect of
environmental temperature at the early developmental stage of seeds on the
characteristics of endosperm starches of rice (Oryza sativa L.). J. Jpn. Soc. Starch
Sci. 36:1-8.
Asaoka, M., Okuno, K., Konishi, Y., and Fuwa, H. 1987. The effects of endosperm
mutations and environmental temperature during development on the distribution of
molecular weight of amylose in rice endosperm. Agri. Biol. Chem. 51:3451-3453.
Baldwin, P. M., Frazier, R. R., Adler, J., Glasbey, T. O., Keane, M. P., Poberts, C. J.,
Tendler, S.J. B., Davies, M. C. and Melia, C. D. 1996. Surface imaging of thermally-
sensitive particulate and fibrous materials with the atomic force microscope: a novel
sample preparation method. Microcopy. 184: 75-80.
BeMiller, J. N. 1997a. Starch modification challenges and prospects. Starch/Starke.
49:127-131.
BeMiller, J. N. 1997b. Structure of the starch granule. J. Appl. Glycosci. 44:43-49.
Bhullar, S. S. and Jenner, C. F. 1985. Differential responses to high temperatures of
starch and nitrogen accumulation in the grain of four cultivars of wheat. Aust. J. Plant
Physiol. 12:363-375.
Blanshard, J. M. V. 1987. Starch granule structure and function: a physicochemical
Approach. Pages 16-54 in Starch: properties and potentials, Critical Reports on
Applied Chemistry, Vol. 13, T. Galliard ed. John Wilry and Sons: Chichester, U. K.
Blumenthal, C., Bekes, F., Gras, P. W., Barlow, E. W. R., and Wrigley, C. W. 1995.
Identification of wheat genotypes tolerant to the effects of heat stress on grain
quality. Cereal Chem. 72:539-544.
Bogracheva, T. Y., Morris, V. J., Ring, S. G., Hedley, C. L. 1998. The granular
structure of C-type pea starch and its role in gelatinization. Biopolym. 45:323-332.
Buleon, A., Colonna, P., Planchot, V., and Ball, S. 1998. Starch granules: structure
and bisynthesis. Int. J. Biol. Macromol. 23:85-112.
Buleon, A., Duprat, F., Booy, F. P., and Chanzy, H. 1984. Single crystals of amylopectin

19
with a low degree of polymerization. Carbohydr. Polym. 59:161-173
Callaghan P. T., and Lelievre, J., 1986. The influence of polymer size and shape on
self-diffusion of polysaccharides and solvents. Anal. Chim. Acta, 189:145-166.
Callaghan P. T., and Lelievre, J., 1987. A comparison of the size and shape of 0-
limit detrin and amylopectin using pulsed field-gradient nuclear magnetic resonance
and analytical ultracentrifugation. Carbohydr. Res. 62:33-40
Campbell, M. R„ Pollak, L. M., and White, P. J. 1994. Effect of planting date on
maize starch thermal properties. Cereal Chem. 71:556-559.
Campbell, M. R., Pollak, L. M. and White, P. J. 1995. Genetic variation for starch
thermal and functional properties among nonmutant maize inbreds. Cereal Chem.
72:281-286.
Cooke, D., and Gidley, M. J. 1992. Loss of crystalline and molecular order during
starch gelatinization: origin of the enthalpic transition. Carbohydr. Res. 227:103-112.
Crossa, J., and Gardner, C. O. 1987. Introgression of an exotic germplasm for
improving an adapted maize population. Crop Sci. 27:187-190.
Dehass, B. W., and Goering, K. J. 1972 Chemical structure of barley starch. I. study
of the properties of amylase and amylopectin from barley starches showing a wide
variation in Brabender cooking viscisity curves. Starch/Stârke. 24:145-149.
Donovan, J. W. 1979. Phase transitions of starch-water system. Biopolymers. 18:263.
Doublier, J. L. 1987. A rheological comparison of wheat, maize, Faba Bean and Smooth
Pea Starches. J. Cereal Sci. 5. 247-262
Eerlingen, R. C., Jacobs, H., Block, K., and Delcour, J. A. 1997. Effects of
hydrothermal treatment on the rheological properties of potato starch. Carbohydr.
Res. 297:347-351.
Evans, I. D. and Haisman, D. R. 1982. The effect of solutes on the gelatinization
temperatures range of potato starch. Starch/Stârke. 34:224-231.
Fannon, J. E., Hauber, R. J., and BeMiller J. N. 1992. Surface pores of starch
granules. Cereal Chem. 69:284-288.
Fergason V. L.,and Zuber, M. S. 1962. Influence of environment on amylase content of
maize endosperm. Crop Sci. 2:209-211.
Fisher, D. K., and Thompson, D. B. 1997. Rétrogradation of maize starch after

20
thermal treatment within and above the gelatinization temperature range. Cereal
Chem. 74:344-351.
Flory, P. J. 1953. Pages 193-21 in: Principles of Polymer Chemistry. Flory, P. J. Cornell
University Press: Ithaca, N. Y.
French, D. 1972. Fine structure of starch and its relationship to the organization of starch
granules. J. Jpn. Soc. Starch Sci. 19:8-25.
French, D. 1984. Organisation of starch granules. Pages 184-248. in: Starch: Chemistry and
Technology. R. L. Whistler, J. N. Bemiller, and E. F. Paschall, eds. Academic Press:
Orlando, FL.
Gallant, D. J., Bouchet, B., and Baldwin, P. M. 1997. Microscopy of starch: evidence
of a new level of granule organization. Carbohydr. Polym. 32:177-191.
Geadelmann, J. L. 1984. Using exotic germplasm to improve Northern corn. Ann. Corn
Sorgh. Ind. Res. Conf. Proc. 39:98-110.
Gerard, C., Planchot, V., Colonna, P. and Bertoft, E. 2000. Relationship between
branching density and crystalline structure of A- and B-type maize mutant starches.
Carbohydr. Res. 326 :130-144.
Gidley, M. J., and Bociek, S. M. 1985. Molecular organisation in starches: A 13C
CP/MAS NMR study. J. Am. Chem. Soc. 107:7040-7044.
Gidley, M. J., and Bulpin, P. V. 1987. Crystallization of malto-oligosaccharides as
models of the crystalline forms of starch: Minimum chain-length requirement for the
formation of double helices. Carbohydr. Res. 161:301-304.
Goodman, M. M. 1985. Exotic maize germplasm: Status, prospects and remedies. Iowa
State J. Res. 59:497-527.
Guan, H., Li, P., Imparl-Radosevich, J., Preiss, J., and Keeling, P. 1997. Comparing
the Properties of Escherichia coli Branching Enzyme and Maize Branching Enzyme.
Arch. Biochem. Biophys. 342:92-98.
Hizukuri, S. 1969. The effect of the environmental temperature of plants on the
physiochemical properties of their starches. J. Jpn. Soc. Starch Sci. 17:73-88.
Hizukuri, S. 1986. Polymodal distribution of the chain lengths of amylopectins, and
its significance. Carbohydr. Res. 147:342-347.
Hizukuri, S. 1985. Relatinship between the distribution of the chain length of

21
amylopectin and the crystalline structure of starch granules. Carbohdyr. Res.
141:295-306.
Hizukuri, S. 1996. Starch: analytical aspects. Pages 347-429 in: Carbohydrates in Food.
Eliasson, A. C. ed. Marcel Dekker Inc: New York, USA.
Hizukuri, S., Takeda, Y, Yasuda, M., and Suzuki, A. 1981. Multi-branched nature of
amylose and the action of de-branching enzymes. Carbohydr. Res. 94:205-213.
Huber, K. C., and BeMiller, J. N. 2000. Channels of maize and sorghum starch granules.
Carbohydr. Polym. 41:269-276.
Imberty, A., Buleon, A., Tran, V., and Perez, S. 1991. Recent advances in knowledge
of starch structures. Starch/Stârke. 43:375-384.
Inouchi, N., Ando, H., Asaoka, M., Okuno, K., and Fuwa, H. 2000. The effect of
environmental temperature on distribution of unit chains rice amylopectin.
Starch/Stârke. 52:8-12.
Jane. J. 1997. Starch functionality in food processing. Pages 26-35 in: Starch
structure and functionality. P. J. Frazier, P. Richmong, and A. M. Donald, eds. The
royal society of chemistry:Cambridge, UK.
Jane, J., Chen, Y. Y., Lee, L. F., McPherson, A. E., Wong, K. S., Radosavljevic, M.,
and Kasemsuwan, T. 1999. Effects of amylopectin branch chain length and amylose
content on the gelatinization and pasting properties of starch. Cereal Chem. 76:629-
637.
Jane, J., and Shen, J. J. 1993. Internal structure of the potato starch granule revealed
by chemical gelatinization. Carbohydr. Res. 247:279-290.
Jenkins, P. J., Cameron, R. E., and Donald, A. M. 1993. A universal feature in the
structure of starch granules from different botanical sources. Starch/Stârke. 45:417-
420.
Jenkins, P. J., and Donald, A. M. 1995. The influence of amylose on starch granule
structure. Int. J. Biol. Macromol. 17:315-321.
Jenner, C F., Siwek, K., and Hawker, J. S., 1993. The Synthesis of [14C] Starch from
[14C] Sucrose in Isolated Wheat Grains is Dependent upon the Activity of Soluble
Starch Synthase. Aust. J. Plant Physiol. 20: 329-335.
Kasemsuwan, T., and Jane, J. 1994. Location of amylose in normal starch granules. II.

22
Locations of phosphodiester cross-linking revealed by phosphorus-31 nuclear
magnetic resonance. Cereal Chem. 71:282-287.
Keeling, P. L., Bacon, P. J., Holt, D. C. 1993. Elevated temperature reduces starch
deposition in wheat endosperm by reducing the activity of soluble starch synthase.
Planta. 191:342-348.
Knutson, C. A. 1990. Annealing of maize starches at elevated temperatures. Cereal
Chem. 67:376-384.
Krueger, B. R., Knutson, C. A., Inglett, G. E„ Walker, C. E. 1987. A differential scanning
calorimetry study on the effect of annealing on gelatinization behaviour of corn
starch. J. Food Sci. 52:715-718.
Kuckuck, H., Kobabe, G„ and Wenzel, G. 1991.4. Plant Breeding and Plant Production.
Pages 188-189 in: Fundamentals of Plant Breeding. H. Kuckuck, G., Kobabe. and G.,
Wenzel. Springer-Verlag: Berlin, Germany
Lee, Y. E., and Osman, E. M. 1991. Correlation of morphological changes od rice starch
granules with rheological properties during heating in excess water. J. Koreal Agri.
Chem. Soc. 34:379-385
Lelievre, J., Lewis, J. A., and Marsden, K. 1986. The size and shape of amylopectin: a
study using analytical ultracentrifugation. Carbohydr. Res. 153:195-203
Lim, S. T., Kasemsuwan, T., and Jane, J. 1994. Characterization of phosphorus in
starches using 31P-NMR spectroscopy. Cereal Chem. 7:488-493.
Lineback, D R., 1984. The starch granules: organisation and properties' in Bakers
Dig. 58:16-21
Lu, T., Jane, J., Keeling, P. L., and Singletary, G. W. 1996. Maize starch fine
structures affected by ear development temperature. Carbohydr. Res. 282:157-170.
MacLeod, L. C., and Duffus, C. M. 1988. Temperature effects on starch granules in
developing barley grains. J. Cereal Sci. 8:29-37.
Marchant, J. L., and Blanshard, J. M. V. 1978. Studies of the dynamics of the
gelatinization of starch granules employing a small angle light scattering system.
Starch/Stârke. 30:257-264.
Manners, D. J. 1989. Recent developments in our understanding of amylopectin
structure. Carbohydr. Polym. 11:87-112.

23
Matveev, Y. I., van Soest, J. J. G., Nieman, C., Wasserman, L. A., Protserov, V. A.,
Ezernitskaja M., and Yuryev, V. P. 2001. The relationship between thermodynamic
and structural properties of low and high amylose maize starches. Carbohydr. Polym.
44:151-160.
Moates, G. K.., Noel, T. R., Parker, R., and Ring, S. G. 1997. The effect of chain length
and solvent interactions on the dissolution of the B-type crystalline polymorph of
amylose in water. Carbohydr. Res. 298:327-333.
Morrison, W. R. 1995. Starch lipids and how they relate to starch granule structure
and functionality. Cereal Foods World. 40:437-438, 440-441,443-444.
Morrison, W. R., and Gadan, H. 1987. The amylose and lipid contents of starch
granules in developing wheat endosperm. J. Ceral Sci. 5:263-275.
Morrison, W. R„ and Scott, D. C. 1986. Measurement of the dimensions of wheat starch
granule populations using a Coulter Counter with 100-channel analyzer. J. Cereal
Sci. 4:13-21.
Morrison, W. R., Scott, D. C., and KarKalas J. 1986. Variation in the composition and
physical properties of barley starches. Starch/Stârke. 38:374-379
Nakazawa, F., Noguchi, S., Takahashi, J., and Takada, M. 1984. Thermal equilibrium.
State of starch-water. Mixture studied by differential scanning calorimetry. Agric.
Biol. Chem. 48:2647-2653.
Nikuni, Z. 1969. Denpun and chori (Starch and Cookery). Chorikaguku 2, 6
Gates, C. G. 1997. Towards an understanding of starch granule structure and
hydrolysis. Trends in Food Science & Technology. 8:375-382.
Oostergetel, G. T., van Bruggen, E. F. J. 1989. On the origin of a low angle spacing in
Starch. Starch/Stârke. 9:331-335
Oostergetel, G. T., van Bruggen, E. F. J. 1993. The crystalline domains in potato starch
granules are arranged in a helical fashion. Polymer. 21:7-12
Pfannemxiller, B. 1987. Influence of chain length of short monodisperse amylase on the
formation of A- and B-type X-ray diffraction patterns. Int. J. Biol. Macromol. 9:105-
108
Pollak, L. M., and Salhuana, W. 1998. Lines for improved yield and value-added traits
results from GEM. Ann. Corn Sorgh. Ind. Res. Conf. 53:143-158.

24
Pollak, L. M., and White, P. J. 1995. Corn as a food source in the United States: Part I,
Historical and Current Perspectives. Cereal Foods World. 40:749-754.
Protserov, V. A., Wasserman, L. A., Tester, R. F., Debon, S. J. J., Ezernitskaja, M. G.,
and Yuryev, V. P. 2002. Thermodynamic and structural properties of starches
extracted from potatoes grown at different environmental temperatures. Carbohydr.
Polym. 49:271-279
Ring, S. G., Miles, M. J., Morris, V. J., Turner, R., and Colonna, P. 1987. Spherulitic
crystallization of short chain amylase. Int. J. Bio. Macromol. 9:158-160
Robin, J. P, Mercier, C., Charbonnière, R., Guilbot, A.. 1974. Lintnerized starches, gel
filtration and enzymatic studies of insoluable residues from prolonged acid acid
treatment of potato starch. Cereal Chem. 51:389-406
Safford, R., Jobling, S. A., Sidebottom, C. M., Westcott, R. J., Cooke, D., Tober, K. J.,
Strongitharm, B. H., Russell, A. L. and Gidley, M. J. 1998. Consequences of
antisense RNA inhibition of starch branching enzyme activity on properties of potato
starch. Carbohydr. Polym. 35:155-168.
Salhuana, W., Pollak, L., Ferrer, M., Paratori, O., and Vivo, G. 1998. Agronomic
evaluation of maize accessions from Argentina, Chile, the United States, and
Uruguay. Crop Sci. 38:866-872.
Sarko, A., and Wu, H.-C. H. 1978. The crystal structure of A-, B- and C-Polymorphs
of amylose and starch. Starch/Starke.30:73-78.
Shi, Y-C., Seib, P. A. and Bernardin J. E. 1994 Effects of temperature during
grain-filling on starches from six wheat cultivas. Cereal Chem. 71:369-383
Singh, S. K., Johnson, L. A., Pollak, L. M., and Hurburgh, C. R, Jr. 2001a.
Compositional, physical, and wet-milling properties of accessions used in
Germplasm Enhancement of Maize project. Cereal Chem. 78:330-335.
Singh, S. K., Johnson, L. A., White, P. J., Jane, J. -L., and Pollak, L. M.
2001b. Thermal Properties and Paste and Gel Behaviors of Starches Recovered
from Accessions Used in the Germplasm Enhancement of Maize Project. Cereal
Chem. 78:315-321
Takeda, Y., Guan, H. P., and Preiss, J. 1993. Branching of amylose by the branching
isoenzymes of maize endosperm. Carbohydr Res. 240:253-263.

25
Tester, R. F. 1997. Influence of Growth Conditions on Barley Starch Properties.
Int. J. Bio. Macromol. 21:37-45.
Tester, R. F., Debon, S. J. J., Davies, H. V., and Gidley, M. J. 1999. Effect of
temperature on the synthesis, composition and physical properties of potato starch. J.
Sci. Food Agri. 79: 2045-2051.
Tester, R. F., and Morrison, W. R. 1990a. Swelling and gelatinization of cereal
starches. I. Effect of amylopectin, amylose, and lipids. Cereal Chem. 67:551-557.
Tester, R. F. and Morrison, W. R. 1990b. Swelling and gelatinization of cereal
starches. II Waxy Rice starches. Cereal Chem. 67: 558-563
Tester, R. F.. Morrison, W. R., Ellis, P. R., Piggot, J. R., Batts, G. R., Wheeler, T. R.
Morrison, J. H., Hadley, P., and Ledward, D. A. 1995 Effects of elevated growth
temperature and carbo dioxide levels on some physico-chemical properties of wheat
starch. J. Cereal Sci. 22:63-71.
Tester, R. F., South, J. B., Morrison, W. R., and Ellis R. P. 1991. The effects of
ambient temperature during the grain filling period on the composition and properties
of starch from four barley genotypes. J. Cereal Sci. 13:113-127.
Tian. S. J., Rickard, J. E., and Blanshard, J. M. W. 1991. Physico-chemical properties
of sweet potato starch. J. Sci. Food Agri. 57:459-491
Thomas, D., & Atwell, W. A. 1999. Matching starches to application. Page 28 in:
Starches. Thomas, D., and Atwell, W. A. Eagan Press: St. Paul, Minnesota, USA
Tracy, W. F. 1990. Potential contributions of five exotic maize populations to sweet
corn improvement. Crop Sci. 30:918-923.
Wang, T. L., Bogracheva, T. Y., and Hedley, C. L. 1998. Starch: as simple as A, B,
C?. J. Exp. Botany. 49:481-502.
White, P. J., Abbas, I., Pollak, L. M., and Johnson, L. 1990. Intra- and interpopulation
variability of thermal properties of maize starch. Cereal Chem. 67:70-73.
Yamaguch, M., Kainuma, K. and French, D. J., 1979. Electron microscopic observations
of waxy maize starch. J. Ultrastructural Res. 69:249-261
Zobel, H. F. 1988. Molecules to granules: a comprehensive starch review. Starch/Stârke.
40:44-50.

26
A -A -
h-*-
i % »:
Bt; A
ft T J
T
1 f
C.L K12-16-) — c.l. 27-28 —
Fig 1. Model of the cluster structure of amylopectin (taken from Hizukuri 1996)

27
Semi-crystalline ' Soft Shell
Whole Granule
Pores Granule Surface Hilum
Crystalline
Hard Shell
Semi-crystalline JV\ Soil Shell
Large Small Amorphous Biocklet Block lei
Channels
Crystalline
Amorphous
Biocklet
Amylopectin
Clusters
m Side View Top View
Amylose Lipid Type B -V
Fig 2. Overview of starch granule structure. At the lowest level of granule organization, the alternating crystalline (hard) and semi-crystalline (soft) shells are shown (dark and light colors, respectively). The shells are thinner towards the granule exterior (due to increasing surface area to be added to by constant growth rate) and the hilum is shown off center. At a higher level of structure the biocklet structure is shown, in association with amorphous radial channels. Biocklet size is smaller in the semi-crystalline shells than in the crystalline shells. At the next highest level of structure one biocklet is shown containing several amorphous crystalline lamellae. In the next diagram the starch amylopectin polymer in the lamellae is shown. The next image (from Blanshard, 1987) reminds us that amylose-lipid (and protein) feature in the organization of the amylopectin chains. At the highest level of order, the crystal structures of the starch polymers are shown (taken from Gallant et al. 1997).

28
Starch granules • Swollen Heating Gelatinized
-4 granules • Starch Temp -> Tgeiat-
Heating& Shearing ,
•
Retrograded Storage Cooling Starch Starch < GeI ~ Paste
Heating
Fig 3. Transformation of starch physical structure (taken from Jane 1997).

29
CHAPTER 3. OPTIMIZING A SMALL-SCALE CORN-STARCH EXTRACTION
METHOD FOR USE IN THE LABORATORY1
A paper to be submitted to Cereal Chemistry
Y. Ji2, K. Seetharaman2,3, and P. J. White2,4
1 Journal Paper No ... of the Iowa Agriculture and Home Economics Experiment Station,
Ames, Iowa, Project No. , and supported by Hatch Act and State of Iowa funds. 2 Graduate student, postdoctoral research associate, and professor, respectively, 2312 Food
Science Building, Department of Food Science and Human Nutrition, Iowa State University,
Ames, IA 50011, USA. 3 Currently, Assistant Professor, Department of Food Science, The Pennsylvania State
University, University Park, PA 16802, USA. 4 Corresponding author. Email: pjwhitefgiiastate.edu. Phone: (515)294-9688. FAX: (515)294-
8181.

30
Abstract
The objective of this experiment was to determine the effect of different starch
extraction procedures designed for use in the laboratory on starch yield, protein content, and
thermal properties. The effects were examined of starch extraction methods differing in
steeping time (24,48, or 72 hrs), in the numbers of com kernels extracted (2, 5, or 10
kernels), or in isolation method (sedimentation or centrifugation). Starch yield, protein
content of the extracted starch, and starch thermal properties obtained by using a Differential
Scanning Calorimeter (DSC) were determined. Starch yield and protein content were
significantly altered by the experimental treatments. Starch extracted following steeping for
24 hr and purified by the sedimentation method had the lowest gelatinization onset
temperature and the widest gelatinization temperature range among the treatments examined.
The energy required to gelatinize starch did not differ among the treatments. The differences
in onset temperature and temperature range were probably caused by annealing of starch that
occurs over time, during steeping. Treatments involving more kernels and/or sedimentation
rather than centrifugation, yielded starch with the lowest protein content. Therefore, this
study suggests that sedimentation is preferred over centrifugation, 10 kernels is preferred
over 2 or 5, and soaking the seeds for less than 24 hrs is preferred if minimizing annealing is
desired.

31
Introduction
Common to all starch research is the initial step of extracting starch granules from
the plant material. The extraction must be accomplished without significant modification of
the starch granules and in sufficient quantities to permit various analyses. Wet-milling, the
industrial process for extracting starch from cereal grains, involves chemical, biochemical,
and mechanical operations to separate corn into relatively pure fractions of starch, gluten,
germ, and fiber. The process involves softening the kernel in steep water, followed by
grinding. Fractions are separated by taking advantage of differences in the physical
properties including density and particle size of the fractions (Singh et al 1997).
During extraction of corn starch, the grain is steeped in dilute sulphur dioxide (SO?)
or bisulfite solution (a form of aqueous SO2) for more than 20 hr at 48 to 52°C. The SO?
disrupts the protein matrix that surrounds starch granules by breaking inter- and intra
molecular disulfide bonds, thus making the physical separation of starch and protein easier.
The SO2 also activates endogenous protease activity in the endosperm, which helps
solubilize the protein matrix (Wahl 1969). The degree of protein peptidization in whole
kernels increases over the 24-hr steeping period with increasing SO2 concentrations (up to
0.4% tested) and higher steeping temperature (up to 55°C tested), resulting in increased
starch granule release from the surrounding protein matrix. In commercial steeping, kernel
degradation for starch release does not occur until kernels are exposed to SO? (Wagoner
1948). Bisulfite ions also can form sulfo-protein complexes (Boundy et al 1967). The
naturally occurring Lactobacillus sp. can propagate at low (20-200 ppm) levels of SO2 and
will consume soluble materials that leach into the steep water directly from the steeped corn
or enter with the recycling of process water (Watson 1984). Lactic acid, arising from
fermentation of corn by Lactobacillus spp. in commercial operations, further enhances
separation of starch and proteins.
Laboratory wet-milling procedures can be used to evaluate wet-milling
characteristics of new corn hybrids, the effect of harvest and drying methods on the milling
efficiency of com, and the use of different steeping and processing techniques on product
yields. Laboratory procedures generally mill between 50 g and 2 kg of com. These
quantities, however, are still too large to screen com germplasm or developmental lines to
identify unusual properties for selection of desirable lines for breeding purposes. White et al

32
(1990) designed a single-kernel wet-milling starch-extraction process for use in the
laboratory, which uses 1 to 10 com kernels (0.2-3.5 g). The com kernels were steeped in
sodium metabisulflte solution, the pericarp and germ removed by hand, and the endosperm
blended with a microblender to further enhance the separation of starch and protein. A
modification to the procedure saves time by utilizing a tissue homogenizer rather than a
microblender (Krieger et al, 1997). The study showed that starch granules separated by
using the tissue homogenizer were intact and undamaged, and that their thermal properties
measured with a Differential Scanning Calorimeter (DSC) were similar to those of starch
separated by using the microblender (Krieger et al, 1997). Additional evaluation of this
procedure could further optimize conditions to obtain maximum starch yields with minimal
residual protein in the shortest amount of time.
Different extraction procedures will have different effects on the chemical
composition and physical properties of starch. The changes in starch properties resulting
from the extraction procedure were explained as a reflection of the non-rigid organization of
starch granules (Singh et al 1997). According to these authors, starch granule structure could
undergo alteration as a result of extraction. As an example, the reduction in yield of starch
from samples pretreated with potassium metabisulphite, an accepted pretreatment in some
extraction procedure, could be a result of mild oxidative degradation during pretreatment,
because sulphite is known to cleave the amylolytic linkages owing to its prooxidant activity
(John et al 1999).
In the current study, the effects of starch extraction methods differing in steeping
time (24,48, or 72 hr), number of kernels (2, 5, or 10 kernels), or in isolation method
(sedimentation or centrifugation) were examined. The objectives of this research were to
obtain the maximum starch yield, with minimal protein content, in a short time, while still
retaining the thermal properties characteristic of native starch, thus optimizing the process
conditions designed for use in the laboratory.
Materials and Methods
Materials
The com inbred, Mo 17, was grown and self-pollinated near Ames, IA, in 1998. Ears
were harvested at full physiological maturity and dried at 37.5°C until the moisture content

33
reached -12%. All seeds were stored at 4°C and 10% relative humidity until analyzed.
Starch Extraction
Corn kernels were hand-picked and cleaned to remove foreign material, mold, and
broken kernels before analysis. Kernels of whole com (2, 5 or 10 kernels) were steeped in 5
mL 1% sodium metabisulfite solution (~ 0.67% SO2) at 45°C for 24, 48 or 72 hr, followed by
manual removal of the pericarp and germ with forceps. The separated endosperm was placed
in a 50 mL centrifuge tube with 10 mL of distilled water and homogenized by using a
Tekmar Vortex type tissue homogenizer (Ultra-Turrax T25, 600W, Cincinnati, OH) at 20,500
rpm for 30 sec. The homogenized slurry was filtered by using a 30-micron nylon filter under
vacuum with several washes, for a total wash-water volume of 500 mL. Coarse and fine
fibers, and part of the protein, were removed during filtration. The starch-protein mixture
from the filtrate was further separated by either centrifugation or sedimentation. Each sample
was separated three times, with 250 mL of distilled water used for each of the three
separations. All treatments were performed in replication of five.
Centrifugation Procedure
The starch slurry was centrifiiged (Sorvall RC 5B Plus Newtown, CT) at 5,219 x g
force for 30 min. The supernatant was decanted, the protein layer was scraped off, and more
water (250 mL) added to the partly cleaned starch, with centrifugation and decanting
repeated three times. The resulting sediment was air-dried.
Sedimentation Procedure
The starch slurry was allowed to settle in a refrigerator for 2 hr and the supernatant
drained. The starch was rinsed with 250 mL water, drained twice, and the resulting sediment
air-dried.
Starch Yield
In this paper, the dry flour will be called starch. Starch yield was determined as
follows:
% yield = (weight of dry matter recovered from extraction* 100/weight of dry whole
corn kenels). The dry matter recovered after wet-milling still contained very little amounts of
protein, fiber and other residues. The weights of dry starch and com kernels were measured
using the same balance (±0.01 gram accuracy) by using the same balance (Mettler AE 104,
Toledo, OH).

34
Differential Scanning Calorimetry (DSC)
Transition temperatures and enthalpies associated with the gelatinization process of
starch were determined by using differential scanning calorimetry (Perkin Elmer DSC 7,
Norwalk, CT). A Perkin-Elmer DSC-7 analyzer (Norwalk, CT) equipped with thermal
analysis software (Perkin-Elmer Corp., Norwalk, CT) was used. All experiments were run at
a scanning rate of 10 °C /min from 30 °C to 110 °C. The samples were prepared with a water
to starch ratio of 2:1. The actual dry weight of starch used ranged from 3.96 to 4.02 mg. All
enthalpy calculations were based on the dry-starch weight. Thermal transitions for
gelatinization were characterized by T0 (onset temperature), Tp (peak temperature), Tc
(conclusion temperature), and AH (enthalpy of gelatinization).
Nitrogen Analyzer
Protein content was determined by using a Perkin Elmer Series II Combustion
Nitrogen Analyzer 2410 (Norwalk, CT). Combustion and reduction temperature used in the
experiment were 930°C and 640°C, respectively. CO? was used as purge gas. The compound,
Ethenediaminetetracetic Acid, was used as a standard, which was analyzed every three starch
samples to calibrate the Nitrogen Analyzer. Starch (40 to 50 mg) was used for each
measurement and each sample was analyzed in replicate of three, with the results averaged.
The protein conversion factor used was 6.25.
Statistical Analysis
A 3 x 3 x 2 complete factorial experimental design was used with three steeping
times (24, 48, or 72 hrs), three levels of kernel number (2, 5, or 10 kernels), and two
isolation methods (sedimentation or centrifugation). Unless otherwise noted, samples were
processed and analyzed in five replicates. Analysis of variance (ANOVA) was used to test
the hypothesis that means were not different for the starch yield, protein content, and each of
the DSC properties, and to test for main effects and interactions (including two-way and
three-way interactions) between steeping time, numbers of kernels, and isolation method.
Tukey's multiple range test was used to test for differences between groups (a=0.05).
Calculations were performed with SAS version 8.2 (SAS Institute, Cary, NC) for the Unix
Operating system.
Results and Discussion

35
Overall Evaluation of Extraction Procedures on the Starch Yield and Composition
The main effects of steeping time, number of kernels, isolation method, and two-way
interactions (steeping time x number of kernels, steeping time x isolation method, and
number x isolation method) were analyzed by using ANOVA for General Linear Model
(GLM). Three main factors (steeping time, number of kernels, and isolation method)
affected starch yield and protein content significantly (p < 0.01). Only the interaction of
steeping time and number of kernels was significant for starch yield (p < 0.05) indicating
that the impact of number of kernels on the starch yield was affected by the steeping time.
The mean yield and protein content of starches extracted by using the various
treatments are shown (Table I). Starch yield, ranging from 45.0 to 63.8%, and protein
content of the starch, ranging from 0.92 to 4.34%, were significantly different among
treatments (p < 0.05). Starch extracted from 10 kernels following soaking for 72 hr and
separated by using sedimentation resulted in the greatest starch yield with lowest protein
content in starch, whereas starch extracted from 2 kernels following soaking for 24 hr and
separated by using centrifugation resulted in the lowest starch yield and greatest protein
content in starch.
Effect of Steeping Time on Starch Yield and Protein Content
Starch yield increased and the protein content decreased as the steeping time
increased for both centrifugation and sedimentation isolation methods (Table I). The average
starch yield ranged from 48.5 to 55.2% with centrifugation and 55.5 to 58.9% with
sedimentation , and the starch protein content ranged from 3.65 to 2.82% with centrifugation
and 2.16 to 1.28% with sedimentation, respectively for the three levels of kernels used in the
extractions. The protein was probably more completely separated from starch when steeping
time was greater than 48 hr, resulting in both higher starch yields and lower protein content
(Wang and Johnson, 1992).
Effect of Number of Kernels on Starch Yield and Protein Content
Increasing the number of kernels extracted at one time resulted in lower protein
content in the starch and higher starch yields when using either isolation methods (Table I).
Increasing the number of kernels from 2 to 5 increased starch yield from 48.3 to 58.9% for
centrifugation and 53.8 to 57.8% for sedimentation (data averaged for all steeping times
shown in Table I). No significant increase for starch yield was observed with a further

36
increase in the number of kernels from 5 to 10. As the number of kernels decreased from 10
to 2, the protein content increased from 2.85 to 3.78% for centrifugation, and 1.33 to 2.01%
for sedimentation (data averaged for all steeping times shown in Table I). A possible reason
for the increased starch yield and decreased protein content as number of kernels increased
was that com kernels were not uniformly blended within 30 seconds, resulting in some
unbroken large particles. And starches could not be released from these large particles,
which might affect starch yield and its protein content. This possibility was ruled out
because homogenizer is a very efficient blender. No large particles were found from the
residue left after filtration or starch. Another possible reason might be the partial separation
of starch and protein occurred with the 30-pm filter used in the methods. Starch particles are
approximately in the order of 10 to 30 |im in diameter, whereas, protein particles are
typically about 5 to 10 jam in diameter (Singh 1994). Although the size of the starch particles
is greater than the size of the protein particles, the starch should pass through the filter,
whereas the stickier proteins would coat the filter cloth and bind with fiber that had not been
adequately separated (Singh and Eckhoff, 1996). Corn gluten is also known to agglomerate
under certain conditions, which also would account for the protein being retained by the
filter (Singh and Eckhoff, 1996). The same amount of water was used to wash all the starch
slurries, thus more protein may have been forced through the filter when fewer kernels were
extracted, resulting in greater protein contents. In addition, starch might be drained out with
wash water during sedimentation and centrifugation process, while this loss of milling
product would have a bigger effect on the 2 kernels extraction than 10 kernels extraction
because of small initial weight used in the previous extraction procedure. This may also
contribute to the low starch yield in the two-kernel extraction procedure.
Effect of Isolation Method on Starch Yield and Protein Content
Sedimentation resulted in starch with lesser protein content and greater starch yield
than starch extracted by using centrifugation (Table I). For centrifugation, the average
values of yield and protein content of starch over three steeping times and three levels of
kernels were 51.1% and 3.29%, respectively, whereas for sedimentation, the corresponding
average values were 56.9% and 1.65%, respectively. Milled starch consists primarily of
starch and com protein particles that can be further separated by particle density differences
in the isolation procedure. In commercial practices, centrifuges are used for primary starch-

37
protein separations because of the greater average density of starch granules (1.5g/cm3) than
of protein particles (l.lg/cm3) (Gausman et al 1952, Biss and Cogan 1988, and Steinke and
Johnson 1991). After centrifugation, the heavy starch fraction and the lighter protein fraction
both formed sedimentation. The protein layer, which lies above the starch, is scraped off. On
the other hand, centrifugation is not an appropriate separation method when the amount of
starch sample is small, especially for single- or small multi-kernel extractions. In such
extractions, the protein fraction was dispersed within the starch fraction, and no clear
separation of two fraction layers was observed, making it very difficult to remove the protein
fraction. In addition, some starch might also be removed with protein fraction because of the
dispersion. In contrast, during sedimentation, the heavy starch fraction settled to the bottom
of the beaker and the lighter protein fraction remained suspended in the water, being
removed during decanting. Further, smaller starch granules, which might be excluded at the
centrifugation speed used in the centrifugation method, were recovered in the sedimentation
method, thus resulting in greater starch yields.
Effect of Extraction Procedures on the Thermal Properties of Starch
Among all thermal properties studied in this research (Table II), only T0 and R were
significantly affected by the steeping time. Starch from kernels steeped for 48 hr or more had
greater T0 and a narrower R than did starch from kernels steeped for 24 hr. It is likely that
the starch underwent annealing which decreased swelling power and solubility of starch and
delayed the gelatinization (Fisher and Thompson 1997, Krueger et al 1987). No significant
main effects of number of kernels and isolation method on the DSC properties were found.
Conclusions
This study suggests that the sedimentation procedure is preferred for laboratory
starch extractions especially when quantity of sample is small because of the lowered protein
content in starch and higher starch yields. With total wash-water volume of 500 mL, using
10 com kernels in the extraction would produce starch with highest yield and lowest protein
content compared to 2 and 5 com kernels. Longer steeping time yielded starch with lower
protein content and higher yield. Soaking seeds for less than 48 hr is preferred to minimize
annealing of starches and, thus, altering starch thermal properties.

38
Literature Cited
Biss, R., and Cogan, U. 1988. The siginifance of insoluble protein solubilization in corn
steeping. Cereal Chem. 65:281-284.
Boundy, J. A., Turner, J. E., Wall, J. S., and Dimler, R. J. 1967. Influence of commercial
prosessing on composition and properties of corn zein. Cereal Chem. 44:281-287.
Fisher, D. K., and Thompson, D. B. 1997. Rétrogradation of maize starch after thermal
treatment within and above the gelatinization temperature range. Cereal Chem.
74:344-351.
Fox, S. R., Johnson, L. A., Hurburgh, C. R., Dorsey-Redding, C., and Bailey, T. B. 1992.
Relations of grain proximate composition and physical properties to wet milling
characteristics of maize. Cereal Chem. 69:191-197.
Gausman, H. W., Ramser, J. H., Dungan, G. H., Earle, F. R., MacMasters, M. M., Hall, H.
H., and Baird, P. D. 1952. Some effects of artificial drying of corn grain. Plant
Physiology 27:794-802
Hart, P. E., and Blanshard, J. M. V. 1982. The effect of extraction method upon the
gelatinization behaviour of wheat starch granules. Starch/Stârke. 34: 293-296.
Jacobs, H., and Delcour, J. A. 1998. Hydrothermal modifications of granular starch, with
retention of the granular structure: A review. J. Ag. Food Chem. 46:2895-2905.
John, J. K., Sunitha, V. R., Raja, K. C. M., Moorthy, S. N. 1999. Physicochemical and
enzyme susceptibility characteristics of starch extracted from chemically pretreated
xanthosoma sagitifolium roots. Starch/Stârke. 51: 86-89.
Krieger, K. M., Duvick, S. A., Pollak, L. M., and White, P. J. 1997. Thermal properties of
corn starch extracted with different blending methods; Microblender and
homogenizer. Cereal Chem. 74: 553-555.
Krueger, B. R., Walker, C. E., Knutson, C. A. and Inglett G. E. 1987. Differential scanning
calorimetry of raw and annealed starch isolated from normal and mutant maize
genotypes. Cereal Chem. 64:187-190.
Singh, N., and Eckhoff, S. R. 1996. Wet milling of com-a review of laboratory-scale and
pilot plant-scale procedures. Cereal Chem. 73:659-667
Singh, S. K., Johnson, L. A., Pollak, L. M., Fox, S. R., and Bailey, T. B. 1997. Comparison
of laboratory and pilot-plant corn wet-milling procedures. Cereal Chem. 74:40-48.

39
Steinke, J. D., Johnson, L. A. 1991. Steeping maize in the presence of multiple enzymes. I.
Static batchwise steeping. Cereal Chem. 68:7-12.
Wagoner, J. A. 1948. Microscopic observations and procedures used in a study of industrial
corn steeping. Cereal Chem. 25:354-361.
Wahl, G. 1969. Present knowledge of the maize steeping process. Starch/Stârke. 21:62-73.
Wang, C., and Johnson, L. A. 1992. Wet-milling characteristics of propionate-treated high-
moisture maize. I. Yields and compositions of products. Cereal Chem. 69:43-46
Watson, S. A. 1984. Corn and sorghum starches. Pages 417-468 in: Starch Chemistry and
Technology. R. L. Whistler, ed. Academic Press: Orlando, FL.
Watson, S. A. and Sanders, E. H. 1961. Steeping studies with corn endosperm sections.
Cereal Chem 38:22-33.
Wei 1er, C. L., Paulsen, M. R., and Steinberg, M. P. 1988. Correlation of starch recovery with
assorted quality factors of four corn hybrids. Cereal Chem. 65:392-397.
White, P. J., Abbas, I., Pollak, L. M., and Johnson, L. 1990. Intra- and interpopulation
variability of thermal properties of maize starch. Cereal Chem. 67:70-73.
Yaptenco, K. F., Fox, E. J., and Eckhoff, S. R. 1996. A laboratory countercurrent steep
battery for corn wet-milling. Cereal Chem. 73:249-256.

40
Table I. Effect of Extraction Methods on Starch Yield and Protein Content
Isolation Method Steeping Time Number of kernels Starch yield Protein Content Centrifugation
24 2 45.0a' 4.34a 24 5 52.8a-d 3.32ab 24 10 47.2a-c 3.30a-c 48 2 45.3ab 3.86ab 48 5 50.7a-d 3.3 la-c 48 10 53.5b-d 3.05a-d 72 2 49.7a-d 3.15a-d 72 5 56.9de 3.1 la-d 72 10 59. le 2.21 b-e
average 51.1 3.29 Sedimentation
24 2 52.2a-d 2.45b-e 24 5 57.4de 1,90c-e 24 10 56.8de 2,l3c-e 48 2 55.led I.89c-e 48 5 57.8de 1.74d-e 48 10 56.7de 0.92e 72 2 54.0cd 1.70de 72 5 58.2de 1.2 le 72 10 63.8e 0.92e
average 56.9 1.65 a Values followed by the same letter in the same column are not significantly different (P < 0.05)
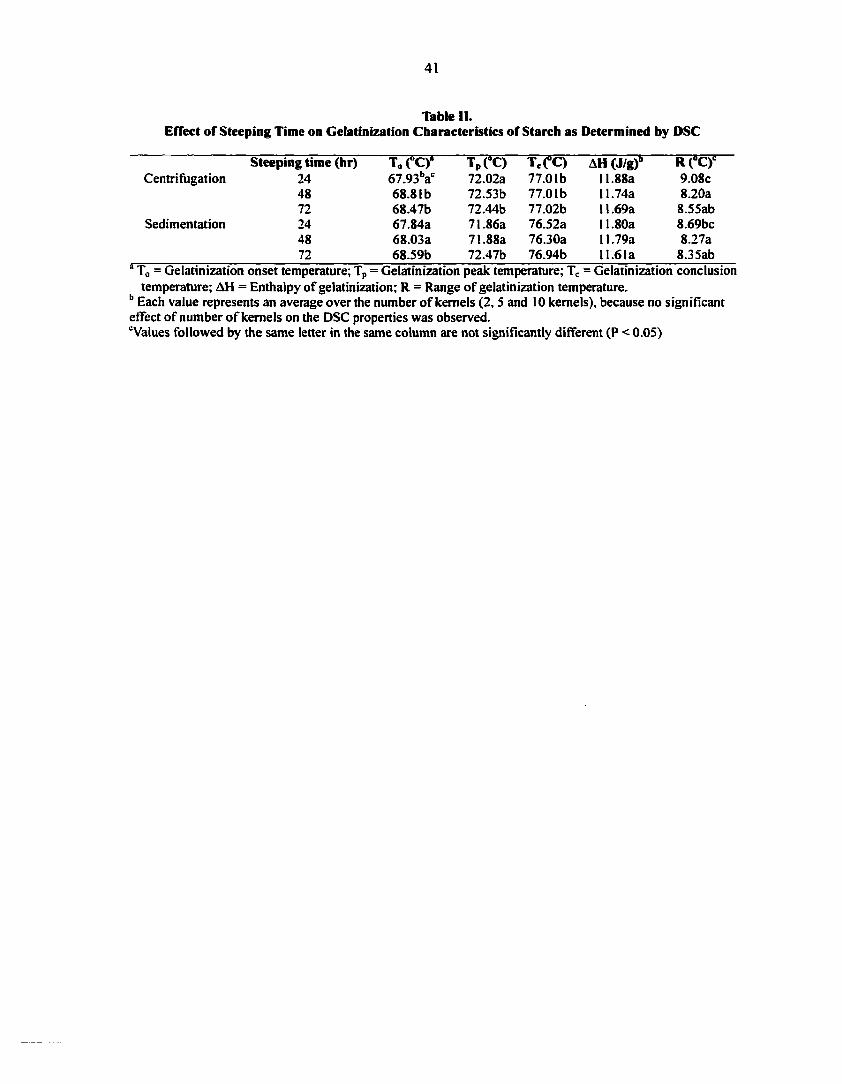
41
Table II. Effect of Steeping Time on Gelatinization Characteristics of Starch as Determined by DSC
Steeping time (hr) T„ ("C)* TP(°C) Tc(°C) AH (J/g)6 R (°C)C
Centrifugation 24 67.93V 72.02a 77.01b 11.88a 9.08c 48 68.8 lb 72.53b 77.0lb 11.74a 8.20a 72 68.47b 72.44b 77.02b 11.69a 8.55ab
Sedimentation 24 67.84a 71.86a 76.52a 11.80a 8.69bc 48 68.03a 71.88a 76.30a 11.79a 8.27a 72 68.59b 72.47b 76.94b ll.6Ia 8.35ab
a T0 = Gelatinization onset temperature; Tp = Gelatinization peak temperature; Tc = Gelatinization conclusion temperature; AH = Enthalpy of gelatinization; R = Range of gelatinization temperature.
b Each value represents an average over the number of kernels (2, 5 and 10 kernels), because no significant effect of number of kernels on the DSC properties was observed. 'Values followed by the same letter in the same column are not significantly different (P < 0.05)

42
CHAPTER 3. THERMAL AND STRUCTURAL PROPERTIES OF UNUSUAL
STARCHES FROM DEVELOPMENTAL CORN LINES 1
A paper accepted by the Carbohydrate Polymers
Y. Ji2, K. Seetharaman2'3, K. Wong2, L. M. Pollak4, S. Duvick4, J. Jane2, and P. J. White *2
1 Journal Paper No. 19849 of the Iowa Agriculture and Home Economics Experiment
Station, Ames, IA, Project No. 3768, and supported by Hatch Act and State of Iowa funds. 2 Graduate student, postdoctoral research associate, research associate, professor, and
professor, respectively, 2312 Food Science Building, Department of Food Science and
Human Nutrition, Iowa State University, Ames, IA 50011, USA. 3 Currently, assistant professor, Department of Food Science, The Pennsylvania State
University, University Park, PA 16802, USA. 4 Research geneticist and support scientist, respectively, USDA-ARS, Corn Insects and Crop
Genetics Research Unit, Department of Agronomy, Iowa State University, Ames, IA 50011,
USA.
'Corresponding author. Email: [email protected]. Phone: (515)294-9688. FAX: (515)294-
8181.

43
Abstract
Starches from exotic corn lines were screened by using Differential Scanning
Calorimetry (DSC) to find thermal properties that were significantly different from those
exhibited by starches from normal Com Belt lines. Two independent gelatinization
transitions, one corresponding to the melting of a peak at ~ 66°C and the other to a peak
melting at ~ 69°C, were found in some starches. The melting characteristics were traced to
two separate types of granules within the endosperm. Strong correlations were found
between DSC properties and proportion of large granules with equivalent diameter > 17 |im.
Starches with a lower peak onset gelatinization temperature (T0c), had a lower normalized
concentration of chains with a degree of polymerization (dp) of 15 to 24 and/or a greater
normalized concentration of chains with a dp of 6 to 12. These studies will aid in
understanding structure-thermal property relationships of starches, and in identifying corn
lines of interest for commercial breeding.
Keywords: Maize starch; Corn starch; Starch structure; Starch function; Starch
thermal properties; Starch granules; Starch molecular weight; Starch branch chain length.

44
Introduction
Although corn starch is a valuable ingredient to the food industry, the cooking
characteristics of native, unmodified corn starches are undesirable for many applications. To
overcome these problems and expand the usefulness of starch, chemical modifications (such
as cross-linking and/or substitution) and physical modifications (such as pregelatinization)
often are made. With more restrictive food regulations and little hope for the introduction of
new modification processes, a greater potential for the manufacture of modified starches
with improved functionalities lies in the use of raw materials from previously
uncharacterized plant genotypes. This approach might be especially valuable to the food
industries because the corn and its starch could be used in the manufacture of "all natural"
foods.
As the domestic gene pool becomes more genetically homogeneous, exotic (non-
Corn Belt Dent) germplasm may be an excellent source for improving quality and, possibly,
improved agronomic performance, because much of the corn grown outside of the United
States is consumed directly by humans and has undergone centuries of selection for flavors,
aromas, and textures (Tracy, 1990). Exotic germplasm is usually considered to include
unadapted domestic populations and foreign temperate, tropical, and semitropical
populations. Geadelmann (1984) suggested that incorporation of exotic strains into adapted
germplasm would increase the available genetic variability and give rise to additional
heterotic vigor, lessening chances for a yield plateau. The introgression of adapted
germplasm with useful genes from exotic corn has successfully altered corn traits and
broadened the genetic base through the Germplasm Enhancement of Maize (GEM) project
(Pollak & Salhuana, 1999). The small amount of data that has been collected suggests the
presence of significant variability in the thermal properties of starch from these corn genetic
resources (White, Abbas, Pollak, & Johnson, 1990; Campbell, White, & Pollak, 1995).
The genetic background of corn can have substantial effects on the physical and
chemical properties of starch. This influence may be attributable to changes in granule-size
distribution (Katz, Furcsik, Tenbarge, Hauber, & Friedman, 1993; Campbell, Li, Berke, &
Glover, 1996), chemical structure (Lim, Kasemsuwan, & Jane, 1994), crystallinity (Stering,
1962), organization of the molecules within the granule (Shannon & Garwood, 1984), and/or
molecular structure of the starch polymers (Sanders, Thompson, & Boyer, 1990; Jane, Chen,

45
Lee, Mcpherson, Wong, Radosavljevic, & Kasemsuwan, 1999).
We previously identified six novel corn lines, of which two are exotic germplasm
lines, and four are derived from breeding crosses developed by crossing exotic genotypes
with Corn Belt lines. These lines have starches with significantly different (and potentially
useful) thermal properties from those found in starch from normal Corn Belt corn. The
objective of this study was to evaluate the thermal properties of novel corn lines regrown and
self-pollinated in 1998 and to establish the relationship between the fine structure and
physicochemical properties of the starch.
Materials and Methods
Corn Populations
Lines and their advanced progeny from six exotic by adapted breeding crosses from
the GEM project and two exotic Plant Introductions, plus public Corn Belt inbred lines B73
(Stiff Stalk heterotic pattern) and Mo 17 (non-Stiff Stalk heterotic pattern) as controls, were
studied (Table 1). The Sn designation defines the number of times the line has been self-
pollinated, starting with the breeding cross (the So population), in the development of the
line (Simmonds, 1974). For example, an S3 line has been self-pollinated three times after
starting in the So population. With each self-pollination the numbers of heterozygous genes
are reduced by half, thus increasing inbreeding, genetic purity, and repeatability of a trait
when it is replanted. The original exotic lines and populations used in this study are
maintained at the North Central Regional Plant Introduction Station in Ames, Iowa. The
breeding crosses were developed by crossing the exotic populations with inbreds of the Stiff
Stalk heterotic pattern. The Stiff Stalk inbreds belong to companies that cooperate in GEM
(Pollak et al., 1999). All S3 families for the exotic breeding crosses, Si families for the exotic
inbreds, and B73 and Mo 17 as controls were grown and self-pollinated in the same
environment near Ames, Iowa, in 1998, to reduce the effect of differences caused by
environment. Ears were harvested at full maturity and dried at 37.5°C until the moisture
content reached 12%. All seeds were stored at 4°C and 10% relative humidity until analyzed.
Single Kernel Starch Extraction
Starch was extracted from single kernels using the method described by White et al.
(1990), with modifications (Krieger, Duvick, Pollak, & White, 1997). For the initial

46
screening, at least 10 randomly selected kernels from up to 21 progeny lines from each of the
eight exotic families were individually evaluated for starch characteristics after extraction.
Thermal analysis by using Differential Scanning Calorimetry (DSC, described below) was
conducted on these starch samples. Based on the results of the initial screening, 32 progeny
lines from eight exotic families, plus one line each from Mo 17 and B73 as controls, were
selected for further characterization. After extraction, starch was stored at 4°C until
evaluated.
DSC
A Perkin-Elmer DSC-7 analyzer (Norwalk, CT), equipped with thermal analysis
software (Perkin-Elmer Corp., Norwalk, CT), was used to analyze starch thermal properties
following procedures of White et al. (1990). All experiments were run at a scanning rate of
10°C /min from 30°C to 110°C, and samples were prepared using a water-to-starch ratio of
2:1. The actual dry weight of starch used ranged from 3.96 to 4.02 mg. DSC parameters
recorded for this study included change in enthalpy (AH), peak onset (T0), peak (Tp), and
range of gelatinization (RG). A subscript g after the parameter denotes a gelatinization
property. The parameters T0, Tp, Tc (peak end), and AH were given directly by the DSC
software. The RG was calculated as Tc-T0, and peak height index (PHI) was calculated from
the change in enthalpy of gelatinization divided by half the range. All enthalpy calculations
were based on the dry-starch weight, and all analyses were conducted in duplicate and values
averaged. The same scanning method was used for rétrogradation of the gelatinized samples
kept at 4°C at 7 days. A subscript r after the DSC parameter denotes a rétrogradation
property.
Microscopy
AnalysesBirefringence of individual starch granules was evaluated with a polarized
microscope equipped with cross-polarizers at 40x magnification (Nikon, Japan). To prepare
the partly gelatinized starch sample, 33% water suspensions of a starch sample were sealed
in an aluminum DSC pan and heated to 66°C (the temperature between two gelatinization
peak maxima previously identified on the DSC thermograms of some starches) at a heating
rate of 10°C/min, and then cooled in an ice bath. The sealed DSC pan was opened with
tweezers, and the partly gelatinized starch was removed and applied to a glass microscope
slide with a drop of mineral oil added to enhance the vision. The presence of ungelatinized

47
starch granules was determined.
Granule-size distributions of native starches were obtained by following the
procedure described by Jane and Chen (1992). Native starch was suspended in 100%
ethanol to aid in spreading the particles into a monolayer, mounted on a glass microscope
slide, and viewed using a Zeiss axiophot microscope (Zeiss-Kontron, Thomwood, NY) at
50x magnification (20x by 2.5x optivar). Three slides from each sample were analyzed
separately, with 200 particles measured from one slide and 400 particles measured from each
of two additional slides, to give a total of 1000 starch granules analyzed per starch type. The
starch granules selected for the measurement were randomly chosen from each slide. For
each granule, area, perimeter, radial S.D., and major axis were determined. The radial S.D. is
a measure of the "roundness" of a particle. A perfect circle would have a radial S.D.
measurement of 0. The less round the particle, the bigger its radial S.D. number. The
equivalent diameter was assessed by: equivalent diameter = sqrt(4*area/7t).
Molecular Size of Amylose
A starch components profile, indicating the molecular size of amylose, was
determined by gel-permeation chromatography on a sepharose CL-2B column (Chen & Jane,
1992). Distribution coefficients, K„. of amylose were used for comparison between samples.
The peak retention volume of amylopectin was used as the void volume, K0 = 0, and the
peak retention volume of glucose was used as the total permeation volume, KQ = 1. The
results are the average of three replicate analyses of each starch type.
X-ray Diffraction
The X-ray diffraction patterns of starches were obtained with copper-nickel foil-
filtered, Ka radiation by using a difiractometer (D-500, Siemens, Madison, Wl) following
the procedure described by Jane et al. (1999). The difiractometer was operated at 27mA and
50 kV. The scanning region of the diffraction angle (20) was from 4° to 40° at 0.05°
increments with a count time of 2 s.
Branch-Chain-Length Distribution of Whole Starch
Branch-chain-length distribution of starch was determined following the procedure
described by Jane and Chen (1992). Starch extracted as previously described for single-
kernel extracting was debranched by using isoamylase, and the branch-chain-length
distributions were analyzed by using a high-performance anion-exchange chromatography

48
system equipped with an enzyme column reactor and a pulsed amperometric detector
(Dionex, Sunnyvale, CA) (HPAEC-ENZ-PAD) by using the method reported by Wong and
Jane (1997). The results reported are an average of at least two replicates for each sample.
Statistical Analysis
Granule size and shape distribution of starches were analyzed by using software
entitled S-plus 6 (Insightful Corporation, Seattle, WA). Between-sample variations of
granule size and shape parameters, which included mean area, equivalent diameter,
perimeter, radial S.D., and major axis, were assessed by using the mixed effects Analysis of
Variance (ANOVA) model for nested design (i.e., three plates were nested within a starch
sample) with unbalanced replicates. The Tukey multiple comparison test was used to
calculate differences in means of these parameters among starch samples. Relationships
between starch DSC properties and granule size and shape distribution were analyzed by
using the Pearson correlation test in the SAS system (release 8.2, SAS Institute, Cary, NC).
The coefficients (Ko) of amylose were analyzed by using the general linear model (GLM)
procedure on the SAS system. Multiple comparison procedures of the Tukey test were used
to calculate the differences among starch samples. The family-wise confidence level used for
calculating the differences among starch samples was 95% (i.e., a = 5%).
Results and Discussion
DSC
Starch from 77 progeny S„+i lines of the eight exotic breeding crosses and exotic
inbred Sn families (1 to 21 S„+i lines per Sn family) and two Com Belt inbred lines used as
controls (Mo 17 and B73) were screened by using DSC to identify unusual thermal
properties. A starch was considered to have different and useful thermal properties based on
criteria given by Seetharaman et al. (2001). Each of eight exotic S„ families (Table 1) had at
least one progeny S„+i line whose kernels contained starch exhibiting one or more useful
DSC properties. For example, 9 out of 16 progeny lines of the family Chis-37 that we
analyzed contained at least one kernel having starch with a specific useful DSC property.
The frequency of kernels within each Sn+i line with starch exhibiting a specific DSC
property varied from 1/10 to 36/37 (data not shown). Progeny lines from Chis-37, Cuba-23,
Cuba-34, Cuba-38, and PI-83 had a high frequency of kernels (7/10 to 36/37) with both low

49
Tog (56.6 to 61.6°C) and wide RG (13.6 to 17.8°C). Among them, 7 of 10 kernels of one
progeny line from Chis-37 and 8 of 10 kernels of one progeny line from Cuba-38 also
contained starches with low Tpo (66.1 to 66.2°C). All selected starches (except one progeny
line from Cuba-23) had a relatively lower AHG (9.2 to 11.9 J/g) than did Mo 17 (12.4 J/g).
None of the starches exhibited unusual rétrogradation properties.
Some starches from exotic lines also exhibited gelatinization thermogram shapes
with shoulders or double peaks (Fig. I), suggesting either two different independent
cooperative transitions, or one time-dependent two-stage process during gelatinization of
starches. To distinguish between these possibilities, a two-stage heating experiment was
used. The DSC gelatinization curve for starch from one kernel of Cuba-23-1-12 is shown in
Fig. 2a, demonstrating the double peak with a large shoulder at the lower temperature.
During the experiment, another sample of the starch suspension was heated to 66°C. just
beyond the peak temperature of the first peak (Fig. 2b), cooled, and then reheated beyond the
gelatinization temperature of the second peak (Fig. 2c). During the second complete heating
(Fig. 2c), only a small single peak was found. The position of the peak in Fig. 2c was similar
to that of the second peak of the original gelatinization curve (Fig. 2a). This finding clearly
indicated that the original curve of gelatinization represents two independent transitions, one
corresponding to the melting of the lower temperature peak (TP~66°C) and the other to a
higher temperature peak (TP~69°C). Different ratios of the two transitions may cause the
different shapes of gelatinization peaks shown in Fig. 1.
Two transitions for these starches still existed when the DSC was performed in
excess water. No significant differences in gelatinization parameters were observed when the
starch:water ratio was increased from 1:2 to 1:4 for two different starches with different
curve shapes, Cuba-23-1-12 and PI-83-9-5 (Fig. 3a and b). This observation excluded the
possibility that these two transitions were caused by inadequate water content in the DSC
run (Donovan, & Mapes, 1979). Possibly, these two transitions might correspond to two
different starch structures. Furthermore, all starches exhibited a typical A-type diffraction
pattern, indicating the starch molecules were packed in a similar fashion within the granule
(data not shown).
Based on these initial data, 13 kernels derived from seven exotic corn lines (the
eighth exotic line, DK-8, was not further evaluated) were selected for further structural

50
studies of their starch. The exact DSC properties for starch extracted from the specific
kernels studied are summarized in Table 2. The data are the average of duplicate DSC
analyses of the same starch.
Polarized Microscopy Study
The two independent transitions noted during gelatinization of some of the unusual
starches were further studied by observing granular birefringence with polarized microscopy
(Figs. 4a and b). After being heated beyond the temperature of the first transition (66°C) and
below the temperature of the second transition (69°C), some granules were completely
gelatinized, whereas others still showed the intact "Maltese Cross" indicating crystalline
structure (Fig. 4b). It can be concluded that these two transitions were located in different
granules, which differentiates them from those reported in C-type granules characteristic of
pea starch (Bogracheva, Morris, Ring, & Hedley, 1998). The two independent gelatinization
transitions in C-type starch granules are caused by the coexistence of A and B polymorphs
within the same granule. The B polymorphs are arranged centrally with the A polymorphs
located peripherally within the granules. During heating in excess salt solution the
polymorphs in the two regions melt independently, giving a double peak in heat capacity; the
B polymorphs melting at a lower temperature than the A polymorphs.
X-ray Diffraction Pattern of Starch
All starches exhibited a typical A-type diffraction pattern, indicating the starch
molecules were packed in a similar fashion within the granule. These data are not shown.
Granule-size Distribution
Significant differences were observed in the mean granule-size parameters among the
selected starches (Table 3). Granules of starch from Cuba-34-1-2 had the smallest mean area,
equivalent diameter, and major axis, whereas granules of starch from B73 had the greatest
values for the same parameters. The mean granule-shape parameters also showed significant
differences. Granules from B73 tended to deviate least from a spherical shape (radial S.D. =
7.4), whereas granules from PI-83-9-11 tended to deviate most from spherical shape (radial
S.D. = 11.6).
Starch granules were divided into five groups according to their equivalent
diameters: < 5 p.m, > 5 and < 9 |im, 9 and < 13 pm, >13 and < 17 p.m, and > 17 |im, and
reported as a percentage of the total number of granules measured (Table 4). Significant

51
differences were observed in the percentage distribution profiles of some of these selected
starches. In general, Chis-37-5-3 had the lowest proportion of granules lower than 5 gm in
size (2.3%), whereas Cuba-38-5-5 had the greatest proportion of granules lower than 5 |im hi
size (13.1%). Cuba-38-5-5 tended to have the lowest proportion of large granules (0.1% of
granules >17 jim), and B73 had the highest proportion of large granules (12.5% of granules
> 17 nm). Generally, the granule size and shape distributions of all exotic lines studied were
different from both B73 and Mo 17 starches.
Even though Mo 17 and B73 starches had similar DSC properties, granules from
these two lines were different in size and shape distributions: granules from B73 were larger
and more spherical than granules from Mo 17. In addition, B73 starch had a lower percentage
distribution of small granules (< 5 p.m) and greater percentage distribution of larger granules
(>17 |im) than did Mo 17. No significant differences were observed in percentage
distribution of granules within the ranges of 5 to 9 pm, 9 to 13 |im, and 13 to 17 |im.
Relationships between starch DSC properties and granule size and shape
distributions were analyzed by using the Pearson correlation test (Table 5). The DSC
parameters of T0o, AHg and PHI were positively correlated with percentage of granules
having an equivalent diameter of > 17 pm (r = 0.73, 0.64, and 0.76, respectively), whereas
RG was negatively correlated with percentage of granules having an equivalent diameter of
> 17 jam (r = -0.66). Previous studies have noted a negative correlation between T0c and
granule size distribution (Campbell et al., 1996). It is likely that the T0c is influenced by
many factors, including that of granule size. For example, small crystals (granules) are more
thermodynamically unstable than are large ones (Atkins, 1998), because of the larger surface
area, given that both have the same internal structure. Internal structural differences in starch
granules also cause size variations in the granule, thus influencing the ultimate granule size.
Thus, if only granule size is related to T0G, it might appear that a correlation exists, whereas
the correlation is actually a secondary effect of internal structural composition. Another
example of differences in composition of large and small granules is the lipid content, which
tends to be greater in smaller granules (Banks, Greenwood, & Muir, 1973). No strong
correlation was found between DSC properties and mean areas of starch granules.

52
Molecular Size of Amylose
The Sepharose CL-2B gel permeation chromatograms showed no significant
differences in the molecular sizes of amylose among the starches analyzed. The average
distribution coefficients (Ko ) of amylose for all starches ranged from 0.733 to 0.750 (data
not shown).
Branch-Chain-Length Distribution of Amylopectin
Normalized branch-chain-length distributions of the selected starches and of Mo 17
and B73 starches were measured by HPAEC-ENZ-PAD (Fig. 5 a-c, Table 6). In Fig. 5 a-c,
three starch types representing slightly different patterns of peak concentrations compared
with the control starches are presented. The results are expressed as means ± standard
deviation of a minimum of duplicate analyses, and the height of each bar at each degree of
polymerization (dp) represents its relative concentration to peak I at dp 13 or 14. All
starches showed a bimodal distribution with the first peak at dp 13 to 14 and the second peak
at dp 42 to 46. Chains with dp ~13 to 14 were most frequent in the distribution, explaining
why all starches displayed an A-type diffraction pattern (Jane et al., 1999). In general, A-type
starches contain branches with shorter chain lengths (first peak at dp 12 to 14, second peak at
dp 41 to 51) than do B-type starches (first peak at dp 14 to 16, second peak at dp 48 to 53).
All exotic starches had either lower normalized concentrations of long branch-chain at dp 15
to 24 or higher normalized concentration of short branch-chain at dp 6 to 12 (or both these
characteristics) than did Mo 17 and B73 (Fig. 5 a-c). To classify the starches, the chains were
recorded as belonging to one of four fractions: dp 6 to 12, 13 to 24, 25 to 36, or > 37,
corresponding to A, BI, B2, and B3 or longer chains, respectively, based on Hizukuri's
model (1986). All exotic starches had relatively lower average chain lengths (dp 23.2 to
24.8) than did Mo 17 and B73 starches (dp 25), and contained a higher proportion of A chains
at dp 6 to 12 (16.40-18.01%) than did Mol7 (15.64%) and B73 (16.34%) starches (Table 6).
Cuba-23-1-12 starch had the shortest average chain length (dp 23.2) and the highest
proportion of A chains (dp 6 to 12) and B1 chains (dp 13 to 24) among all the starches.
Relationship Between Gelatinization Behavior and Granular Structure
Gelatinization properties are influenced by the crystalline structure of the starch
granule. Results suggest that exotic starches with a shoulder peak or double gelatinization
peaks are composed of two different kinds of granules. Even though the starch molecules

53
were packed in an A-type crystalline structure, the granules that gelatinized at a lower
temperature may have fewer stable crystallites than those granules that gelatinized at a
higher temperature.
Amylopectin is the main component responsible for the crystallinity of starch.
Therefore, exotic starches with low T„G, wide RG, and unsymmetrical gelatinization peaks
may have different amylopectin structures than do normal starches. This theory is supported
by the fact that amylopectin from exotic starches had different amylopectin branch-chain-
length distribution patterns than did normal starch (Fig. 5 a-c and Table 6). According to
Hizukuri's model (1986), A-chains and B1 chains (those chains that make up the first peak in
the distribution profiles of Fig. 5a-c) are primary participants in the crystalline regions. All
starches studied contained a greater proportion of A chains with dp 6 to 12 and fewer B1
chains with dp 15 to 24 than did starch from Mo 17 and B-73. Also, relative intensities of the
shoulder at dp 15 to 24 to peak I in unusual starches were lower than those in Mo 17 and
B73, which implies that fewer chains in the exotic starches would be long enough to go
through the crystalline region, thus resulting in defects in the crystallites. That is to say,
crystalline regions in the starches were not as tightly packed as in Mo 17 and B73 starch.
This observation is corroborated by the DSC data that show lower than normal gelatinization
onset temperatures (T0c < 63°C) for all exotic starches of interest (Table 2).
Conclusions
Exotic corn germplasm is a valuable source for producing starches with useful
unique characteristics. The starches from the corn lines identified in this study are of interest
because of unusually low T0G and wide RG. Two independent gelatinization transitions, one
corresponding to the melting of a peak at a lower temperature — 66 °C and the other to a peak
melting at a higher temperature ~ 69 °C, located in different granules were found in some
starches. All starches exhibited a typical A-type X-ray diffraction pattern. Significant
differences were observed in starch-granule size-distributions and shape-distributions of the
selected starches. No strong correlation was found between DSC properties with mean areas
of starch granules. However, strong correlations were found between DSC properties and
proportion of large granules with equivalent diameter > 17jim. No significant differences
were observed in the starch component profiles, as measured by gel-permeation

54
chromatography. The low T0o is consistent with the branch chain-length pattern of the
amylopectin reported here. Starches with a lower T0G had a lower normalized concentration
of chains with a degree of polymerization (dp) of 15-24 and/or a greater normalized
concentration of chains with a dp of 6-12. Overall starches with a low T0o had a higher
relative concentration of branch chains below dp 13 than did normal starch. Work is in
progress to genetically "fix" the unusual thermal properties in each line of corn so that
succeeding generations exhibit the property, and to better understand the structure-function
relationships in these starches.
Acknowledgement
The authors thank the NRI Competitive Grants program/US DA, award number
98355036371, and the Iowa Corn Promotion Board for funding the research.
Literature Cited
Atkins, P. W. (1998). Chapter 6: Physical transformations of pure substances. In: P.W.
Atkins, Physical Chemistry, New York: Freeman, pp 154.
Banks, W., Greenwood, C. T., & Muir, D. D. (1973). Studies on the biosynthesis of starch
granules. 6. Properties of the starch granules of normal barley, and barley with starch
of high amylose-content, during growth. Starke, 25, 225-230
Bogracheva, T. Y., Morris, V. J., Ring, S. G., & Hedley, C. L. (1998). The granular structure
of C-type pea starch and its role in gelatinization. Biopolymers, 45, 323-332.
Campbell, M. R., Li., J., Berke, J. T., & Glover, D. V. (1996). Variation in starch granule size
in tropical maize germplasm. Cereal Chem., 73, 536-538.
Campbell, M. R., White, P., & Pollak, L. (1995). Properties of sugary-2 maize starch:
Influence of exotic background. Cereal Chem., 72, 389.
Geadelmann, J. L. (1984). Using exotic germplasm to improve Northern corn. Ann. Corn
Sorgh. Ind. Res. Conf. Proc., 39,98-110.
Hanashiro, L, Abe, J., & Hizukuri, S. (1996). A periodic distribution of chain length of
amylopectin as revealed by high-performance anion-exchange chromatography.
Carbohydr. Res., 283, 151-159.
Hizukuri, S. (1986). Polymodal distribution of the chain lengths of amylopectin, and its

55
significance. Carbohydr. Res., 147, 342-347.
Jane, J., & Chen, J. (1992). Effects of amylose molecular size and amylopectin branch
chain length on paste properties of starch. Cereal Chem., 69, 60-65.
Jane, J., Chen, Y. Y, Lee, L. F., Mcpherson, A. E., Wong, K. S., Radosavljevic, M., &
Kasemsuwan, T. (1999). Effects of amylopectin branch chain length and amylase
content on the gelatinization and pasting properties of starch. Cereal Chem., 76,629-
637.
Katz, F. R., Furcsik, S. L., Tenbarge, F. L., Hauber, R. J., & Friedman, R. B. (1993).
Behavior of starches derived from varieties of maize containing different genetic
mutations: Effects of starch genotype on granular morphology. Carbohydr.
Polymers, 21, 133-136.
Krieger. K. M., Duvick. S. A., Pollak, L. M.. & White, P. J. (1997). Thermal properties of
corn starch extracted with different blending methods: Microblender and
homogenizer. Cereal Chem., 74, 553-555.
Lim, S., Kasemsuwan, T., & Jane, J. -L. (1994). Characterization of phosphorus in starch by 3lP-nuclear magnetic resonance spectroscopy. Cereal Chem., 71,488-496.
Lu, T.-J., Jane, J.-L., Keeling, P. L., & Singletary, G. W. (1996). Maize starch fine structures
affected by ear developmental temperature, Carbohydr. Res., 282, 157-170.
Pollak, L., & Salhuana, W. (1999). Lines for improved yield and value-added traits-Results
from GEM. Ann. Corn Sorgh. Ind. Res. Con/., 53, 143-158.
Pollak, L. M., & White, P. J. (1997). Thermal starch properties in Corn Belt and exotic corn
inbred lines and their crosses. Cereal Chem., 74,412-416.
Sanders, E. B., Thompson, D. B., & Boyer, C. D. (1990). Thermal behavior during
gelatinization and amylopectin fine structure for selected maize genotypes as
expressed in four inbred lines. Cereal Chem., 67, 594-602.
Seetharaman, K., Tziotis, A., Borras, F., White, P. J., Ferrer, M., & Robutti, J. (2001).
Thermal and functional characterization of starch from argentinean corn. Cereal
Chem., 78, 379-386.
Shannon, J. C., & Garwood, D. L. (1984). Genetics and physiology of starch development.
In: R. L. Whistler, J. N. Bemiller, & E. F. Paschall, Starch: Chemistry and
Technology, 2nd ed. Orlando, FL:Academic Press, pp. 25-86.

56
Simmonds, N.W. (1974). Chapter 5: Breeding plan. In: Simmonds, N.W, Principles of crop
improvement. London: Longman Group Limited, pp. 128-134.
Stering, C. (1962). Alow angle spacing in starch. J. Polym. Sci., 56, S10.
Tracy, W. F. (1990). Potential contributions of five exotic maize populations to sweet corn
improvement. Crop Sci., 30,918-923.
White, P. J., Abbas, L, Pollak, L., & Johnson, L. (1990). Intra- and interpopulation
variability of thermal properties of maize starch. Cereal Chem., 67, 70-73.
Wong, K. S., & Jane, J. (1997). Quantitative analysis of debranched amylopectin by
HPAEC-PAD with a post-column enzyme reactor. J. Liq. Chrom.. 20, 297-310.

Table 1 Exotic Breeding Crosses and Exotic Inbred Corn Lines and Their Origins.
Exotic Parent* Pedigree for S„ Lines" Source Number oiSnt,a Number of Unusual S„+, Origin of Exotic Identification* Lines Analyzed Lines' Parent
Exotic Breeding Crosses PI 576258 CHIS775:SI9I lb-37-1-2 Chis-37 16 9 Mexico PI 489361 CUBAI64:S2008a-23-l Cuba-23 1 1 Cuba PI 489361 CUBA164:S151 lb-34-1-3 Cuba-34 8 2 Cuba PI 489361 CUBA 164:8151 lb-38-l-3 Cuba-38 8 2 Cuba
Ames 23670 DK212T:S0610-8-1-3 DK-8 5 3 Thailand Ames 23670 DK212T;S0610-10-1-3 DK-10 21 3 Thailand
Exotic Inbreds PI 186182 PI 186182 PI-82 8 4 Uruguay PII 86183 PI 186183 PI-83 10 8 Uruguay
b Regrown com ears, maintained as lines to preserve a specific starch characteristic, n = 3 for exotic breeding crosses except Cuba-23 for which n = 2, n = I for exotic inbreds. c Abbreviated source identification for use within this paper, representing the S„ lines. d Snt| line means first generation of corn after self-pollination of S„ lines. c Number of Snt, lines having at least one kernel containing starch with unusual thermal properties according to criteria given by Seetharaman et al. (2001).

Table 2 Differential Scanning Caiorimetry (DSC) Data of Starches from Single Kernels of Selected Corn Lines Used in Structural Analysis.
DSC Parameter Source of Starch (Sn+, line'-Kernel) T0c " (°C) Tpc(°C) AHc(J/g) RG(°C) PHI AH„(J/g) R% Shape of DSC
Gelatinization Curve' Mol7 66,2 70.8 12.6 9.2 2.7 5.6 44.5 Curve Shape 1 B73 67.2 71.1 11.6 7.6 3.1 6.0 51.6 Curve Shape 1
Chis-37-5-3 60.3 66.5 10.5 14.0 1.5 5.7 54.5 Curve Shape 2 Chis-37-11-1 62,1 70.6 9.3 13.5 1.4 3.6 38.6 Curve Shape 3 Cuba-23-1-12 58.4 70.1 10.3 18.3 I.I 4.7 45.8 Curve Shape 4 Cuba-34-1-2 60.9 70.4 11.7 16.0 1.5 4.5 38.0 Curve Shape 5 Cuba-38-5-5 57.9 66.1 9.1 16.3 I.I 4.9 54.6 Curve Shape 6 DK-IO-1-2 63.2 71.6 11.3 13.7 1.6 6.3 56.3 Curve Shape 3 PI-82-l-l 60.4 69.4 10.5 15.1 1.4 6.3 59.9 Curve Shape 3 PI-83-2-2 59.6 69.9 10.8 16.1 1.3 5.6 51.4 Curve Shape 3 Pl-83-2-5 60.4 69.1 10.5 16.0 1.3 5.4 51.6 Curve Shape 2
PI-83-2-10 60.5 67.6 10.4 15.3 1.4 5.5 52.6 Curve Shape 2 PI-83-9-5 60.6 70.3 9.6 15.8 1.2 4,9 51.3 Curve Shape 7 PI-83-9-8 59.4 71.2 9.3 16.5 I.I 4.6 49.9 Curve Shape 3 PI-83-9-11 58.9 70.7 11.0 17.2 1.3 5.9 53.2 Curve Shape 3
" See Table I for an explanation of Sn( ( line. For example, Chis-37-5 designates the S,„, line. The -3 designates the kernel number. b Too = Gelatinization onset temperature; Tpc = Gelatinization peak temperature; Ro = Range of gelatinization temperature; AHC = Enthalpy of gelatinization; AHR = Enthalpy of rétrogradation; PHI = Peak height index (enthalpy of gelatinization divided by half the range); R = Rétrogradation, Bold numbers indicate values of interest. c See Fig, I for definition of curve shapes.

Table 3 Mean Granule Size and Shape Parameters of Starches from Single Kernels of Selected Corn Lines Used in Structural Analyses.
Source of Starch (S„+, line'-Kernel)
Mean Area (Hm1)
Mean Diameter (Mm)
Mean Perimeter (H"i)
Mean Radial S.D. (nm)
Mean Major Axis (M«n)
Mol7 88.9b-d" 9,8bc-e 41,1b 8.8bc 10.8b B73 118,8g 11,5g 47,6b 7.4a 12.6c
Chis-37-5-3 9l.3b-d I0,4de 43,4c 7.9a 11.3d Chis-37-11-l 83.1b 9.8b 40.6b 8.3ab 10.6b Cuba-23-1-12 110,2fg II,3g 47.6b 8.0a I2.3e Cuba-34-1-2 62,4a 8.4a 35.3a 8,2ab 9.1a Cuba-38-5-5 111,9fg 11.4g 48.3d 9.4cd I2.6e DK-I0-I-2 86.3b-d 10.lbc-e 42.7bc 9,5dc 11.1 bed Pl-82-l-l 108.6% II.2g 47.6d 9,6de I2,4e PI-83-2-2 84.8bc 9,8b-d 42,1 be I0,5f 11,6b-d PI-83-2-5 106, lef H.Ofg 47. Id I0.5f 12,3e Pl-83-2-10 94,4cd I0,4de 44,2c lO.ld-f 11.6d PI-83-9-5 82,5 9.8b 41.8b 11.Ig ll.lb-d PI-83-9-8 98,0de I0.7ef 34,8a 10.2ef I2.3e
Pl-83-9-11 82,9b 9.6b 41,9bc li.4g 10,9bc " See Table I for an explanation of Snt) lines. b Values followed by the same letter in the same column are not significantly different (P < 0.05).

60
Table 4
Distribution Profiles of Starch from Selected Corn Lines Used in Structural Analyses.
Source of Starch (S„+i line'-Kernel)
Distribution Profiles (%)D Source of Starch (S„+i line'-Kernel) < 5(nm) 5-9(nm) 9-13(nm) 13-17(nm) > 17 (nm)
Mo 17 12.0c' 35.2ab 29.0a I8.3b-d 5.5bc B73 2.7a 30.3ab 33.3ab 21.2b-e 12.5d
Chis-3 7-5-3 2.3a 30.8ab 48.1 de I7.8b-d l.Oab Chis-37-11-1 7.4a-c 35.4ab 39.1a-e I6.4a-d 1.7a-c Cuba-23-1-12 3.3ab 30.7ab 50.6e 15.0a-c 0.4a-c Cuba-34-1 -2 4. lab 27.2a 39.0ae 22.8c-e 6.9a Cuba-38-5-5 13.1c 45.5b 34.7a-c 6.6a 0.1a-c DK-10-1-2 4.2ab 22.2a 38.1a-e 31.le 4.4a PI-82-l-l 3.2ab 21.8a 44.0b-e 26.0de 5b PI-83-2-2 6.6a-c 34.9ab 40.2a-e 16.la-d 2.2a-c PI-83-2-5 3.6ab 27.8a 37.8a-d 23.8c-e 7.0c Pl-83-2-10 7.0a-c 32.8ab 40.2a-e I6.7b-d 3.3a-c PI-83-9-5 4.4ab 37.0ab 46.0c-e 11.4ab 1.2a-c Pl-83-9-8 2.Sab 26.6a 47.2c-e 21.3b-e 2.1a-c PI-83-9-11 9.3bc 30.7ab 39.1a-e 18.1b-d 2.8a-c
1 See Table I for an explanation of S„^, lines. b Starch granules are divided into different groups according to equivalent diameters.
Values followed by the same letter in the same column are not significantly different (P < 0.05).

Table 5 Pearson Correlation Coefficients (r) of Differential Scanning Caiorimetry (DSC) Properties with Granule Size and Shape Distribution
DSC Properties Mean Area (fim2 )
Mean Radial S.D. Distribution Profiles (%)' DSC Properties Mean Area (fim2 ) (urn) < 5pm 5-9(pm) 9-l3(nm) 13-17(nm) >17(fim)
T„r.6(°C) 0.04 -0,44*c -0.02 -0.15 -0.62** 0.37 0.73** TpG (°C) -0,27 0.05 -0.22 -0.45* -0,11 0.50* 0,38 AHc(J/g) -0,22 -0.26 0.03 -0.34 -0.51* 0.48* 0.64** RG(°C) -0.17 0.50* -0.07 0,00 0.63** -0,21 -0.66**
PHI 0,18 -0,50* 0.06 -0.05 -0.65** 0.24 0,76** AH„(J/g) 0.27 0.18 -0.10 -0.40 -0,20 0.46* 0.38
R% 0.49* 0.40 -0.11 -0.19 0.13 0.15 -0.05 " Starch granules are divided into different groups according to equivalent diameter. b See Table 2 for DSC parameter descriptions, ' * , * * : w h e r e p - v a l u e s f o r t e s t H o ( p = 0 ) v s . H a ( p * • 0 ) a r e s m a l l e r t h a n 0 , 1 0 a n d 0 , 0 5 , r e s p e c t i v e l y .
as

62
Table 6 Relative Branch-Chain-Length (CL) Distributions of Whole Starch from Single Kernels of Selected Corn Lines
Source of Starch (S„+| line'-Kernel) •
Peak dp" Average % Distribution' Source of Starch (S„+| line'-Kernel) • I II CL dp
6-12 dp
13-24 dp
25-36 dp
>37 Mo 17 14 45 25.0 15.64 47.21 15.79 21.36 B73 14 47 25.0 16.34 45.94 16.03 21.09
Chis-37-5-3 14 46 24.5 17.57 46.90 14.35 21.17 Chis-37-! l - l 14 45 23.8 17.88 48.66 14.04 19.41 Cuba-23-1-12 13 44 23.2 18.01 50.33 14.02 17.63 Cuba-34-1-2 13 46 23.7 17.81 47.92 16.13 18.15 Cuba-38-5-5 13 45 24.3 17.08 46.12 16.83 19.97 DK-lO-l-2 14 44 24.4 16.98 48.41 13.67 20.91 PI-82-1-1 14 46 24.5 16.73 47.78 14.89 20.61 PI-83-2-2 14 46 24.4 17.10 47.85 14.90 20.16 PI-83-2-5 14 43 24.5 16.69 47.12 15.80 20.39 PI-83-2-10 14 46 24.3 16.65 47.83 15.95 19.56 Pl-83-9-5 14 45 24.8 16.40 47.65 14.28 21.67 Pl-83-9-8 14 45 24.4 16.72 46.70 20.49 24.42 Pi-83-9-11 14 45 23.9 17.68 48.45 14.73 19.14
a See Table 1 for ail explanation of S„-M lines. b dp = degree of polymerization ' Grouping of dp numbers followed that of Hanashiro, Abe, & Hizukuri. (1996).

63
•
Curve Shape 7 \
Curve Shape 6
Curve Shape 5
Curve Shape 4
Curve-Shape^L
Curve Shape 1
Temperature ( C) Fig. 1. Typical Differential Scanning Caiorimetry gelatinization thermograms of starches listed in Table 3, illustrating the different curve shapes.

64
40 50 60 70 80 90 100
Temperalure(°C)
Fig. 2. Differential Scanning Caiorimetry gelatinization thermograms of Cuba-23-1-12 starch, a, Sample was heated from 30°C to 110°C. b. Starch was heated from 30°C to 66°C (just after the temperature of the first peak), c, Starch from b was cooled to 30°C and then heated to 110°C.

65
:h:water = 1:4
starch :watet- 'H2
40 50 60 70 80 90 100
Temperature (°C) Fig 3a.
starch.water = 1:4
starch:water = 1:2
1 1 i 1 1 1 40 50 60 70 80 90 100
Temperature (°C)
Fig. 3b Fig. 3. The effects of water content on Differential Scanning Caiorimetry parameters and curve shapes of starches from (3a) Cuba-23-1-12 and (3b) PI-83-9-5.

66
Fig. 4a
• • • Fig. 4b
Fig. 4. Polarized-light micrographs of starch from Cuba-23-1-12. a, native starch granules, b, starch granules after heating to 66°C, just after reaching the temperature of the first peak shown in Fig. 2a.

67
1.2
g 0.8 4
"g 0.6
t« 0.2 4
0 W
1.2
s g 0.8 4 e
•g 0.6 N
<8
0.4 -
0.2 -
0 III
Mo17
D Chis-37- 5-3
6 12 18 24 30 36 42 48 Degree of Polymerization
Fig 5a
llHfifiitiiiiii 54 60 66
Mo17
• PI-83- 2-5
tllnimiiii,
6 12 18 24 30 36 42 48 54
Degree of Polymerization Fig 5b
60 66

68
1.2
• Mo17 • PI-83-9-11
<5 0.8
6 12 18 24 30 36 42 48 54 60 66
Degree of Polymerization Fig 5 c
Fig. 5 a-c. Normalized branch-chain-length distributions of selected exotic starches compared with Mo 17 starch determined by using a high-performance anion-exchange chromatography system equipped with an enzyme column reactor and a pulsed amperometric detector. A Carbopac PA 100 column composed of immobilized amyloglucosidase was used for the analysis.

69
CHAPTER 5. STRUCTURE AND FUNCTION OF STARCH FROM ADVANCED
GENERATION OF NEW CORN LINES1
A paper to be submitted to the Carbohydrate Polymers
Y. Ji2, K. Wong2, J. Hasjim \ L. M. Pollak4, S. Duvick4, J. Jane2, and P. J. White *'2
1 Journal Paper No. of the Iowa Agriculture and Home Economics Experiment Station,
Ames, I A, Project No. 3768, and supported by Hatch Act and State of Iowa funds. 2 Graduate student, research associate, professor, and professor, respectively, 2312 Food
Science Building, Department of Food Science and Human Nutrition, Iowa State University,
Ames, IA 50011, USA.
3 Undergraduate student, Department of Chemistry, Iowa State University, Ames, IA 50011,
USA
4 Research geneticist and biologist, respectively, USDA-ARS, Corn Insects and Crop
Genetics Research Unit, Department of Agronomy, Iowa State University, Ames, IA 50011,
USA.
"Corresponding author. Email: pjwhite<'g)iastate.edu. Phone: (515)294-9688. FAX: (515)294-
8181.

70
Abstract
The objectives of this research were to evaluate functions and structures of starches
from exotic x adapted inbred lines and exotic lines, to confirm the advancement of functional
traits into the next generation of core, and to establish relationships between the fine
structure and functional properties of the starches. Several lines were characterized from the
forth and fifth successive generations of exotic crosses and from the third generation of
exotic inbreds containing kernels with unusual and potentially useful, thermal properties as
measured by a differential scanning calorimetry (DSC, gelatinization onset temperature <
60°C or range of gelatinization temperature > 14°C). The frequency of these traits increased
with succeeding generations, when selection of the plants was based on the desired trait.
Significant differences were observed in starch-granule size distributions and shape
distributions of the selected starches. Measurements with high-performance anion-exchange
chromatography (HPAEC) revealed that all selected unusual starches had a lower normalized
concentration of chains with a degree of polymerization (dp) of 15 to 24 and/or a greater
normalized concentration of chains with a dp of 6 to 12. Overall, chains with a low T0c had a
greater relative concentration of branch chains shorter than dp 13 than did normal starch.
Strong correlations were found between DSC and RVA properties and the granular structure
(granular size distribution and branch-chain-length distribution of amylopectin).
Keywords'. Maize starch; Corn starch; Starch structure; Starch function; Starch
thermal properties; Starch granules; Weight-average molecular weight; Starch branch chain
length.

71
Introduction
Corn is extremely important to the U.S. economy because of the amount produced,
and its value for domestic and export use. Less than one percent of the U.S. germplasm base,
however, consists of exotic germplasm (Goodman, 1985) leading to concerns about the
genetic vulnerability of com. The Latin American Maize Project (LAMP) was the first
coordinated international effort to deal with the evaluation of the genetic resources of a
major world crop (Salhuana, Pollak, Ferrer, Paratori, & Vivo, 1998). The project, involving
the cooperative efforts of 12 countries in evaluating their native germplasm accessions,
identified accessions (native and foreign) with good yield potential that could be
incorporated into breeding programs. The next step in this overall program, entitled the
Germplasm Enhancement of Maize (GEM) project, was to provide the corn industry with
materials developed from LAMP by germplasm enhancement. The ultimate objective was to
improve and broaden the germplasm base of com hybrids grown by American farmers.
Traits targeted for improvement are agronomic productivity, disease and insect resistance,
and value-added characteristics (Pollak & Salhuana, 1999).
Starch represents nearly 70% of the dry weight of the mature com kernels and is the
most economically important component. Therefore, it was essential to understand the starch
characteristics of the GEM materials. From previous research, we targeted several com lines
containing starches with thermal properties of potential use to the food industry, and that
were significantly different from those of normal com starches. In addition to providing new
com lines with value-added properties, the starches from the com provide an excellent
vehicle to study structure-function relationships. The starches from the targeted com lines
showed unusually low gelatinization onset temperature (T0G, Ji et al, 2002). In some
starches, two independent gelatinization transitions were found, one corresponding to the
melting of a peak at a lower temperature ~ 66 °C and the other to a peak melting at a higher
temperature ~ 69 °C. The two peaks represented two different populations of granules, which
gelatinized at different temperatures. All starches exhibited a typical A-type X-ray diffraction
pattern. The low T0o was consistent with the branch chain-length pattern of the amylopectin.
For example, starches with a lower Tqg> had a lower normalized concentration of chains with
a degree of polymerization (dp) of 15 to 24 and/or a greater normalized concentration of
chains with a dp of 6 to 12.

72
Previous work was accomplished by using starches from an early developmental
stage, including S3 and S4 generations for exotic breeding crosses (exotic populations x
adapted lines), and S? generation for exotic x adapted inbred lines. The S„ designation
defines the number of times the line has been self pollinated starting with the breeding cross
(the So population), in the development of the line. The frequency of kernels within some
lines containing starch with low T0G was relatively low (1/10), which indicated that the
genetic background controlling low T0G was still heterogeneous. Therefore, all thermal and
structural analysis were performed by using starch extracted from single kernels. By
advanced self-breeding and selecting for a specific trait, which was low T0G, this specific
trait was fixed in the progeny generation. Furthermore, more materials were produced to
allow us to do more complete structural and functional analyses.
The objectives of this research were to evaluate functions and structures of starches
from advanced generations of developmental lines from exotic x adapted inbred lines and
exotic breeding crosses (exotic populations x adapted lines), and to establish relationships
between the fine structure and functional properties of the starches. A secondary objective
was to confirm the advancement of selected functional traits into the next generation of com.
Materials and Methods
Corn Populations
Lines and their derivatives from three exotic by adapted breeding crosses from the
Germplasm Enhancement of Maize (GEM) project and four exotic inbreds, plus public
inbred lines B73 and Mo 17 as controls, were studied (Table 1). Mo 17 has a non-Stiff Stalk
heterotic pattern and B73 has a Stiff Stalk heterotic pattern. The original exotic lines and
populations used in this study are maintained at the North Central Regional Plant
Introduction Station in Ames, IA. The breeding crosses were developed by crossing the
exotic populations (DK212T is a tropical 3-way commercial hybrid developed by DeKalb
Genetics in Thailand) with inbreds of the Stiff Stalk heterotic pattern. The Stiff Stalk inbreds
belong to companies that cooperate in GEM. All parent lines for regrowing were selected for
the desirable trait, low T0G- All S4 progeny derived from the exotic x adapted lines, CHIS-37,
CUBA-38, and for the Mo-17 control, were grown and self-pollinated in the same
environment near Ames, IA in 1998. All S5 progeny derived from the exotic x adapted lines,

73
DK-8-1, DK-8-4, DK-8-5, DK-10-1, and DK-10-25, S? progeny for the exotic inbreds,
PI82-3, PI82-6, PI82-8 and PI82-18, and the B73 control, were grown and self-pollinated in
the same environment near Ames, IA in 1999. Ears were harvested at full physiological
maturity; they were dried at 38°C for five days, shelled and stored at 4 °C and 45% relative
humidity until the kernels were needed for analysis.
Single Kernel Starch Extraction
Starch was extracted from single kernels using the method described by White et al.
(1990), with modifications (Krieger, Duvick, Pollak, & White, 1997). Corn kernels were
hand-picked and cleaned to remove foreign material, mold, and broken kernels before
analysis. One kernel of whole corn was steeped in 5 mL 1% sodium metabisulfite solution at
45 C for 48 hr, followed by manual removal of the pericarp and germ with forceps. The
separated endosperm was placed in a 50-mL centrifuge tube with 10 mL of distilled water
and homogenized by using a Tekmar tissue homogenizer (Ultra-Turrax T25, 600W,
Cincinnati, OH) at 20,500 rpm for 30 sec. The homogenized slurry was filtered by using a
30-micron nylon filter under vacuum with several washes, for a total wash-water volume of
300 mL. The starch slurry was allowed to settle in a refrigerator for 2 hr and the supernatant
drained. The starch was rinsed with 250 mL water, drained twice, and the resulting sediment
air-dried.
For the initial screening, at least five randomly selected kernels from each of the 55
Sn+i lines were individually evaluated for starch characteristics after extraction. Thermal
analysis by using Differential Scanning Calorimetry (DSC, described below) was conducted
on these starch samples. Based on the results of the initial screening, 11 progeny lines from
11 exotic families, plus one line each from Mo 17 and B73 as controls, were selected for
further characterization.
Bulk Starch Extraction
Five to ten (depending on the availability of seeds) separate starch extractions, of ten
kernels each, were made by using the ten-kernel extraction procedure as for screening,
except that the homogenized slurry was filtered by using a nylon filter for a total wash-water
volume of 500 mL. Starches were combined and mixed well to produce the large quantities
of starch needed for the functional and structural studies described in this paper. After
extraction, starch was stored at 4°C until evaluated.

74
Moisture Content of Starch
Mo isture content of starch was measured by heating starch at 110°C for 3 hrs.
Triplicate analyses were done for each sample.
DSC
Thermal properties of the isolated starch were analyzed with a DSC7 analyzer
(Perkin-Elmer Corp., Norwalk, CT) equipped with a thermal analysis data station. Starch
was gelatinized as described by White et al (1990). Starch (4.00 mg) was weighed into an
aluminum pan (Perkin-Elmer 0219-0062) and 8 |iL of distilled water was added to the starch
in the pan. All experiments were run at a scanning rate of 10°C /min from 30°C to 110°C
(Ng, Duvick, & White, 1997). DSC parameters recorded for this study included change in
enthalpy (AH), peak onset temperature (To), peak temperature (Tp), and range of
gelatinization temperature (Re). A subscript g after the parameter denotes a gelatinization
property. The parameters T0, Tp, Te (peak conclusion temperature), and AH were given
directly by the DSC software. The Rg was calculated as Tc-T0, and peak height index (PHI)
was calculated from the change in enthalpy of gelatinization divided by half the range. The
same scanning method was used for rétrogradation of the gelatinized samples kept at 4°C for
7 days. A subscript r after the DSC parameter denotes a rétrogradation property. The T0, Tp,
Tc and Hof rétrogradation were calculated automatically. Range of rétrogradation (RR) was
calculated as (Tc - T0). All enthalpy calculations were based on the dry-starch weight, and all
analyses were conducted in duplicate and the values averaged. Percentage of rétrogradation
(%R) was calculated from the ratio of Hof rétrogradation to H of gelatinization.
Pasting Properties
The pasting properties of starches were analyzed by using a Rapid Visco Analyser
(RVA, model 4, Newport Scientific Pty. Ltd., Warriewood, NSW, Australia) and an STD2
temperature profile equipped with Thermocline for Windows software version 1.2. At least
two RVA profiles were obtained for each sample and the results for each sample were
averaged. An 8% (dwb) starch in water slurry at a final weight of 28 g was used for each
RVA analysis. The following time-temperature profile was used: heat the starch-water
mixture for 1 min at 50°C to equilibrate the sample, increase the temperature to 95°C in 7.5
min, hold at 95°C for 5 min, decrease to 50°C in 7.5 min, and hold at 50°C for 2 min.
Pasting temperature (Ptemp), peak time (Ptime), peak viscosity (PV), trough or hot paste

75
viscosity (HPV), final or cool paste viscosity (CPV), breakdown (PV-HPV), and setback
(CPV - HPV) were recorded.
Gel Strength
The texture properties of starch pastes from the RVA analysis were analyzed with a
texture analyzer (Stable Micro Systems TA.XT2, Texture Technologies Corp., Scarsdale,
NY) equipped with Texture Expert for Windows software (VI. 11) (Takahashi & Seib, 1988).
After each RVA run, the hot starch paste was poured into an aluminum container (27 mm
diameter and 27mm depth) with aluminum foil surrounding the top to increase its depth by
10 mm. The top of the container was covered with aluminum foil to prevent dehydration.
Gel strength was tested after two storage conditions: one day at 25°C and seven days at 4°C.
Samples stored at 4"C for seven days were equilibrated at room temperature for 1 hr before
analysis.
For a gel strength measurement, the aluminum foil cover was removed and the extra
gel was removed with a cheese cutter to produce a fresh surface for analysis (Takahashi &
Seib, 1988). The gels were compressed at a speed of 0.9 mm/sec to a distance of 7.5 mm
using a stainless steel punch probe (P/4, 4 mm diameter). The peak at 7.5 mm (8.2 sec) was
reported as the firmness of the gel, and the negative portion of the peak was reported as the
stickiness of the gel (Takahashi & Seib 1988). From each of two replicates, gel strength was
measured at five different locations on each gel sample and results per replicate averaged.
Microscopy Analyses
Granule-size distributions of native starches were obtained by following the
procedure described by Jane and Chen (1992). Native starch was suspended in 100% ethanol
to aid in spreading the particles into a monolayer, mounted on a glass microscope slide, and
viewed by using a Zeiss axiophot microscope (Zeiss-Kontron, Thomwood, NY) at 50x
magnification (20x by 2.5x optivar). Three slides from each sample were analyzed
separately, with 400 particles measured from each slide, to give a total of 1200 starch
granules analyzed per starch type. The starch granules selected for the measurement were
randomly chosen from each slide. For each granule, area, perimeter, radial S.D., and major
axis were determined. The radial S.D. is a measure of the "roundness" of a particle. A perfect
circle would have a radial S.D. measurement of 0. The less round the particle, the bigger its
radial S.D. number. The equivalent diameter was assessed by: equivalent diameter = sqrt

76
(4*area/7t).
Apparent Amylose Content
Starch samples were defatted by dispersing starch in 90% DMSO solution, with
stirring in boiling water bath for 1 hr and stirring at 25°C for another 24 hr. Dispersed starch
was precipitated with three volumes of ethanol and collected by centrifugation. Precipitated
sample was washed with ethanol, recovered by filtration, and dried in a convection oven at
35°C for 24 hr. Iodine affinities of defatted whole starch were determined by using a
potentiometric autotitrator equipped with Meterodata recording software (702 SM Titrino,
Brinkman Instrument, Westbury, NY) following the procedure by Kasemsuwan, Jane,
Schnable, Stinard & Robertson (1995). Apparent amylose contents were calculated by
dividing the iodine affinity of starch by 19.0% (Takeda & Hizukuri, 1987). Iodine affinities
of the samples were replicated four times and the results averaged.
Branch-Chain-Length Distribution of Whole Starch
Branch-chain-length distribution of starches was determined following the procedure
described by Jane and Chen (1992). Starch was debranched by using isoamylase, and the
branch-chain-length distributions were analyzed by using a high-performance anion-
exchange chromatography system equipped with an enzyme column reactor and a pulsed
amperometric detector (Dionex, Sunnyvale, CA) (HPAEC-ENZ-PAD) by using the method
reported by Wong and Jane (1997). A CarboPac PA1 anionexchange column (250 x 4 mm)
and a CarboPac PA1 guard column (25 x 3 mm) were used for sample separation. The results
reported are an average of at least two replicates for each sample.
Molecular Weight Distribution of Amylopectin by HPSEC-MALLS-RI
The weight-average molecular weight (Mw) and z-average radius (Rz) of gyration of
amylopectin were measured by using HPSEC (HP 1050 series isocratic pump) equipped with
multiangle laser lightscattering (MALLS, model Dawn-F, Wyatt Tech. Co., Santa Babara,
CA) and refractive index (RI) detectors (HP1047A) following the procedure of Yoo & Jane
(2002). In the procedure, a Shodex OHpak KB-G guard column, and KB-806 and KB-804
analytical columns (Shodex Denko, Tokyo, Japen) were used for the separation of
amylopectin from amylose.
Statistical Analysis
Between-sample variations of granule size and shape parameters, which included

77
mean area, equivalent diameter, perimeter, radial S.D., and major axis, were assessed by
using the Analysis of Variance (ANOVA) for mixed effects model with nested design (i.e.,
three plates were nested within a starch sample). The Tukey multiple comparison test was
used to calculate differences in means of these parameters among starch samples. The
apparent amylose content, molecular weight of amylopectin, starch paste properties, and
starch texture properties were analyzed by using the general linear model (GLM) procedure.
Multiple comparison procedures of the Tukey test were used to calculate the differences
among starch samples. The family-wise confidence level used for calculating the differences
among starch samples was 95% (i.e., a = 5%). Relationships between starch functional
properties and structural properties were analyzed by using the Pearson correlation test.
Calculations were performed by using SAS version 8.2 (SAS Institute, Cary, NC) for the
Unix Operating system.
Results and Discussion
Selection and Verification of Trait by Using DSC
Starches from 55 Sn+i lines (Table 1) were screened for unusual thermal properties by
using DSC. Among these 55 Sn+i lines, 24 exotic breeding cross lines were from the S4
generation (CHIS-37 and CUBA-38), 18 exotic crosses were from the S5 generation (DK.-8-
l, DK-8-4, DK-8-5, DK.10-1 and DK10-25), and 13 exotic inbreds were from the S3
generation (PI82-3, PI82-6, PI82-8, PI82-18). Five to thirteen randomly selected single
kernels per line were individually extracted and then analyzed by using DSC. Twenty-seven
out of 55 lines were identified as lines for potential research and commercial interest,
because these lines contained at least one kernel whose starch exhibited thermal properties
that are significantly different from that of normal Com Belt lines (Mo 17 and B73), such as
a low T0G and wide Rg. For example, 9 out of 16 progeny lines of CHIS-37 contained at
least one kernel having starches with unusual gelatinization properties.
Based on the screening (represented in Table 1), 16 Sn+i lines containing kernels with
unusual thermal properties (T0G< 60°C or RG> 14°C) were selected for further
characterization (Table 2). The frequency of kernels within each Sn+t line with starch
exhibiting the specific DSC properties varied from 1/10 to 10/10. Starch gelatinization
properties of individual kernels within an S„+iline exhibited considerable variability. The

78
mean, minimum and maximum values for T0O, TPC, TCG and AHG of all kernels analyzed
within a progeny line are noted (Table 2). These selected lines have the promise for
developing inbred lines with fixed unusual thermal properties. None of the starches exhibited
unusual rétrogradation properties as measured by DSC.
To obtain large quantities of starch for further functional and structural analyses, all
com lines listed in Table 2 underwent starch extraction by using a bulk extraction procedure
for 50 to 100 kernels depending on the availability of the seeds. The DSC properties of each
starch type, bulked for each sample are listed in Table 3. The values are average of at least
two DSC analyses of the bulked starch.
Some starches from exotic lines also exhibited gelatinization thermogram shapes
with shoulders or double peaks (Fig. 1), suggesting two independent cooperative transitions
located in different populations of starch granules starting to gelatinize at different
temperatures (Ji et al, 2002). This finding verifies the presence of the two populations first
noted in the previous paper, and demonstrates that their presence is genetic. A food industry
might be able to take advantage of a starch having two separate starch population within one
source
Pasting and Textural Properties of Starch from Selected Corn Lines
Significant differences were observed in the pasting properties of starch from
different lines (Table 4). The B73 starch had the greatest PtCmp (79.2°C), whereas DK-8-4-5
had the lowest Ptemp (71.1 °C). All starches from exotic lines had greater peak viscosity
values (184.0 to 222.7 RVU), greater breakdown (57.3 to 114.9 RVU), and greater setback
values (86.2 to 108.5 RVU) than did Com Belt inbred line Mol7 (152.4,48.4 and 77.1 RVU,
respectively). Among all exotic lines, DK-8-4-6 had the greatest PV (222.7 RVU), DK-10-1-
4 had the greatest breakdown (114.9 RVU) and PI82-6-1 had the greatest setback value
(108.5 RVU). The values for starch from the two Com Belt inbred lines, B73 and Mo 17,
were quite different from each other in their pasting properties. B73 starch exhibited
relatively high PV values (195.2 RVU), high breakdown (77.5RVU) and high setback values
(97.2 RVU), compared with Mo 17 starch.
Data for the firmness and stickiness of the gels measured with a TA after the two
storage treatments are summarized in Table 5. Within a starch, seven days of storage at 4°C
gave significantly firmer gels than one day of storage at 25°C (Significance data for this

79
comparison is not listed in the table). The increase in gel firmness over time is mainly caused
by rétrogradation of starch gels, which is associated with syneresis of water and
crystallization of amylopectin, leading to denser gels (Miles, Morris, Orford, & Ring,
1985).
Among the different lines, significant differences were observed in the textural
properties. Starch from B73, CHIS-37-5 and PI82-18-1 required the least amount of force to
break the gel among all starch types after both 1 and 7 days storage and starch from DK-8-4-
6 required the greatest amount of force to break the gel among all starch types after both 1
and 7 days storage. Gel formed from starch from DK-8-4-5 had the greatest stickiness value
(21.99 g x sec) after one day of storage at 25 °C, whereas gel formed from starch PI82-6-1
had the greatest stickiness value (27.57 g x sec) after seven days of storage at 4 °C. Gel
formed from starch from DK-10-1-4 had the least stickiness value (14.12 g x sec) after one
day of storage at 25 °C, whereas gel formed from starch DK-8-4-3 had the least stickiness
value (18.8 g x sec) after seven days of storage at 4 °C. Textural properties of starch gels are
very important criterion used to evaluate the performance of starch in a food system. For
example, a firm and short (low stickiness) starch gel is desirable in a pudding or salve-like
product whereas long (great stickiness) starch gel is desirable in syrup-like products
(Thomas & Atwell, 1999b). The variability of the gel properties of starches from
developmental lines makes it possible that these starches from developmental lines can be
used in a wide variety of foods.
Apparent Amylose Content
No significant differences were observed in the apparent amylose content among the
starches analyzed. The average apparent amylose content for all starches ranged from 29.0 to
32.4% (data not shown). Because of the limited quantities of starch available from each line,
we did not measure the absolute amylose content for starch. It was difficult to make any
conclusion about absolute amylose content from apparent amylose content, because long
branch chains of amylopectin, like amylose, could bind iodine to form a single helical
complex during potentiometric titration, and consequently inflate the iodine affinity and the
apparent amylose content of starch (Jane et al 1999, Kasemsuwan et al, 1995).
Granule-size Distribution
Significant differences were observed in the mean granule-size parameters among the

80
selected starches (Table 6). Granules of starch from DK-8-5-2 had the smallest mean area,
equivalent diameter, and major axis, whereas granules of starch from B73 had the greatest
values for the same parameters. The mean granule-shape parameters also showed significant
differences. Granules from B73 starch tended to deviate least from a spherical shape (radial
S.D. = 7.7), whereas granules from CUBA-38-5 starch tended to deviate most from a
spherical shape (radial S.D. = 9.4).
Starch granules were divided into five groups according to their equivalent
diameters: < 5 |im, > 5 and < 9 p.m, > 9 and < 13 |im, > 13 and <17 fim, and > 17 (am, and
reported as a percentage of the total number of granules measured (Table 7). Significant
differences were observed in the percentage distribution profiles of some of these selected
starches. In general, B73 had the lowest proportion of granules smaller than 5 ^m in size
(2.3%), whereas 4726 had the greatest proportion of granules lower than 5 pm in size
(13.1%). Also, CUBA-38-5 tended to have the least proportion of large granules (0.1% of
granules > 17 |im), and B73 had the greatest proportion of large granules (8.17% of granules
> 17 |im).
Similar to results previously noted (Ji et al, 2002), Mo 17 and B73 were significantly
different from each other in granular size and shape distributions: granules from B73 were
larger and more spherical than granules from Mo 17. In addition, B73 starch had a lower
percentage distribution of small granules (< 5 pm) and greater percentage distribution of
larger granules (>17 fim) than did Mo 17.
Branch-Chain-Length Distribution of Amylopectin
Normalized branch-chain-length distributions of the selected starches and of Mo 17
and B73 starches were measured by HPAEC-ENZ-PAD. The comparison of normalized
chain length distribution of exotic starches with starch from control line B73 are shown in
Fig. 2a-c. The results are expressed as means ± standard deviation of a minimum of
duplicate analyses, and the height of each bar at each degree of polymerization (dp)
represents its relative concentration to peak I at dp 13 or 14. All starches showed a bimodal
distribution with the first peak at dp 13 to 14 and the second peak at dp 42 to 46. Chains with
dp -13 to 14 were most frequent in the distribution. These three graphs represent three
different chain length distribution patterns than the control starches: all exotic starches had

81
either lower normalized concentrations of long branch-chain at dp 15 to 24 (Fig 2a) or higher
normalized concentration of short branch-chain at dp 6 to 12 (Fig 2b), or both these
characteristics (Fig 2c) than did B73. Starches from two controls, Mo 17 and B73, had
slightly different normalized distribution patterns (Fig 3). The Mo 17 starch contained lower
relative intensities of A-chains at dp 6-12, and higher relative intensities of B1 chains at dp
15-18 than did B 73 (Fig 3).
To classify the starches, the chains were recorded as belonging to one of four
fractions: dp 6 to 12, 13 to 24, 25 to 36, or > 37, corresponding to A, Bl, B2, and B3 or
longer chains, respectively, based on Hizukuri's model (1986) (Table 8.). All exotic starches
had relatively lower average chain lengths (dp 23.4 to 25.3) than did Mo 17 and B73 starches
(dp 25.0 and dp 25.5, respectively) (Table 8.). All exotic starches contained a higher
proportion of A chains at dp 6 to 12 (16.55-18.77%) than did Mol7 (16.11%) and B73
(16.32%) starches, and a lower proportion of long B-chains (B2 or B3) at dp > 37 (17.79-
21.68 %) than did Mo 17 and B73 (22.27 and 22.50%). Among all exotic starches, CUBA-
38-5 starch had the shortest average chain length (dp 23.4), the greatest proportion of A
chains at dp 6 to 12 (18.58%), and the lowest proportion of B2 or B3 chains at dp > 37
(17.79%) (Table 8).
Molecular Weight and Gyration Radii of Amylopectin
Weight-average molecular weight (Mw) and Z-average radius of gyration (Rz,
related to the volume occupied by the molecule in a solution) of the amylopectin molecules,
determined by using an HPSEC-Malls-RI system, showed significant differences in Mw and
Rz among all starches (Table 9). Starch from DK-10-1-3 had the highest Mw (12.4x10⁸) and
Rz (398. lnm), whereas starches from DK-8-5-2 had the lowest Mw (7.9xl08), and starch
from DK-8-4-5 had the lowest Rz (351.lnm). A Pearson correlation analysis showed a strong
correlation between Mw and Rz (r=0.72 with p < 0.0001).
Relationship between Starch Function and Granule Size Distribution
Relationships between starch functional behavior and granule size and shape
distributions were analyzed by using the Pearson correlation test. Significant correlations at
p < 0.10 and p < 0.05 are listed (Table 10). The correlation coefficient (r) values were fairly
low, because functional properties of starch depend on many variables, and the effects of
each variable might interfere with each other. Thus, even a low r value, when accompanied

82
by a statistically significant value may be important.
The DSC parameter of T0o was positively, and RG was negatively correlated with
mean area. In addition, T0G and TcG were positively correlated with percentage of granules
having an equivalent diameter of > 17 |im, whereas T0G was negatively correlated with
percentage of granules having an equivalent diameter of 5 to 9 fim.
The effect of granular size on the gelatinization properties of starch has been the
subject of many research papers. Some investigators used A- and B- type starch granules
from the bimodal distribution of granules from wheat and barley to show the impact of
granule size, but the results are contradictory. The A- (larger) and B- (smaller) type starch
granules were reported to have different TPG and TCG with similar T0G, the TPG and TCG of B-
type starch granules were higher by 1-2°C than those of A-type starch granules (Eliasson &
Karlsson 1983, Soulaka & Morrison 1985, Peng, Gao, Abdel-Aal, Hucl, & Chibbar 1999).
According to Seib (1994), B-type granules started gelatinizing at a lower T0 than did A-type
granules, but had greater Tp and Te. But Ghiasi, Hoseney, & Varriano-Marston (1982)
reported that A- and B-type starch granules had similar gelatinization temperature regimes.
Further, Eliasson & Karlsson (1983), Soulaka & Morrison (1985) and Peng et al (1999)
reported that A-type starch granules from wheat had greater gelatinization enthalpy than B-
type starch granules, whereas Stevens & Elton (1971) found the gelatinization enthalpies of
wheat starch granules of different size classes to be similar. In contrast, Wootton &
Bamunuarachchi (1979) reported that A- type wheat starch granules had a lower
gelatinization enthalpy than did B-type starch granules. Actually, gelatinization properties of
starch are influenced by many factors, some of which inherently affect granule size. For
example, the lipid content is greater and amylose content is lower in small wheat starch
granules (Evers, Greenwood, Muir, & Venables, 1974), and the saturated fatty acids are
present in the greatest quantities in the smallest granules (Meredith, Dengate, & Morrison,
1978). Thus, it might seem that a correlation between granule size and gelatinization
temperatures (including T0G, TPG and TCG) exists, whereas the correlation is actually a
secondary effect of the internal structural composition.
Other correlations indicated that R% was positively correlated with size of starch
granules. The correlation coefficients between R% with starch mean area and major axis
both were 0.54. The reason for this might be that larger granules typically a contain higher

83
content of amylose than do small granules (DufEus & Murdoch, 1979). During the cooling
and storage of gelatinized starch, starch molecules begin to reassociate, with amylose
retrograding faster than amylopectin. Thus the greater amylose content causes more junction
zones and a higher R%.
The PV by RVA was negatively correlated with the percentage of small granules
having diameter < 5|im. At the same degree of swelling, small granules occupy less volume
than larger granules, resulting in the low PV (Medcalf & Gilles, 1968). The breakdown
values were positively correlated with mean major axis of starch granules, meaning that
paste stability decreased as the granules size increased. Highly swollen large granules are
more fragile and more easily broken by stirring because of their large volume, resulting in a
greater decrease in viscosity than for small granules (Medcalf & Gilles, 1968).
Relationship between Starch Functional Behavior and Chain-Length Distribution
A-chains and B1 chains of amylopectin are primary participants in the crystalline
regions. All exotic starches studied contained a greater proportion of A-chains with dp 6 to
12 than did starch from Mo 17 and B73 (Table 8). Also, relative intensities of the shoulder at
dp 15 to 24 to peak I in unusual starches were lower than those in Mo 17 and B73 (Fig 2 a-c).
Crystalline structure in the exotic starch was not as perfect as in Mo 17 or B73, because
fewer chains in the exotic starches would be long enough to go through the crystalline
region, thus resulting in defects in the crystallites. This observation is corroborated by the
DSC data that show lower than normal gelatinization onset temperatures (T0c < 62°C) for all
exotic starches of interest (Table 3).
The values of Tpc and AHO were positively correlated with average CL, and
negatively correlated with the proportion of A-chains at dp 6 to 12 (Table 10). Tester and
Morrison (Tester & Morrison, 1990) suggested that Tpo represents a measure of starch
crystallite perfection whereas AHQ represents the amount of crystalline amylopectin. A high
proportion of A-chains at dp 6-12 may lead to the less perfect and smaller quantities of
crystalline structure in starch granules.
The AHR values were positively correlated with the average CL, and negatively
correlated with the proportion of A-chains at dp 6-12, because A-chains at dp 6-12 will
inhibit the rétrogradation (Shi & Seib, 1992).
The proportions of A-chains at dp 6-12 also were negatively correlated with Ptemp by

84
RVA, because more short chains at dp 6-12, leading to less tightly packed crystalline
structures, also promoted swelling.
Correlation among Functional Properties of Starches
The PV and breakdown from RVA were negatively correlated with TPG and TCG
(Table 11). High gelatinization temperatures reflected by TPG and TCG will slow the
gelatinization process and lead to low PV. Proportion of short A chains of amylopectin could
be the reason for the negative correlation between breakdown values and TPG and TCG. A
great proportion of A-chains at dp 6-12 will result in a less perfect crystalline structure in the
granule and lead to a low gelatinization temperature. At the same time, a great proportion of
A-chains at dp 6-12 will promote swelling and result in high breakdown values (Jane et al,
1999).
Firmness and stickiness of gels by the TA were strongly correlated with
rétrogradation of starch (Table 11). As the starch became more crystallized, water was
squeezed out of the gel, causing a firmer, more concentrated gel. With less water, the gels
also had greater stickiness (Thomas, & Atwell, 1999a).
Comparison of Functional and Structural Properties of Two Corn-Belt Lines Mol7 and
B73
Starch from Com Belt inbreds, Mo 17 and B73, used as control lines in this study
were significantly different from each other in function and structure. The Mo 17 com
belongs to the non-Stiff Stalk heterotic pattern and B73 belong to the Stiff Stalk heterotic
pattern. The Mo 17 starch contained lower relative intensities of A-chains at dp 6-12 and
higher relative intensities of B1 chains at dp 15-18 than did B73 (Fig 3). This observation is
corroborated by the DSC data in that Mo 17 showed higher T0G, TPO and AHG than B73
starch. In addition to the structural differences in the chain-length distributions, starch from
Mo 17 and B73 had significantly different granular size and shape distribution. Starch
granules from B73 were larger in size and more spherical in shape than were starch granules
from Mo 17. Because of the larger size, more spherical shape and higher proportions of A-
chains at dp 6-12, starches from B73 had greater PV, and larger breakdown values than did
starch from Mol7.

85
Conclusion
The exotic lines were selected because of a low gelatinization onset temperature and
a wide range of gelatinization. The different gelatinization and pasting properties could be
explained by the branch chain-length pattern of the amylopectin. Starch granule-size
distribution profiles of exotic starches were different than those of normal starch. These
results suggest that incorporation of exotic alleles into Corn Belt germplasm is an excellent
means to obtain value-added traits to produce starch with desirable functions.
Acknowledgements
The authors thank Zihua Ao for the technical assistance. The authors also thank the
NRI Competitive Grants program/US DA, award number 98355036371, the NASA food
technology commercial space center, and the Iowa Corn Promotion Board for funding the
research.
Literature Cited
Duffus. C. M., & Murdoch, S. M. (1979). Variation in starch granule size distribution and
amylose content during wheat endosperm development. Cereal Chem., 56,427-429.
Eliasson, A.-C., & Karlsson, R. (1983). Gelatinization properties of different size classes of
wheat starch granules measured with differential scanning calorimetry.
Starch/Starke., 35, 130-133.
Evers, A. D., Greenwood, C. T., Muir, D. D., and Venables, C. (1974). Studies on the
Biosynthesis of starch granules. Starch/Stdrke., 26,42-46.
Ghiasi, K., Hoseney, R. C., & Varriano-Marston, E. (1982) Gelatinization of wheat starch.
III. Comparison by differential scanning calorimetry and light microscopy. Cereal
Chem., 59,258-262.
Goodman, M. M. (1985). Exotic maize germplsam: Status, prospects, and remedies. Iowa
State J. Res., 59,497-527.
Hanashiro, I., Abe, J., & Hizukuri, S. (1996). A periodic distribution of chain length of
amylopectin as revealed by high-performance anion-exchange chromatography.
Carbohydr. Res., 283,151-159.
Hizukuri, S. (1986). Polymodal distribution of the chain lengths of amylopectin, and its

86
significance. Carbohydr. Res., 147, 342-347.
Jane, J., & Chen, J. (1992). Effects of amylose molecular size and amylopectin branch
chain length on paste properties of starch. Cereal Chem., 69, 60-65.
Jane. J., Chen, Y. Y, Lee, L. F., Mcpherson, A. E., Wong, K. S., Radosavljevic, M„ &
Kasemsuwan, T. (1999). Effects of amylopectin branch chain length and amylase
content on the gelatinization and pasting properties of starch. Cereal Chem., 76, 629-
637.
Ji, Y, Seetharaman, K., Wong, K., Pollak, L. M., Duvick, S., Jane, J., & White, P. J. (2002)
Thermal and structural properties of unusual starches from developmental com lines.
Carbohydr. Polym., (in press).
Kasemsuwan, T.. Jane, J., Schnable, P., Stinard, P., & Robertson, D. (1995) Characterization
of the dominant mutant amylose-extender (Ae 1-5180) maize starch. Cereal Chem.,
72,457-464.
Krieger, K. M., Duvick, S. A., Pollak, L. M., & White, P. J. (1997). Thermal properties of
com starch extracted with different blending methods: Microblender and
homogenizer. Cereal Chem., 74, 553-555.
Medcalf, 0. G., & Gilles, K. A. (1968). The function of starch in dough. Cereal Sci. Today,
13,382-392.
Meredith, P., Dengate, H. N., & Morrison, W. R. (1978). The lipids of various sizes of wheat
starch granules. Starch/Stàrke., 30, 119-125.
Miles, M. J., Morris, V. J., Orford, P. D., & Ring, S. G. (1985). The roles of amylose and
amylopectin in the gelation and rétrogradation of starch. Carbohydr. Res., 135, 271-
281.
Ng, K. —Y, Duvick, S. A., & White, P. J. (1997). Thermal properties of starch from selected
maize (Zea mays L.) mutants during development. Cereal Chem., 74, 288-292.
Peng, M., Gao, M., Abdel-Aal, E.-S. M., Hucl, P., & Chibbar, R. N. (1999). Separation and
characteristic of A- and B-type starch granules in wheat endosperm. Cereal Chem.,
76, 375-379.
Pollak, L., & Salhuana, W. (1999). Lines for improved yield and value-added traits-Results
from GEM. Ann. Corn Sorgh. Ind. Res. Conf., 53, 143-158.
Seib, P. A. (1994). Wheat starch: Isolation, structure and properties. Oyo Toshitsu Kagakii.,

87
41,49-69.
Salhuana, W., Pollak, L., Ferrer, M., Paratori, O., & Vivo, G. (1998). Agronomie
evaluation of maize accessions from Argentina, Chile, the United States, and
Uruguay. Crop Sci., 38, 866-872.
Seetharaman, K., Tziotis, A., Borras, F., White, P. J., Ferrer, M., & Robutti, J. (2001).
Thermal and functional characterization of starch from argentinean corn. Cereal
Chem., 78, 379-386.
Shi, Y. C., & Seib, P. A. (1992) The structure of four waxy starches related to gelatinization
and rétrogradation. Carbohydr. Res., 227, 131-145.
Soulaka, A. B., & Morrison, W. R. (1985). The amylose and lipid contents, dimensions, and
gelatinisation charactistics of some wheat starches and their A- and B-granule
fractions. J. Sci. Food Agric., 36, 709-718.
Stevens, D. J., & Elton, G. A. H. (1971). Thermal properties of starch/water system. I.
Measurement of heat of gelatinization by differential scanning calorimetry.
Starch/Starke., 23, 8-11.
Takahashi, S., & Seib, P. A. (1988). Paste and gel properties of prime com and wheat
starches with and without native lipids. Cereal Chem., 65, 474-483.
Takeda, Y, & Hizukuri, S. (1987). Structures of rice amylopectins with low and high
affinities for iodine. Carbohydr. Res., 168, 79-88.
Tester, R. F., & Morrison, W. R. (1997). Swelling and gelatinization of cereal starches. II
Waxy Rice starches. Cereal Chem., 67, 558-563.
Thomas, D., & Atwell, W. A. (1999a). Gelatinization, pasting and rétrogradation. In:
Thomas, D., and Atwell, W. A., Starches (pp.28-29). Eagan Press St. Paul,
Minnesota, USA
Thomas, D., & Atwell, W. A. (1999b). Matching starches to application. In: Thomas, D., and
Atwell, W. A., Starches (pp.49-51). Eagan Press St. Paul, Minnesota, USA
White, P. J., Abbas, I., Pollak, L., & Johnson, L. (1990). Intra- and interpopulation
variability of thermal properties of maize starch. Cereal Chem., 67, 70-73.
Woo ton, M., & Bamunuarachchi, A. (1979). Application of differential scanning calorimetry
to starch gelatinization. I. Commercial native and modified starches. Starch/Stàrke.,
31,201-204.

88
Wong, K. S., & Jane, J. (1997). Quantitative analysis of debranched amylopectin by
HPAEC-PAD with a post-column enzyme reactor. J. Liq. Chrom., 20, 297-310.
Yoo, S. H., & Jane, J. (2002). Molecular weight and gyration radii of amylopectins
determined by high-performance size-exclusion chromatography equipped with muti
angle laser-light scattering and refractive index detectors. Carbohydr. Polym., 49,
307-314.

Table I Exotic breeding crosses and exotic inbred corn lines and their origins.
Exotic Pedigree for S„ Lines" Source Number of Snt, Number of Unusual S„+, Origin of Exotic Parent* Identification' Lines Analyzed1* Lines' Parent
Exotic Breeding Crosses PI 576258 CHIS 775:S191 lb-37-1-2 CHIS-37 16 9 Mexico PI 489361 CUBAI64:S151lb-38-l-3 CUBA-38 8 2 Cuba
Ames 23670 DK212T :S0610-8-1 -3-1 DK-8-1 1 1 Thailand Ames 23670 DK212T :S0610-8-1 -3-4 DK-8-4 6 6 Thailand Ames 23670 DK2I2T:S0610-8-1-3-5 DK-8-5 3 3 Thailand Ames 23670 DK212T.S06I0-10-I-3-1 DK-IO-I 4 4 Thailand Ames 23670 DK2I2T:S0610-10-1-3-25 DK-10-25 4 2 Thailand
Exotic Inbreds PI 186182 PI 186182-3 PI82-3 4 4 Uruguay PI 186182 PI 186182-6 PI82-6 3 3 Uruguay PI 186182 PI 186182-8 PI82-8 4 4 Uruguay PI 186182 PI 186182-18 PI82-I8 2 2 Uruguay
"Original com populations as maintained at the North Central Region Plant Introduction Center, Ames, IA. b Regrown com ears, maintained as lines to preserve a specific starch characteristic. n=4 for exotic breeding crosses CHIS-37 and CUBA-38. n=5 for exotic breeding crosses DK-8-1, DK-8-4, DK-8-5, DK-IO-I and DK-IO-25. n=2 for exotic inbreds. c Abbreviated source identification for use within this paper. d Sn,| line means first generation of com after self-pollination of S„ generations. 'Number of S„,, lines having at least one kernel containing starch with unusual thermal properties according to criteria given by Seetharaman et al (2001),

Table 2 Differential scanning calorimetry (DSC) data of starches from single kernels of selected corn S„+, lines*.
T0G"(°C) TPG (°C) TCF;(°C) AHc(J/g) Corn Source Frequency1 Mean Min Max Mean Min Max Mean Min Max Mean Min Max
Mol7 0/18 66.2 65.2 67.3 70.5 69.7 71.2 75.8 74.5 76.3 12.5 12.1 12,9 B73 0/10 64.9 64.5 65,3 68,7 68.2 69.3 72.8 71.9 73.8 10,9 10.4 11.2
CUBA-38 CUBA-38-5 8/10 59.7 56.9 62,1 66.4 64.4 67.8 72.7 71.7 74.2 9,4 9.0 9.7
CHIS-37 CHIS-37-5 5/13 62,2 59,2 63,9 67.9 66.3 69,4 74,9 74.1 75.5 10.8 10.3 11.5
DK-8-1 DK-8-1 4/5 60.3 59,0 63.2 68.1 67.5 69.7 73.6 72.6 74,7 11.4 10.0 10.5
DK-8-4 DK-8-4-3 10/10 57.1 52.8 59.1 67.6 66.9 68.5 73.0 72.3 74.2 11.7 9,9 11,4 DK-8-4-5 10/10 59.2 55.7 60.6 68,2 67.3 68.6 73.1 73,7 72.3 12.1 10.4 12,8 DK-8-4-6 10/10 57.5 55.1 59.9 67.3 66,8 68.2 72,5 71.9 73.5 11.2 9.6 11.4 DK-8-4-8 10/10 58,5 55.7 60,6 67,7 67.0 68.3 73.2 72.2 74.4 11.0 9.7 12.2
DK-8-5 DK-8-5-1 9/10 58,4 54,8 62,8 68.6 67.6 69.7 73.6 72.7 74.9 10.8 10.5 11.8 DK-8-5-2 9/10 57,0 51.7 65.1 68.3 67.8 68.8 73.4 72.3 74.3 10.9 9.6 12,1
DK-IO-I DK-IO-I-3 9/10 60.1 58,3 61,7 69.1 68.0 69.8 74.0 73.4 74.8 11.2 10.7 11.9 DK-10-1-4 7/10 60,2 58.5 61,7 69,1 68.2 69.7 73.8 72.7 74.4 10.8 9.9 11.7
DK-10-25 DK-10-25-1 9/10 59.4 57,2 61,5 67.4 67.0 67.7 71.9 70.8 72.7 10.6 9.2 11.4
P182-3 PI82-3-1 8/10 60.0 57,4 65.1 68.4 67.3 69.0 73.0 71.6 73.5 10.8 10.1 11.2
PI82-6 PI82-6-I 5/10 60.4 58.6 62.4 67.1 66.0 67.9 73.2 72.5 74.1 9.4 8.6 10.6
PI82-8 PI82-8-5 7/10 60,6 57,9 64,4 67,8 66.4 69.0 73.2 72.3 73.8 11.0 10.1 11.9
PI82-I8 PI82-18-1 1/10 62,0 59,5 64.3 68.8 67.3 70.0 74.1 73.0 75.4 I I I 10,8 11.3
"See Tabic I for the definition ofSnl| lines, b See Table I for an explanation of source identification, The number after the dash signifies the ear number for the pedigree of the Sn line, c Frequency of kernels whose starch exhibited the unusual DSC properties, T*o < 6I°C or Rtt> I4°C. d Too = Gelatinization onset temperature; Tpo = Gelatinization peak temperature; AI lfi = Enthalpy of gelatinization. The results reported arc an average of at least replicates for each sample, and standard deviations are less than 0,38.

Table 3 Differential scanning calorimetry (DSC) data of starches from 50 to 100 kernel extraction of selected corn lines.
Source of Starch (Sn+, line*)
DSC Parameter Source of Starch (Sn+, line*) ToC
6(°C) Tpc(°C) T«c <°C) AHc(J/g) RG(°C) PHI T„K (°C) RR(°C) AH„(J/g) R% Mol 7 67.7 72,0 76,5 13.0 8.6 3.0 43,3 19.3 6.9 52,8 B73 65,0 69.8 75.0 11.6 10,1 2.3 43.6 19.0 6.4 54.9
CUBA-38 CUBA-38-5 61.2 68.1 74.3 11.2 13.0 1.7 42.1 20.8 6.4 57,1
CHIS-37 CHIS-37-5 61,4 68.6 76.2 11.5 14.9 1.5 42.5 19,6 5.6 48.8
DK-8-1 DK-8-1 58,7 68.7 74.6 12,4 15.9 1,6 42.3 19.7 6.2 50.2
DK-8-4 DK-8-4-3 56,2 68.2 73,8 I I I 17.6 1.3 42.2 19.5 4.6 42,0 DK-8-4-5 60,0 67.7 72.6 12.2 12.6 1.9 40.4 21.1 6.2 51.3 DK-8-4-6 56,7 67,7 73.5 12.1 16.8 1.4 41.0 20.6 5.6 46,6 DK-8-4-8 57.2 68.0 73,8 12,1 16.6 1.3 42.5 18.7 5,4 49,0
DK-8-5 DK-8-5-1 55.3 68,8 74.9 11.3 19.7 I.I 41.6 20.7 5,8 51.6 DK-8-5-2 53,5 69.3 75.5 12,1 22.1 1.1 41.2 21.3 6,2 51.0
DK-IO-I DK-IO-I-3 60,3 69,5 74.8 12.3 14,5 1.7 42.7 18,7 6,7 54.4 DK-I0-I-4 62.2 69,2 74.2 11.6 12.0 1.9 41.1 21.6 6.4 55.5
DK-10-25 DK-10-25-1 56.7 67,3 72.0 11,6 15.3 1.5 39.7 22,0 6.5 56,6
PI82-3 P182-3-I 61,4 68.8 74.1 10.6 12.7 1,7 43,5 18.6 5.2 49,4
PI82-6 PI82-6-I 59.7 67.8 74.2 10.8 14.5 1.5 42,4 19.8 6.5 59.8
PI82-8 PI82-8-5 59.2 67,3 73.7 11.4 14.4 1.6 40.9 20.5 6.2 54.6
PI82-I8 62,0 69.8 75.9 12.2 13.8 1.8 42.9 19.4 5.5 45.0 P182-I8-1 62,0 69.8 75.9 12.2 13.8 1.8 42.9 19.4 5.5 45.0
" See Tabic I for an explanation of S„tl line. b I'oc = Gelatinization onset temperature; Tpo, = Gelatinization peak temperature; Tc0 = Gelatinization end temperature; AHa = Enthalpy of gelatinization; R0 = Range of gelatinization temperature; PHI = Peak height index (enthalpy of gelatinization divided by half the range); ToR = Rétrogradation onset temperature; Rr = Range of rétrogradation temperature; AHR = Enthalpy of rétrogradation; R% = Percentage of rétrogradation. The results reported are an average of at least two replicates for each sample, and standard deviations are less than 0,59,

92
Table 4 Pasting properties of starches from selected corn lines measured with a Rapid Visco Analyser (RVA).
Source of Starch (Sn+I line')
p -•limp P lime Viscosity(RVU) Source of Starch
(Sn+I line') p -•limp P lime
PV HPV CPV Breakdown Setback Mol7 75.5 8.2 152.4 104.0 181.1 48.4 77.1 B73 79.2 8.3 195.2 117.7 214.9 77.5 97.2
CUBA-38 CUBA-38-5 71.6 8.1 198.3 105.7 202.2 92.6 96.5
CHIS-37 CHIS-37-5 72.3 8.3 210.0 136 230.6 74.0 94.6
DK-8-I DK-8-I 72.9 8.1 204.9 131.3 220.1 73.6 88.8
DK-8-4 DK-8-4-3 72.1 8.3 184.0 111.6 209.9 72.4 98.3 DK-8-4-5 71.1 8.0 198.4 117 212.9 81.4 95.9 DK-8-4-6 71.2 8.2 222.7 140.1 232.4 82.6 92.3 DK-8-4-8 75.3 8.2 195.9 123.8 215.2 72.1 91.4
DK-8-5 DK-8-5-1 73.4 8.3 200.3 123.4 221.3 76.9 97.9 DK-8-5-2 77.9 8.5 186.1 128.8 216.8 57.3 88.0
DK-IO-I DK-lO-l-3 72.7 8.1 205.7 119.3 208.8 86.4 89.5 DK-lO-l-4 73.9 7.7 222.5 107.6 211.3 114.9 103.7
DK-I0-25 DK-10-25-1 77.1 8.4 204.2 122.4 229.2 81.8 106.8
PI82-3 PI82-3-1 77.7 8.1 1912 106.1 202.4 85.1 96.3
PI82-6 PI82-6-I 71.9 8.0 207.2 105.4 213.9 101.8 108.5
PI82-8 PI82-8-5 77.7 8.3 208.4 131.8 233.9 76.6 102.1
PI82-18 PI82-I8-I 78.1 8.3 192.8 127.7 213.9 65.1 86.2
S.D. 1.78 0.13 7.66 7.15 12.00 8.82 9.01 a See Table I for an explanation of Sni.| line. b P,cmp= pasting temperature (°C), = peak time (min). PV = peak viscosity. HPV = hot paste viscosity. CPV = cool paste viscosity, breakdown = PV-HPV. setback = CPV HPV. S.D. = standard deviations. The results reported are an average of at least two replicates for each sample.

93
Table 5 Gel properties of starches from selected corn lines measured with a Texture Analyzer.
Source of Starch Firmness (g) Stickness (g x sec) (S„+, line*) 2S°C, I Day 4"C, 7 Pays 2S°C, I Pay 4°C, 7 Days
Mo 17 14.86abu 19.20ed 18.53bd 24.43a-e B73 I0.46ij 16.44fg I4.40g 22.52a-f
CUBA-38 CUBA-38-5 12.54d-g 20.46b-d 20.53ab 21.25c-f
CHIS-37 12.54d-g
CHIS-37-5 10.26J 16.40fg 20.33ab 20.44 DK-8-1
DK-8-1 12.12e-h 20.3 lb-d 21.87a 26.68ab DK-8-4
DK-8-4-3 10.77h-j 14.28b 18.26be 18 8f DK-8-4-5 13.51b-e 21.67ab 21.99a 18.94f DK-8-4-6 16.24a 23.42a 18.90bc 21,87b-f DK-8-4-8 13.39b-e 17.68fe 20.62ab 20.58d-f
DK-8-5 DK-8-5-1 I2.42d-g 16.39fg 20.09ab 19.68ef DK-8-5-2 1 l.85f-i 17.36% 17.42cf 25.46a-d
DK-10-1 DK-10-1-3 15.3a 21.18bc 15.74eg 22.4 la-f DK-10-1-4 13.63b-d 21.21bc I4.12g 27.14a-c
DK-10-25 DK-10-25-1 14.l0a-c NAC 15.44% NA
PI82-3 15.44%
P182-3-1 11.17g-j I5.53hg I8.94bc 20.50d-f P182-6
P182-6-1 12.27d-b 19.65cd 20.l7ab 27.57a PI82-8
P182-8-5 13.09c-f I8.65ed 20.22ab 24.47a-e PI82-18
PI82-18-1 10.03J 17.36% I6.08dg 20.06 1 See Table t for an explanation of S„»i line. b The results reported are an average of at least five replicates for each sample. Standard deviations are not listed, because of the unbalance data. Values followed by the same letter in the same column are not significantly different (P < 0.05). c Not available. Data is missing because of the limited quantities.

Table 6 Mean granule size and shape parameters of starches from selected corn lines used in structural analyses.
Source of Starch Mean Area Mean Diameter Mean Perimeter Mean Radial S.D. Mean Major Axis (Sn+, line*) (nm2) (Mm) (Mm) (Mm)
Mol7 88.9D 9.8D 41.IC 8.8A-C 10.8D B73 123.6A I2.0A 49.9A 7.7F 13.1A
CUBA-38 CUBA-38-5 II3.7B II.3 A 48.5A 9.5A I2.5A
CHIS-37 CHIS-37-5 9I.3CD I0.4C 43.4C 7.9EF II.3C
DK-8-1 DK-8-1 85. ID 9.9D 41.2C 8.ID-F 10.9D
DK-8-4 DK-8-4-3 69. IE 8.9F 36.8F 8.2D-F 9.6E DK-8-4-5 83.7D 9.9D 41.6C 8.2DE 10.8D DK-8-4-6 86.7D I0.0CD 4I.9C 7.8EF I0.9CD DK-8-4-8 74.2E 9.3EF 38.7DE 7.9EF 10.1E
DK-8-5 DK-8-5-1 85.7D 10.0D 4I.6C 8.5CD I0.9CD DK-8-5-2 70.7E 9.0F 37.5EF 8.3 DE 9.8E
DK-IO-I DK-I0-I-3 71.3E 9, IF 37.9EF 8.5CD 9.9E DK-10-1-4 94.4C I0.5C 43.9B 8.3DE II.4C
DK-10-25 DK-10-25-1 81.9D 9.7DE 40.4CD 8.9AC 10.7D
P182-3 PI82-3-1 83.2D 9.9D 4I.8C 9.3A I0.9CD
P182-6 PI82-6-I I05.7B 10.9B 45.7B 8.6BD II.9B
PI82-8 PI82-8-5 83.5D 9.8D 4I.2C 8.9A-C I0.7D
P182-I8 PI82-18-1 85.6D 9.8D 41.2C 9.IAB 10.7D
See Table 1 for an explanation of S„,, lines. b The results reported are an average of 1200 granules for eaeli sample. Please refer to Statistical Analysis for the detail experimental design. Values followed by the same letter in the same column are not significantly different (P < 0.05)

95
Table 7 Distribution profiles of starch from selected corn lines.
Source of Starch (Sn+, line*)
Distribution Profiles ;(%)" Source of Starch (Sn+, line*) < 5(nm) 5-9(nm) 9-l3(nm) 13-I7(nm) > 17 (pm)
Mol7 I2ac 35.2c-e 29e 18.3c-e 5.5a-c B73 0.92f 2l.33f 37.92b-e 31.67a 8.17a
CUBA-38 CUBA-38-5 4.23b-f 22.25f 38.14b-e 3l.06ab 4.32b-d
CHIS-37 CHIS-37-5 2.3ef 30.8d-f 48.1a 17.8c-g l.Oe
DK-8-1 17.8c-g
DK-8-1 2.92d-f 39.5bd 40.67a-c 14.42d-h 2.5c-e DK-8-4
DK-8-4-3 7.67a-d 49.58a 31.25d-e I0.67f-h 0.83e DK-8-4-5 3.08ef 40.25a-d 41.25a-c I4.33d-h 1.08e DK-8-4-6 2.08ef 40a-d 38.75a-c 17.67c-g l.5de DK-8-4-8 4b-f 47ab 37.33b-e I0.92e-h 0.75e
DK-8-5 DK-8-5-1 4.42b-f 36.25c-e 42a-c 15.08d-h 2.25de DK-8-5-2 7a-e 46.33ab 35.75b-e 10.42gh 0.5e
DK-10-1 DK-10-1 -3 8.42a-e 41 83a-c 39.92a-d 9.58h 0.25e DK-10-1-4 3d-f 33.08c-e 41.75a-c 19.17cd 3c-e
DK-10-25 DK-10-25-1 3.42c-f 42.67a-c 38.42b-e 14.08d-h 1.42d-e
PI82-3 PI82-3-1 2.33ef 38.33b-d 44.5ab 13.92d-h 0.92e
PI82-6 P182-6-1 6.33b-e 28.33e-f 34.58c-e 23.83bc 6.92ab
PI82-8 PI82-8-5 4.5b-f 37.83b-e 41.83a-c 14.5d-h 1.33de
P182-18 PÏ82-18-1 9.l7ab 35.92c-e 34.33c-e I8c-f 2.58c-e
1 See Table I for an explanation of S^i lines. b The results reported are an average of three replicates for each sample. c Values followed by the same letter in the same column are not significantly different (P < 0.05)

96
Table 8 Relative branch chain-length (CL) distributions of whole starch.
Source of Starch Peak dp" CL % Distribution* (Sn+, line'-Kernel) I II
CL dp
6-12 dp
13-24 dp
25-36 dp
>37 Mo 17 14 46 25.0 16.11 47.54 14.07 22.27 B73 14 44 25.5 16.32 45.92 15.25 22.50
CUBA-38 CUBA-38-5 13 46 23.4 18.58 48.57 15.05 17.79
CHIS-37 CHIS-37-5 13 46 23.7 18.00 48.12 15.06 18.82
DK-8-1 DK-8-1 14 46 24.5 17.08 47.01 15.54 20.37
DK-8-4 DK-8-4-3 14 44 23.7 18.53 48.53 14.34 I8 60 DK-8-4-5 14 45 24.3 17.84 47.91 14.40 19.85 DK-8-4-6 14 45 24.2 17.40 47.63 15.57 19.39
DK-8-4-8 14 45 23.9 18.77 48.06 14.08 19.09
DK-8-5 DK-8-5-1 14 44 24.5 17.66 47.09 15.64 19.61
DK-8-5-2 14 44 24.4 17.98 47.63 14.47 19.92
DK-10-1 DK-lO-l-3 14 46 25.3 16.96 46.25 15.11 21.68
DK-lO-l-4 14 44 24.1 17.69 48.13 15.07 19.11
DK-10-25 DK-10-25-1 14 45 24.4 16.55 47.14 16.69 19.60
PI82-3 PI82-3-1 14 47 24.0 17.34 47.97 15.97 18.71
PI82-6 PI82-6-1 13 44 23.5 18.26 49.80 13.95 18.00
PI82-8 PI82-8-5 13 46 24.0 17.44 48.02 15.86 18.69
P182-18 P182-18-1 14 46 23.6 17.28 49.60 15.20 17.92
1 See Table I for an explanation of S^.t lines. b dp=degree of polymerization cThe results reported are an average of at least two replicates for each sample. Grouping of dp numbers followed that of Hanashiro et al (1996).

97
Table 9 Amylopectin molecular weights and gyration radii of starches from Selected Corn Lines.
Source of Starch (Sn„ line')
M w ( x i o r R, (nm)c
Mo 17 ll.5ab 386.8ab B73 8.6d-f 365.7bc
CUBA-38 CUBA-38-5 8.3ef 368.3a-c
CHIS-37 CHIS-37-5 8.5d-f 3 59.1 be
DK-8-1 DK-8-1 10.2b-d 366.6bc
DK-8-4 DK-8-4-3 8.Of 351.1c DK-8-4-5 9.0d-f 365.7bc DK-8-4-6 9.4c-f 368.3a-c DK-8-4-8 8.9d-f 374a-c
DK-8-5 DK-8-5-1 8.5d-f 367.6bc DK-8-5-2 7.9f 361.9bc
DK-10-1 DK-10-1-3 12.4a 398.1a
DK-10-1-4 9.8c-e 376.6a-c
DK-10-25 DK-10-25-1 9.3c-f 361.Ibc
PI82-3 PI82-3-I 9.1d-f 360.8bc
PI82-6 PI82-6-I 8.9d-f 368.8a-c
PI82-8 PI82-8-5 8.3ef 368.5a-c
PI82-18 PI82-18-1 I0.9a-c 385.2ab
a See Table I for an explanation of Sn., lines. b Weight -average molecular weight. The results reported are an average of three replicates for each sample. c z-average radius of gyration. The results reported are an average of three replicates for each sample.

98
Table 10 Pearson correlation coefficients (r) of starch functional properties with structural properties.
Functional Granule Size Parameter Granule Size Distribution Profiles * Properties Mean Mean Major >17 13-17 9-13 5-9 <5
Area Axis (pm) (nm) (urn) Qim) (nm) DSC Parameter"
ToG 0.56**d 0.53** 0.48** 0.50** -0.60** TPG TcG 0.50** -0.48** He Rg -0.56** -0.54** -0.44* 0.52** HR
R% 0.54** 0.54** RVA Parameterc
Setback -0.41 * Breakdown 0.40*c
PV 0.56** -0.55** 1 Starch granules are divided into different groups according to equivalent diameter. b See Table 2 for DSC parameter descriptions. See Table 4 for RVA parameter descriptions. c See Table 4 for RVA parameter descriptions. "**.** : p-values for test Ho: p = 0 vs. Ha: p = 0 are smaller than 0.10 and 0.05. respectively. We used 0.1 instead of 0.005 here, because starch is a very complicated system which results in small correlation coefficients. If we use 0.005. we may lose some information here.

99
Table 10 (continued)
Functional Properties Branch Chain Length Distribution CL dp 6-12 (%) dp > 37 (%)
DSC Parameter" T„o -0.49** Tpc 0.50** -0.52** -0.59** TCC
HG 0.49** -0.42* 0.58** RG 0.47* HR 0.48** -0.48** 0.49** R%
RVA Parameter' Setback -0.46*
Breakdown PV

100
Tablell. Pearson correlation coefficient (r) among functional properties of starch.
DSC Parameter
T„G* TPG TCG RG HC TOR RR Gel Parameter
S7 F7 0.42* -0.47* SI F1 0.44* -0.42*
Setback -0.71** -0.64** -0.77** -0.45* 0.42* Breakdown -0.45* -0.46* -0.54*
PV -0.65** -0.42* 0.45* P|cmp
DSC Parameter R% AHR
RR -0.43* -0.88** T„R 0.57** 0.62** 0.67** -0.88** RG -0.94**
AH0 0.50** TcG 0.43* 0.79** TpG 0.62**
4 See Table 2 for DSC parameter descriptions. b See Table 4 for gel RVA parameter descriptions. S7 = Stickiness after seven days of storage at 4°C. F7 = Firmness after seven days of storage at 4°C. SI = Stickiness after one days of storage at 25°C. F1 = Firmness after one davs of storage at 25°C. ' * .** : p-va lues fo r t e s t Ho : p = 0 vs . Ha : p = 0 a re smal le r than 0 .10 and 0 .05 . r e spec t ive ly . We used 0 .1 ins tead o f 0 .005 here, because starch is a very complicated system which results in small correlation coefficients. If we use 0.005. we may lose some information here.

101
Table 11 (continued)
DSC Parameter Gel Parameter Hr R% P " «temp PV Breakdown FI
Gel Parameter S7 0.63**= 0.59** F7 0.57** -0.49** 0.43* 0.78** SI -0.49** FI 0.45*
Setback 0.44* 0.59** 0.74** Breakdown 0.48** 0.73**
PV
Piemp DSC Parameter
R% 0.83** AHR
RR TOR RG
AHG T=G
Tpc

102
Mo17
35 55 75 95
Temperature (°Q Figl. Geiatinization differential scanning calorimetry thermographs of starches in Table 3.

103
! ; 0.5 -
d TIHÏJJJïx
• CHIS-37-5 0B73
fllTirTnirm
11 21 31 41 51 Degree of Polymerization
Fig. 2a
61 71
I "§0.5 H N
0 4
DK-8-4-3 • B73
ill ullnrimiT
11 21 31 41 51 Degree of Polymerization
Fig. 2b
61 71

104
• DK10-1-3 0B73
TÎLU ITT
LHLM.TT f 1 11 21 61 71 81 31 41 51
Degree of Polymerization Fig. 2c
Fig 2a-c. Comparison of normalized branch-chain length distributions of exotic starches with B73 starch determined by using a high performance anion-exchange chromatography system equipped with an enzyme column reactor and a pulsed amperometric detector (HPAEC-ENZ-PAD). A Carbopac PA 100 column an immobilized amyloglucosidase column were used for the analysis.

105
I ED B73 • Mo17
I 73
0.5 -
o z
21 61 1 11 31 51 41 Degree of Polymerization
Fig 3. Comparison of normalized branch-chain length distributions of starches from two control line B73 and Mo 17, determined by using a high performance anion-exchange chromatography system equipped with an enzyme column reactor and a pulsed amperometric detector (HPAEC-ENZ-PAD). A Carbopac PA 100 column an immobilized amyloglucosidase column were used for the analysis.

106
CHAPTER 6. GELATINIZATION PROPERTIES OF STARCHES FROM THREE
SUCCESSIVE GENERATIONS OF SIX EXOTIC CORN LINES GROWN IN TWO
LOCATIONS1
A paper to be submitted to Cereal Chemistry
Y. Ji2, L. M. Pollak3, S. Duvick3, K. Seetharaman2- 4, P. M. Dixon5, J. Jane2,
and P. J. White2 6
1 Journal Paper No ... of the Iowa Agriculture and Home Economics Experiment Station,
Ames, Iowa, Project No. 3768, and supported by Hatch Act and State of Iowa funds, by
NRI. Competitive Grants program/USDA, award number 98355036371, and the Iowa Corn
Promotion Board. 2 Graduate student, postdoctoral research associate, professors, respectively, Department of
Food Science and Human Nutrition, Iowa State University, Ames, IA. 3 Research geneticist and biologist, respectively, USDA-ARS, Corn Genetics Research Unit,
Department of Agronomy, Iowa State University, Ames, IA
4 Currently, Assistant professor, Department of Food Science, The Pennsylvania State
University, University Park, PA16802 3 Associate professor, Department of Statistics, Iowa State University, Ames, IA.
^Corresponding author. Email: pjwhitefg)iastate.edu. Phone: (515)294-9688. FAX: (515)294-
8181.

107
Abstract
The objectives of this research were to evaluate the intra- and interpopulation
variability in geiatinization properties of starches from exotic com lines and their derivatives
when grown 1) during two successive years in the same location; and 2) in both temperate
and tropical environments. Six novel com lines (two exotic lines and four derived from a
breeding cross developed by crossing an exotic hybrid with Com Belt lines) were selected
for this research because heir starches have significantly different (and potentially useful)
thermal properties than those found in starch from normal Com Belt corn. The Sn (n=3 for
exotic cross population and n=l for exotic inbred population) generations of the six exotic
lines were self-pollinated and grown in the winter nursery in Puerto Rico. Two successive
generations (S„+i and S„+2 ) of selected (for low onset geiatinization temperature T0) lines
were self-pollinated and grown in the same environment near Ames, Iowa. To evaluate the
effect of environment, the S„+z generation also was self-pollinated and grown in the winter
nursery in Puerto Rico. Thermal properties of starches from ten single kernels from each line
were analyzed by using Differential Scanning Calorimetry (DSC). After subsequent
generations, the differences in geiatinization properties between selected kernels within each
progeny line narrowed, suggesting increased homogeneity of starch structural properties
within each line. Unusual thermal properties were fixed in some progeny lines.
Environmental factors also affected the thermal properties of starch, and a significant
interaction between environment and genotype was observed. These results suggest that
introgression of adapted germpiasm with useful genes from exotic com would increase the
available genetic variability for starch functionality and allow the development of hybrids
with important value-added traits.

108
Introduction
Less than one percent of the U.S. germplasm base of corn consists of exotic
germplasm (Goodman 1985), leading to concerns about corn's genetic vulnerability to
changes in environmental and agronomic conditions, and new insect and disease pressures
(Crossa and Gardner 1987, Kuckuck et al 1991). The Germplasm Enhancement of Maize
Project (GEM), a coordinated and cooperative effort among public and private sectors, was
launched with the objective of providing the com industry with materials developed by using
germplasm enhancement of useful exotic germplasm and ultimately improving and
broadening the germplasm base of com hybrids grown by American farmers. Traits targeted
for improvement are agronomic productivity, disease and insect resistance, and value-added
characteristics (Pollak and Salhuana 1999). Starch represents nearly 70% of the dry weight
of the mature com kernels and is the most economically important component. Therefore, to
further evaluate the starch quality of the GEM materials is essential to the fully utilize these
materials for food application.
We have currently developed several com lines derived from breeding crosses of
exotic genotypes with Com Belt lines. Our research has shown that these new lines can
produce starches with improved functional properties, which may have potential applications
in food industry. The desired functional properties of starches from the new developmental
lines (Ji et al 2002b) and their possible food applications are listed in Table I. To produce
inbred lines from the early-generation GEM lines that can be released and used
commercially as breeding lines, it is necessary to continue to develop and select lines to
genetically "fix" the unusual thermal properties, and to evaluate the performance of the
selected lines grown under different environments.
Individual properties of starch depend both on the genetic background of com
genotype and the environment. The effect of the genetic background of com and
environmental factors on the starch during the development of plants may be attributable to
changes in granule-size distribution, chemical structure, crystallinity, organization of the
molecules within the granule, and/or molecular structure of the starch polymers (Asaoka et
al 1989, Fergason and Zube 1962, Hizukuri 1969, Morrison and Scott 1986, Shi et al 1994,
Tester et al 1991). It is not know the roles of genetic (variety and level of breeding) and
environmental (year and location) factors in the total variability of starch properties. One

109
reason for this might be that different genotype responds differently to environmental
factors.
In the current study, Sn generations of selected lines were self-pollinated and grown
in the winter nursery in Puerto Rico in 1996. The S„ designation defines the number of times
the line has been self-pollinated, starting with the breeding cross or the Plant introduction
(the So population), in the development of the line (Simmonds 1974). Two successive
generations (S„+i and Sn+2) of the selected lines were self-pollinated and grown in same
environment near Ames, Iowa in 1998 and 1999. To evaluate the effect of environment, the
Sn+2 generation also was self-pollinated and grown in the winter nursery in Puerto Rico in
1999-2000. The objectives of this research were to evaluate the intra- and interpopulation
variability in thermal properties of starches from exotic novel com lines and their derivatives
when grown I) during two successive years in the same location; and 2) in both temperate
and tropical environments.
Materials and Methods
Materials
Three successive generations (Sn, Sn+i, and S„+z) of selected lines derived from an
exotic by adapted breeding cross from the Germplasm Enhancement of Maize (GEM)
project and two exotic inbred Plant Introductions were studied (Table II). The breeding
crosses were developed by crossing an exotic 3-way hybrid with two commercial inbreds of
the Stiff-Stalk heterotic pattern. Two successive generations (Sn+i and S„+z) of selected lines
were self-pollinated and grown in the same environment near Ames, Iowa. To evaluate the
effect of environment, the Sn+i generation also was self-pollinated and grown in the winter
nursery in Puerto Rico. Ears were harvested at full physiological maturity and dried at
approximately 37.5°C until the moisture content reached approximately 12%. All seeds were
stored approximately at 4°C and 10% relative humidity until analyzed.
Single Kernel Starch Extraction
Starch was extracted from single kernels by using the method described by White et
al (1990), with modifications (Krieger et al 1997). Starch from each of 10 randomly selected
kernels from each line was evaluated separately for starch characteristics after extraction.
After extraction, starch was stored at 4°C until evaluated.

110
Differential Scanning Calorimetry (DSC)
For DSC analysis, a Perkin-Elmer DSC 7 analyzer equipped with a thermal-analysis
data station (Perkin-Elmer Corp., Norwalk, CT) was used. Analysis of starch geiatinization
was conducted as described by White et al (1990). Starch (-4.0 mg, dwb) was weighed into
aluminum sample pans with 8 mg of distilled water. Samples were heated from 30 to 110°C
at a rate of l0°C/min. Thermal transitions for geiatinization were characterized by T0 (onset
temperature), Tp (peak temperature), Tc (conclusion temperature), and AH (enthalpy of
geiatinization). These parameters were calculated directly by the DSC software. All enthalpy
calculations were based on the dry-starch weight. The rétrogradation parameters are not
discussed in this paper because no significant differences among genotypes and
environments were observed.
Statistical Analysis
Effect of genotype and environment and their interactions on the geiatinization
properties of starch of Sn+z generation were analyzed by using an analysis of variance
procedure for a mixed model with nested design for unbalanced data. The model was:
Yijkim = En; + Pj + Lkj + (EnP)ij + (EnL)jjk + Oiijk + E^im
In this equation, Yakima is the geiatinization values for single kernel, p. is the overall
average, En; is the ''fixed" environmental effect, Pj is "fixed" source effect, (EnP)y is the
interaction between environment with source, is random line effect (Sn+i, nested within
the population), (EnL)ijk is the interaction between environment with Sn+i line, O^k is the
random progeny line effect (nested within each S„+i line), and Eijkim is the random error.
Effects from environment and source were treated as "fixed" effects here, because only two
environments (Ames, 1999 and Puerto Rico 1999 winter nursery) and six sources were
evaluated in this study. Because of the unbalance data. Type III sum of square was used to
test whether the contribution from each item (except g and Eijkim ) in the equation equaled to
zero or not.
Results and Discussion
Genetic Variability among and within Sn+z Lines Grown at Ames, IA 1999
The degree of genetic variability of developmental lines can be evaluated
quantitatively by measuring variations in starch geiatinization properties with-DSC (Brockett

I l l
et al 1988, Pollak and White 1997, Sanders et al 1990). The geiatinization properties of
starches from 66 S„+2 lines from exotic sources, DK8, DK.10, DK.14, DK34, PI82 and PI83,
grown in Ames, IA 1999, were determined by using DSC and summaries of their values are
listed in Tables III-VIII.
The thermal properties of starch from different lines exhibited considerable
variability. Among 66 S„+2 lines (from six sources) analyzed, the mean T0 ranged from 55.8
°C (DK8-S3-4-l, Table III) to 66.7 °C (PI83-S,-7-l, Table VIII), the mean Tp ranged from
66.8 °C (PI82-S[-6-3, Table VII) to 70.0 °C (PI83-S,-7-l, Table VIII), the mean Tc range
from 71.4°C (DK10-S3-3-2, Table IV) to 75.6°C (PI82-S,-7-l, Table VII), and mean AH
range from 9.3J/g (PI83-S,-l-4, Table VIII) to 12.3J/g (DK10-S3-18-4, Table IV). Within
each line, a high degree of variability for different geiatinization properties was also
observed among ten single kernels analyzed. Among 66 lines analyzed, line DK.8-S3-5-2
showed the highest variability in T0, ranging from 51.7-65.1 °C with standard deviation 3.95
(Table III), line PI82-S|-8-2 showed the highest variability on Tp and Tc, ranging from 66.3-
70.3 °C with standard deviation 1.20 and ranging from 71.4-76.1 °C lwith standard deviation
1.69 respectively (Table VII). Line DKlO-Ss-7-3 showed the highest variability on AH,
ranging from 7.9 to 12.3 J/g with standard deviation 1.7 (Table IV).
Sufficient variability in thermal properties within corn germplasm is important in
breeding programs aimed at screening maize germplasm for desired starch properties,
because the outliers reveal accessions possessing traits of potential use and make it possible
to develop corn lines with unusual thermal properties. Several studies have indicated genetic
variability among nonmutant sources of maize by DSC. For example, White et al (1990)
observed significant variations for onset temperature (T0), range of geiatinization (RG), and
AH values within and among several genetically variable, open-pollinated populations of
maize. Similarly, Li et al (1991) observed variability within several exotic populations,
suggesting that selection might be possible within populations to obtain genotypes with
specific starch properties.
Because the 66 lines in this paper were all grown in the same location during the
same year, growing conditions of the kernels were alike. Therefore, the significant
differences in geiatinization properties observed suggest that the different genetic
backgrounds of corn have a major effect on starch geiatinization behavior. The differences

112
in geiatinization properties of starch from various com lines could be attributed to some
structural variations of the starch. It has been suggested that geiatinization temperature
represents a measure of starch crystallite perfection and AH represents the amount of
crystalline structure (Tester and Morrison 1990). Previous studies defined the structures of
these and other com lines at S„+i (Ji et al 2002a) and S„+2 (Ji et al 2002b) generations.
Significant differences were observed among their granule size and shape
distribution, amylopectin molecular weight distribution, and branch-chain length distribution
of amylopectin. The variations in these structural properties would lead to the variation in
the crystalline structures of starch granule and the observed geiatinization properties.
Comparison among Three Successive Generations
The geiatinization values (mean, range and standard deviation) for starches from
derived lines of the exotic breeding cross and the two exotic inbreds populations over three
successive growing seasons (S„ in 1996 at Puerto Rico, Sn+i in 1998 at Ames, and Sn+z in
1999 at Ames) are also listed in Table III-VIII.
In general, each subsequent generation resulted in a narrowing of the differences in
geiatinization properties between kernels within each progeny line, suggesting increased
homogeneity of starch structural properties within each line. Such a trend of increased
homogeneity (or decreased s.d. of geiatinization properties) was clear following the
generation DK8-S3 -> DK8-S3-I -> progeny lines of DK.8-S3-I (Table III). A decrease in the
range of T0 values was found over three successive generations (Sn -S„+2 ) of population DK8
(Table 3). Among ten single kernels analyzed for the S„ generation, the T0 had a range of
6.0°C and s.d. (standard deviation) 1.92, whereas for the S4 generation, the range decreased
to 2.6 - 4.9°C with an accompanying decrease of s. d. to 1.01-1.64. The 10 progeny Sn+z
lines of DK8-S3-I showed continued reduction in the range of T0 and s. d., with the range
decreased from 4.9°C to 2.3-4.5°C, and the s.d. decreased from 1.64 to 0.70-1.27. A similar
trend of increased homogeneity on geiatinization values over successive generations were
also observed for some lines from population DK10, DK14, DK34, PI82 and PI83.
The S3 generation (staring from Si generation) of exotic inbreds PI82 and PI83 still
exhibited large variability on geiatinization temperatures and enthalpy still exited at. For S3
generation of PI82 inbred, the largest variability on T0 was shown up among the ten seeds
analyzed from PI82-S[-5-l, with a range of 8.8°C and s.d. of 2.86. For S3 generation of PI83

113
inbred, the largest variability on T0 was shown up among the ten seeds analyzed from PI83-
Si-4-l, with a range of 9.2 °C and s.d of 3.55. The reason for this might be that inbreds PI82
and PI83 was not true inbreds or the trait was not fixed in them.
For some lines, the change of variability of geiatinization properties over successive
generations became complicated. Even among progeny lines from the same parent, some
progeny lines showed larger variability, whereas other progeny lines showed smaller
variability than their parent did. For example, the s.d. of T0 for parent line DKIO-S3-I was
1.27. Among the next generation, two lines DKIO-S3-I-I and DKIO-S3-I-3 had small s.d.s
(1.19 and 1.01, Table IV), whereas two lines DKIO-S3-I-2 and DKIO-S3-I-4 had larger s.d.s
(1.37 and 1.93). This complication might be caused by many reasons. One possible reason
might be that geiatinization properties of starch are controlled by many genes and their
interactions. The line with small s.d. might be more homozygous for its gene controlling the
trait than the line with large s.d. Another possible reason might be the environmental effect
and its interaction with genotype, which will be discussed in detail in the following section.
Geiatinization thermograms of starch from progeny lines of DK8-S3-4 and DK8-S3-5,
which were grown at Ames, IA 1999, started to separate into a single peak with a big
shoulder at low temperature (Fig 1). This separation in geiatinization thermograms may also
contribute to the increased variability of geiatinization values among some progeny lines.
Selection and Verification of Trait with Potential Application in Food Industry
We started the selection by using DSC at the S3 generation for GEM exotic cross
lines with the goal to increase the desirable gene frequency (producing starch with T0 <
61.0°C) in the progeny. Before S3 generation, selection was for agronomic traits and yield.
The frequency of kernels containing starch with desirable geiatinization properties (T0 <
61.0°C) and their potential food application are listed in Table III-VIII. Unusual thermal
properties (T0 < 61.0°C) were fixed in some progeny lines S„+2 grown at Ames, 1999. For
example, one out of ten kernels of the S„+i line DK8-S3-I contained starch with T0 < 61.0°C,
whereas this frequency increased to 9 out of 10 kernels in the Sn+2 line of DK8-1-1. Zero out
of ten kernels of the Sn+i line DKIO-S3-7 contained starch with T0 < 61.0°C with one kernel
containing starch with T0 = 61.6°C„ whereas this frequency increased to 8 out of 10 kernels
in the Sn+z line of DK10- S3-7-l(Table IV). In addition, it could be concluded that selection
for these traits using the Puerto Rico winter nursery was successful.

114
Starch Variability between Two Locations
The average values and ranges of geiatinization parameters (To, Tp, Tc and AH) of
starch from the S„+2 generations of the corn grown at two locations (Ames and Puerto Rico)
revealed significant environmental effects and some significant interactions between
environment and genotype (Table IX). The significant environmental and genotype
interactions indicated that different genotypes responded differently to environmental factors
and that environment affects expression of these traits.
The environment and genotype interactions in this study include environment and
source interaction and environment and S„+i line interaction. And these significant
interactions can be specified from the geiatinization data in Table III-VIII. For progeny lines
of DK.10- S3-4, DKIO-S3-6, DKIO-S3-IO, no significant differences were caused by the
effect of environment. Whereas for progeny lines of DKIO-S3-I5 and DKIO-S3-I8, there was
a significant effect of environment on the T0 of starch. Eight out of nine progeny lines of
DKIO-S3-15 grown in Puerto Rico exhibited lower mean T0 (61.2-63.5°C) than did two
progeny lines grown in Iowa ( mean T0 64.4-64.7 °C). For DKIO-S3-I8, one progeny line
out of two grown in Puerto Rico exhibited lower mean T0 (61.6 °C) than did two progeny
lines grown in Iowa (mean T0 63.0-64.2 °C), whereas one progeny line out of two progeny
lines of DK10-18 grown in Puerto Rico exhibited higher mean T0 (65.7 °C) than did two
progeny lines grown in Iowa (mean T0 63.0-64.2 °C). Similar complications were also
observed when comparing progeny lines of DK34-S3-9 grown at two locations. In contrast,
the T0 of starches from progeny lines (S„+2 generation) of the exotic accession PI82 grown in
the tropical environment were higher than were those grown in the temperate environment.
Conclusion
The degree of genetic variability among and within developmental lines for
geiatinization properties was characterized by analyzing starch geiatinization properties on
10 randomly selected single kernels by using DSC. Large intra- and interline variability was
observed, and unusual thermal properties were fixed in some progeny lines over two
successive generations. Unusual thermal properties (T0 < 6l.0°C) were fixed in some
progeny lines. These results indicate that these lines might be useful for developing corn
breeding lines with unusual thermal properties. Environmental factors also affected the

115
thermal properties of starch, and a significant interaction between environment and genotype
was observed for some lines.
Acknowledgements
The authors thank the NRI Competitive Grants program/USD A, award number
98355036371, and the Iowa Com Promotion Board for funding the research.
Literature Cited
Asaoka, M., Okuno, K., Hara, K., Oba, M., and Fuwa, H. 1989. Effect of environmental
temperature at the early developmental stage of seeds on the characteristics of
endosperm starches of rice (Oryza sativa L.). J. Jpn. Soc. Starch Sci. 36:1-8.
Brockett, E., Thompson, D., Davis, T., and Boyer, C. 1988. Geiatinization characteristics of
starch from du, wx, ae, and ae wx endosperm of sweet com inbred la 5125.
StarclVStârke. 40:175-177.
Crossa, J., and Gardner, C. O. 1987. Introgression of an exotic germplasm for
improving an adapted maize population. Crop Sci. 27:187-190.
Fergason V. L., Zuber, M. S. 1962. Influence of environment on amylase content of
maize endosperm. Crop Sci. 2:209-211.
Goodman, M. M. 1985. Exotic maize germplasm: Status, prospects and remedies. Iowa
State J. Res. 59:497-527.
Hizukuri, S. 1969. The effect of the environmental temperature of plants on the
physiochemical properties of their starches. J. Jpn. Soc. Starch Sci. 17:73-88.
Ji, Y., Seetharaman, K., Wong, K., Pollak, L. M., Duvick, S., Jane, J., and White, P. J.
2002a. Thermal and structural properties of unusual starches from developmental
com lines. Carbohydr. Polym. (in press).
Ji, Y, Wong, K., Hasjim, J., Pollak, L. M., Duvick, S., Jane, J., and White, P. J. 2002b.
Structure and Function of Starch from Advanced Generation of New Com Lines. To
be submitted to Carbohydrate Polymers.
Krieger, K M., Duvick, S. A., Pollak, L. M., and White, P. J. 1997. Thermal properties of
com starch extracted with different blending methods: microblender and
homogenizes Cereal Chem. 74:553-555.

116
Kuckuck, H., Kobabe, G., and Wenzel, G. 1991. Pages 188-189 in: Fundamentals of Plant
Breeding, H. Kuckuck, G., Kobabe, and G., Wenzel. Springer-Verlag: Berlin,
Germany
Li, J., Berke, T. G., and Glover, D. V. 1994. Variation for thermal properties of starch in
tropical maize germplasm. Cereal Chem. 71:87-90.
Morrison, W. R., and Scott, D. C. 1986. Measurement of the dimensions of wheat starch
granule populations using a Coulter Counter with 100-channel analyzer. J. Cereal
Sci. 4:13-21.
Pollak, L. M., and Salhuana, W. 1999. Lines for improved yield and value-added
traits-Results from GEM. Ann. Corn Sorgh. Ind. Res. Conf. 53:143-158.
Pollak, L. M., and White, P. J. 1997. Thermal starch properties in corn belt and exotic com
inbred lines and their crosses. Cereal Chem. 74:412-416.
Sanders, E. B., Thompson, D. B, and Boyer, C. D. 1990. Thermal behavior during
geiatinization and amylopectin fine structure for selected maize genotypes as
expressed in four inbred lines. Cereal Chem. 67:594-602.
Shi. Y-C., Seib, P. A. and Bernardin, J. E. 1994. Effects of temperature during
grain-filling on starches from six wheat cultivars. Cereal Chem. 71:369-383.
Simmonds, N.W. 1974. Chapter 5: Breeding plan. Pages 128-134 in: Principles of crop
improvement. Simmonds, N.W. London: Longman Group Limited.
Tester, R. F. and Morrison, W. R. 1990. Swelling and geiatinization of cereal starches. II
Waxy Rice starches. Cereal Chem. 67:558-563.
Tester, R. F., South, J. B., Morrison, W. R., and Ellis, R. P. 1991. The effects of
ambient temperature during the grain filling period on the composition and properties
of starch from four barley genotypes. J. Cereal Sci. 13:113-127.
White, P. J., Abbas, I., Pollak, L., and Johnson, L. 1990. Intra- and interpopulation
variability of thermal properties of maize starch. Cereal Chem. 67:70-73.

117
Table I Desired Functional Properties of Unusual Starches from New Hybrids and Their Application in
Food Industry
Parameters Desired Characteristics Potential Application in Food Industry Gelatinization temperature
Viscosity development
Paste Properties
Gel properties
Low onset and peak gelatinization temperature by Differential Scanning
Calorimeter (<6l°C and 66°C respectively)
High peak viscosity (>200 RVU) by Rapid Visco Analyzer (RVA) High set back value by RVA
High firmness by Texture Analyzer (TA)
Energy savings, and nutrient and flavor retention during the cooking process.
Good swelling behavior, good thickener, less starch in a formula, formula savings.
Good gelling properties.
Good gelling properties.

118
Table II Exotic Breeding Crosses and Exotic Inbred Corn Lines and Their Origins.
Exotic Parent* Pedigree for S„ Lines Source Identification0
Origin of Exotic Parent
Exotic Breeding Crosses Ames 23670 DK212T:S0610-8-1 -3 DK8-S3 DeKalb Genetics Hybrid from
Thailand Ames 23670 DK212T:S0610-10-l-3 DKIO-S3 DeKalb Genetics Hybrid from
Thailand Ames 23670 DK2I2T:S0610-14-1-2 DKI4-S3 DeKalb Genetics Hybrid from
Thailand Ames 23670 DK212T:S0610-34-1-1 DK34-S3
Exotic Inbreds
DeKalb Genetics Hybrid from Thailand
PI 186182 PI 186182 PI-82-S, Inbred 378 from Uruguay PI 186183 PI 186183 PI-83-Si Inbred 378 from Uruguay
a Original com populations as maintained at the North Central Region Plant Introduction Center, Ames, IA. b Regrown com ears, maintained as lines to preserve a specific starch characteristic. In Sn generations, n=3 for exotic breeding crosses and n=l for exotic inbreds. c Abbreviated source identification for use within this paper.

Table III Gelatinization Data of Starches from Single Kernels of Selected Corn Lines from the DK8 Source
Corn Source" Freq" T.cc(°C) T„c(°C) TefifC) AHc(J/g)
Mean Range s.d.d Mean Range s.d. Mean Range s.d. Mean Range s.d.
DK8-S3 0/10 66,8 S3
62.4-68.4 generation, grown in Puerto Rico 1996 winter nursery 1.92 70.7 69.7-71.5 0.67 74.7 73,5-75.5 0.71 12.2 11.3-12.8 0.58
DK8-S3-I 1/10 63,6 61,5-66,4 1.64 S4 generation, grown in Ames 1998
71.4 70.6-72.4 0.49 76.9 76.5-77.6 0.46 12.4 11.7-13.2 0.44 DK8-S3-2 0/10 65,5 64.7-67.3 1.08 70.2 69,8-70.7 0.32 74.8 74.4-75.9 0.57 11.9 11.3-12.4 0.47 DK8-S3-3 0/10 64.4 62.3-66.8 151 69.9 68.1-70.8 0.85 74.9 73.9-75.4 0.50 12.5 11.4-13.9 0,91 DK8-S3-4 0/10 66.0 64.1-67.3 101 71,1 69,6-72.5 0,78 75.3 73.9-76.1 0.61 12.4 II.5-13.6 0.73 DK8-S3-5 0/10 65.3 63.8-67.4 1.17 70,1 69,0-71.2 0.73 74.6 74.0-75.7 0.56 12.5 10.8-14.3 1.18
DK8-S3- I - I 9/10 60.2 59-63.2 1.16 S5 generation, grown in Ames 1999
68,1 67,5-69.7 0.64 73.6 72.6-74.8 0.69 11.4 10.4-12.6 0.63 DK8-S3-4-1 10/10 55.8 52.5-57.8 1.54 67.8 67.2-68,7 0,52 73.2 72.3-74.5 0.63 11.6 10.9-12.3 0.45 DK8-S3-4-2 10/10 57.0 52,8-59,2 2.16 67.6 66.9-68.5 0.54 73.0 72,3-74.3 0,60 11.7 9.46-13.0 1.01 DK8-S3-4-3 10/10 59.2 55,7-60,6 1,57 68.2 67.3-68.6 0.38 73.1 72.3-73,7 0.42 12.1 11.5-12.8 0,44 DK8-S3-4-4 10/10 57,5 55,1-59.9 1.72 67.3 66.8-68.2 0.41 72,6 71.9-73.7 0.68 11.2 8,8-12.7 1,25 DK8-S3-4-5 9/10 58,6 55.1-61.4 1.64 68,0 66.7-69.6 0,92 72,8 71.5-74.6 0.95 12.1 10.7-13.3 0.67 DK8-S3-4-6 10/10 58.2 55,7-60,6 1.64 67.8 67-68.3 0.41 73.44 72.2-75.6 I I I 11.4 9.2-12.4 1.07 DK8-S3-5-1 9/10 58,5 54.8-62,8 2,39 687 67.6-69.9 0,66 73,8 72.9-75.0 0.70 11,2 10,0-12.1 0,67 DK8-S3-5-2 9/10 56,6 51.7-65,1 3.95 68,3 67.8-68.8 0.34 73.2 72.3-74.2 0.73 10.9 9.23-13,7 1,44 DK8-S3-5-3 5/10 61,5 58.7-64.1 2.13 67.7 67-68.9 0.64 72.8 71.3-74.5 0.97 11.3 9,7-12.5 0.76
DK8-S3-I-2 0/10 64.7 S5 generation, grown in Puerto Rico, 1999 winter nursery
61,8-65,7 III 69.2 68.7-69.7 0.35 73.8 72.8-75,0 0.62 11.9 10.9-12.5 0.44 DK8-S3-I-3 0/10 65.2 64.4-66,7 0.70 69.8 69-70.8 0,52 74.0 73.0-75.0 0.63 11.7 10,5-12.4 0.59 DK8-S3-I-4 0/10 66.2 64.2-67.7 1.19 69.9 68.7-71 0,74 73.8 72.7-74.8 0.65 12.2 11.4-13.8 0.81 DK8-S3-1 -5 0/10 65.1 63.6-66.3 0.79 69.1 68.2-70.0 0.64 73.4 72.3-74.9 0.81 11.7 10,8-12,8 0.68 DK8-S3-I-6 0/10 65.0 63.4-66.2 0.93 69.0 68.2-69,8 0,57 73.0 72.0-74,1 0,79 11.2 10.2-12.3 0.75 DK8-S3-I.7 0/10 66,0 64.0-67.8 1.27 70.1 69,0-71 0.61 74.2 73.6-74.7 0.34 12,4 10.8-13.7 1.01 DK8-S3-I-8 0/10 64.7 63,4-66.2 0.95 69.4 68,7-70.4 0,60 73.8 72.6-74.6 0.69 11.4 9.8-12.8 0.94 DK8-S3-I-9 0/10 64,5 62.2-66.7 1.33 69.6 68.4-70.3 0.61 73.8 72,5-74.4 0.67 11,6 10.3-13.0 1.03
DK8-S3- I - IO 0/10 69,3 67.9-70.4 I I I 73,0 72.3-74 0,62 75.9 75.0-77.1 0.77 11.2 10.1-12.4 0,88 " See Table I for an explanation of source identification. The number after the dash signifies the ear number for the pedigree of the Sn line, b Freq, = Frequency, number of kernels containing starch with T0 < 6l°C / total number of kernels analyzed, c Toe, = Gelatinization onset temperature; Tpo = Gelatinization peak temperature; AHCl = Enthalpy of gelatinization. d s.d. = Standard deviation of gelatinization values among 10 randomly selected kernels analyzed within each line.

Table IV Gelatinization Data of Starches from Single Kernels of Selected Corn Lines from the DKIO Source
Corn Source* Freq." T„cc(°C) TpG(°C) TcC(°C) AHc(J/g)
Mean Range s.d.' Mean Range s.d. Mean Range s.d. Mean Range s.d. S3 generation, grown in Puerto Rico 1996 winter nursery
DKIO -S3 0/10 66,5 65.0-68.2 0.86 69.5 68.5-70.8 0.73 73.4 72.3-74.0 0.55 12.2 11.2-12.7 0.44 S4 generation, grown in Ames 1998
DKIO -S3- I 0/10 64,9 63.2-66,7 1.27 71.6 71.0-72,2 0.45 76.2 74.9-77.0 0.72 11.6 11.0-12,1 0.39 DKlO-Sj-2 0/10 62,2 61,2-62,5 0,26 69,1 68,3-70.2 0.66 73.5 68.3-70.2 0.66 11.4 10,7-12,0 0.57 DKIO -S3-3 0/10 64,8 64,1-65.9 0.54 69.2 68.7-70 0.39 73,7 73.0-74.6 0.52 11.7 11.4-12.0 0,17 DKIO -S3-4 0/10 64.7 62.7-66.0 109 69.2 68.7-69.7 0.33 73.6 73.0-74.2 0.44 11.4 10.2-12,3 0.58 DKIO -S3-5 0/10 64.7 63,0-66.4 1.21 69.9 69.3-70.5 0.37 74,4 73.7-75.1 0,41 11.5 10.7-12.5 0,55 DKIO -S3-6 0/10 66,1 65,2-67.9 0,94 70.4 69.5-71.9 0.70 74.4 73.7-75.0 0,39 II .1 10,4-11,5 0,39 DKIO -S3-7 0/10 63,8 61,6-65,4 1.02 69.6 68.8-70.1 0.41 73.9 73,3-74.5 0.38 11.0 10.3-11.5 0,41
DKIO -S3- IO 0/10 63,4 61.2-64.9 1,17 69.0 68.5-69,9 0.45 73.4 72.5-74.3 0.62 11.8 11.0-11.4 0,54 DKIO -S3- I2 1/10 63,7 60.7-65.2 1.76 69.5 69,1-70,2 0.52 74.1 73.6-74.6 0,39 11,2 11.0-11.4 0.17 DKIO -S3- I3 0/10 63.3 61.9-64.0 0.86 69.2 68,7-69.7 0.34 74.2 73.8-74.7 0.35 11,2 10.4-11.9 0,57 DKIO -S3- I5 2/10 61,9 60,6-62.9 0.75 68.3 67.7-69.5 0,45 73.0 72.1-73.7 0.455 11.1 9.9-12.6 0.87 DKIO -S3- I8 1/10 629 60.9-64.6 I I I 69.7 69.4-70.1 0.21 74.2 73.7-74.7 0.36 11.5 10.6-12.5 0,55
S5 generation, grown in Ames 1999 DKIO -S3- I - I 4/10 616 60-63.5 1.19 69.8 69.3-70.4 0.34 74,3 73.7-75.9 0.66 10.9 9.4-12.8 108 DKIO -S3- I -2 4/10 61.8 58.7-64.5 1.93 69.0 67.9-70.0 0.61 73.1 72.0-74.2 0.60 11.1 10.4-12.1 0,60 DKIO -S3- I -3 8/10 60.3 58.3-61.7 1.01 69.2 68-69,8 0.57 73.9 73.4-74.6 0.46 11.4 10.4-12.7 0,68 DKIO -S3- I -4 4/10 60,7 59-63.1 1.37 69.0 68.2-69.7 0,39 73.6 72.7-74.4 0.55 10.9 10.4-11.7 0,39 DKIO -S3-3- I 0/10 62,9 61.5-65,0 1.41 68,2 67.3-69.8 0.98 72.5 71.0-74.3 1.20 11.0 10.3-11.7 0,48 DKIO -S3-3-2 0/10 64.3 63,8-65,0 0.46 67,6 67,0-68.2 0.48 71.4 70,6-71.9 0.55 11.8 11.4-12.3 0,34 DKIO -S3-4- I 0/10 64,5 62,5-65,8 098 69.9 69.3-70.7 0.43 74.2 73.3-75.2 0.69 10.8 10.0-11.5 046 DKIO -S3-4-2 0/10 64.2 63,2-65.5 0.66 68.3 68,1-68.6 0,16 72.8 72,1-73.3 0.38 11.6 10.4-12.6 062
1 See Table II for an explanation of source identification. The number after the dash signifies the ear number for the pedigree of the Sn line. b See Table II for an explanation of freq, c See Table III for Differential Scanning Calorimetry (DSC) parameter descriptions. (l s.d, = Standard deviation of gelatinization values among 10 randomly selected kernels analyzed within each line.

Table IV (Continued)
Corn Source* Freq." T.cc(°C) TpG(°C) TccCC) AHc(J/g) Corn Source* Freq."
Mean Range s,d.d Mean Range s.d. Mean Range s.d. Mean Range s.d. DKIO-S3-6-I 0/10 64,2 62.5-66.3 0,68 68.3 67,1-69.4 0,20 73.0 71.6-74.1 0.41 110 9.9-12,6 0.64 DKIO-S3-6-2 0/10 63,2 62,0-64.5 0.87 67.6 66,9-68.6 0,46 72.5 71.9-73,7 0.60 II.1 10.0-12.1 0,75 DKIO-S3-6-3 I/IO 62.7 60,4-64,8 1.23 67.7 67.0-69.1 0.60 72,9 72.0-73.9 0.59 10.0 8.2-10,9 1.06 DKIO-S3-7-I 8/10 60,0 57,2-63,3 1.77 67.5 67-67.8 0.25 71.9 70.8-72.7 0.66 10.6 9.0-11.5 0,85 OKI OS)-?-] 0/10 63.5 62.8-64.6 0.68 67.7 67-68.1 0.43 71.7 70.8-72.1 0.49 9.9 7.9-12.3 1,7 DKIO-S3-7-4 0/10 64,4 63,6-65.2 0.75 67.7 67,3-68,2 0.46 71.5 70.7-72.1 0.59 11.0 10.1-11.7 0,72 DKIO-S3-IO-I 0/10 64.1 63.6-64.8 0.41 67.4 66.9-67.7 0.27 72.0 71.6-72.4 0.34 11.5 8.9-12.9 1,22 DKIO-S3-IO-2 0/10 62,8 61,5-64,0 0.87 67.2 66.3-67.9 0.53 71.7 71.2-72.3 0,38 10.4 9,7-11.2 0.60 DKIO-S3-IO-3 0/10 62,7 61,4-64,0 0.79 67.6 67.2-67.9 0.25 72.6 71.3-74.5 1,04 11.4 9.6-12.9 1,21 DKI0-S3-10-4 3/10 61,7 58.9-64.0 1.51 67.8 67.5-68.4 0.36 71.9 71.5-72.6 0.39 10.7 9.9-11.1 0,39 DKIO-S3-IO-5 0/10 64,5 64.1-65.3 0.39 67.7 66.8-68.3 0.44 71.6 69.6-72.4 0.87 12.2 11.1-12,4 0,44 DKIO-S3-I3-I 0/10 64,7 64.3-65.2 0.38 68.2 67.7-68.5 0.31 72.3 71.8-72.7 0.36 11.35 10.7-12.7 0,80 DKIO-S3-I3-2 6/10 61,0 59.1-63,6 1,49 67.9 66.9-68.5 0.47 72.9 71.7-74.0 0.75 11,4 10.8-11.8 0.37 DKIO-S3-I5-I 0/10 64,7 62,8-66.4 1,08 68.3 67.2-69.5 0.75 72.4 71.1-73.4 0.60 I I I 9.9-11.9 0,64 DKI0-S3-15-2 0/10 64,4 62,9-67.1 1,30 68.0 66.8-70.4 1.29 73.1 71.5-75.6 1.31 10.8 9,0-11,7 0.83 DKIO-S3-I8-I 0/10 64,2 61.6-65,9 1.12 68.2 66.8-70.5 0.98 72,4 71.6-75.4 1.08 10.8 9.4-11.8 0.73 DKIO-S3-I8-2 0/10 63,0 61.9-64,4 0,94 67.3 66.8-67.7 0.38 71.8 71.4-72.5 0,35 10.8 9.3-11.9 0.98
85 generation, grown in Puerto Rico, 1999 winter nursery DKI0-S3-4-3 0/10 64,8 64.1-65.5 0.73 68.5 67.7-69.3 0.83 72.5 71.4-73.6 1,04 II.1 10.9-11.4 0.22 DKIO-S3-4-4 0/10 62,6 61.7-63.6 0.72 68.6 68.0-69.0 0.32 73.8 72.7-76.5 1.03 11.3 10.0-12.4 0.66 DKIO-S3-4-5 1/10 64.1 61,0-65,3 1.2 69.0 68.3-69.5 0.35 73.4 73.0-74.0 0.32 11.6 10.6-12.3 0.48 DKIO-S3-6-4 0/10 64.7 63,7-66,0 0.77 69,2 68.5-70.2 0.55 74.0 73.2-74.9 0.49 10,3 9.1-11.2 0.64 DKIO-S3-6-5 0/10 64.7 63.9-65.6 0,52 69.3 68.3-69.9 0.48 73.8 73.4-74.2 0.24 11.4 10.6-12,5 0.62
DKI-S3O-IO-6 0/10 63.9 63.5-64.7 0.46 67,5 66.7-68.2 0.61 71.8 71.2-72.6 0.62 11.4 10.4-13.1 1.09 DKIO-S3-IO-7 0/10 64.3 62.4-65.6 0.99 68.5 67.9-68.9 0.33 72.9 71.8-74.5 0.73 11.8 10.6-13.2 0.71 DKIO-S3-IO-8 0/10 64.2 63.0-65.2 0.68 67.7 66,7-68.2 0.43 72.4 70.9-74.8 1.05 11.8 10.3-13.1 0.91 DKIO-S3-IO-9 3/10 62,2 59.3-64.3 1.51 66.6 65,2-67.4 0.60 71.2 70.0-72.9 0.77 12.0 10.8-13,2 0.79 DK10-S3-15-3 0/10 63,5 61.6-64.4 0.87 67.7 67.2-68,2 0,35 72.1 70.9-72.7 0.54 12,0 10.6-12.6 0,65 DK10-S3-I5-4 1/10 62.8 60.9-63.8 0.77 66,3 64.9-67,0 0.58 71.1 69.7-72.3 0.77 11,7 10.8-12.8 0,76 DKI0-S3-I5-5 3/10 61,4 60,3-62.7 0,92 66,6 66.1-67.4 0.52 71.5 70.3-72,4 0.77 11.4 10.8-12,4 0.59

Table IV (Continued)
Corn Source* Freq." T„cc(°C) TpcCQ T,G(°C) AHc(J/g) Mean Range s.d.° Mean Range s.d. Mean Range s.d. Mean Range s.d.
DKIO-S3-I5-6 3/10 61.2 60.2-62.2 0.61 66.4 66-66.7 0.23 71.6 70.7-72.5 0.51 11.8 II. 1-12.2 0,36 DKIO-S3-I5-7 0/10 62,8 61.9-64.0 0.79 67.4 66,5-67.9 0.44 71.9 70.9-72.3 0.41 11.7 II.0-12.4 0.52 DKIO-S3-I5-8 0/10 62.3 61.3-63.4 0.63 67.2 66.6-67.9 0.38 71.7 70.5-72.5 0.71 11.6 10.5-12.5 0,62 DKI0-S3-I5-9 0/10 66,0 64,7-68.3 0.99 69.8 69.0-71.7 0.79 73.8 72.9-75.8 0.95 11.8 7,2-12.8 1.76
DKIO-S3-I5-IO 3/10 61,5 60.0-62.9 0.91 66.9 66.3-67.6 0.41 71,7 71.0-72.3 0.41 12.0 11.5-12,5 0,34 DKIO-S3-I5-II 1/10 62,0 60.0-63.3 1.03 67.4 67.1-67.7 0.19 72.4 71.7-73.0 0,39 11.9 11,4-12,8 0,48 DKIO-S3-I8-3 3/10 61,6 57.5-63.6 1.68 68.1 67.1-69.3 0.65 72.9 72.2-73.9 0.49 11.4 10.5-12.3 0,58 DKIO-S3-I8-4 0/10 65.7 64.0-66.4 0.65 69.8 69.5-70.4 0.27 74.3 73.9-75.4 0,44 12.3 11.9-12.7 0.27

Table V Gelatinization Data of Starches from Single Kernels of Selected Corn Lines from the DKI4 Source
Corn Source* Freq." TOGC(°C) TPc(°C) TCGCC) AHG(J/g)
Mean Range s.d. Mean Range s.d. Mean Range s.d. Mean Range s.d.
DKI4-S3
DKI4 -S3-I DKH-S3-3 DKH-S3-4 DKI4-S3-6 DKH-S3-7
DKH-S3-7-I OKI 4-83-7-2
DK14-S3-7-3 OK 14-83-7-4 DKI4-S3-7-5
0/10
0/10 0/10 0/10 0/10 0/10
0/10 1/10
0/10 0/10 0/10
S3 generation, grown in Puerto Rico 1996 winter nursery 67,5 65.7-69.7 1.23 70.8 69.5-72.7 1.07 74.3
84 generation, grown in Ames 1998 72.7-75.9 1.22 12.2 11.3-12.5 0,34
66,3 65,4-66,8 0.40 70.2 69.8-70,5 0.20 74.4 74.0-74.9 0.28 11.7 10,3-12,6 0.73 64.6 62.9-66,4 1.04 69,2 68,8-69,7 0.34 73.3 72.9-73.9 0.48 11.5 II.1-12.3 0,44 65,9 64,5-67.0 0.81 70.3 70.1-70.7 0.19 73.9 73.5-74.4 0.33 11.7 10.9-12.1 0.33 65.1 62.9-66.5 1.28 69.2 68.6-69.9 0.57 73.5 72.9-74.3 0.48 10.9 10.7-11.4 0.26 67.7 65.8-68.7 0,95 71.0 70.2-71,5 0.37 74.8 73.5-75.7 0.65 I I.I 9.5-12,1 0,84
85 generation, grown in Ames 1999 65.2 64.2-66.1 0,60 68,8 68,4-69.2 0.31 72.9 71.8-73.8 0.52 11.4 9.8-12,2 0.75 61.9 56.6-64.0 2.52 68,5 68,1-69.2 0.35 72.8 72.3-73.3 0.34 10.3 9,2-11,7 0,74
85 generation, grown in Puerto Rico, 1999 winter nursery 69.2 68.5-70.2 0.61 72.1 71.3-73.1 0.72 76.0 75.1-77.1 0.72 11.5 10.4-12.3 0.68 66.0 63.0-67.3 1,31 69,7 68.8-70,2 0.40 73.1 68,8-74.7 1,60 11,2 9,5-12,2 0,81 68.1 66.4-70.6 1.16 71.5 70.1-73.7 1.07 75.4 74,0-77.6 1.12 11.3 10.3-12.6 0.69
1 See Table II for an explanation of source identification, The number after the dash signifies the ear number for the pedigree of the Sn b See Table II for an explanation of frequency. c See Table III for Differential Scanning Calorimetry (DSC) parameter descriptions. d s.d, = Standard deviation of gelatinization values among 10 randomly selected kernels analyzed within each line.
line.

Table VI Gelatinization Data of Starches from Single Kernels of Selected Corn Lines from the DK34 Source
Corn Source* Freq." Tog c(°C) T»G(°C) Tcg(°C) AHc(J/g) Corn Source* Freq." Mean Range s.d.° Mean Range s.d. Mean Range s.d. Mean Range s.d.
S3 generation, grown in Puerto Rico 1996 winter nursery DK34-S, 65,4 58,8-67.9 2,50 70.3 68.8-71.3 0.71 74.4 73.7-75.2 0.46 12.2 11.6-13.0 0.60
S4 generation, grown in Ames 1998 DK34-S3-I 0/10 67.0 65,6-68,8 0.98 70.3 68.9-72.9 1.08 73.9 72.6-74.9 0.71 12,5 II.7-13.1 0.50 DK34-Sj-2 0/10 67.5 67,0-68.3 0,42 70.7 70.4-71.2 0.28 74.7 74.4-75.3 0.31 12.4 12.0-13.2 0.38 DK34-Sj-3 0/10 66.5 65.4-68.2 0.83 70.2 69.0-72.4 0.94 74.3 73.1-77.0 1.13 12.0 11.6-12.7 0.36 DK34-S3-4 0/10 65.9 65,1-66,9 0.58 69,9 69.3-70.3 0.33 74.2 73.5-74.8 0.37 11.6 10.8-12.5 0.51 DK34-S3-5 0/10 67.4 66,2-68,4 0,86 71.2 70.6-72.2 0.49 75.4 74.8-76.1 0.45 11.9 11.7-12.3 0.21 DK34-S3-6 0/10 66.7 65.5-67,7 0.83 70.4 69.7-71.1 0.50 74.7 74.0-75.2 0.37 11.22 8.7-12.6 1.41 DK34-S3-7 0/10 67,1 66,0-68,0 0,64 70.7 69.6-71.2 0.51 74.7 73.8-75.3 0.44 11.69 11.2-12.0 0.25 DK34-S3-8 0/10 65,9 64.8-67.1 0.71 70.3 69.5-71.6 0.54 74.0 73.0-74.7 0,48 11.9 11.3-12.9 0.51 DK34-Sj-9 2/10 61,9 59.4-63,7 1.31 68.6 68.0-69.1 0.33 73.9 73.2-75.0 0,55 9.7 7,7-10,8 0.88
S5 generation, grown in Ames 1999 DK34-S3-9-l 0/10 64,0 62,7-65,3 0.76 68.0 67.6-68.8 0.39 722 71.5-72.9 0.51 11.0 10.2-11.9 0.61 DK34-S3-9-2 6/10 61,0 58,3-65,2 1.97 68.2 67.3-69.3 0.65 73.1 72.1-74.2 0.64 10.3 9.6-1 I.I 0.54
S5 generation, grown in Puerto Rico, 1999 winter nursery DK34-S3-9-4 0/10 66,5 65,4-67,8 0.71 70.0 69.4-70.9 0.49 73.9 73.2-75.0 0.58 12,0 11.4-13.4 0.57 DK34-S3-9-5 0/10 63,8 62.5-64,9 0.79 68.8 68.1-69.6 0.43 73.3 72.7-74.0 0.41 11,6 10.2-12.4 0.62 DK34-S3-9-6 1/10 63.2 59.6-66,2 2,00 69.2 68.2-70.8 0.88 74.0 72.0-75.4 1,19 II.1 9.9-12.1 0,80 DK34-S3-9-7 0/10 63,8 62.4-67.1 1,86 69.9 69.5-71,2 0.62 74.9 73.5-76.1 0,84 11.6 10.9-12.4 0,56 * See Table II for an explanation of source identification. The number after the dash signifies the ear number for the pedigree of the Sn line. b See Table II for an explanation of frequency, c See Table III for Differential Scanning Calorimetry (DSC) parameter descriptions. d s.d, = Standard deviation of gelatinization values among 10 randomly selected kernels analyzed within each line,

Table VII Gelatinization Data of Starches from Single Kernels of Selected Corn Lines from the PI82 Source
Corn Freq." T„tiC(°C) TpG (°C) Tcr.(°C) AHc(J/g) Source* Mean Range s.d.d Mean Range s.d. Mean Range s.d. Mean Range s.d.
SI generation, grown in Puerto Rico 1996 winter nursery PI82-S, 2/10 64,7 57.6-68,6 3.48 70.0 67,2-72.2 1.49 74.6 70.8-76.9 1.68 11.1 10.3-12.2 0.61
S 2 generation, grown in Ames 1998 PI82-S,-I 1/10 64,0 60.4-65,8 1.80 70.4 69.4-71.0 0.45 75.8 75.2-77.3 0.59 10.3 9.2-11.1 0.61 PI82-S|-2 I/IO 63,2 60.4-65.1 1.57 69.5 68.4-70.8 0.74 74.9 73.3-75.8 0.72 10.8 9.6-11.7 0.54 PI82-S|-3 0/10 66.3 64.1-68,3 1,30 70,9 69.5 72.1 0.84 76.4 75.5-77.4 0,64 PI82-S,-4 2/10 63,2 60.7-65.3 1,32 69.1 67.4-71.2 1.09 75.7 74.6-77,1 0.66 11.35 10.2-12.2 0.55 P182-S|-5 0/10 64.7 62,0-66,5 1.37 69.5 67.2-70.4 0.87 75.3 73.5-77.0 1.13 10.9 8.9-12.5 0.94 P182-S,-6 0/10 64.4 62.2-66,5 1,52 69.7 68.5-70.7 0.78 74.5 73.3-76.0 0.97 10.6 10.1-11.4 0.46 P182-S,-7 0/10 64.5 62.3-66,4 1.32 69.9 68.7-70.8 0.65 74.6 72.9-75.4 0,77 11.3 9.8-12.1 0.63 PI82-S,-8 0/10 64,1 61,8-65.1 1.18 69.9 69.1-70.6 0.51 75.1 73.5-76.6 0,93 II.1 10.3-12.2 0.61
S3 generation, grown in Ames 1999 PI82-S|-1-I 2/10 61.5 57.1-63,1 1,83 68.9 68.3-69.5 0.45 73.7 72.9-74.6 0,57 11.3 9.9-12.1 0.68 PI82-S,-1-2 6/10 60.4 58-63.8 1.91 67.4 66.7-68.4 0.63 73.1 72.1-73.9 0.54 10.2 8.5-11,3 0.90 PI82-S,-2-l 7/10 60.6 58.3-65.1 2.30 68.5 67.8-69.0 0.35 73.2 72.1-73.7 0,52 11.0 9,9-12,3 0.77 PI82-S|-2-2 6/10 60.9 58,3-63.3 1.70 68.4 67.4-69.8 0.82 73.3 72.6-75.0 0.75 10,7 9,7-11.9 0,67 PI82-S,-2-3 2/10 62.4 60,2-64.3 1,27 68.5 67.0-69.3 0,63 73,6 71.8-74.5 0.81 10.1 9.0-11.3 0.72 PI82-S,-2-4 7/10 60,6 58,6-63,0 1.51 67.4 65.9-68,7 0.91 72.4 71.0-73.5 0.85 9.7 8.4-11.7 0,99 PI82-S,-4-l 5/10 60.4 58.6-62.4 1.33 67.2 66.0-67.9 0.55 73.3 72.6-74.1 0.49 10.1 8.7-11.0 0.62 P182-S,-4-2 6/10 60.7 58,6-63,0 1.58 67.8 67-68.8 0.61 74.0 73.0-75.5 0.83 10.5 8.8-11,9 1.11 PI82-S,-4-3 6/10 60.8 58,3-64,6 1,69 68.4 67.3-69.8 0.75 74.3 73.2-75.4 0.96 11.2 9.6-12.3 0.82 PI82-S,-5-l 1/10 64,4 58,8-67,6 2,86 69.2 67,4-70,7 1,13 73.9 72,7-75.2 0,82 11.0 8,9-12.0 1,05 PI82-S,-5-2 2/10 62,0 59,8-63.7 1.34 69.1 68.5-69,9 0.47 74.9 74.1-76,1 0.61 10.7 9.9-11.9 0.68 PI82-S.-5-3 3/10 61,9 58.4-64.8 2.48 68,9 67.9-69,9 0.81 74.4 73.5-75.2 0.63 10.2 8.35-12.6 1.50
1 See Table 11 for an explanation of source identification. The number after the dash signifies the ear number for the pedigree of the Sn line, b See Table II for an explanation of frequency, c See Table III for Differential Scanning Calorimetry (DSC) parameter descriptions, d s.d. = Standard deviation of gelatinization values among 10 randomly selected kernels analyzed within each line.

Table VII (continued)
Corn Freq." T„Gc(°C) TpG(°C) TcG(°C) AHc(J/g)
Source* Mean Range s.d.° Mean Range s.d. Mean Range s.d. Mean Range s.d. PI82-S, 1-5-4 6/10 61.1 58,2-64.3 2.80 68.4 67.1-69.1 0.79 74.1 73.1-76.1 1.17 II.1 9.8-12.4 0.94 PI82-S, i-6-l 4/10 62.1 59.7-64.3 1.67 68.6 67-69.7 0.73 73.3 72.5-74.3 0.68 10.8 9.7-12.5 0.80 PI82-S, i-6-2 6/10 60,6 59.1-63.0 1.24 67.8 67.1-68.6 0.58 73.8 72.7-74.7 0.64 11.2 10.2-12.5 0.66 PI82-S, i-6-3 9/10 60.3 58,7-61.3 0.77 66.8 66.2-67.7 0.55 72.7 70.8-74,1 1.04 10.7 8.0-12.3 1.23 PI82-S, 1-6-4 6/10 60.1 58,5-64,4 1.77 67.4 66.2-69 0.90 73.2 72,3-74.0 0.56 11.2 10.30-11.6 0.48 P182-S, i-7-l 0/10 65,2 61.9-67.0 1,70 70,8 68,9-71.7 0.81 75.6 74,2-76.3 0.63 10.3 9.6-11.2 0.51 PI82-S, -5-2 0/10 64,7 63.0-66,5 1.04 70,1 68.5-71.7 1.14 74.5 73.3-76.6 1.21 10.1 8.6-12.1 1.02 PI82-S, i-8-2 3/10 62,0 69,5-64.3 1.49 68.8 67,3-70 0.87 74.1 73.0-75.3 0.83 11.2 10.7-11.7 0.38 PI82-S, -8-2 3/10 62.4 60,4-65.0 1.48 67.9 66,3-70.3 1.20 73.7 71.4-76.1 1.69 10.3 9.2-12.0 0.81
S3 generation, grown in Puerto Rico, 1999 winter nursery PI82-S, -1-3 0/10 64.7 61,8-66,6 1.37 68.5 66.7-77.3 0.93 73.1 72.4-74.5 0.69 10.9 10.4-11.9 0.48 PI82-S, -1-4 0/10 65.2 63,5-66,3 0.89 69,3 68,3-70 0,53 73.5 72.4-74,7 0.63 10.8 8.2-12.3 1.12 PI82-S, -2-5 0/10 67.3 65,6-69,4 1.37 70,8 69.3-72.5 1.24 74.7 72.8-76.9 1.54 11.0 7.7-13.2 1.7 PI82-S, -2-6 0/10 67.9 65,5-69,9 1.74 71.6 69.3-73.5 1.51 75.9 73.2-78.0 1.80 10.6 8.0-12.9 1.69 PI82-S, -4-4 0/10 65,4 64,5-65,9 0,62 69.7 69.5-70 0.21 74.0 73.6-74.9 0.63 10.1 9.3-10.6 0.61 PI82-S, -5-3 0/10 66,1 64.9-67,8 0.88 70.5 69.1-71.7 0.74 75,2 73.7-77.1 1.02 11,0 9.8-12,4 0.73 P182-S, -5-4 0/10 65.4 63.3-67.1 1.28 70.6 69.6-71.4 0,53 75.3 74.7-76.8 0.69 I I I 10.3-12.0 0.51 PI82-S, -5-5 0/10 64,8 62.1-67.4 1.59 70.6 69,3-71.9 0.81 75.1 73.4-76.0 0.77 10.8 7.9-12.3 1.67 PI82-S, -5-6 0/10 65,6 62.1-68,3 1.98 70.3 69.4-71.4 0.79 75.2 73.7-76.3 0.84 10.5 9.3-11.5 0,73 PI82-S, -5-7 0/10 66,6 65-67.2 0.66 70.9 69.4-71.7 0.64 75.3 73.8-77.1 0.88 11.I 9.2-12.0 0,86 PI82-S, -5-8 0/10 65,7 61,0-67.6 2.06 71.3 69.8-72.7 0,84 75.5 74.3-76.5 0.80 10.9 8.5-12.5 1.26 PI82-S, -6-5 0/10 66,6 64,5-69,1 1,59 70.2 68.3-72.6 1.35 74.6 72.4-77.2 1.46 11.2 10.3-11.9 0.57 PI82-S, -6-6 0/10 65,7 64.2-67,1 0,94 69.6 68.3-70.7 0.67 74.1 72.4-74.7 0.71 11.2 9,5-12.32 0.78 PI82-S.-6-7 0/10 65,0 63,6-66.6 0.36 69.8 68.7-70.9 0.75 74.8 74.0-75.5 0.54 11.4 10.9-12.9 0.59 PI82-S, -6-8 0/10 66.6 64,3-67.8 1.13 70.2 69.0-71.1 0.77 74.9 73.6-76.3 0.88 11.3 10.1-12,5 0,81 PI82-S, -8-3 0/10 65,6 61,1-67,7 1.96 70.3 69-71.5 1.01 75.5 73.8-77.0 1.27 9,8 7.8-11.3 1.12 PI82-S, -8-4 0/10 64.9 62,1-67,5 1.66 69.7 68.1-71.3 0.92 75.0 73.5-76.9 1.06 10,3 9,2-11.3 0.81 P182-S, -8-5 0/10 65,6 63,5-67.4 1,18 70.2 68,3-72.2 1.07 74.6 72.4-76.4 1.30 11,3 9.9-12.4 0.75 PI82-S, -8-6 0/10 68,0 65.8-71.2 1,91 72.5 70.0-74.7 1.61 76.2 74.3-77.8 1.00 10.6 7.5-11.6 1.40 PI82-S, -8-7 0/10 65,2 63.9-67.7 1.18 70.4 69.7-71.2 0.81 74.8 73.2-77.1 1.33 11.2 9.8-12.2 0.70

Table VIII Gelatinization Data of Starches from Single Kernels of Selected Corn Lines from the PI83 Source
Corn Source*
Freq." TOG c(°C) Tpc(°C) Tcg (°C) AHG(J/g) Corn Source*
Freq." Mean Range s.d.° Mean Range s.d. Mean Range s.d. Mean Range s.d.
SI generation, grown in Puerto Rico 1996 winter nursery PI83-S, 1/10 62.6 61.0-64.4 1.00 69.0 65.8-70.6 1.51 74.3 73.0-75.3 0.81 11,0 10.3-11.8 0,39
S2 generation, grown in Ames 1998 PI83-S,-1 8/10 60,9 59.1-64,6 1,69 69.3 67.3-70.9 1.15 75.9 75.2-76.4 0.35 11.0 10.4-12.3 0.64 PI83-S,-2 5/10 61.3 59.5-63,5 1.38 71.1 70.5-71.6 0.36 76.7 75.9-77.4 0.54 11.5 11.0-12.1 0,32 PI83-S,-3 1/10 62.3 60,0-65,7 1,53 70.2 68.9-71.7 0.87 76.3 75.2-78,2 0.96 11.1 9.2-13.1 1.29 P183-S,-4 1/10 62.8 60,0-64,4 1.5 70.2 69-70,8 0.55 76.3 75,0-77.0 0.74 10.6 9,9-11.3 0.48 PI83-S,-5 6/10 61.1 59.3-63.6 1.37 70.3 68,8-71.1 0.84 75.8 74,9-77,7 0.84 10.9 10.5-11.4 0.37 PI83-S.-6 2/10 62.8 58.1-66.6 2.68 70.3 68.7-71,1 0.69 75.4 74.0-76.1 0.76 10.1 9.0-11,8 0.81 PI83-S|-7 9/10 60.6 58.9-62.6 1.15 70.9 70.3-71.8 0,48 76.0 74.9-77.0 0.59 11.2 10.5-12.3 0,57 PI83-S,-8 1/10 61.6 59,2-62.6 0.98 69.8 69.2-70,7 0,55 76.1 74.7-77.8 0.83 11.0 10.5-11.7 0,36
S3 generation, grown in Ames 1999 PI83-S,-4-l 8/10 60,0 56.9-66.1 3.55 69.5 68.3-70.4 0.75 73.4 72.9-74.2 0.62 10.6 9.5-12.4 1.14 PI83-S,-4-2 0/10 65.0 62.1-66.2 1,68 69.2 68.7-69.8 0.53 73.3 73.0-73.6 0,28 10.3 9.5-11.0 0.63 PI83-S.-4-3 0/10 65,1 64,2-65,9 0.62 69.3 68.8-70.0 0.46 73.1 72,5-73.6 0,51 11.0 10.7-11.2 0,20 PI83-S,-7-l 0/10 66.7 65,7-67,6 0,72 70.0 69.2-71 0,72 73,8 72.8-74.5 0.69 11.9 10.9-12.8 0,69 PI83-S,-8-l 6/10 61.5 59.5-66.4 1.92 68.8 67.8-69.8 0.60 73.9 73.8-74.5 0.39 11,5 9,9-12.3 0.84
S3 generation, grown in Puerto Rico, 1999 winter nursery PI83-S,-I-I 0/10 63,3 62.2-65.2 0.96 68.3 67,5-69,0 0.48 73.2 72.4-73.7 0.44 10.4 7.9-11.8 1.10 PI83-S,-l-2 0/10 63,5 62.5-65.0 0,69 68.3 67.7-69,1 0.48 73.2 72.1-74.1 0.79 10.3 8,2-12.0 1.16 P183-S,-l-3 0/10 65,7 62.8-71.2 2,98 71.4 68,2-74,8 2.59 75.6 73.2-78,2 2.01 10.3 9.16-11.7 0,89 PI83-S|-l-4 0/10 68,2 66.7-69,7 1.2 73.0 72-73.7 0.67 76.5 75,9-77.7 0.85 9.4 8.9-9.8 0.33 PI83-S,-l-5 0/10 62,9 62,0-63.8 0.63 68.2 67.7-68.5 0.33 72.8 71,8-73.1 0.59 10,6 9.9-11.6 0,62 PI83-S |-4-3 0/10 65.7 63,8-66,8 1,45 70.0 69-70.7 0.71 74.1 73.0-74.7 0.67 10.4 8.6-11.3 1,01 PI83-S|-7-2 0/10 64.7 63.1-65.9 0,96 69.9 69.6-70 0.17 74,5 73.7-75.1 0.51 11.4 10.5-11,9 0,49 PI83-S.-7-3 0/10 64.4 63.5-65.9 0,87 69,4 69.3-69.7 0.18 74.8 73.9-76.7 1.33 11.5 9.9-12.6 0.51
" See Table II for an explanation of source identification. The number after the dash signifies the ear number for the pedigree of the Sn line, h See Table II for an explanation of frequency, c See Table III for Differential Scanning Calorimetry (DSC) parameter descriptions, u s.d, = Standard deviation of gelatinization values among 10 randomly selected kernels analyzed within each line.

128
Table IX Significance of Genotype Effects and Environment Effects and their Interaction from Analysis of
Variance of Starch Gelatinization Properties Source of Variation df* Starch Gelatinization Properties Source of Variation df*
T0 °(°C) Tp(°C) Tc(°C) AH(J/g) Environment I **< ** ** *
Source 5 *
Environment x Source 5 *
S„.ri Line (Source) 9 Environment* S„T| Line (Source) 9 ** ** **
S„-r: Line (S„+, Line (Source)) 64 ** ** ** **
* df = degree of freedom. b See Table III for Differential Scanning Calorimeter (DSC) parameter descriptions. c *, ** indicate significance at P< 0.10 and P < 0.05, respectively.

129
DK8-4
DKSs4-4
DK8-4-5
DK8-4-5
Temperature (°C) Fig 1. Gelatinization thermograms of starches from progeny lines of DK8-4.

130
CHAPTER 7. GENERAL CONCLUSION
We have currently developed several novel GEM corn lines, adapted by exotic
breeding crosses, which can produce starches with improved functional properties. Starches
from these new lines will also provide a good vehicle for structure-function study. The
underlying objectives of this research work were to evaluate functions and structures of
starches from developmental lines, and to establish relationships between the fine structure
and functional properties of the starches. A secondary objective was to confirm the
advancement of selected functional traits into the next generation of corn. The work
published in this dissertation successfully meets the objectives.
The effect of different starch extraction procedures designed for use in the laboratory
on starch chemical composition and physical properties were studied in the chapter 3. From
this study, it was suggested that the sedimentation procedure is preferred for laboratory
starch extractions especially when quantity of sample is small because of the lowered protein
content in starch and higher starch yields. 10 kernels is preferred over 2 or 5 kernels with the
same total volume of wash water. Longer steeping time yielded starch with lower protein
content and higher yield. Soaking seeds for less than 48 hr is preferred to minimize
annealing of starches and, thus, altering starch thermal properties. The procedure optimized
in this paper was used in research conducted within the rest of the dissertation.
Chapter four and chapter five evaluated functional and structural properties of
starches from exotic x adapted inbred lines and exotic breeding crosses (exotic populations x
adapted lines), and to establish relationships between the fine structure and functional
properties of the starches. The starches from the com lines identified in this study are of
interest because of unusually low T0Q. Two independent gelatinization transitions, located in
different granules, were found in some starches. All selected starches from the
developmental lines had significant different pasting properties and gel properties than did
starch from normal corn inbreds Mo 17. Significant differences were observed in starch-
granule size-distributions and shape-distributions of the selected starches. The different
gelatinization and pasting properties could be explained by the branch chain-length pattern
of the amylopectin. Starches with a lower peak onset gelatinization temperature (T0c), had a
lower normalized concentration of chains with a degree of polymerization (dp) of 15 to 24

131
and/or a greater normalized concentration of chains with a dp of 6 to 12. These studies will
aid in understanding structure-thermal property relationships of starches, and in identifying
corn lines of interest for commercial breeding.
Effect of environment and genotype on the gelatinization properties of starches from
developmental corn lines was studied in chapter six. Gelatinization properties of starches
from exotic corn lines and their derivatives when grown 1) during three successive years;
and 2) in both temperate and tropical environments were evaluated.Unusual thermal
properties (low Too ) were fixed in some progeny lines. Environmental factors had a
significant effect on the thermal properties of starch, and a significant interaction between
environment and genotype was observed. These results suggest that introgression of adapted
germplasm with useful genes from exotic corn would increase the available genetic
variability for starch functionality and allow the development of hybrids with important
value-added traits.

132
ACKNOWLEDGEMENTS
I sincerely thank my three professors, Dr. Pamela White, Dr. Jay-lin Jane, and Dr.
Linda Pollak, not only for their support and encouragement, but also for their intellectual
contributions to my development as a scientist. I am extremely grateful to Dr. White for her
numerous proofreads that greatly improved this work. I am very lucky to work with Dr. Jane.
Her insightful ideas and landmark work on starch chemstry inspired me in many ways. I am
deeply thankful to Dr. Pollak. She did most of the field works for this research. Her hard
working was the basis for the success of this work.
I also thank my graduate committee members Dr. Anthony Pometto and Dr. Peter
Keeling for the advice and time given me.
I specially thank Dr. Hugo Franzen, my previous supervisor and a pssionate scienist,
for his inspiration and being a good model for me.
To my lab-mates, thanks for the fun and support. I particularly thank Dr. Kit-sum
Wong, Dr. Sang-ho Yoo, Dr. Zihua Ao and Sue Duvick for their technical support and
friendship. I would also like to thank Jovin Hasjim, Susie Gan, and many other student
employees for their assistance in the laboratory.
I dedicate my dissertation to my parents. My dad, who introduced me to chemsitry in
the first place, always encourages me to be an independent thinker and teaches me how a
career in science can be a worthy part to pursuit. I thank my parents for unconditional
support throughout the years. Their faith in me has enhanced my ability to go through any
difficulties and to succeed in the end. I thank my dear brother Yuyang, with whom I share a
lot of growing-up. He always pretends to be an old brother for me©, even though he is two
years younger than I am. Finally and mostly, I would like to thank my dear husband Jun for
all the happiness he has brought to my world.