Embed Size (px)
Citation preview

Developing and validating a technology‑based diagnostic assessment using the evidence‑centered game design approach: an example of intrapreneurship competenceSandra Bley*
Abstract
Background: Educational experts commonly agree that tailor-made guidance is the most efficient way to foster the learning and developmental process of learners. Diagnostic assessments using cognitive diagnostic models (CDMs) have the potential to provide individual profiles of learners’ strengths and weaknesses on a fine-grained level that can enable educators to assess the current position of learners. However, to obtain this necessary information a strong connection has to be made between cogni-tion (the intended competence), observation (the observed learners’ responses while solving the tasks), and interpretation (the inferences made based on the observed responses of learners’ underlying competencies). To secure this stringent evidence-based reasoning, a principled framework for designing a technology-based diagnostic assessment is required—such as the evidence-centred game design (ECgD).
Aim: With regard to a diagnostic assessment, three aspects are of particular impor-tance according to the ECgD approach: (I) the selection of a measurable set of compe-tence facets (so-called skills) and their grain-size, (II) the constructed pool of skill-based tasks, and (III) the clear and valid specified task to skill assignments expressed within the so-called Q matrix. The Q matrix represents the a priori assumption for running the statistical CDM-procedure for identifying learners’ individual competence/skill profiles. These three prerequisites are not simply set by researchers’ definition nor by experts’ common sense. Rather, they require their own separate empirical studies. Hence, the focus of this paper is to evaluate the appropriateness and coherence of these three aspects (I: skill, II: tasks, and III: Q matrix). This study is a spin-off project based on the results of the governmental ASCOT research initiative on visualizing apprentices’ work-related competencies for a large-scale assessment—in particular, the intrapreneurship competence of industrial clerks. With the development of a CDM I go beyond the IRT-scaling offering the prerequisites for identifying individuals’ skill profiles as a point of departure for an informative individual feedback and guidance to enhance students’ learning processes.
Methods: Therefore, I shall use a triangulated approach to generate three empirically based Q matrix models from different sources (experts and target-group respondents), inquiry methods (expert ratings and think-aloud studies), and methods of analyses (frequency counts and a solver–non-solver comparison). Consequently, the four single
Open Access
© The Author(s) 2017. This article is distributed under the terms of the Creative Commons Attribution 4.0 International License (http://creativecommons.org/licenses/by/4.0/), which permits unrestricted use, distribution, and reproduction in any medium, provided you give appropriate credit to the original author(s) and the source, provide a link to the Creative Commons license, and indicate if changes were made.
RESEARCH
Bley Empirical Res Voc Ed Train (2017) 9:6 DOI 10.1186/s40461‑017‑0049‑0
*Correspondence: [email protected] Munich School of Management, Institute for Human Resource Education and Management, Ludwig-Maximilians-University in Munich, Ludwigstraße 28/RG, 80539 Munich, Germany
Page 2 of 32Bley Empirical Res Voc Ed Train (2017) 9:6
Q matrix models (researchers’ Q matrix generated within the task construction process and the three empirically based Q matrix models) were additionally matched by dif-ferent degrees of overlap for balancing the strengths and weaknesses of each source and method. By matching the patterns of the four single Q matrix models, the appro-priateness of the set of intrapreneurship skills (I) and the pool of intrapreneurship tasks (II) were investigated. To identify and validate a reasonable proxy for the task to skill assignments for selecting the best fitting Q matrix model (III), the single as well as the matched Q matrix models where empirically contrasted against N = 919 apprentices’ responses won and scaled up within the ASCOT-project using psychometric proce-dures of cognitive diagnostic within the DINA (Haertel in J Educ Meas 26:301–323, 1989) model.
Results: The pattern matching resulted in a set of seven skills and 24 tasks. The appropriateness of these results was emphasized by model fit values of the different Q matrix models. They show acceptable up to good sizes (SRMSR between .053 and .055). The best fitting model is a matched Q matrix of which the match is not that strict or smooth with regard to the degree of overlap.
Conclusions: The study provides a principled design for a technology-based diag-nostic assessment. The systematic and extensive validation process offers empirical evidence for (I) the relevance and importance of the specified intrapreneurship skills, (II) tasks prompting the intended skills, and (III) the sophisticated proxy of real cogni-tive processes (in terms of the Q matrix), but also give hints for revision. This—within a diagnostic assessment—preliminary work aims at identifying the best-fitting Q matrix to enable the next step of depicting learners’ individual strengths and weaknesses on a sound basis.
Keywords: Diagnostic assessment, Cognitive diagnostic assessment, Principled assessment design, Evidence-centered design, Technology-based assessment, Vocational education and training intrapreneurship
BackgroundArising from different research streams we know that informative feedback, guidance etc. is the most efficient method for fostering and supporting learners’ learning and development processes and outcomes (Hattie 2012). It has therefore become a decisive competence facet within teacher standards around the world: in Germany (KMK 2004), in Switzerland (Oser 1997) and internationally (Interstate Teacher Assessment and Sup-port Consortium 2011). In the workplace learning literature, comparable concepts are discussed, for example, “guidance” by Billett (2002) or “learning support” by Tynjälä (2013). But how can one do this? In order to realize such fine-grained and informative feedback, the various authors suggest (a) addressing the learners where they currently are, (b) working out their strengths and weaknesses to support them individually, according to their particular needs, and (c) designing, adapting and delivering tailor-made instructions and opportunities to learn. But how can one discover such individual information? Currently, most educators rely on test scores to differentiate between high and low achievers within the group of learners. When the average percentage of low achievers has not reached the class or course goal more support is necessary. Therefore, the majority of educators continue with teaching and assessing the whole pool of tasks. Some other educators are applying item response theory (IRT) to obtain information about learners’ abilities corresponding to item difficulty. This information enables the
Page 3 of 32Bley Empirical Res Voc Ed Train (2017) 9:6
educator to keep teaching and training on that particular task that has been identified as difficult. The educator can also work further with clearly identified groups on particular achievement levels and collections of tasks with the corresponding difficulty in order to strengthen the ability of the students on that particular achievement level and to guide them to the next performance level.
However, on the basis of assessments using the cognitive diagnostic model (CDM; e.g. Roussos et al. 2007) (hereafter referred to as “diagnostic assessments”), educators can obtain feedback on a much more informative and fine-grained level. This feedback includes information about (a) the percentage of the whole group of learners master-ing a specific competence facet (skill), (b) the percentage of different groups of learners with equal profiles of strengths and weaknesses (skill classes), and (c) individual compe-tence profiles for each learner, which entails information about particular competence facet(s) a learner is lacking or has weaknesses in, but also his/her particular strengths which were used to solve the tasks (individual skill profiles) (Helm et al. 2015). CDMs are able to fulfil the entitlement of a plurality of politicians, scientists, teachers, trainers, and other stakeholders of educational research that assessments can be used as a tool for instructional design and for directly supporting learning by evidence-based informa-tive feedback (e.g. Helm et al. 2015; Nichols and Joldersma 2008). Therefore, this type of assessment analysis can be used to describe examinees’ capabilities, explain exami-nees’ level of performance, allow customized instruction tailored to examinees’ abili-ties, screen examinees for further advancement or for other selection purposes, and to classify learners into different groups (so-called skill classes) according to indicated skill states (Leighton and Gierl 2007).
However, independent from the intended assessment information (e.g. achievement levels on the basis of IRT or individual competence profiles on the basis of CDMs) assessment experts are generally in agreement that a principled assessment design is des-perately needed to make valid interpretations on learners’ underlying competencies, on the basis of observable problem-solving activities (Pellegrino 2010; Shavelson 2012; Wil-son 2005). The assessment triangle (Pellegrino et al. 2001), as a crucial assessment design concept, is based on the rational of evidence-based reasoning and links three corners in a coherent manner: (A) the cognition corner, (B) the observation corner, and (C) the interpretation corner. The cognition corner (A) provides claims about learners’ underly-ing latent competencies in the domain of interest which is defined within the curricu-lum. A coherent observation corner (B) provides a set of assumptions about the kind of situations and tasks that are needed to prompt learners to use the claimed latent compe-tencies by showing the proposed evidences. The interpretation corner (C) represents the most suitable statistical model (mostly still imperfect) to translate examinees’ responses (observation) into helpful intended information on learners’ competence (cognition). A practical step by step approach to implement ideas of the assessment triangle is the evidence-centered design (ECD: Mislevy and Haertel 2006; Roussos et al. 2010), more specifically the evidence-centered game design (ECgD: Mislevy et al. 2014) for tech-nology-based learning and assessment environments. Authors of the ECgD framework structure their process in three parts. Part 1 involves an extensive “domain analysis” and the “domain modelling” to identify “big ideas” of acting and learning in that particular domain. Part 2—the core of the framework—is focused on the assessment development

Page 4 of 32Bley Empirical Res Voc Ed Train (2017) 9:6
by defining and evaluating the three components of the “conceptual assessment frame-work”: (A) the competence model (cognition corner), (B) the task model (observation corner), and (C) the statistical model (interpretation corner). As depicted by the added brackets, as well as in Fig. 1, the three components of part 2 of the ECgD correspond with the three corners in the assessment triangle. Finally, the sounded assessment can be implemented in practice to deliver the intended feedback information (part 3).
Applying the principled assessment design ideas of the ECgD to diagnostic assess-ments using statistical CDM procedures three crucial characteristics are important to consider (Roussos et al. 2007; Rupp et al. 2010): (I) their underlying deep level of grain-size expressed by domain-specific skills (Rupp et al. 2010), (II) their skill-based con-structed tasks, which are able to prompt these intended skills (de la Torre and Minchen 2014), and (III) their need for a substantive assignment of skills to tasks expressed within a so-called Q matrix (Tatsuoka 1983). Skills (I) are fine-grained facets of a competence. Following the principles of the ECgD implies that an intended interpretive argument on a fine-grained skill level requires a sounded specification of a manageable set of skills on the basis of the competence model (A). On a coherent level of grain size, tasks (II) have to be able to prompt these intended skills, so that their construction has to be funda-mentally diagnostic. Consequently, skills (I) connect the competence model (A: cogni-tion corner) and the task model (B: observation corner) by being the target for the task (II) development. The Q matrix (III) is a specific need for psychometric models of the CDM family, wherein the task to skill assignments are specified. That means, for each task it has to be identified which skill(s) is/are intended to be measured by a particular task. Because it describes hypothesis about variations in task performances, the statisti-cal model (C: interpretation corner) is linked to the task model (B: observation corner) of the assessment triangle (Fig. 1).
Fig. 1 Combining the assessment triangle and the evidence-centered (game) design for an application to cognitive diagnostic models (adapted from Pellegrino et al. 2001, and de la Torre and Minchen 2014)

Page 5 of 32Bley Empirical Res Voc Ed Train (2017) 9:6
State of the art in diagnostic assessments
At present, there are only a rare number of diagnostic assessments fitting the assump-tions of principled assessment design and the use of psychometric models of the CDM family (de la Torre and Minchen 2014). Existing diagnostic assessments that work effec-tively capture small and scientifically well-researched constructs of primary school cur-ricula like “fraction subtraction ability” (e.g. (de la Torre 2008; de la Torre and Douglas 2004; Leighton et al. 2004; Tatsuoka 1983), “reading comprehension ability” or “listening comprehension ability” (Jang 2009; Li and Suen 2013; Sawaki et al. 2009). The alternative application of originally IRT-based assessments for diagnostic purposes (so-called ret-rofitting studies) yield continuously unacceptable diagnostic classification results (Gierl and Cui 2008; Leighton et al. 2004). These unsatisfactory consequences can mostly be justified by the unique nature of diagnostic assessments (I: fine-grained skills; II skill-based constructed tasks, and III sounded Q matrix) missing a principled assessments design (e.g. ECgD) for diagnostic purposes (Habermann et al. 2008; Rupp and Templin 2008). This is because a diagnostically measureable set of skills (I), a successfully working pool of tasks (II), and a correctly specified Q matrix (III) cannot easily be determined by using a certain source (e.g., researchers or experts), a certain method of inquiry (e.g., document analysis or expert rating), or a certain method of analysis (e.g., counted fre-quencies of expert ratings) (Kunina-Habenicht et al. 2012). For this reason, the process of development and validation of diagnostic assessments’ crucial aspects (I: skills, II: tasks, and III: Q matrix) requires special study.
Diagnostic assessment for intrapreneurship competence
In contrast to existing diagnostic assessments for well-defined domains, in this study I emphasise intrapreneurship (IP) as a professional competence that is much more com-plex and transferable for work and life (so-called twenty first century-skills: Pellegrino 2014; Pellegrino and Hilton 2012; Weber et al. 2014). With the exception of the work of Weber and colleagues (2014, 2015, 2016a, b) within the ASCOT1 research initiative, intrapreneurship has been subject to little research to date. Therefore, I refer to their work where IP competence has been conceptualized, operationalized, and scaled up by IRT procedures with the purpose of comparing groups within a large-scale assessment (LSA). Their assessment design also follows the steps of the ECD. At this point, all three ECD parts (1 domain analyses and modelling, 2 conceptual assessment framework, and 3 assessment implementation and delivery) have been completed. In particular, I refer to their domain analysis and modelling material, their competence model, their task model,2 and the data base of their main study.
The ASCOT project was run within the German apprenticeship program of industrial clerks. In Germany about half of all school graduates start an apprenticeship program each year (Federal Ministry of Education and Research 2014). More precisely, the target group of industrial clerk apprentices was chosen because (a) their program facilitates
1 The main purpose of the research initiative ASCOT was the development of valid and reliable instruments for meas-uring competencies in the field of vocational education and training. Thereby, the preferred models of traditional IRT (item response theory) were used to measure in a first step more overarching competence dimensions (Beck et al. 2016).2 From the outset, the tasks for measuring Intrapreneurship (part of the CoBALIT project) were constructed for addressing two purposes (the monitoring perspective measurable by IRT as well as the diagnostic perspective measur-able by CDM). Although the assessments of both perspectives include the same tasks, they differ in their formation.

Page 6 of 32Bley Empirical Res Voc Ed Train (2017) 9:6
central job tasks in the area of business and commerce which were comparable across six European countries (Breuer et al. 2009),3 (b) a considerable amount of every-day work tasks is required for innovative behavior and project management abilities (Trost and Weber 2012; Weber et al. 2015), and (c) IP is a fixed learning goal of their official German curriculum and anchored within their oral examinations (KMK 2002).
By applying CDM procedures to intrapreneurship competence I go beyond the exist-ing studies, because of the identification of groups with similar strengths and weak-nesses and of learners’ individual skill-profiles enabling an informative feedback. As innovative behavior and IP are decisive twenty first century skills (Pellegrino and Hilton 2012) education and, in particular, vocational education and training in the field of busi-ness and commerce have to equip young people accordingly. Previous studies show that on average apprentices are already achieving IP on a medium to high proficiency levels as a result of their German apprenticeship program (Weber et al. 2015, 2016b). How-ever, as innovative behaviour/IP competence is a decisive issue at current workplaces it should be supported by individual guidance and informative feedback to bring more apprentices up to a higher level of achievement.
Diagnostic assessment design, by using the ECgD, stresses the coherent and elabo-rately validated specification of several indicating factors for providing valid informative feedback information. Building on the existing materials (domain analyses and model-ling) and results (competence model and task model) of Weber and colleagues, the focus of this study is to specify and evaluate the crucial aspects of a coherent diagnostic assess-ment design: (I) the description of a measurable set of fine-grained skills, (II) the evalu-ation of the pool of skill-based tasks, and building on this, (III) the identification of the best proxy of skill to task assignments (Q matrix).
Structure of the paper
After outlining the theoretical considerations of diagnostic assessments using CDM, I shall introduce the technology-based diagnostic assessment design for IP using the ECgD with particular regard to theoretical assumptions about the set of skills (I), the pool of tasks (II), and the Q matrix (III). The empirical part concerns the validation process of these aspects by capturing empirical evidence on apprentices’ underlying cognitive processes in a triangulated approach (different sources, inquiry, and analysis methods) and depicting them in three empirically based Q matrix models (instruments for pattern matching). By matching the patterns of these empirically based Q matrix models with those of researchers’ Q matrix, which were generated within the task con-struction process, an appropriate set of IP skills (I) and a coherent pool of tasks (II) can be identified. Because no source and no method is beyond limits it is expected that an overlap of all the theoretically and empirically constructed Q matrix models will fit apprentices’ underlying cognitive process best. By varying the degree of overlap four, so-called matched Q matrix models were constructed (as additional instruments for empir-ical Q matrix evaluation). Pattern matching and empirical evaluation procedure will be presented in the section analyses. Finally, the results will be summarized, discussed, and concluded.
3 More information on the German apprenticeship system and categories of comparison are given with Busemeyer and Trampush (2012), and Weber and Lehtinen (2014).
Page 7 of 32Bley Empirical Res Voc Ed Train (2017) 9:6
Theoretical considerations on diagnostic assessments using cognitive diagnostic models (CDMs)Psychometric models of the CDM family are probabilistic categorical-latent trait meas-urement models with the purpose of extracting multidimensional individual competence profiles (Rupp and Templin 2008). In the following, latent traits are labelled as compe-tencies and their fine-grained operationalizations as skills. CDM characteristics share several features with traditional item-response theory models (e.g., latent trait model, probabilistic model, item-response-patterns), as well as with confirmatory factor analy-sis (CFA: e.g., complex loading structure, a priori defined skill to task assignments as depicted within the Q matrix). Two of the most important differences are that assess-ments based on IRT are mostly uni- or low-dimensional and that skills in CDMs mostly are conceptualized as dichotomous (instead of continuous) and, therefore, a person’s ability, is expressed in terms of skill-master versus skill-non-master (Kunina-Habenicht et al. 2012).
CDMs underlying idea is that the probability to be a task-solver depends on the com-bination of (a) the person’s skill-vector (=all skills that a person is able to master) and (b) the task’s skill-vector (=all skills that are needed to solve the task correctly).4 I am assuming here,5 that skills are non-compensable.6 That means if a person is master of all skills needed for a task, he/she has a high probability of solving this task correctly. But if he/she has a skill-deficit in at least one of the skills needed for a particular task, he/she has only a low probability of solving the task correctly. Consequently, a person with a certain skill-deficit (e.g., is not “able to work with domain specific tools”: TOOL) in its skill-vector will, for example, have a low probability of solving tasks which require the application of IP specific tools “TOOL”, irrespective of other needed skills. The other way around, a person who fails all tasks with “TOOL” in their skill-vector can be diagnosed with a high probability as a “TOOL”-non-master. Summarizing, the deterministic form of a CDM can be described as follows: if one knows a person’s state of mastery for all necessary skills for a task, then the correctness or incorrectness of the task solution for this examinee is clearly designated (Roussos et al. 2007, p. 20).
The correctness of this conclusion also depends on other factors (e.g., guessing or slipping; Roussos et al. 2007), mainly on a fundamentally diagnostic assessment model specified by the Q matrix. The importance of correctly specified Q matrices can be dem-onstrated by the following example of the “TOOL”-non-master: if a task’s skill-vector claims erroneously for “TOOL”, then obviously “TOOL” is not necessary for solving the task correctly; hence, the “TOOL”-non-master has—given he/she is a master of all the other skills of the task’s skill vector—a high probability of solving this task correctly. Under the assumption of a correctly specified Q matrix, the “TOOL”-non-master shows
4 Thereby, the diagnostic-assessment-based CDM approach basically differs from traditional instructional assumption in VET, in that each challenge/task has to comprise a complete vocational action (from perceiving until reflection) and that, therefore, in each challenge/task all skills are necessary (e.g., Oser et al. 2009). However, VET researchers generally agree that on a fine-grained consideration, context-based vocational challenges vary enormously and that therefore—although all skills are basically needed—some specific skills play a more important role than others. For the diagnostic purpose of CDMs—to identify apprentices’ strengths and weaknesses—the focus on the most important skills per task is essential.5 See “I. Skills: theoretical assumptions of diagnosable IP skills” section.6 Skills are non-compensable if a lack of one skill cannot be compensated by another skill (e.g., George and Robitzsch 2015).
Page 8 of 32Bley Empirical Res Voc Ed Train (2017) 9:6
an ambivalent response pattern concerning the skill “TOOL”. That means, misspecified Q matrices have a strong impact on poor model-data-fit and, therefore, on the quality of a person’s diagnostic information.
But unfortunately this developmental step cannot easily be taken. There have been dif-ferent methods used so far: (a) apply existing test specification, if a skill to task assign-ment already exists (Xu and von Davier 2008), (b) use eye-tracking technology which records individuals’ eye movement data during stimulus processing to understand underlying solving processes (Gorin 2007), (c) invite a group of subject matter experts to comprehend underlying cognitive processes of target groups’ task solution processes (Ravand 2015; Sawaki et al. 2009; Sorrel et al. 2016), and (d) extract skill to task assign-ments on the basis of target group think aloud protocols, when they solve the tasks (Gao and Rogers 2011; Jang 2009; Li and Suen 2013; Wang and Gierl 2011). Unfortunately, none of the mentioned methods are without limitations (Kunina-Habenicht et al. 2009; Li and Suen 2013). For this reason, I have used a triangulation of different sources, inquiry and analysis methods for balancing the advantages and disadvantages of each method. Because there is no existing skill to task assignment for IP tasks (a), and as eye-tracking technology is not useful for dynamic technology-based computer simulations, as is the case for the IP assessment (see also “III. Q matrix: theoretical assumptions of skill to task assignments” section) (b), the two last mentioned approaches will be applied in this study. However, how well the Q matrix will fit the data is basically dependent on (I) an appropriate specified set of skills, in combination with (II) a representative depict domain by tasks, because skills and tasks are the two elements of (III) the Q matrix. At this point, it should be noted, that due to the number of possible combinations of tasks (especially considering time restrictions), only a limited number of skills can be meas-ured. CDM experts suggest not more than 7–10 skills, and a set of at least 15–20 tasks (de la Torre and Minchen 2014; Roussos et al. 2007).
Technology‑based diagnostic assessment design for IP using the ECgDI. Skills: theoretical assumptions of diagnosable IP skills
For specifying an initial set of skills, I refer to the competence model for IP competence developed by Weber et al. (2014, 2015, 2016a, b) on the basis of an extended domain analysis of IP in the German apprenticeship programs.7 The following “big picture” appeared for modelling IP competence, especially for diagnostic purposes. The term “IP” is defined in accordance with Perlman et al. (1988, p. 14). An IP person is an entrepre-neur within a firm (Antončič and Hisrich 2001; Wunderer and Bruch 2000) who gener-ates and initiates innovative projects and who tries to realize these ideas via project work (Korunka et al. 2009). Typical IP project themes in (apprenticeship) practice are, for example, to promote an event, to introduce a new product, to regular customers, or to run a fashion show. Representative challenges within these projects are to recognize opportunities, to generate a new project or idea, to search for and to structure
7 The study builds on the extensive preliminary work of Weber, Bley, and colleagues for understanding IP activities in the apprenticeship program of industrial clerks (Bley et al. 2015; Weber et al. 2014, 2015). The domain analysis entails cur-ricular (training regulations for schools and for the workplace), instructional (school-books, N = 6), classroom observa-tions with follow-up target group surveys, as well as teacher and trainer interviews and assessment analyses (final exam reports held by the Chamber of Commerce, N = 205). Additionally, job advertisements (N = 437) to ensure ecological validity and scientific literature about intra-/entrepreneurship and innovative behavior in the fields of business, psychol-ogy, and pedagogic (N = 147 studies) were processed.

Page 9 of 32Bley Empirical Res Voc Ed Train (2017) 9:6
information, and to plan and to work with domain-specific terms. Typical observable evidence of apprentices’ IP-specific behavior is: to select relevant information from given documents or to decide among different alternative solutions in view of disturbances (changes in markets). The underlying skills to solve tasks correctly are not compensable, meaning that a low ability (lack) of a specific skill (e.g., TOOL) of one’s person-skill-vec-tor cannot be compensated by a high ability of another skill (e.g., INFO). Hence, persons without the skill TOOL in their person-skill-vector will fail to master this particular task, but also all other tasks which require this particular TOOL-skill. Most IP activities were computer-based by using tools for communication, calculation, word-processing, or presentation. Typical observable examples of apprentices’ intrapreneurship-specific behavior are: to create a GANTT chart on the basis of given information, to select rele-vant information from given documents, or to decide among different alternative solu-tions in view of disturbances (changes in markets). The competence model based on central assumptions for modelling professional competences as discussed in the interna-tional literature (for more details see Weber et al. 2016a, b). The model comprises three layers with an increasing depth of operationalization: six phases of IP (e.g., analyses IP situations or procure information and (IP) project planning) and the fine-grained set of fourteen multiple IP skills (e.g., arrange aspects in sequences or procure, assess, and structure information) which will be used in this study as an initial set of skills (see Table 1). An analysis of apprentices’ final exam reports (as one source of the domain analysis) delivers evidence that the listed skills are used in IP projects on apprentice level (Weber et al. 2015).
II. Tasks: diagnostic assessment tasks for the domain of IP
A valid assessment design for professional and complex competencies like IP implies an authentic modeling of the world of work where examinees can think and act as if at real workplaces (Darling-Hammond et al. 2013; Janesick 2006; Pellegrino et al. 2016; Shavel-son 2012; Weber et al. 2014; Wiggins 1998; Winther and Achtenhagen 2009). Therefore, all 22 diagnostic tasks reflect typical IP situations as they were identified by domain analysis.8 Additionally, all of them were implemented into a technology-based platform (called ALUSIM Ltd.; see Achtenhagen and Winther 2014). The ALUSIM platform rep-resents a computer-based simulated company for producing aluminum boxes and cans which is rebuilt according to an existing firm. Apprentices may have to play the role of an apprentice of ALUSIM Ltd. who works as part of IP project-teams in various situations (e.g., on time, cost or profit planning tasks) in two holistic projects: (authentic scenario 1) setting up an online shop as an additional distribution channel and (authentic sce-nario 2) attracting apprentices under the existing situation of shortage of skilled workers in Germany as a recruiting task (Antončič and Hisrich 2001). The simulation is equipped with realistic tools (such as a file system, client email, calculator, spreadsheet, and text processing program) and introduced and explained by video clips.
Screen shots of the technology-based implemented task 3 are presented in Fig. 2. The apprentice is sitting at his/her simulated workplace and receives, via email, the task to create a GANTT chart for setting up the new online shop-project. Attached to this
8 See also section: “I. Skills: theoretical assumptions of diagnosable IP skills”.

Page 10 of 32Bley Empirical Res Voc Ed Train (2017) 9:6
Table 1 Initial set of IP skills (in accordance with Weber et al. 2014, p. 303)
Skill number and abbre-viation
Skill description Examples for evidenceThe apprentice…
1 REC Recognize IP challenges and opportunities …becomes aware and realizes an IP problem or chance
2 ANAL Analyse IP situations …analyzes the perceived IP problem or chance (explicating main and side effects, taking per-spective etc.)
3 IDEA Create an (IP-)idea … generates a new innovative (at least an incre-mental) IP idea with regard to the perceived IP chance or problem
4 CREA Use creativity techniques …applies tools for supporting the idea-generating process
5 SEQU Arrange aspects in sequences …creates a GANTT-chart
6 INFO Procure, assess and structure information … searches for relevant information in documents or data files
7 TERM Use of domain-specific terms and techniques …applies, for example, a break-even-point by means of complex calculations
8 TOOL Use of domain-specific tools …calculates a break-even-point by means of spreadsheets
9 DEC Reasoned decisions …decides among alternative solutions in view of disturbances (e.g., changes in market) on the basis of concrete reasons and arguments
10 RISK Identify and analyse risks …assesses different risk scenarios
11 TEAM Teamwork …shows that he/she knows and understands central categories of team work
12 DIST Identify and manage disturbances …analyzes and chooses appropriate strategies when team work begins to break down or gets stuck
13 REF Reflect on whether the project was effective …reflects on phases, elements or the whole project and evaluates them with regard to goal achievement, appropriateness, or success (explaining things that went wrong or well etc.)
14 DEF Distribute, defend, or introduce a project …presents his/her IP project and persuades others to accept it
Fig. 2 Task example, “Creating a GANTT chart”

Page 11 of 32Bley Empirical Res Voc Ed Train (2017) 9:6
email is an elaborated GANTT chart of a pre-project, the company’s internal GANTT-chart template, and the protocol of the last team meeting. The template of the GANTT chart consists of a table where the four main work packages, as well as the forthcom-ing months, are already registered. The apprentice has to fill out the right cells for each work package by using the spreadsheet marking function (Weber et al. 2014, p. 305). The apprentice masters the task if he/she fills out the right cells for three of the four work packages.
At an early stage of task development, the whole pool of 22 IP tasks were checked on their substantive validity (Bley et al. 2015). Construct-irrelevant cognitive load, such as confusing technology issues or wrong association provoking task formats and assign-ments, was revised.
III. Q matrix: theoretical assumptions of skill to task assignments
The Q matrix connects the skill-vectors of all 22 IP tasks. For specifying the skill-vectors the task constructors anticipated for each task, according to the results of the extended domain analysis and their expert knowledge on teaching and learning theories, the cognitive process an apprentice usually engages in when solving particular tasks. This first validity check was done within the ASCOT project (Bley et al. 2015). For example, to solve task 3 successfully the apprentice needs the following four skills (skill-vector 00001111000000: see Table 1). First of all, he/she has to understand and apply the eco-nomic term “GANTT-chart” (TERM: “use domain specific terms and routines”). Fur-thermore, he/she has to select relevant information about time issues for each work package from the team meeting protocol (INFO: “procure, assess, and structure infor-mation”) and sequence them in the right order by taking into account the required time (SEQU: “arrange aspects in sequence”). By using the marking function of the spread-sheet tool and filling out the right cells in the template (TOOL: “use domain-specific tools”), the apprentice creates finally the GANTT chart. This fine-grained construction process was done for each task and their skill-vectors were translated into the initial Q matrix (see Table 2).
Research questionsOn the basis of theoretical considerations, an extensive domain analysis, and prelimi-nary work in modeling the competence of IP (e.g., Weber et al. 2014; Weber et al. 2016a), a set of fourteen IP skills (I), a pool of 22 diagnostic IP assessment tasks (II), and an ini-tial Q matrix model (III) exist. The question arises whether these specifications (skills, tasks, Q matrix) are adequate to fit the target groups’ cognitive processes and response patterns as a prerequisite for identifying learners’ individual fine-grained skill profiles for providing an informative feedback.
I. Following the suggestions of CDM experts the set of fourteen IP skills exceeded the number of reliable measurable skills by using CDM procedures. Therefore, it needs to be evaluated which of the fourteen skills are relevant in a sufficient amount of tasks’ skill-vectors and in a unique manner. Skills which are only relevant in combi-nation with other skills, or which are only necessary in a small amount of tasks, are statistically problematic (Roussos et al. 2007; Jang 2009). By triangulating different
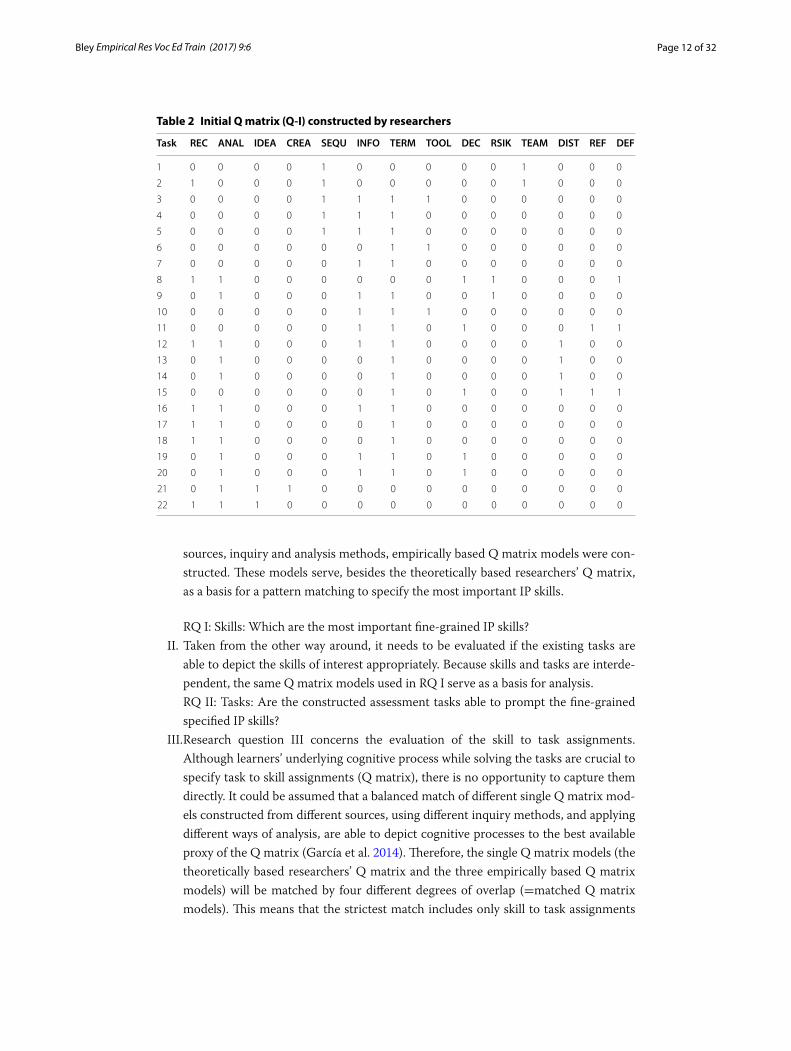
Page 12 of 32Bley Empirical Res Voc Ed Train (2017) 9:6
sources, inquiry and analysis methods, empirically based Q matrix models were con-structed. These models serve, besides the theoretically based researchers’ Q matrix, as a basis for a pattern matching to specify the most important IP skills.
RQ I: Skills: Which are the most important fine-grained IP skills?II. Taken from the other way around, it needs to be evaluated if the existing tasks are
able to depict the skills of interest appropriately. Because skills and tasks are interde-pendent, the same Q matrix models used in RQ I serve as a basis for analysis.
RQ II: Tasks: Are the constructed assessment tasks able to prompt the fine-grained specified IP skills?
III. Research question III concerns the evaluation of the skill to task assignments. Although learners’ underlying cognitive process while solving the tasks are crucial to specify task to skill assignments (Q matrix), there is no opportunity to capture them directly. It could be assumed that a balanced match of different single Q matrix mod-els constructed from different sources, using different inquiry methods, and applying different ways of analysis, are able to depict cognitive processes to the best available proxy of the Q matrix (García et al. 2014). Therefore, the single Q matrix models (the theoretically based researchers’ Q matrix and the three empirically based Q matrix models) will be matched by four different degrees of overlap (=matched Q matrix models). This means that the strictest match includes only skill to task assignments
Table 2 Initial Q matrix (Q‑I) constructed by researchers
Task REC ANAL IDEA CREA SEQU INFO TERM TOOL DEC RSIK TEAM DIST REF DEF
1 0 0 0 0 1 0 0 0 0 0 1 0 0 0
2 1 0 0 0 1 0 0 0 0 0 1 0 0 0
3 0 0 0 0 1 1 1 1 0 0 0 0 0 0
4 0 0 0 0 1 1 1 0 0 0 0 0 0 0
5 0 0 0 0 1 1 1 0 0 0 0 0 0 0
6 0 0 0 0 0 0 1 1 0 0 0 0 0 0
7 0 0 0 0 0 1 1 0 0 0 0 0 0 0
8 1 1 0 0 0 0 0 0 1 1 0 0 0 1
9 0 1 0 0 0 1 1 0 0 1 0 0 0 0
10 0 0 0 0 0 1 1 1 0 0 0 0 0 0
11 0 0 0 0 0 1 1 0 1 0 0 0 1 1
12 1 1 0 0 0 1 1 0 0 0 0 1 0 0
13 0 1 0 0 0 0 1 0 0 0 0 1 0 0
14 0 1 0 0 0 0 1 0 0 0 0 1 0 0
15 0 0 0 0 0 0 1 0 1 0 0 1 1 1
16 1 1 0 0 0 1 1 0 0 0 0 0 0 0
17 1 1 0 0 0 0 1 0 0 0 0 0 0 0
18 1 1 0 0 0 0 1 0 0 0 0 0 0 0
19 0 1 0 0 0 1 1 0 1 0 0 0 0 0
20 0 1 0 0 0 1 1 0 1 0 0 0 0 0
21 0 1 1 1 0 0 0 0 0 0 0 0 0 0
22 1 1 1 0 0 0 0 0 0 0 0 0 0 0
Page 13 of 32Bley Empirical Res Voc Ed Train (2017) 9:6
which were identified to be relevant in all four Q matrix models; the smoothest match includes all skill to task assignments which were identified in at least one of the four single Q matrix models. By an empirical evaluation all single and matched matrix models were contrasted.
RQ III: Q matrix: Which Q matrix model best fits the response patterns of the target group?
MethodsDesign
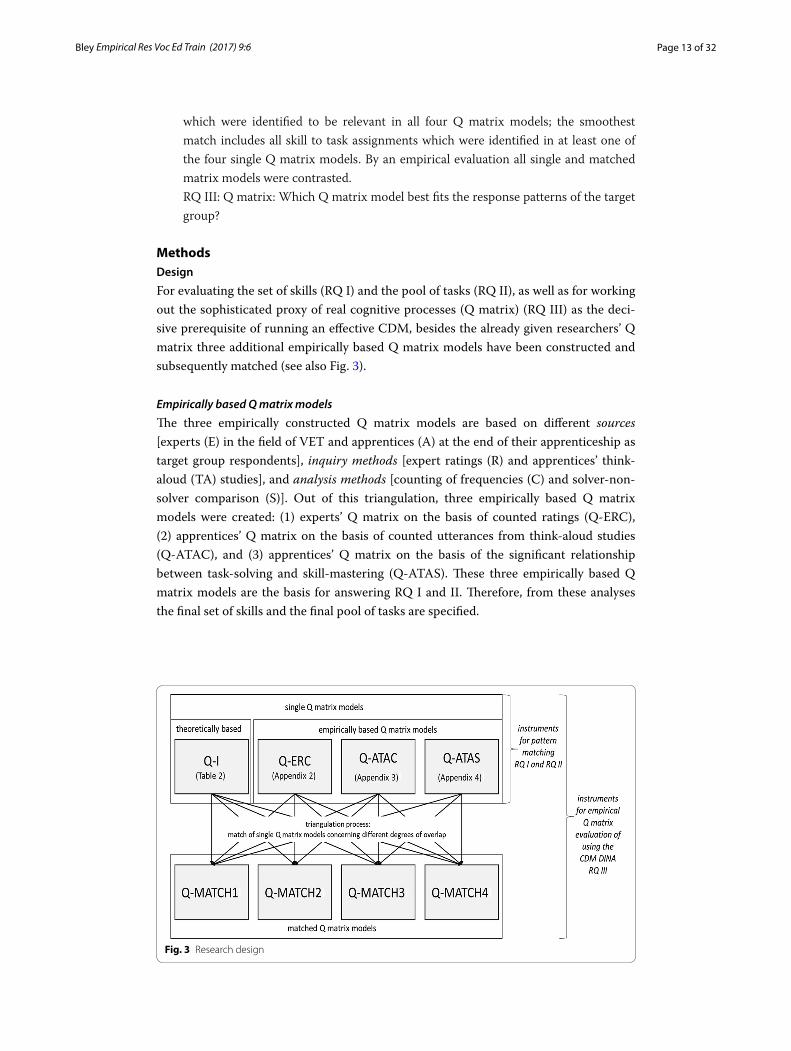
For evaluating the set of skills (RQ I) and the pool of tasks (RQ II), as well as for working out the sophisticated proxy of real cognitive processes (Q matrix) (RQ III) as the deci-sive prerequisite of running an effective CDM, besides the already given researchers’ Q matrix three additional empirically based Q matrix models have been constructed and subsequently matched (see also Fig. 3).
Empirically based Q matrix models
The three empirically constructed Q matrix models are based on different sources [experts (E) in the field of VET and apprentices (A) at the end of their apprenticeship as target group respondents], inquiry methods [expert ratings (R) and apprentices’ think-aloud (TA) studies], and analysis methods [counting of frequencies (C) and solver-non-solver comparison (S)]. Out of this triangulation, three empirically based Q matrix models were created: (1) experts’ Q matrix on the basis of counted ratings (Q-ERC), (2) apprentices’ Q matrix on the basis of counted utterances from think-aloud studies (Q-ATAC), and (3) apprentices’ Q matrix on the basis of the significant relationship between task-solving and skill-mastering (Q-ATAS). These three empirically based Q matrix models are the basis for answering RQ I and II. Therefore, from these analyses the final set of skills and the final pool of tasks are specified.
Fig. 3 Research design

Page 14 of 32Bley Empirical Res Voc Ed Train (2017) 9:6
Matched Q matrix models
RQ III is the most sophisticated endeavour. Because no source and no method (inquiry as well as analysis method) is without limitations, the four single Q matrix models (researchers’ initial Q matrix: Q-I and the empirically based Q matrix models: Q-ERC, Q-ATAC, Q-ATAS) will additionally be matched with regard to different degrees of overlap: Q-MATCH4 includes all skills which were identified to be relevant in at least one of the four Q matrix models, Q-MATCH3 includes skills which were identified to be relevant in at least two single matrix models, Q-MATCH2 includes skills which were identified to be relevant in at least three of the four matrix models, and Q-MATCH1 includes only skills which were identified to be relevant in all four single Q matrix mod-els. Thus, these four matched Q matrix models balance the strengths and weaknesses of the single Q matrix models in different ways (triangulation process) and, furthermore, they provide, besides the single Q matrix models, additional models for specifying the best proxy for apprentices’ real cognitive processes while solving the tasks. This empiri-cal evaluation process will be carried out by CDM procedure.
Sample
The expert sample consists of four vocational educational training (VET) school teachers and five trainers from small (<50 employees: n = 1), medium (51–250 employees: n = 1), large (251–1000 employees: n = 1), and very large (>1000 employees: n = 2) enterprises. All of the interview partners were experts with an average of more than 5 years of experi-ence working with apprentices and more than two years of experience with IP activities. The think-aloud study was conducted with 26 voluntarily participating apprentices (12 males, 14 females). All of them were at the end of their apprenticeship in small (n = 1), medium (n = 4), large (n = 17) or very large enterprises (n = 4). Half of the participants had an intermediate level of education, while the other half had a university-level educa-tion, with an average age of 21 years (SD = 1.89). The sampling process of both groups (experts and apprentices) was facilitated by advertising and self-selection—all partici-pants (experts and apprentices) received €40 for their cooperation.
The empirical Q matrix evaluation is based on data from the main study of the ASCOT project CoBALIT (Weber et al. 2016a). The national wide sample study was collected in 2014 in seven states (Baden-Wuerttemberg, Bavaria, Hesse, Lower Saxony, North Rhine, Westphalia, and Thuringia). Within a 4-h survey, besides the IP instrument, fur-ther business competence instruments, as well as individual and social context variables, were conducted by applying a booklet design. Out of the whole group of 2171 appren-tices, a group of 919 apprentices solved the diagnostic assessment of IP. Apprentices were, on average, aged 21 (SD = 2.3). Thereof, 554 were female and 317 male; there were 48 missings. 578 apprentices have a certificate of university entrance qualification and 279 finished their secondary education (12 without completing secondary education, 50 missings). They had apprenticeship contracts with large (more than 501 employees: n = 282), medium (51–500 employees: n = 499), and small companies (1–50 employees: n = 105; 33 missings).

Page 15 of 32Bley Empirical Res Voc Ed Train (2017) 9:6
Analysis methods
In order to answer RQ I and II a pattern matching of the four single Q-matrix models (Q-I, Q-ERC, Q-ATAC, Q-ATAS) was carried out. On the basis of patterns’ commonali-ties and differences, the most important and statistically measurable skills (RQ I) will be identified, and the sufficiency and validity of the tasks (RQ II) will be evaluated.
Because of its parsimony in terms of model parameters and its non-compensatory assumption (which was basically hypothesized during the process of defining our Q matrix), the CDM DINA (deterministic input, noisy, and gate) model (Haertel 1989) was chosen for the empirical validation of the different versions of Q matrices (RQ III) in order to identify the best-fitting proxy (Q matrix). The DINA model expresses the statis-tical relationship between responses and skills as follows:
Deterministic model: ξij =∏K
k=1 αqjkik
Probabilistic model: P(
Xij = 1|αi
)
= P(
Xij = 1|ξij , gj , sj)
= (1− sj)ξij g
1−ξijj
where ξij is the response of apprentice j to task i (1 if correct; 0 if incorrect), αik specifies the existence of skill k in in the skill-profile of apprentice j (qjk = 1 if apprentice j is able to do skill k; qjk = 0 if otherwise), qjk specifies the requirement for mastery of skill k for task i (αik = 1 if task i requires s; αik = 0 if otherwise), gj is the probability to guess the task response, and sj is the probability to make a mistake obviously person’s skill vector fits the task’s skill vector.
The DINA model was estimated and evaluated with the R (R Core Team 2015) package CDM (George et al. 2016). As suggested by de la Torre and Minchen (2014) most criteria that have been shown useful in the (traditional) IRT context can be adapted to CDMs. Therefore, the model fit was assessed using the following quality criteria—two indices for absolute model fit: (1) item/task pairwise χ2 and the associated p value, as well as (2) the standardized root mean square residual (SRMSR); (3) three information criteria: AIC (Akaike Information Criterion), BIC (Bayesian Information Criterion), and CAIC (Con-sistent AIC); and (4) the mean Item Discrimination Index (IDIj). Benchmarks for evalua-tion were: (1) in a well-fitting model the maximal item pairwise χ2 statistic should not be significant; (2) Maydeu-Olivares (2013) suggests that SRMSR should be smaller than .05 for well-fitting models; (3) the model with the smallest information criteria should be favored over the other models; and (4) item discrimination values close to one indicate a good separation between examinees with low and high abilities.
Instruments for pattern matching: constructing empirically based Q matrix models using
different sources, inquiry and analysis methods
Information sources: experts (E) and apprentices (A)
Experts (E) A panel of experts serves as a first source. In this case, teachers from voca-tional education training (VET) schools, as well as trainers from private enterprises, provide conceptual parameters for the learning domain IP in schools and on the job. Furthermore, these experts are able to determine whether the tasks reflect the underly-ing learning objects and required cognitive processes needed to solve them. However, a large concern is that experts’ abilities to solve the tasks is significantly higher than that of apprentices (Leighton and Gierl 2007). Additionally, there could be a high degree of vari-ance in expert opinions, at least between the experts of two different learning settings (in school and on the job), which could be obstructive.

Page 16 of 32Bley Empirical Res Voc Ed Train (2017) 9:6
Apprentices (A) A second resource is the target group of industrial clerk apprentices. The source advantage is the target level of the ability, while the disadvantage is that learn-ers at the novice level are not usually able to assess and verbalize their used cognitive pro-cesses to solve tasks in detail. For this reason, Ericsson and Simon (1996) suggest holding think-aloud studies (TA) for extracting thinking strategies more indirectly.
Inquiry methods: expert ratings (R) and think‑aloud studies (TA)
Expert ratings (R) On the basis of their practical experience with the learning processes of apprentices in general and their IP-relevant tasks in particular, subject-matter experts are able to validate an identified set of diagnosable skills and to describe trainees’ task-solving processes and determine necessary skills per task interaction. A briefing session was held prior to the formal rating, wherein the previously skill-based task construction process was introduced. Afterwards, experts have to solve the tasks to perform the rating task. Discrepancies and related practical evidence have to be discussed.
Think‑aloud studies with apprentices (TA) Concurrent think-aloud studies have thus far enabled the best possible determination of cognitive processes while solving tasks (Erics-son and Simon 1996) and are therefore often suggested in Q matrix development (Jang 2009; Pressley and Afflerbach 1995; Taylor and Dionne 2000). Although think-aloud stud-ies hypothetically increase the cognitive load, the initial result shows that this method does not hinder cognitive processes (Leow and Morgan-Short 2004). To achieve the best possible result, Ericsson and Simons (1996) and Pressley and Afflerbach (1995) suggest various rules (Ericsson and Simon 1996, pp. 80–83): use separate rooms for each session; use trained test administrators who are seated outside the apprentices’ field of vision and who interrupt the think-aloud process only after a silence of more than 5 s to remind the examinees to continue speaking; use standardized instruction; and hold preliminary practice sessions with participants. “To figure out what a learner knows (on the basis of what he says […]) and how that knowledge influences the way the learner reasons and solves problems, correctly or incorrectly” (Chi 1997, p. 274), the verbal data were analysed in accordance with the above suggested approach. A content analysis (accord-ing to Mayring 2010) was run. The process of quantifying verbal data of think-alouds is presented in Appendix 2.
Quantitative analysis methods: counting of frequencies (C) and solver‑non‑solver comparisons
(S)
Counting experts’ ratings and apprentices’ utterances (C) Skill necessity is defined by the counted frequencies on the basis of a prior defined cut-off point. To determine the cut-off point for expert ratings the strict suggestion of Shrout and Fleiss (1979), of a good interrater agreement rate of 80%, was followed. That means if 80% or more experts judged a certain skill as being necessary for a certain task, then the skill receives a “1” in the Q matrix; otherwise, it receives a “0” (unnecessary). The cut-off point for apprentices’ utter-ances was determined at the level of 50%. Thus, if there are utterances in more than 50% of the 26 apprentices’ verbal protocols, this skill will be included (“1”) in the Q matrix; otherwise a “0” has to be filled in. The severity of the cut-off point is due to the issue that some apprentices, with respect to their person-skill-vectors (and in accordance with
Page 17 of 32Bley Empirical Res Voc Ed Train (2017) 9:6
CDM ideas, see “Theoretical considerations on diagnostic assessments using cognitive diagnostic models (CDMs)” section), are not able to solve certain tasks and therefore do not use (i.e., think-aloud) certain skills. This matter can become a problem if cer-tain tasks require skills that are obviously harder than others and are therefore missed in many (more than 50%) apprentices’ skill-profiles. It can also become a concern if certain tasks require a large set of skills, as one might claim that the probability of solving a task decreases with an increasing number of necessary skills. Therefore, for obtaining the best proxy depicting the underlying cognitive solving processes, different Q matrices are cre-ated and matched.
Solver‑versus‑non‑solver comparison (S) To address the limitation of apprentice-solver versus apprentice-non-solver of the first method, a cross-table comparison between the two groups [apprentices who solve (1) versus those who do not solve (0) the task] regard-ing their skill-mastering [apprentices who use a certain skill correctly (1) as opposed to those who do not use a certain skill, or use the skill incorrectly (0)] were added. This approach is based on the deterministic CDM model [“Theoretical considerations on diag-nostic assessments using cognitive diagnostic models (CDMs)” section], which stated that solvers are able to solve tasks correctly because they are disposed to apply all of the necessary skills in the correct way (=skill-master). However, non-solvers are not able to answer tasks correctly because they do not dispose of all necessary skills or they apply one or more of the skills in an incorrect fashion (=skill non-master). In other words, neces-sary skills were significantly more often applied (in the right way) with solvers than with non-solvers. Conversely, those skills that are significantly more often used by solvers than by non-solvers are necessary for the task solution process and have to be included in the Q matrix as necessary (“1”). Those skills that are applied in the case of a certain task and do not significantly differ between solvers and non-solvers are, by definition, not neces-sary. On the basis of the categorical variable characteristics, a phi-coefficient analysis (Bühner and Ziegler 2008, pp. 627–629) was run for each skill to task assignment. On the basis of a 5% significance level, skill level necessity was decided. It is critical to note that the solver-versus-non-solver procedure has only limited significance if the number of group sizes differs considerably. This is especially the case if tasks are quite easy (solver group is much bigger than non-solver group) or quite difficult (solver group is much smaller than non-solver group).
Finally, four single Q matrix models serve as the basis for the pattern-matching pro-cedure. The theoretically based Q-I (researchers’ task construction and decisions) (see Table 2) and the three empirically based Q matrices: Q-ERC (experts’ counted ratings), Q-ATAC (apprentices’ counted arguments from the think-aloud studies), and Q-ATAS (apprentices’ skills used when solving the tasks correctly) (see Appendices 2, 3, 4).
Instruments for empirical Q matrix evaluation: matching single Q matrix models
by different degrees of overlap
As CDM experts suggest, a set of seven to ten IP skills provides a reliable measurable basis. Therefore, the empirical evaluation is built on the results of the pattern-matching procedure. This means that all single Q matrix models will be revised according to the
Page 18 of 32Bley Empirical Res Voc Ed Train (2017) 9:6
adapted (reduced) set of IP skills and the adapted pool of tasks.9 Furthermore, the four (revised) single Q matrix models will be matched with regard to different degrees of overlap for balancing the strengths and weaknesses of the single Q matrix models: Q-MATCH4 includes all skills which were identified to be relevant in at least one of the four Q matrices, Q-MATCH3 includes skills which were identified to be relevant in at least two single matrices, Q-MATCH2 includes skills which were identified to be rele-vant in at least three of the four matrices, and Q-MATCH1 includes only skills which were identified to be relevant in all four single Q matrices. These matches Q matrix models provide, besides the single Q matrix models, the basis for identifying the best proxy for apprentices’ real cognitive processes while solving the tasks.
Analysis: pattern matching and the empirical evaluation processPattern matching of single Q matrix models (concerning RQ I and RQ II)
In order to compare the patterns of the different single Q matrix models, I shall focus on cells which claim a skill necessity and, therefore, are filled by a “1”, because a consist-ency in “0” (skill is not needed) is, in many cases, of subordinate interest. A frequency based view on these cells, which were claimed as necessary in at least one of the four single Q matrix models (n = 82 cells), indicates that 35 cells (=43%) were defined con-sistently in all four models as necessary. However, for 57% of the cells at least one Q matrix model does not claim the skill as necessary. This result confirms the statement that each source and method (researchers’ Q matrix model included) provides different suggestions of necessary skill to task assignments for the same task. An evaluation of the number of cells filled by a “1” for each Q matrix model illustrates that researchers (Q-I: n = 76 cells), as well as VET experts (Q-ERC: n = 69 cells), defined overall consider-ably more skills as necessary than could be the result from using different analysis meth-ods using data from think-aloud studies (Q-ATAC: n = 57 cells, Q-ATAS: n = 48 cells). Consequently, the overlap between Q-I and Q-ERC is the highest (84%) and between Q-I and Q-ATAS is the lowest (58%). The percentage of overlap between researchers’ expectations (Q-I) and counted utterances in apprentices’ verbal protocols (Q-ATAC) is in between these two comparisons (73%).
To decide on the importance and measurability of each IP skill the following aspects are considered in a balanced way: (i) how often a particular skill is represented by the tasks (empirical importance); (ii) how often a particular skill is needed in combination with another skill (skill pairs); and (iii) how important the particular skill is regarding content validity aspects (practical importance).
Aspect (i): Skill frequencies vary between the different IP skills (from 1 to 17) and within different Q matrix models (skill “TERM”: from 9 to 17, see Fig. 4). Skills with the highest mean frequencies are “REC,” “ANAL,” “SEQU,” “INFO,” “TERM,” and “DEC.”
Aspect (ii): The overlap of all skill pairs for the four single Q matrix models is depicted in Appendix 5, Figs. 9, 10, 11, 12. The following is an example of how to read the table concerning the important skills “TERM” and “INFO”: in Q-I (Fig. 9) the skill “TERM” is needed in 100% of the tasks which also required the skill “INFO” (cell: row
9 If two skills are merged into one skill, the new skill is specified as necessary if one of the original two skills was speci-fied as necessary.

Page 19 of 32Bley Empirical Res Voc Ed Train (2017) 9:6
“TERM”—column: “INFO”); in reverse (cell: row “INFO”—column: “TERM”), the skill “INFO” is needed in 67% of the tasks which also required the skill “TERM”. For this skill pair other Q matrix models also deliver rather high connections (Q-ERC: 91 and 63%; QATAC: 100 and 79%; Q-ATAS: 50 and 44%). The results for this skill pair indicated that they should be merged into one skill. Aspect (iii): All skills were critically scrutinized concerning their content validity.
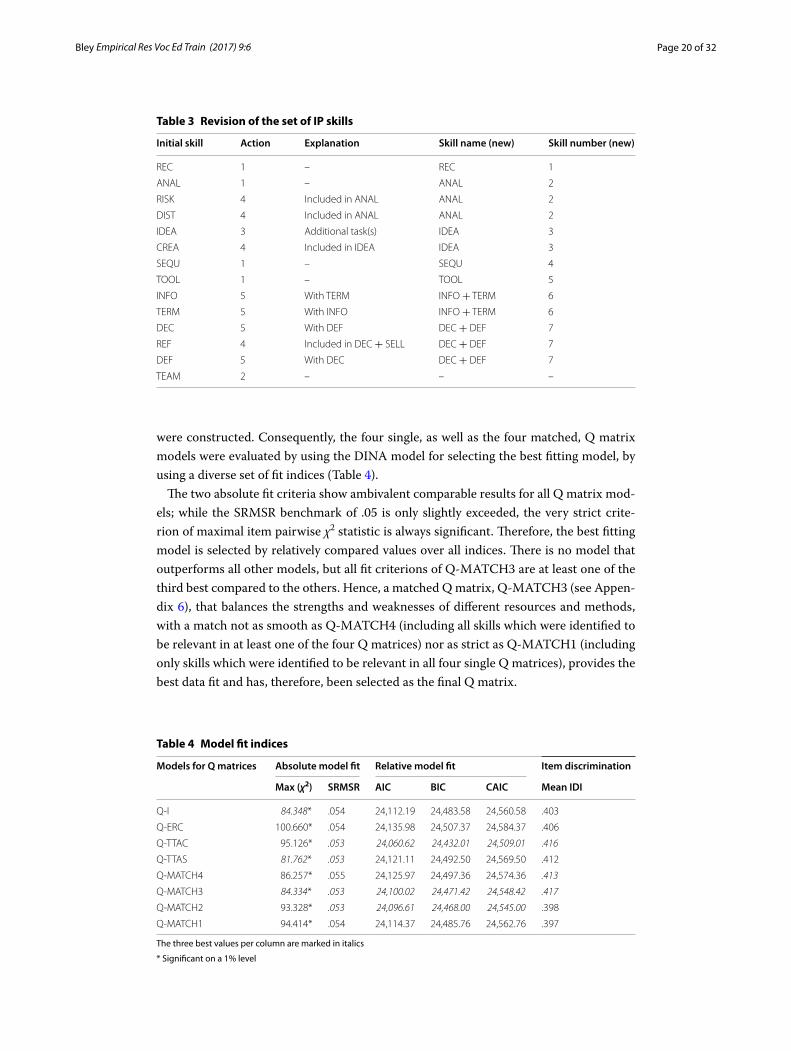
Because all three aspects are involved, and the connections of skill pairs can vary con-siderably over the different Q matrix models, there is no fixed rule regarding how to revise a certain skill. Finally, the following five different actions were used to compress the initial set of IP skills. (1) Empirically and/or practically important skills, with a low tendency to be part of a high overlapping skill pair, were maintained as initially intro-duced (e.g., “TOOL”). (2) Practically important, but hard to depict, skills needed for tasks from the individual assessment have to be eliminated (only “TEAM”). (3) Practi-cally important, but less empirically represented, skills in existing tasks were enhanced by additionally constructed tasks (e.g., “IDEA”). (4) Empirically less important, but prac-tically important, skills with a high tendency to need another important skill for a task solution were integrated into the more important skill (e.g., skill “RISK” were integrated into skill “ANAL”). And finally, (5) empirically as well as practically important skills, with a high tendency to be needed together, were merged into one new skill (e.g., “INFO” and “TERM” became “INFO + TERM”). In summary, the set of diagnosable skills could be reduced to a manageable number of seven skills (the revision process is documented in Table 3).
The analyses of all four single Q matrix models (see Table 2 and Appendix Figs. 6, 7, 8) show that all IP tasks need at least one of the 14 IP skills (expectation: skill “DIST” in Q-ATAC and Q-ATAC). Using skill revision (see Table 3), less represented skills were integrated into another skills (e,g., “DIST”), eliminated (“TEAM”), or enhanced by addi-tional tasks (“IDEA”). Therefore, the revised set of seven skills could be prompted by the extended pool of 24 tasks.
Empirical evaluation of single and matched Q matrix models (RQ III)
As a result of the pattern-matching procedure, the set of IP skills was reduced from four-teen to seven skills, and the pool of tasks was enhanced by two tasks, from 22 to 24. All single Q matrix models (Q-I, Q-ERC, Q-ATAC, Q-ATAS) were revised accordingly, so that each Q matrix model consisted of seven skills and 24 tasks.10 On this basis, the matched Q matrix models (Q-MATCH1, Q-MATCH2, Q-MATCH3, and Q-MATCH4)
10 Skill vectors of the two new tasks are equal in all Q matrix models because these tasks were not part of the validation process.
Fig. 4 Frequencies, mean and standard deviation (sd) of IP skills in the four single Q matrix models
Page 20 of 32Bley Empirical Res Voc Ed Train (2017) 9:6
were constructed. Consequently, the four single, as well as the four matched, Q matrix models were evaluated by using the DINA model for selecting the best fitting model, by using a diverse set of fit indices (Table 4).
The two absolute fit criteria show ambivalent comparable results for all Q matrix mod-els; while the SRMSR benchmark of .05 is only slightly exceeded, the very strict crite-rion of maximal item pairwise χ2 statistic is always significant. Therefore, the best fitting model is selected by relatively compared values over all indices. There is no model that outperforms all other models, but all fit criterions of Q-MATCH3 are at least one of the third best compared to the others. Hence, a matched Q matrix, Q-MATCH3 (see Appen-dix 6), that balances the strengths and weaknesses of different resources and methods, with a match not as smooth as Q-MATCH4 (including all skills which were identified to be relevant in at least one of the four Q matrices) nor as strict as Q-MATCH1 (including only skills which were identified to be relevant in all four single Q matrices), provides the best data fit and has, therefore, been selected as the final Q matrix.
Table 3 Revision of the set of IP skills
Initial skill Action Explanation Skill name (new) Skill number (new)
REC 1 – REC 1
ANAL 1 – ANAL 2
RISK 4 Included in ANAL ANAL 2
DIST 4 Included in ANAL ANAL 2
IDEA 3 Additional task(s) IDEA 3
CREA 4 Included in IDEA IDEA 3
SEQU 1 – SEQU 4
TOOL 1 – TOOL 5
INFO 5 With TERM INFO + TERM 6
TERM 5 With INFO INFO + TERM 6
DEC 5 With DEF DEC + DEF 7
REF 4 Included in DEC + SELL DEC + DEF 7
DEF 5 With DEC DEC + DEF 7
TEAM 2 – – –
Table 4 Model fit indices
The three best values per column are marked in italics
* Significant on a 1% level
Models for Q matrices Absolute model fit Relative model fit Item discrimination
Max (χ2) SRMSR AIC BIC CAIC Mean IDI
Q-I 84.348* .054 24,112.19 24,483.58 24,560.58 .403
Q-ERC 100.660* .054 24,135.98 24,507.37 24,584.37 .406
Q-TTAC 95.126* .053 24,060.62 24,432.01 24,509.01 .416
Q-TTAS 81.762* .053 24,121.11 24,492.50 24,569.50 .412
Q-MATCH4 86.257* .055 24,125.97 24,497.36 24,574.36 .413
Q-MATCH3 84.334* .053 24,100.02 24,471.42 24,548.42 .417
Q-MATCH2 93.328* .053 24,096.61 24,468.00 24,545.00 .398
Q-MATCH1 94.414* .054 24,114.37 24,485.76 24,562.76 .397
Page 21 of 32Bley Empirical Res Voc Ed Train (2017) 9:6
Results and comprehensive discussionRQ I investigated the appropriateness of the initial set of skills on the basis of a pat-tern matching of empirically constructed Q matrix models (Q-ERC, Q-ATAC, Q-ATAC) with the theoretically derived initial researchers’ Q matrix (Q-I). The reduction of the initial set of fourteen skills to seven skills caused a balanced consideration of (i) how often a skill was represented by the tasks, (ii) how often a skill was part of a skill pair in tasks, and (iii) how important the skill was with regard to content validity aspects. The results prompted a revision of skills using five different actions: (1) maintaining a skill as initially introduced, (2) eliminating a skill that is hard to depict, (3) constructing addi-tional tasks to enhance poorly represented skills, (4) integrating a skill with another if the particular skill is usually only needed with another skill, but not the other way around, or (5) merging skills which often require each other into one new skill. These revisions go in line with suggestions of CDM experts to specify not more than 7–10 skills to yield in best results (de la Torre and Minchen 2014; Roussos et al. 2007).
RQ II demonstrated that information from the different sources, inquiry methods, and analysis show that all the skill-based tasks need at least one of the seven IP skills and, therefore, are valuable for the diagnostic assessment. However, two more tasks had to be constructed in order to prompt the demonstration of the skill “IDEA.”
The appropriateness of a set of seven IP skills (RQ I) and a pool of 24 tasks (RQ II) is additionally underscored by the absolute model fit value SRMSR, which varies only between .053 and .055 over all eight different Q matrix models and, thus, only slightly exceeded (Maydey-Olivares 2013) suggested benchmark of .05 for well-fitting models.
RQ III: In order to obtain insights into the “real” cognitive processes—in other words, to get an appropriate proxy of these cognitive processes when solving tasks—it is worth-while to extend the researchers’ first underlying construction assumptions (Q-I) by additional information resources arising from different sources, inquiry methods, and analysis, as well as to balance this information by a triangulation process. Finally, the best fitting Q matrix model was selected on a diverse set of fit indices. As expected, the best description of apprentices’ skill application when solving representative IP tasks was yielded by a matched Q matrix model (Q-MATCH3: including skills which were identified to be relevant in at least two single Q matrix models) that balanced the (dis)advantages of different information sources, in a moderate manner, and that fits the data best.
ConclusionsIn order to provide valid informative feedback—as claimed for in professional teacher behaviour and corresponding teacher standards (Interstate Teacher Assessment and Support Consortium 2011; KMK 2004; Oser 1997)—the here introduced cognitive diag-nostic assessment using fine-grained units of analysis seems to be promising. For secur-ing quality of such diagnostic assessments using CDM, a principled assessment design like the ECgD has to be used. Thereby, a coherent system of competence model, set of skills, task model/pool of tasks, a Q matrix, and statistical model have to be specified. Whereby, the Q matrix specifying the skill task assignment is an indispensable prerequi-site for running CDMs as they function as an à priori defined assumption about learners’ cognitive processes when solving the tasks. Hence, the specification of a good Q matrix
Page 22 of 32Bley Empirical Res Voc Ed Train (2017) 9:6
is a study in its own right (e.g. Kunina-Habenicht et al. 2012). Because VET competence measurement for diagnostic purposes is still in its infancy, the study focus was on the theoretical specification and empirical evaluation of the three crucial aspects used for diagnostic assessments: (I) set of skills, (II) pool of tasks, and (III) Q matrix.
The extensive amount of various empirical evidence as a result of triangulated data from different sources, different inquiry methods, and different analysis methods pro-vides a comprehensive basis for adapting the coherence of the skills’ set, task pool, and Q matrix. As expected each single Q matrix is unique. The empirical result that a matched Q matrix model is the best proxy for describing apprentices’ underlying cogni-tive processes while solving each IP task confirmed the expectation that no source and no method is without limitations and that every different source and method delivers a unique contribution within the process of specifying a sounded Q matrix. Results of the Q matrix pattern matching shows that researchers, as well as experts in the field, overall rated more skills as necessary, as this could be found within the coding process of think-aloud study transcripts. With regard to empirical evaluation of these four single Q matrix models (Q-I, Q-ERC, Q-ATAC, Q-ATAS), models based on apprentices’ think-aloud studies usually show better model fit values than researchers’/experts’ Q matrix models. This underlies the special emphasis of the think-aloud method of target group respondents to understand underlying cognitive processes while solving tasks.
Obviously qualitative data of think-aloud studies are very helpful their quantifying can lead to a loss of information. Furthermore, decisions about cut-off points, such as 80% of the experts have to be agreed in their rating of a skill to task assignment, or 50% of the apprentices have to mention a skill for that skill to be considered necessary and be assigned to a task, are usually accompanied by reductions.
Summing up, the results indicate that I have succeeded in developing a decisive pre-requisite of a diagnostic assessment (the best fitting Q matrix model as best proxy rep-resenting apprentices’ cognitive processes when solving IP tasks) which can enable (in a subsequent step) the measurement of the complex construct of IP competence on a much more fine-grained level than has been the case up until now. This means that by using this assessment in combination with the cognitive processes—described within the Q matrix—it will be possible to diagnose apprentices’ strengths and weak-nesses concerning the seven intrapreneurship skills: “REC”—recognize IP opportu-nities and problems, “ANAL”—analyse IP situations and problems, “IDEA”—create IP ideas, “SEQU”—sequence resources and aspects, “TOOL”—use economic tools, “INFO + TERM”—search for relevant information and use economic terms, and “DEF + REC”—introduce, defend and reflect an IP project. This improved quality of diagnostic information can help apprentices to reflect their own performance progress, teachers and trainers to prepare individualized instruction and coaching, instructional design scientists to understand learning in the domain of IP on a deeper level, and politi-cians to fund and monitor intra-/entrepreneurship activities in a more effective way. E.g. the validated knowledge on cognitive processes by solving the typical intrapreneurship activity of creating a GANTT-chart (see Fig. 2)—specified within the Q matrix—enables
Page 23 of 32Bley Empirical Res Voc Ed Train (2017) 9:6
teachers to understand apprentices’ cognitions and therefore to develop differentiating instructional concepts on a more effective way.
In the next step of the research project, the outcomes of the CDM DINA on intrapre-neurship competence are presented and interpreted in terms of their potential to pro-mote individual learning and performance processes (Bley and George, in press).
Authors’ informationSandra Bley studied Human Resource Education and Management at Georg-August University in Göttingen from 2001–2006. She holds a Master of Business Research (MBR 2008) and a doctoral degree (Dr. oec publ. 2010) from Ludwig-Maximilians-University in Munich. Since 2011 she has been a senior researcher at the Institute for Human Resource Education and Management, Ludwig-Maximilians-University in Munich.
AcknowledgementsNot applicable.
Competing interestsThe author has no competing interests.
Availability of data and materialsThe data supporting the authors´ findings are provided by the author on request.
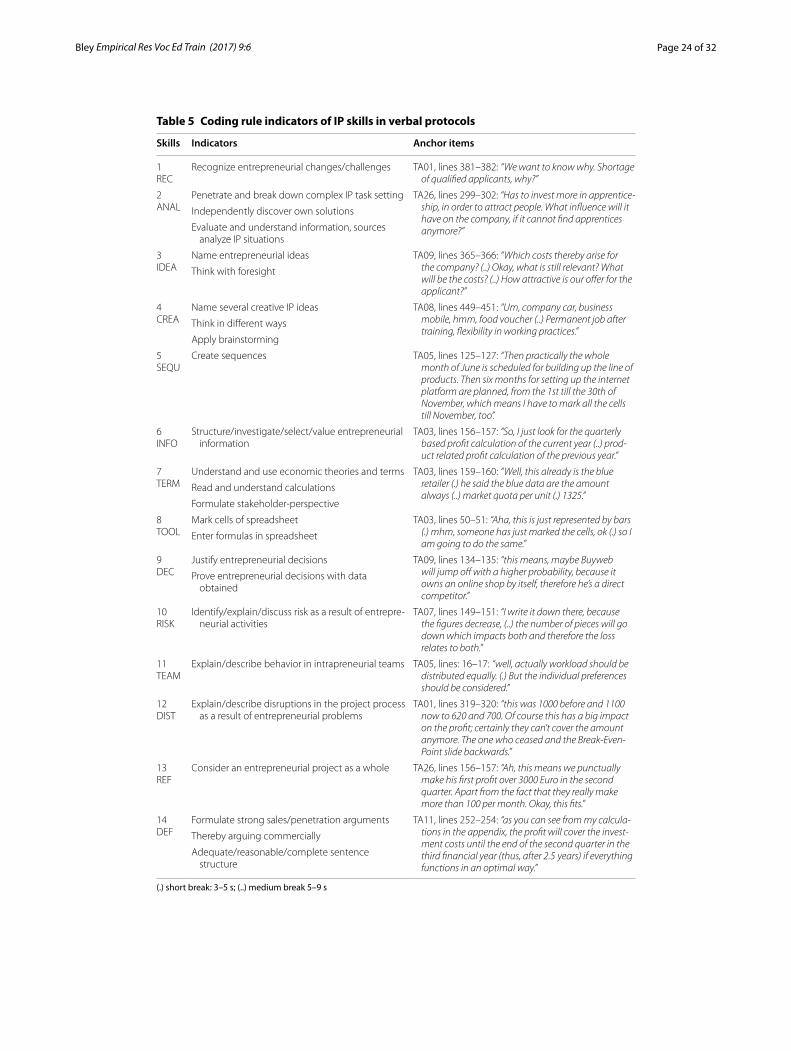
Appendix 1: Quantifying transcripts of think‑aloud studiesThe indicators for apprentices’ reasoning allow us to conclude that a granularity cor-responding with our theoretical grounding (IP-skills; Table 1) fits the verbal data well. Indicators of apprentices’ reasoning, as found in the identified utterances, were coded as skill-mastering (right usage = “1”) or as skill-non-mastering (no, wrong or incom-plete usage = “0”). Additional to the verbal data, written material based on open-ended tasks was used for analysis. An indicator description, as well as the anchor tasks used, are presented in Table 5. Coding was performed in an iterative manner by two research-ers who were familiar with IP challenges in general, and IP tasks in particular, on the basis of defined coding schema. A minimum of three passes were made over transcripts (including written material of open-ended questions). This process yielded a stable cod-ing system based on acceptable utterances for IP skills (Cohens ҡ = .915; Wirtz and Cas-par 2007, p. 55). Counts of utterances per task and apprentices were limited to a single utterance so that more IP skills could be coded on the basis of one utterance. In sum, the material of 26 apprentices and 22 tasks were investigated for the existence or absence of each of the fourteen skills by two researchers (= 16,016 codings). An extract of the first ten tasks (solved by all 26 apprentices) of absolute and relative skills per task is depicted in Fig. 5.
Page 24 of 32Bley Empirical Res Voc Ed Train (2017) 9:6
Table 5 Coding rule indicators of IP skills in verbal protocols
(.) short break: 3–5 s; (..) medium break 5–9 s
Skills Indicators Anchor items
1REC
Recognize entrepreneurial changes/challenges TA01, lines 381–382: “We want to know why. Shortage of qualified applicants, why?”
2ANAL
Penetrate and break down complex IP task setting TA26, lines 299–302: “Has to invest more in apprentice-ship, in order to attract people. What influence will it have on the company, if it cannot find apprentices anymore?”
Independently discover own solutions
Evaluate and understand information, sources analyze IP situations
3IDEA
Name entrepreneurial ideas TA09, lines 365–366: “Which costs thereby arise for the company? (..) Okay, what is still relevant? What will be the costs? (..) How attractive is our offer for the applicant?”
Think with foresight
4CREA
Name several creative IP ideas TA08, lines 449–451: “Um, company car, business mobile, hmm, food voucher (..) Permanent job after training, flexibility in working practices.”
Think in different ways
Apply brainstorming
5SEQU
Create sequences TA05, lines 125–127: “Then practically the whole month of June is scheduled for building up the line of products. Then six months for setting up the internet platform are planned, from the 1st till the 30th of November, which means I have to mark all the cells till November, too”.
6INFO
Structure/investigate/select/value entrepreneurial information
TA03, lines 156–157: “So, I just look for the quarterly based profit calculation of the current year (..) prod-uct related profit calculation of the previous year.”
7TERM
Understand and use economic theories and terms TA03, lines 159–160: “Well, this already is the blue retailer (.) he said the blue data are the amount always (..) market quota per unit (.) 1325.”
Read and understand calculations
Formulate stakeholder-perspective
8TOOL
Mark cells of spreadsheet TA03, lines 50–51: “Aha, this is just represented by bars (.) mhm, someone has just marked the cells, ok (.) so I am going to do the same.”
Enter formulas in spreadsheet
9DEC
Justify entrepreneurial decisions TA09, lines 134–135: “this means, maybe Buyweb will jump off with a higher probability, because it owns an online shop by itself, therefore he’s a direct competitor.”
Prove entrepreneurial decisions with data obtained
10RISK
Identify/explain/discuss risk as a result of entrepre-neurial activities
TA07, lines 149–151: “I write it down there, because the figures decrease, (..) the number of pieces will go down which impacts both and therefore the loss relates to both.”
11TEAM
Explain/describe behavior in intrapreneurial teams TA05, lines: 16–17: “well, actually workload should be distributed equally. (.) But the individual preferences should be considered.”
12DIST
Explain/describe disruptions in the project process as a result of entrepreneurial problems
TA01, lines 319–320: “this was 1000 before and 1100 now to 620 and 700. Of course this has a big impact on the profit; certainly they can’t cover the amount anymore. The one who ceased and the Break-Even-Point slide backwards.”
13REF
Consider an entrepreneurial project as a whole TA26, lines 156–157: “Ah, this means we punctually make his first profit over 3000 Euro in the second quarter. Apart from the fact that they really make more than 100 per month. Okay, this fits.”
14DEF
Formulate strong sales/penetration arguments TA11, lines 252–254: “as you can see from my calcula-tions in the appendix, the profit will cover the invest-ment costs until the end of the second quarter in the third financial year (thus, after 2.5 years) if everything functions in an optimal way.”
Thereby arguing commercially
Adequate/reasonable/complete sentence structure
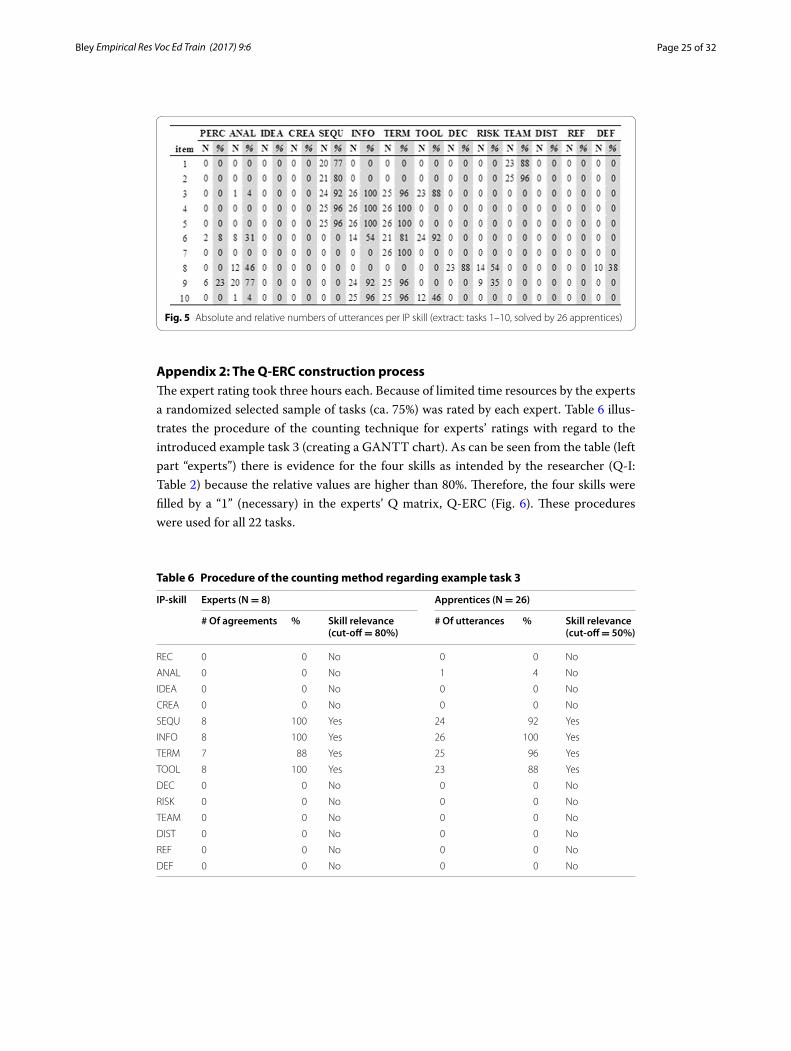
Page 25 of 32Bley Empirical Res Voc Ed Train (2017) 9:6
Appendix 2: The Q‑ERC construction processThe expert rating took three hours each. Because of limited time resources by the experts a randomized selected sample of tasks (ca. 75%) was rated by each expert. Table 6 illus-trates the procedure of the counting technique for experts’ ratings with regard to the introduced example task 3 (creating a GANTT chart). As can be seen from the table (left part “experts”) there is evidence for the four skills as intended by the researcher (Q-I: Table 2) because the relative values are higher than 80%. Therefore, the four skills were filled by a “1” (necessary) in the experts’ Q matrix, Q-ERC (Fig. 6). These procedures were used for all 22 tasks.
Fig. 5 Absolute and relative numbers of utterances per IP skill (extract: tasks 1–10, solved by 26 apprentices)
Table 6 Procedure of the counting method regarding example task 3
IP-skill Experts (N = 8) Apprentices (N = 26)
# Of agreements % Skill relevance (cut-off = 80%)
# Of utterances % Skill relevance (cut-off = 50%)
REC 0 0 No 0 0 No
ANAL 0 0 No 1 4 No
IDEA 0 0 No 0 0 No
CREA 0 0 No 0 0 No
SEQU 8 100 Yes 24 92 Yes
INFO 8 100 Yes 26 100 Yes
TERM 7 88 Yes 25 96 Yes
TOOL 8 100 Yes 23 88 Yes
DEC 0 0 No 0 0 No
RISK 0 0 No 0 0 No
TEAM 0 0 No 0 0 No
DIST 0 0 No 0 0 No
REF 0 0 No 0 0 No
DEF 0 0 No 0 0 No

Page 26 of 32Bley Empirical Res Voc Ed Train (2017) 9:6
Appendix 3: The Q‑ATAC construction processEach two-hour think-aloud session was held at the research institute in separate rooms that were equipped with computers running the technology-based platform “ALUSIM.” Whole sessions were accompanied by test administrators who were seated outside the examinees’ field of view and who interrupted the think-aloud process only after a silence of more than five seconds to remind the examinees to continue speaking. The adminis-trators started with a standardized instruction and a preliminary think-aloud practice session (example: solving logic puzzles). All 26 sessions were recorded on tape and after-wards transcribed in accordance with Dresing and Pehl (2011). The (in)correctness of each task was captured automatically within the technology-based platform. Because of the one-by-one survey situation, all participants were highly motivated and therefore
Fig. 6 Q-ERC
Fig. 7 Q-ATAC
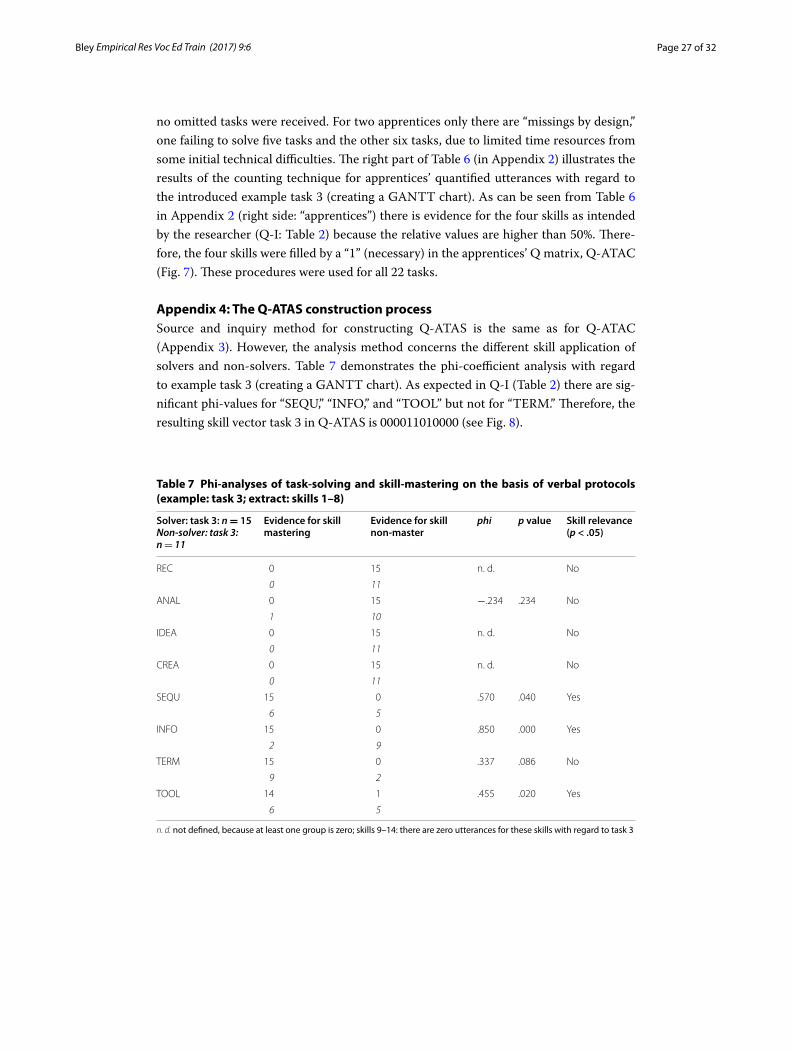
Page 27 of 32Bley Empirical Res Voc Ed Train (2017) 9:6
no omitted tasks were received. For two apprentices only there are “missings by design,” one failing to solve five tasks and the other six tasks, due to limited time resources from some initial technical difficulties. The right part of Table 6 (in Appendix 2) illustrates the results of the counting technique for apprentices’ quantified utterances with regard to the introduced example task 3 (creating a GANTT chart). As can be seen from Table 6 in Appendix 2 (right side: “apprentices”) there is evidence for the four skills as intended by the researcher (Q-I: Table 2) because the relative values are higher than 50%. There-fore, the four skills were filled by a “1” (necessary) in the apprentices’ Q matrix, Q-ATAC (Fig. 7). These procedures were used for all 22 tasks.
Appendix 4: The Q‑ATAS construction processSource and inquiry method for constructing Q-ATAS is the same as for Q-ATAC (Appendix 3). However, the analysis method concerns the different skill application of solvers and non-solvers. Table 7 demonstrates the phi-coefficient analysis with regard to example task 3 (creating a GANTT chart). As expected in Q-I (Table 2) there are sig-nificant phi-values for “SEQU,” “INFO,” and “TOOL” but not for “TERM.” Therefore, the resulting skill vector task 3 in Q-ATAS is 000011010000 (see Fig. 8).
Table 7 Phi‑analyses of task‑solving and skill‑mastering on the basis of verbal protocols (example: task 3; extract: skills 1–8)
n. d. not defined, because at least one group is zero; skills 9–14: there are zero utterances for these skills with regard to task 3
Solver: task 3: n = 15Non‑solver: task 3: n = 11
Evidence for skill mastering
Evidence for skill non-master
phi p value Skill relevance (p < .05)
REC 0 15 n. d. No
0 11
ANAL 0 15 −.234 .234 No
1 10
IDEA 0 15 n. d. No
0 11
CREA 0 15 n. d. No
0 11
SEQU 15 0 .570 .040 Yes
6 5
INFO 15 0 .850 .000 Yes
2 9
TERM 15 0 .337 .086 No
9 2
TOOL 14 1 .455 .020 Yes
6 5
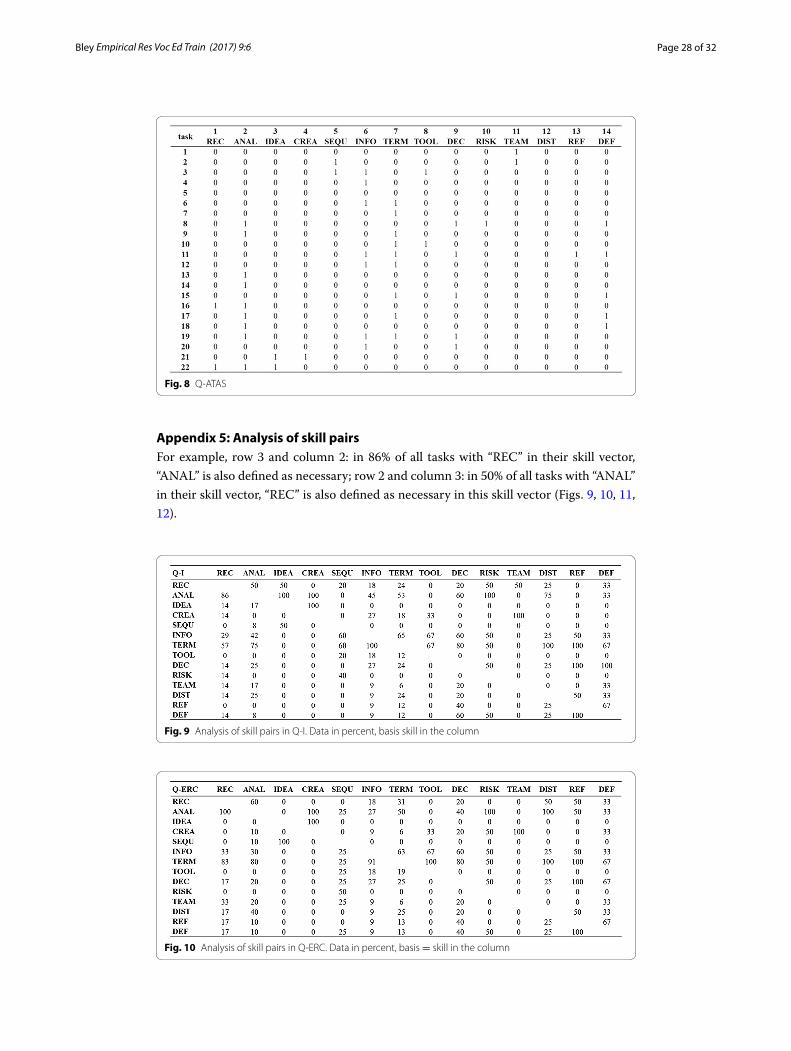
Page 28 of 32Bley Empirical Res Voc Ed Train (2017) 9:6
Appendix 5: Analysis of skill pairsFor example, row 3 and column 2: in 86% of all tasks with “REC” in their skill vector, “ANAL” is also defined as necessary; row 2 and column 3: in 50% of all tasks with “ANAL” in their skill vector, “REC” is also defined as necessary in this skill vector (Figs. 9, 10, 11, 12).
Fig. 8 Q-ATAS
Fig. 9 Analysis of skill pairs in Q-I. Data in percent, basis skill in the column
Fig. 10 Analysis of skill pairs in Q-ERC. Data in percent, basis = skill in the column

Page 29 of 32Bley Empirical Res Voc Ed Train (2017) 9:6
Appendix 6: Final Q matrix (Q‑MATCH3)See Fig. 13.
Fig. 11 Analysis of skill pairs in Q-ATAC. Data in percent, basis skill in the column; n.d. not defined
Fig. 12 Analysis of skill pairs in Q-ATAS.
Fig. 13 Final Q matrix (Q-MATCH3) on the basis of seven skills and 24 tasks
Page 30 of 32Bley Empirical Res Voc Ed Train (2017) 9:6
Received: 14 November 2016 Accepted: 17 February 2017
ReferencesAchtenhagen F, Winther E (2014) Workplace-based competence measurement: developing innovative assessment
systems for tomorrow’s VET programmes. J Vocat Educ Train 66(3):281–295Antončič B, Hisrich RD (2001) Intrapreneurship: construct refinement and cross-cultural validation. J Bus Ventur
16(5):495–527Beck K, Landenberger M, Oser F (eds) (2016) Technologiebasierte Kompetenzmessung in der beruflichen Bildung—
Resultate aus dem Forschungsprogramm ASCOT. Bertelsmann, BielefeldBillet S (2002) Toward a workplace pedagogy: guidance, participation, and engagement. Adult Educ Q 53(1):27–43Bley S, George AC (2017) Kognitive Diagnosemodelle zur Begleitung individualisierter Lehr- und Lernprozesse: Neue
Möglichkeiten aus einem alternativen Ansatz? Zeitschrift für Berufs- und Wirtschaftspädagogik 113(1):56–85Bley S, Wiethe-Körprich M, Weber S (2015) Formen kognitiver Belastung bei der Bewältigung technologiebasierter
authentischer Testaufgaben: Eine Validierungsstudie zur Abbildung von beruflicher-Kompetenz. Zeitschrift für Berufs- und Wirtschaftspädagogik 111(2):268–294
Breuer K, Hillen S, Winther E (2009) Business and administration. In: Baethge M, Arends L (eds) Feasibility study VET-LSA. A comparative analysis of occupational profiles and VET programmes in 8 European countries—international report. Bonn
Bühner M, Ziegler M (2008) Statistik für Psychologen und Sozialwissenschaftler. Pearson, MunichBusemeyer MR, Trampush C (2012) The comparative political economy of collective skill formation. In: Busemeyer MR,
Trampush C (eds) The political economy of collective skill formation. Oxford University Press, New York, pp 3–38Chi MTH (1997) Quantifying qualitative analyses of verbal data: a practical guide. J Learn Sci 6(3):271–315Darling-Hammond L, Herman J, Pellegrino J, Abedi J, Aber JL, Baker E, Bennett R, Gordon E, Haertel E, Hakuta K, Ho A, Linn
RL, Pearson PD, Popham J, Resnick L, Schoenfeld AH, Shavelson R, Shepard LA, Shulman L, Steele CM (2013) Criteria for high-quality assessment. Stanford Center for Opportunity Policy in Education, Stanford, CA
de la Torre J (2008) DINA model and parameter estimation: a didactic. J Educ Behav Stat 34(1):115–130. doi:10.3102/1076998607309474
de la Torre J, Douglas J (2004) Higher-order latent trait models for cognitive diagnosis. Psychometrika 69:333–353de la Torre J, Minchen N (2014) Cognitively diagnostic assessments and the cognitive diagnosis model framework.
Psicología Educativa 20(2):89–97Dresing T, Pehl T (2011) Praxisbuch Transkription: Regelsysteme, Software und praktische Anleitungen für qualitative
ForscherInnen, 2nd edn. Eigenverlag, MarburgEricsson KA, Simon HA (1996) Protocol analysis: verbal reports as data: revised edition (2nd print). Bradford book. The MIT
Press, CambridgeFederal Ministry of Education and Research (2014) Report on vocational education and training 2014. http://www.bmbf.
de/pub/Report_on_Vocational_Education_and_Training_2014_bf.pdfGao L, Rogers WT (2011) Use of tree-based regression in the analyses of L2 reading test items. Lang Test 28(1):77–104.
doi:10.1177/0265532210364380García PE, Olea J, de la Torre J (2014) Application of cognitive diagnosis models to competency-based situational judge-
ment test. Psicothema 26(3):372–377George AC, Robitzsch A (2015) Cognitive diagnosis models in R: a didactic. Quant Methods Psychol 11(3):189–205George AC, Robitzsch A, Kiefer T, Groß J, Ünlü A (2016) The R Package CDM for cognitive diagnosis modeling. J Stat Softw
74(2):1–24Gierl MJ, Cui Y (2008) Defining characteristics of diagnostic classification models and the problem of retrofitting in cogni-
tive diagnostic assessment. Meas Interdiscip Res Perspect 6(4):263–268Gorin J (2007) Test construction and diagnostic testing. In: Leighton JP, Gierl MJ (eds) Cognitive diagnostic assessment for
education. Theory and applications. Cambridge University Press, Cambridge, pp 173–204Habermann SJ, von Davier M, Lee Y-J (2008) Comparison of multidimensional item response models: multivariate normal
distributions versus multivariate polytomous ability distributions. ETS, PrincetonHaertel EH (1989) Using restricted latent class models to map the skill structure of achievement items. J Educ Meas
26:301–323Hattie J (2012) Visible learning for teachers: maximizing impact on learning. Routledge, LondonHelm C, Bley S, George AC, Pocrnja M (2015) Potentiale kognitiver Diagnosemodelle für den berufsbildenden Unterricht.
In: Stock M, Schlögl P, Schmid K, Moser D (eds) Kompetent—wofür? Life-skills—Beruflichkeit—Persönlichkeitsbil-dung. StudienVerlag, Innsbruck, pp 206–224
Interstate Teacher Assessment and Support Consortium (2011) Model core teaching standards: a resource for state dialogue. Council of Chief State School Officers, Washington, DC
Janesick VJ (2006) Authentic assessment. Lang Primer, New YorkJang EE (2009) Cognitive diagnostic assessment of L2 reading comprehension ability: validity arguments for fusion
model application to Language assessment. Lang Test 26(1):31–73KMK (2002) Rahmenlehrplan für den Ausbildungsberuf Industriekaufmann/Industriekauffrau. http://www.kmk.org/filead-
min/Dateien/pdf/Bildung/BeruflicheBildung/rlp/industriekfm.pdfKMK (2004) Standards für die Lehrerbildung: Bildungswissenschaften (Beschluss der Kultusministerkonferenz vom
16.12.2004). http://www.kmk.org/fileadmin/veroeffentlichungen_beschluesse/2004/2004_12_16-Standards-Lehrerbildung.pdf. Accessed 21 Aug 2014
Korunka C, Frank H, Lueger M, Ebner M (2009) Entwicklung und Prüfung eines Modells zur Förderung von Intrapreneur-ship in der dualen Berufsausbildung. Zeitschrift für Personalpsychologie 8(3):129–146
Page 31 of 32Bley Empirical Res Voc Ed Train (2017) 9:6
Kunina-Habenicht O, Rupp AA, Wilhelm O (2009) A practical illustration of multidimensional diagnostic skills profil-ing: comparing results from confirmatory factor analysis and diagnostic classification models. Stud Educ Eval 35(2–3):64–70
Kunina-Habenicht O, Rupp AA, Wilhelm O (2012) The impact of model misspecification on parameter estimation and item-fit assessment in log-linear diagnostic classification models. J Educ Meas 49(1):59–81
Leighton JP, Gierl MJ (2007) Defining and evaluating models of cognition used in educational measurement to make inferences about examinees’ thinking processes. Educ Meas Issues Prac 26:3–16
Leighton JP, Gierl MJ, Hunka SM (2004) The attribute hierarchy model for cognitive assessment: a variation on Tatsuoka’s rule-space approach. J Educ Meas 41:205–237
Leow RP, Morgan-Short K (2004) To think aloud or not to think aloud: the issue of reactivity in SLA research methodology. Stud Second Lang Acquis 26:35–57
Li H, Suen HK (2013) Constructing and validating a Q-matrix for cognitive diagnostic analyses of a reading test. Educ Assess 18(1):1–25
Maydey-Olivares A (2013) Goodness-of-fit assessment of item response theory models. Meas Interdiscip Res Perspect 11:71–137
Mayring P (2010) Qualitative Inhaltsanalyse. Grundlagen und Techniken. Beltz, WeinheimMislevy RJ, Haertel GD (2006) Implications of evidence-centered design for educational testing. Educ Meas Issues Prac
25(4):6–20Mislevy RJ, Oranje A, Bauer MI, von Davier A, Hao J, Corrigan S, Hoffman E, DiCerbo K, John M (2014) Psychometric
considerations in game-based assessment. http://www.instituteofplay.org/wp-content/uploads/2014/02/GlassLab_GBA1_WhitePaperFull.pdf
Nichols PD, Joldersma K (2008) Cognitive diagnostic assessment for education: theory and applications. J Educ Meas 45(4):407–411
Oser FK (1997) Standards in der Lehrerbildung: Teil 1 Berufliche Kompetenzen, die hohen Qualitätsmerkmalen entspre-chen. Beiträge zur Lehrerbildung 15(1):26–37
Oser FK, Salzmann P, Heinzer S (2009) Measuring the competence-quality of vocational teachers: an advocatory approach. Empir Res Vocat Educ Train 1:65–83
Pellegrino JW (2010) The design of an assessment system for the race to the top: a learning sciences perspective on issues of growth and measurement. Educational Testing Service, Princeton
Pellegrino JW (2014) Assessment as a positive influence on 21st century teaching and learning: a systems approach to progress. Psicología Educativa 20:65–77
Pellegrino JW, Hilton ML (eds) (2012) Education for life and work: developing transferable knowledge and skills in the 21st century. National Academies Press, Washington, DC
Pellegrino JW, Chudowsky N, Glaser R (2001) Knowing what students know: the science and design of educational assessment. National Academy Press, Washington, DC
Pellegrino JW, DiBello LV, Goldman SR (2016) A framework for conceptualizing and evaluating the validity of instruction-ally relevant assessments. Educ Psychol 51(1):59–81
Perlman B, Gueths J, Weber DA (1988) The academic intrapreneur. Strategy, innovation, and management in higher education. Praeger, New York
Pressley M, Afflerbach P (1995) Verbal protocols of reading: the nature of constructively responsive reading. Erlbaum, Hillsdale
R Core Team (2015) R: a language and environment for statistical computing. R Foundation for Statistical Computing, Vienna
Ravand H (2016) Application of a cognitive diagnostic model to a high-stakes reading comprehension test. J Psychoeduc Assess 30:1–18
Roussos LA, DiBello LV, Stout WF (2007) Review of cognitively diagnostic assessment and a summary of psychometric models. In: Rao CR, Sinharay S (eds) Handbook of statistics: v. 26 psychometrics, 1st edn. Elsevier, Amsterdam, pp 979–1030
Roussos LA, DiBello LV, Henson RA, Jang E, Templin JL (2010) Skills diagnosis for education and psychology with IRT-based parametric latent class models. In: Embretson SE (ed) Measuring psychological constructs: advances in model-based approaches. American Psychological Association, Washington, DC, pp 35–69
Rupp AA, Templin JL (2008) The effects of Q-matrix misspecification on parameter estimates and classification accuracy in the DINA model. Educ Psychol Meas 68:78–96
Rupp AA, Templin JL, Henson RA (2010) Diagnostic measurement: theory, methods, and applications. Methodology in the social sciences. Guilford Press, New York
Sawaki Y, Kim H-J, Gentile C (2009) Q-Matrix construction: defining the link between constructs and test items in large-scale reading and listening comprehension assessments. Lang Assess Q 6(3):190–209
Shavelson RJ (2012) Assessing business planning competence using the colligate learning assessment. Empir Res Vocat Educ Train 4(1):77–90
Shrout PE, Fleiss JL (1979) Intraclass correlation: uses in assessing rater reliability. Psychol Bull 86:420–428Sorrel MA, Olea J, Abad FJ, de la Torre J, Aguado D, Lievens F (2016) Validity and reliability of situational judgement test
scores: a new appraoch based on cognitive diagnosis models. Organ Res Methods 19(3):506–523Tatsuoka KK (1983) Rule space: an approach for dealing with misconceptions based on item response theory. J Educ
Meas 20(4):345–354Taylor KL, Dionne J-P (2000) Accessing problem-solving strategy knowledge: the complementary use of concurrent
verbal protocols and retrospective debriefing. J Educ Psychol 92(3):413–425Trost S, Weber S (2012) Fähigkeitsanforderungen an kaufmännische Fachkräfte—Eine kompetenzbasierte Analyse von
Stellenanzeigen mittels O*NET. Zeitschrift für Berufs- und Wirtschaftspädagogik 108(2):217–242Tynjälä P (2013) Toward a 3-P model of workplace learning: a literature review. Vocat Learn 6(1):11–36Wang C, Gierl MJ (2011) Using the attribute hierarchy method to make diagnostic inferences about examinees’ cognitive
skills in critical reading. J Educ Meas 48:165–187

Page 32 of 32Bley Empirical Res Voc Ed Train (2017) 9:6
Weber S, Lehtinen E (2014) Transition from school-to-work and its challenges. Unterrichtswissenschaft 42(3):194–205Weber S, Trost S, Wiethe-Körprich M, Weiß C, Achtenhagen F (2014) Intrapreneur: An entrepreneur within a company—
an approach on modeling and measuring intrapreneurship competence. In: Weber S, Oser FK, Achtenhagen F, Fretschner M, Trost S (eds) Becoming an entrepreneur. Sense Publishers, Rotterdam, pp 256–287
Weber S, Wiethe-Körprich M, Bley S, Weiß C, Achtenhagen F (2015) Intrapreneurship-Verhalten an kaufmännischen Arbeitsplätzen: Analysen von Projektberichten. Empirische Pädagogik, Sonderheft Ökonomische Kompetenzen in Schule, Ausbildung und Hochschule 28(1):84–105
Weber S, Draxler C, Bley S, Wiethe-Körprich M, Weiß C, Gürer C (2016a) Der Projektverbund CoBALIT—intrapreneurship: large scale-assessments in der kaufmännischen Berufsausbildung. In: Beck K, Landenberger M, Oser F (eds) Tech-nologiebasierte Kompetenzmessung in der beruflichen Bildung—Resultate aus dem Forschungsprogramm ASCOT. Bertelsmann, Bielefeld, pp 75–92
Weber S, Wiethe-Körprich M, Bley S, Weiß C, Draxler C, Gürer C (2016b) Modellierung und Validierung eines Intrapreneur-ship-Kompetenz-Modells bei Industriekaufleuten. Unterrichtswissenschaft 44(2):149–168
Wiggins GP (1998) Educative assessment: designing assessments to inform and improve student performance, 1st edn. Jossey-Bass, San Francisco
Wilson MR (2005) Constructing measures. An item response modeling approach. Lawrence Erlbaum Associates, MahwahWinther E, Achtenhagen F (2009) Measurement of vocational competencies—a contribution to an international large-
scale assessment on vocational education and training. Empir Res Vocat Educ Train 1(1):85–108Wirtz M, Caspar F (2007) Beurteilerübereinstimmung und Beurteilerreliabilität. Hogrefe, GöttingenWunderer R, Bruch H (2000) Umsetzungskompetenz. Diagnose und Förderung in Theorie und Unternehmenspraxis.
Vahlen, MünchenXu X, von Davier M (2008) Fitting the structured general diagnostic model to NAEP data (No. 27). ETS, Princeton