Embed Size (px)
Citation preview

MONITORING AND EVALUATION FRAMEWORK
FOR CLIMATE CHANGE ADAPTATION ACTIVITIES
ON PROVINCIAL LEVEL IN VIETNAM
Developing an M&E Framework
Institute of Meteorology, Hydrology and Environment, Vietnam
Regional Resource Centre for Asia-Pacific, Asian Institute of Technology

Project “Facilitate the national adaptation planning processes” Implemented by IMHEN and RRC.AP, 2016
2
Table of Contents
1. INTRODUCTION 3
2. APPROACH AND METHODOLOGY FOR M&E OF CLIMATE CHANGE ADAPTATION PROJECTS AT THE PROVINCIAL LEVEL 3
2.1. DPSIR framework 3
2.2. Linkages between the DPSIR framework, climate risks and adaptive capacity 4
2.3. Usage of the DPSIR framework in M&E of adaptation projects 5
3. OPERATION GUIDELINES FOR ADAPTATION M&E SYSTEM 6
3.1. Elements of the Adaptation M&E Framework 7
3.2. Steps for implementing M&E at the provincial level 7
3.6. Developing a baseline scenario 14
4. SUMMARY 15
5. ACKNOWLEDGEMENTS 15
6. ANNEX 16
6.1. Interview questions to identify DPSIR factors 16
6.2. References 17

Project “Facilitate the national adaptation planning processes” Implemented by IMHEN and RRC.AP, 2016
3
1. Introduction
Climate change is predicted to have influences on individuals as well as the social - economic develop-ment. To effectively respond to climate change, methods and tools for policymaking and implementa-tion should support stakeholders at different levels.1 Climate change adaptation activities have been carried out in many sectors and have partly proven their effectiveness in responding to climate change, reducing poverty and ensuring sustainable development in Vietnam. However, there are no adequate guidelines for monitoring and evaluation of the effectiveness of climate change adaptation activities at both national and provincial level. Normally, adaptation projects funded by international organisa-tions are monitored and evaluated with their own M&E system. However, those funded by the gov-ernment are monitored and evaluated as projects, which means that climate adaptive effectiveness will not be considered.
In addition, the absence of adaptation M&E in Vietnam is a barrier for climate change adaptation man-agement. For instance, the Department of Meteorology, Hydrology and Climate Change - a managerial agency for climate change – is not able to collect or aggregate information from each province on their achievement on adaptation. Hence, the department is not able to capture the countrywide progress of adaptation stipulated as national goals.
The core functions of an adaptation M&E system are to support and promote effective adaptation activities and avoid maladaptation. In addition, an adaptation M&E system may help to explain why and how adaptation activities can achieve good results.
Without an effective adaptation M&E system, provincial governments are neither able to review the progress and effectiveness of individual adaptation projects toward the provincial goals on climate change nor to report to the central government.
Therefore, the aim of this guideline is to suggest to provincial governments to develop and implement adaptation M&E for their adaptation projects. It can also help them to improve on-going adaptation activities and to track their adaptation progress.
2. Approach and methodology for M&E of climate change adaptation projects at the provincial level
DPSIR framework
The DPSIR framework is a classification system of environmental indicators most prominently used by the European Environmental Agency.2 While other systems maybe available, this one can be seen as an international standard.
The Driver-Pressure-State-Impact-Response (DPSIR) framework provides a conceptual connection be-tween ecosystem change and the driving forces of such change, together with the effects of pressure of ecosystem and impact on livelihood3. The figure below shows an example of the conceptual connec-tion.
1 Julia Laukkonen, 2009
2 EEA 1999
3 Khajuria & Ravindranath 2012: 5

Project “Facilitate the national adaptation planning processes” Implemented by IMHEN and RRC.AP, 2016
4
Figure 1: Extended analysis covered by DPSIR framework
Driving forces are the underlying causes, which lead to environmental pressures (Drivers). Examples are the human demands for agricultural land, energy, industry, transport and housing. These driving forces lead to Pressures on the environment, for example the exploitation of resources (land, water, minerals, fuels, etc.) and the emission of pollution. The pressures, in turn, affect the State of the envi-ronment. This refers to the quality of the various environmental media (air, soil, water, etc.) and their consequent ability to support the demands placed on them (for example, supporting human and non-human life, supplying resources, etc.). Changes in the State may have an Impact on human health, ecosystems, biodiversity, amenity value, financial value, etc. Impacts may be expressed in terms of the level of environmental harm. To avoid negative effects or impacts, communities must implement suit-able measures (Response) to solve the problems identified by the assessed impacts, e.g. policy measures, and planning actions.
Very often, M&E in development projects focus on indicators that measure Pressure and State; less often they include indicators that measure Drivers, Impacts and Responses. Neglecting these, how-ever, loses the critical causal links among the indicator classes, leading to limited M&E and short-term adjustment of a particular system without a comprehensive view over long-term climate resilience building. The Box below illustrates an example of disconnection of DPSIR.
Box 1: An example about DPSIR
Moreover, it appears as though Drivers and State follow a circular pattern, e.g., poverty makes people vulnerable to climate change – therefore climate change makes people poor and, thus, even more vulnerable. Completing the DPSIR framework allows us to look further down the horizon: what is the likely future impact of the current state? How can possible responses affect either, drivers, pressures, or state?
Linkages between the DPSIR framework, climate risks and adaptive capacity
Each of the indicator categories in the DPSIR can be a measure for risk and adaptive capacity. In fact, the main questions asked to evaluate for adaptation responses are:
Responses
Impacts
State
Pressures
Drivers
Increased drought frequency, saltwater intrusion and resulting degradation of agricultural soil qual-ity (State) may result from a combination of sea-level rise and decreases in river flows (Pressure). While global warming drives sea-level rise, which cannot be controlled or solved at the local level, the decrease in river flows may be driven by non-climate-related, i.e., human-induced factors (e.g. overuse of upstream water for agricultural production). If we look into climate-related Pressure and State indicators only, i.e. sea level rise and decreased rainfall and river flow, the analysis of the scale and geographical coverage of future Impacts (e.g. decreased crop yield) is limited and the scope of adaptation measures narrowed. Consequently, the adaptation actions would not be ro-bust enough to increase the long-term climate resilience of socio-ecological systems.

Project “Facilitate the national adaptation planning processes” Implemented by IMHEN and RRC.AP, 2016
5
(a) do the responses reduce risk?
(b) do the responses improve adaptive capacity?4
The advantage provided by the DPSIR framework is that the linkage of one category with another de-termines the effect of risk to and adaptive capacity of the target population, e.g., high salinity increases the risk of negative effects on yields.
Risk indicators are usually mathematical and do not include complexity and scale effects.5 Adaptive capacity indicators are usually composite indices6, which include several dimensions that may become counter-indicative. This reduces the value of these indices and their significance becomes doubtful. Therefore, we suggest not including an indicator for adaptive capacity and risk per se, but rather de-veloping indicators, which are single measures and provide pinpointed information to decision-mak-ers. For example, the IPCC defines adaptive capacity as determined by economic wealth, technology, information and skills, infrastructure, institutions and equity.7 Rather than wrapping these indicators into one meta-index we suggest to keep the indicators separate to understand what they actually measure. The challenge, therefore, is to develop a representation, in which these indicators can be measured separately but do not become too complex for policy actors to be able to use them in deci-sions.
Usage of the DPSIR framework in M&E of adaptation projects
When applying the DPSIR approach, responses or project interventions will normally aim to address climate change issues related as causes leading to environmental pressures (Drivers), the reduction of pressure on the environment (Pressure), the improvement of the environment and their consequent ability to support the demands placed on them (State), or the reduction in impact on human health, ecosystems, biodiversity, amenity value, financial value, etc. (Impact).
4 Khajuria & Ravindranath 2012
5 Birkmann 2007
6 Jones et al. 2010
7 Jones et al. 2010

Project “Facilitate the national adaptation planning processes” Implemented by IMHEN and RRC.AP, 2016
6
3. Operation guidelines for adaptation M&E system
Figure 2: Proposed Climate Change Adaptation M&E Framework in Viet Nam

Project “Facilitate the national adaptation planning processes” Implemented by IMHEN and RRC.AP, 2016
7
Implementing adaptation M&E involves a number of steps and entities (Figure 2). It is important that project implementers conduct the monitoring process in accordance to a set of agreed indicators. This is because they are most familiar with the intent, goals, outcomes and results of the project; it is also because the monitoring process then becomes a management tool that supports the effective and efficient implementation of the project. Beside the project’s progress and direct outcomes, the adap-tation monitoring process should also consider the long-term impacts regarding climate change adap-tation. These refer to the vulnerability, adaptive capacity or sustainability aspects related to adaptation project.
Monitoring reports should be submitted to the relevant management level such as project manage-ment units (PMUs) or donors, if required. It should also be evaluated by third parties such as research institutes, universities or experts before announcing or reporting to higher levels (NAP reporting pro-cess, national communication on climate change…). Hence, the monitoring and the evaluation can be separate processes within the same project.
Elements of the Adaptation M&E Framework
The following details the various elements of the Vietnam M&E process, which are suggested to be part of the NAP process currently under development.
Monitoring:
The process of monitoring progress, results and impacts of adaptation projects can be based upon 3 factors. Firstly, the progress and results of adaptation activities are monitored in accordance with goals set out. Monitoring this factor aims at ensuring the results are achieved as planned. This process is similar to the M&E of other project types.
Secondly, the DPSIR aspects are monitored to assess whether or not the project contributes to a (long-term) adaptation process.
Finally, co-benefits of adaptation projects are also monitored to assess the sustainability impacts. The monitoring process is carried out by the collaboration between investors and project implementers.
Reporting:
Indicators for evaluating the effectiveness of adaptation project are designed in templates. Monitoring indicators are reported or submitted to relevant authorities as PMU and donors. The report on adap-tation effectiveness is sent to national focal points on climate change at both provincial and national level. Then, it is used for conducting the National Communications. This process will make adaptation activities more transparent in terms of both international supporting resources and domestic efforts.
Evaluation:
The indicators and assessment reports are approved by the focal points on climate change at provincial and national levels. Indicators and reports should be evaluated by a third party, which has appropriate expertise and authority. The third party might be a research institute, a university or an independent organization. All expert groups must have professional capacity to assess the effectiveness of climate change adaptation measures. They should be recognised or certified by the focal point on climate change at local and national level.
The evaluation of an adaptation assessment report has to verify the appropriateness, transparency and accuracy of the monitoring process. A third party can make use of other research results in the province as well as observation data or can undertake interviews and surveys in the project implemen-tation area. After the report is approved, the effectiveness of the project can be recognized by local and central level authorities published by donors as well as domestic and international stakeholders. However, it should be noted that adaptation M&E should be implemented with a short-term and long-term perspective.
Steps for implementing M&E at the provincial level
Step 1: Understanding the CCA context by applying guiding questions

Project “Facilitate the national adaptation planning processes” Implemented by IMHEN and RRC.AP, 2016
8
The following lists some guiding questions, which help to understand the specific CCA risk and adaptive capacity profile in a particular location. The questions are used to start developing indicators, which could measure the critical dimensions of the adaptation complex. They can be applied in an interview or focus group discussion situation with experts and decision makers in situ. In this case the DPSIR framework helps to organise the dimensions of inquiry and classify each risk/potential as to how it related to climate change.
Following is a detailed list of questions to help understand the CCA context of a given location:
Pressure:
P1. List all past and recent natural disasters or extreme weather events.
P2. Please describe how these phenomena have changed in recent decades.
Driving forces:
D1. What are the underlying causes of these natural disaster and extreme weather events? What are the natural and what are the human-induced impacts?
D2. According to you, how have these natural disasters and extreme weather events changed in the past decades?
State:
S1: Could you please list the effect of disaster risks on natural resources of the province (soil quality, water quality & quantity, biodiversity, etc)?
S2: How have the effects changed in the last decades?
Impacts:
I1. Could you please list the impacts of natural disaster on people’s livelihoods and the economy of the province?
I2. How have the impacts on people’s livelihood and the economy changed in the last decades?
I3. Could you please list the impacts of natural disaster on community/society health?
I4. How have the impacts on community/society health changed in the recent decades?
I5. Could you please list the impacts of natural disaster on the provincial infrastructure?
I6. How have the impacts on the provincial infrastructure changed in the recent decades?
Responses:
R1. Could you please tell us the name of adaptation policies, programs, project have been imple-mented in province?
R2. Could you please tell us the goal of adaptation policies, programs, project have been imple-mented in province?
R3. Could ỵou please list the result of adaptation policies, programs, project have been imple-mented in province?
R4. Could you please tell us the name of adaptation policies, programs, project have been imple-menting in province?
R5. Could you please tell us the goal of adaptation policies, programs, project have been imple-menting in province?
R6. Could you please tell us the progress of implementation of adaptation policies, programs, pro-ject have been implementing in province?
R7. Could you please tell us the name of adaptation policies, programs, project will have to be im-plemented in province?
R8. Could you please tell us the goal of adaptation policies, programs, project will have to be im-plemented in province?

Project “Facilitate the national adaptation planning processes” Implemented by IMHEN and RRC.AP, 2016
9
Step 2: Obtaining information on on-going projects relevant to DPSIR context assessed
After characterising the CCA context, the information is organised in a table to clarify the relation be-tween DPSIR in the location. This can help to answer the question “Which projects address CCA and contribute to risk reduction / increase of adaptive capacity?” An example of such a DPSIR table in Hau Giang Province can be seen as follows.
Drivers Pressures States Impacts Responses
- Changes in pre-cipitation;
- Changing up-stream activities such as building reservoirs or hy-dropower dams;
The increase in number of drill-ing well;
Saltwater intru-sion
Loss in rice cuti-vation
- Building sluice gates
- The DARD has implemented some projects to deal with saltwa-ter intrusion and to better adapt to climate change impacts
- Hau Giang ap-plies advanced technology to deal with saltwa-ter intrusion since 2015
- Changes in tem-perature;
- Changes in pre-cipitation;
- Local activities: Urbanization and industrialization, intensive agricul-ture (use of chemical pesti-cides, intense land use and loss biodiversity);
- Extreme weather events become more frequent and se-rious;
- Change of the hydrological re-gime of the Delta
- Land subsides in Mekong delta, which can be even more seri-ous than sea level rise (sea level rise is 2 – 10 mm/year but in some area 1-4 cm/year of land subside)
- Soil erosion and land subsides
- A higher fre-quency and in-tensity of floods
- Fresh water: About 2000 households are effected
- Livelihoods: About 2000 households lost their livelihoods due to less flood-ing with major impacts on rice production
- Pilot project to transform the ag-riculture sector to better adapt to climate change impacts since 2014. Research on potential land use changes from 3 rice to 2 rice crops and shrimp farming; or po-tential changes to other more re-silient species like corn or cas-sava
- Construction of an embankment in south Hau Giang for flood prevention
Step 3: Choosing dimensions in accordance with provincial goals on CC
This step is guided by the primary question “Which adaptive dimensions are addressed by a specific project?”

Project “Facilitate the national adaptation planning processes” Implemented by IMHEN and RRC.AP, 2016
10
Different adaptation activities cannot be measured by a single set of indicators. We can choose devel-opment, resource management, disaster risk management, or other appropriate indicators to assess the adaptation progress in a particular climate context. However, the main challenge is to determine the specific adaptation impacts through selected indicators, i.e., has risk been mitigated or has adap-tive capacity been strengthened?
Climate change adaptation M&E dimensions can assist in focusing on indicator selection. Each dimen-sion represents a different aspect of measuring sustainable adaptation. Rather than striving for a com-prehensive set of indicators, which would make measurements overly complex and impractical, the dimensions make sure that each major aspect is covered in the M&E process. Moreover, different interventions could benefit from using a variant set of indicators, such as a tailored set of process and result indicators. Figure 5 lists a set of general dimensions, which are meant to comprise a set of indi-cators, each associated with the particular aspect of climate adaptation: Finance, food security, insti-tutions, policy, acceptability, ecosystem services, environment, economy and infrastructure.
Figure 3: Suggested Climate Change Adaptation M&E Dimensions
Step 4: Choosing relevant indicators
Fig 5 provides a suggestion on standard adaptation dimensions as per the dominant literature. Note that the dimensions measured may shift in time according to policy priorities and the state-of-the-art in climate adaptation research. When assessing provincial level adaptability, however, projects would have to be assessed according to the same dimensions, even though individual indicators may vary from case to case. This ensures robustness and comparability over time.
When agreeing upon M&E dimensions, it is important that all concerned parties share a common view on what the provincial-level adaptation goals are, which are, in turn, informed by the priority climate change issues occurring in the Province as well as national policy. Since the M&E framework is meant as a tool to measure performance, improve coordination, and report advancements, the shared view and joint agreement by actors at project, provincial, and national level (including possible donors) are critical to the feasibility of the framework.
Suggested dimensions and indicators:
The dimensions in Fig 5 attempt to cover all relevant dimensions of climate adaptation along the DPSIR framework. They are also informed by the fact that climate adaptation is primarily a social exercise, i.e., relates strongly to existing institutions, plans, policies, infrastructure and livelihoods. The social

Project “Facilitate the national adaptation planning processes” Implemented by IMHEN and RRC.AP, 2016
11
aspect of adaptation is reflected in most of the dimensions (finance, economy, institutions, policy); the physical environment is reflected in other dimensions, such as food security infrastructure and ecosys-tem services.
The dimensions suggested include only aspects of the natural environment as they affect people’s vulnerability or adaptive capacity. Other parts of natural ecosystems that may be affected by climate change, but have no relation to human systems, are not considered.
The indicators within each dimension must be treated as suggestions only. Again, it depends on the stakeholders’ agreement as to which indicators are suitable/feasible/measurable/desirable for moni-toring. Ideally, each project would be measured against the same indicators for comparability and compatibility. However, often it will not be possible for projects to cover all of the dimensions, de-pending on their focus and targets. Therefore, the dimensions help to monitor the coverage of various aspects of adaptation by several projects – if the results yield that certain dimensions are not covered by a suite of projects available this identifies a gap in the overall adaptation strategy of the province.
Similarly, and because projects are inherently different in the way they are set up, it is difficult to define the same indicators across all the projects. Therefore, different indicators can be defined for the vari-ous dimensions to be covered. Note that the indicators are meant to be proxy indicators, which means trying to come as close to measuring a particular dimension as possible by using an indicator that de-scribes a part, but not necessarily the whole of the said dimension. Indicators may vary from project to project according to measurability. The following is list of ideas for indicators to cover the respective dimensions shown in Fig 5.
1. Finance
• $$ Committed to adaptation / % of budget committed to adaptation
• Growth rate of budgeting for adaptation
• Adaptation line items in provincial budgets
• Adaptation mainstreamed into Government operations
2. Food Security
• Kcal/cap.d-1
• Kg rice/cap.a-1
• % Population below poverty level
• %
• Household expenditure for food items
• t rice production/cap.a-1
3. Institutions
• Climate adaptation section established within DONRE (at Province and District levels)
• Climate adaptation office established within Dept Irrigation/DARD
• Climate adaptation research units at local University
• Climate adaptation on the People’s Committee’s and Party’s policy agenda
• # projects on CCA in Province
• # projects with international partners in Province
Project “Facilitate the national adaptation planning processes” Implemented by IMHEN and RRC.AP, 2016
12
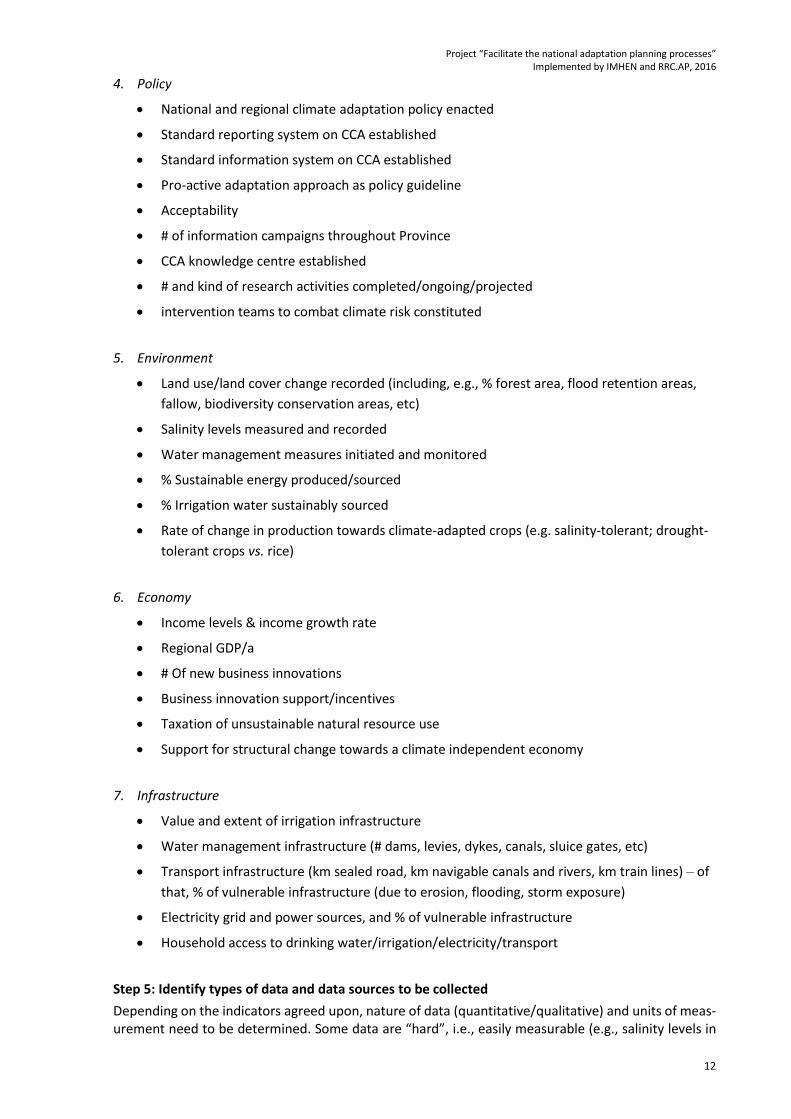
4. Policy
• National and regional climate adaptation policy enacted
• Standard reporting system on CCA established
• Standard information system on CCA established
• Pro-active adaptation approach as policy guideline
• Acceptability
• # of information campaigns throughout Province
• CCA knowledge centre established
• # and kind of research activities completed/ongoing/projected
• intervention teams to combat climate risk constituted
5. Environment
• Land use/land cover change recorded (including, e.g., % forest area, flood retention areas,
fallow, biodiversity conservation areas, etc)
• Salinity levels measured and recorded
• Water management measures initiated and monitored
• % Sustainable energy produced/sourced
• % Irrigation water sustainably sourced
• Rate of change in production towards climate-adapted crops (e.g. salinity-tolerant; drought-
tolerant crops vs. rice)
6. Economy
• Income levels & income growth rate
• Regional GDP/a
• # Of new business innovations
• Business innovation support/incentives
• Taxation of unsustainable natural resource use
• Support for structural change towards a climate independent economy
7. Infrastructure
• Value and extent of irrigation infrastructure
• Water management infrastructure (# dams, levies, dykes, canals, sluice gates, etc)
• Transport infrastructure (km sealed road, km navigable canals and rivers, km train lines) – of
that, % of vulnerable infrastructure (due to erosion, flooding, storm exposure)
• Electricity grid and power sources, and % of vulnerable infrastructure
• Household access to drinking water/irrigation/electricity/transport
Step 5: Identify types of data and data sources to be collected
Depending on the indicators agreed upon, nature of data (quantitative/qualitative) and units of meas-urement need to be determined. Some data are “hard”, i.e., easily measurable (e.g., salinity levels in

Project “Facilitate the national adaptation planning processes” Implemented by IMHEN and RRC.AP, 2016
13
a particular place); other data are more complex to describe, e.g., political strategies or impacts on vulnerability. In the latter case it is legitimate to use qualitative descriptions of phenomena as long as they provide information about the process or action being taken. It is important, however, to bear in mind that each indicator must fit into the DPSIR framework, i.e., it must be part of the overall storyline as to how the observed phenomenon contributes to climate adaptation.
Step 6: Collect and aggregate data
This step includes the actual data collection. After determining dimensions and indicators, as well as identifying data and sources, data need to be filled into template forms. For this project, MS Excel-based forms will be used. Commonly, the M&E project team will collect data; in other cases, however, it may be necessary to work with local authorities and agencies to access the required data. If data should not be available or too difficult to access, this information must be fed back to the M&E team, who will then choose alternative indicators and respective data.
Step 7: Analysis
The data does not yet tell the story. Once data is collected, it is fed into the spreadsheet for analysis.
In order to become meaningful as results, data must be evaluated against policy targets and/or best
practice. Only in a context do data become meaningful results. The analysis may determine how far
the current state is located from the desired state; how much activity is being conducted in a given
area; what the distance to any desired measure may be; or whether an intervention has the desired
impact.
For this project, a form on analysis is planned, which measures adaptation gaps by viewing the dis-
tance between observed risk and level of adaptive capacity. This means that, for each identified di-
mension, there is an indicator defining the risk state and adaptive capacity level.
Developing a baseline scenario
Once a set of appropriate indicators have been identified, baseline values can be recorded for com-paring conditions before, during, and after the implementation of the intervention. In addition to the possible time series, the baseline can be considered when determining appropriate targets for the intervention.
Understanding the baseline enables managers to form realistic and timely targets for adaptation ac-tivities. One target of adaptation activity may correspond to one measured dimension. Information and data collected through the risk assessment can assist managers in selecting appropriate goals. From there, the M&E team can develop assumptions about the risk faced to achieve each goal and the resources required to achieve them.
Another way to track longer-term change in a baseline value, which might otherwise be hard to quan-tify due to changing conditions, is to identify a range of possible outcomes with ratings of indicators, which can then be used to monitor progress. Several guidelines should be adhered to when developing adaptation baselines:
1. Review and synthesize existing information on current gap, climate risk, and current adapta-
tion measures based on previous studies, expert opinions, and policy context.
2. Describe adaptation policies and measures in place that affecting the ability of successfully
cope with climate change.
3. Develop baseline indicators of vulnerability and adaptive capacity that take into account the
historical trend of indicators over time. Note that whether there is a trend upward or down-
ward over the last 5 or 10 years that can be drawn from existing records or statistics.
In the process of identifying basic values, there may be some indicators without basic data or incom-plete data, or may not be accurate. In such cases, alternative baselines can be set, or other appropriate indicators may be reduced.

Project “Facilitate the national adaptation planning processes” Implemented by IMHEN and RRC.AP, 2016
14
The key questions that managers need to consider when establishing the adaptive baselines include:
- Do the baselines provide a clear picture about the risks or vulnerabilities that are intended to
intervene to solve?
- Do the baselines allow distinguishing and monitoring changes caused by climate change,
non-climate impacts and activities (Step 6)?
- Are there priorities for action that is be made clearer with the information collected to form
the basis?
- Are these objectives based on the fundamental documents, and the available monitoring re-
sources?
- Should the baselines be changed and edited over time? If yes, how to frequently re-evaluate
the baseline if there is progress on the goals?
4. Summary
This framework includes elements of a M&E Adaptation monitoring system, which could potentially find its way into the Vietnam NAP process currently under development. The framework and the prac-tical steps provided were developed with the intent to provide an easy-to-use, relevant and simple measurement of the adaptation risks as well as adaptive capacity. While it still reflects the necessary complexity of the issue at hand, the suggest framework is meant to be carried out by local government officers with a responsibility for climate adaptation policy. With the help of experts from IMHEN, the local governments should be able to apply the M&E system for their own benefit in tracking and as-sessing their adaptation measures for impact and effect.
The framework starts with applying the DPSIR framework, used by the European Environmental Agency, in order to link up underlying causes, effects, ramifications, and responses. This represents a departure from traditional impact frameworks, which do not encompass the socio-economic amplifi-ers of climate change symptoms.
Furthermore, the framework presented here suggests maintaining flexibility of the M&E system by applying a modular approach. Depending on local priorities, policy goals and environmental condi-tions, indicators selected to measure baseline and progress can vary. The general dimensions of meas-urements, however, should be retained fixed so as to guarantee comparability and robustness of the system.
The framework suggests building a simple tracking tool for local climate officers, in order to apply the information collected for local decisions and monitoring progress. The tool should be simple and prac-tical enough for use by non-experts, while still reflecting sufficient complexity of climate change im-pacts and responses.
The project team will focus on collecting data and building an adaptation tracking tool to demonstrate that local government can apply an M&E system, which is useful and can find its way into the national NAP process when scaled up. The outcome of these efforts can be seen in the final project report.
5. Acknowledgements
This report has been written by xxx, xxx, xxx, Markus Schwegler (IMHEN), Hiromi Inagaki and Clemens Grunbuhel (RRCAP-AIT). The authors gratefully acknowledge the inputs of Anh Do of IMHEN and Sup-pakorn Chivanno of SEA-START (Thailand)

Project “Facilitate the national adaptation planning processes” Implemented by IMHEN and RRC.AP, 2016
15
6. Annex
Interview questions to identify DPSIR factors
Pressure:
P1. List all past and recent natural disasters or extreme weather events.
P2. Please describe how these phenomena have changed in recent decades.
Driving forces:
D1. What are the underlying causes of these natural disaster and extreme weather events? What are the natural and what are the human-induced impacts?
D2. According to you, how have these natural disasters and extreme weather events changed in the past decades?
State:
S1: Could you please list the effect of disaster risks on natural resources of the province (soil quality, water quality & quantity, biodiversity, etc)?
S2: How have the effects changed in the last decades?
Impacts:
I1. Could you please list the impacts of natural disaster on people’s livelihoods and the economy of the province?
I2. How have the impacts on people’s livelihood and the economy changed in the last decades?
I3. Could you please list the impacts of natural disaster on community/society health?
I4. How have the impacts on community/society health changed in the recent decades?
I5. Could you please list the impacts of natural disaster on the provincial infrastructure?
I6. How have the impacts on the provincial infrastructure changed in the recent decades?
Responses:
R1. Could you please tell us the name of adaptation policies, programs, project have been imple-mented in province?
R2. Could you please tell us the goal of adaptation policies, programs, project have been implemented in province?
R3. Could ỵou please list the result of adaptation policies, programs, project have been implemented in province?
R4. Could you please tell us the name of adaptation policies, programs, project have been implement-ing in province?
R5. Could you please tell us the goal of adaptation policies, programs, project have been implementing in province?
R6. Could you please tell us the progress of implementation of adaptation policies, programs, project have been implementing in province?
R7. Could you please tell us the name of adaptation policies, programs, project will have to be imple-mented in province?
R8. Could you please tell us the goal of adaptation policies, programs, project will have to be imple-mented in province?

Project “Facilitate the national adaptation planning processes” Implemented by IMHEN and RRC.AP, 2016
16
References
1. OECD. 2005. The Paris Declaration on Aid Effectiveness. Full text available at: http://www.oecd.org/document/19/0,3746,en_2649_3236398_43554003_1_1_1_1,00.html.
2. Summary of five core principles available at: http://www.oecd.org/docu-ment/18/0,3746,en_2649_3236398_35401554_1_1_1_1,00.html.
3. GIZ. 2008. Results-based Monitoring: Guidelines for Technical Cooperation. http://www.csr-weltweit.de/uploads/tx_jpdownloads/wirkungsorientiertes-monitoring-leitfaden-en_01.pdf.
4. IPCC. 2007. Fourth Assessment Report. Glossary of Synthesis Report. Available at: http://www.ipcc.ch/pdf/assessment-report/ar4/syr/ar4_syr_appendix.pdf.
5. UNDP 2007c. Human Development Report (HDR) 2007/2008. Fighting Climate Change: Hu-man solidarity in a divided world. Available at: http://hdr.undp.org/en/me-dia/HDR_20072008_EN_Complete.pdf.
6. Phạm Văn Tấn và Trần Thục 2016, Thỏa thuận Pa-ri và những việc cần thực hiện tại Việt Nam;
7. Sina Wartmann, Chris Dodwell and Seyni Nafo 2014, LDC concerns related to MRV in the cli-mate regime.
8. IPCC 2007, The Fourth Assessment Report on Climate Change, the International Panel on Cli-mate Change.
9. Michaelowa, Axel, and Michel Koehler. 2011. “Monitoring the adaptive effect of GIZ’ natural resource management and adaptation projects.” Perspectives Climate Change.
10. VMWG 2013, Tác động của biến đổi khí hậu đối với hoạt động tài chính vi mô: Nghiên cứu trong trường hợp Đồng bằng sông Cửu Long Việt Nam, Nhóm công tác tài chính vi mô Việt Nam.
11. McGray, Heather, et al. 2007. Weathering the Storm: Options for Framing Adaptation and De-velopment. WRI. Available at: http://www.wri.org/publication/weathering-the-storm.
12. World Bank. 2011. India: Andhra Pradesh Drought Adaptation Initiative. Lessons from Com-munity Based Adaptation Approaches to Strengthen Climate Resilience. Final Report. South Asia Region, India Country Management Unit, Sustainable Development Department, Environ-ment, Water Resources and Climate Change Unit. April 2011.
13. Christian Aid. 2009. Community Answers to Climate Chaos: Getting Climate Justice from the UNFCCC. Available at: http://www.christianaid.org.uk/images/community-answers-to-cli-mate-chaos.pdf.
14. CARE. 2010. Climate Change Adaptation Tools for Action. Available at: http://www.care.org/getinvolved/advocacy/climatechange/ourwork_adaptation_tools.asp.
15. Huq, Saleemul, and Hannah Reid. 2007. A Vital Approach to the Threat Climate Change Poses to the Poor. IIED. Available at: http://www.iied.org/pubs/pdfs/17005IIED.pdf.
16. Pettengell, Catherine. 2010. Climate Change Adaptation: Enabling People Living in Poverty to Adapt. Oxfam. Available at: http://www.oxfam.org/en/policy/climate-change-adaptation.
17. wikiAdapt. 2008. “Community-Based Adaptation (CBA) Projects.” Available at: http://wikiadapt.org/index.php?title=Community-Based_Adaptation_%28CBA%29_projects.
18. GEF. 2011. LDCF/SCCF Adaptation Monitoring and Assessment Tool (AMAT). Available at: http://www.thegef.org/gef/tracking_tool_LDCF_SCCF.
19. GEF. 2008. CPP Namibia: Adapting to Climate Change through the Improvement of Traditional Crops and Livestock Farming (CCA) Project Document. Available at: http://www.ge-fonline.org/projectDetailsSQL.cfm?projID=2915.

Project “Facilitate the national adaptation planning processes” Implemented by IMHEN and RRC.AP, 2016
17
20. World Bank. 2010. Pilot Program for Climate Resilience (PPCR). Climate Investment Funds (CIF). Available at: http://www.climateinvestmentfunds.org/cif/ppcr.
21. AFB. 2010. Project Level Result Frameworks and Baseline Guidance Document. Adaptation Fund Board, Ethics and Finance Committee. Available at: http://www.adaptation-fund.org/system/files/AFB.EFC_.2.3%20Project%20level%20results%20frame-work%20and%20baseline%20guidance%20document.pdf.
22. AFB. 2009. Results Based Management Framework. Adaptation Fund Board. Available at: http://www.adaptation-fund.org/system/files/AFB.B.8.8_RBM.pdf.
23. GEF Evaluation Office. 2008. Background and Elements for a GEF Monitoring and Evaluation Framework on Adaptation. Available at: http://www.thegef.org/gef/node/344.
24. DANIDA. 2009. Evaluation of the Operation of the Least Developed Countries Fund for Adap-tation to Climate Change. Evaluation Department, Ministry of Foreign Affairs of Denmark. Available at: http://www.oecd.org/dataoecd/44/24/43989776.pdf.
25. DANIDA. 2010. Follow up to the LDCF Evaluation. GEF. Available at: http://www.thegef.org/gef/sites/thegef.org/files/documents/Fol-lowup%20to%20LDCF%20Evaluation%20DANIDA%20mem%20b%20.pdf.
26. Government of Bangladesh. 2006. National Adaptation Programme of Action (NAPA), Ministry of Environment and Forest. Available at: http://unfccc.int/resource/docs/napa/ban01.pdf.
27. Government of India. 2008. National Action Plan on Climate Change. Available at: http://pmindia.nic.in/Pg01-52.pdf.
28. Government of Uganda. 2007. Uganda National Adaptation Programmes of Action. Available at: http://www.preventionweb.net/files/8578_uga01.pdf.
29. NCAP. 2005. Netherlands Climate Action Program (NCAP). Available at : http://www.nlcap.net/.
30. UNDP. 2010. Adaptation Policy Frameworks for Climate Change: Developing Strategies, Poli-cies and Measures: Annexes. Available at: http://www.undp.org/gef/documents/publica-tions/apf-annexes-a-b.pdf.
31. Dessai, Suraje, and Jeroen van der Sluijs. 2007. Uncertainty and Climate Change Adaptation: A Scoping Study. Copernicus Institute for Sustainable Development and Innovation. Utrecht, The Netherlands. Available at: http://nws.chem.uu.nl/publica/Publicaties2007/NWS-E-2007-198.pdf.
32. GIZ. 2011. Integrating Climate Change Adaptation into Development Co-operation. A Practice-Oriented Training Based on the OECD Policy Guidance. Handouts. Available at: http://www.oecd.org/dataoecd/8/4/46905379.pdf.
33. Adger, N. W., Arnell, N. W. and Tompkins, E. L. (2005) Successful adaptation to climate change across scales. Global Environmental Change, Vol.15: 77 - 86.
34. Dinshaw, A. et al, 2014, Monitoring and Evaluation of Climate Change Adaptation: Methodo-logical Approaches, OECD Environment Working Papers, No. 74, OECD Publishing;
35. Gertler, Pual J. et al. 2011. Impact Evaluation in Practice. Washington DC: World Bank. Availa-ble at: http://siteresources.worldbank.org/EXTHDOFFICE/Resources/5485726-1295455628620/Impact_Evaluation_in_Practice.pdf.
36. Khandker, Shahidur R., Gayatri B. Koolwal and Hussain A. Samad. 2009. Handbook on Impact Evaluation: Quantitative Methods and Practices. Washington DC: World Bank. Available at: http://www-wds.worldbank.org/external/default/WDSContent-Server/WDSP/IB/2009/12/10/000333037_20091210014322/Ren-dered/PDF/520990PUB0EPI1101Official0Use0Only1.pdf

Project “Facilitate the national adaptation planning processes” Implemented by IMHEN and RRC.AP, 2016
18
37. Kropp, Juergen, and Michael Scholze. 2009. Climate Change Information for Effective Adapta-tion. A Practitioner‘s Manual. GIZ and PIK. Available at: http://ccsl.iccip.net/gtz2009-0175en-climatechange-information.pdf.
38. Hahn, Marlene and Alexander Fröde. 2010. Climate Proofed: Climate Proofing for Develop-ment. Adapting to Climate Change, Reducing Risk. Deutsche Gesellschaft für Technische Zusammenarbeit (GIZ). November 2010. Available at http://www2.gtz.de/dokumente/bib-2010/gtz2010-0714en-climate-proofing.pdf.
39. UNFCCC. 2010. Adaptation Assessment, Planning and Practice: An Overview from the Nairobi Work Programme on Impacts, Vulnerability and Adaptation to Climate Change. Available at: http://unfccc.int/resource/docs/publications/10_nwp_adap_assess_en.pdf.
40. Yohe, G., and Richard S.J. Tol. 2001. Indicators for Social and Economic Coping Capacity–Mov-ing Toward a Working Definition of Adaptive Capacity. Available at: http://www.aiaccpro-ject.org/resources/ele_lib_docs/gyoheindicators.doc.pdf.
41. Baas, Stephan, and Selvaraju Ramasamy. 2008. Food and Agriculture Organization. Improved Adaptive Capacity to Climate Change for Sustainable Livelihoods in the Agriculture Sector. Summary Report, Project Phase 1. Community Based Adaptation in Action. Available at: http://www.fao.org/nr/clim/abst/clim_080303_en.htm.
42. Appadurai, Arivudai Nambi. 2011. Responding to Climate Change: Adopting a Landscape Level Perspective. M.S. Swaminathan Research Foundation, Chennai India. Presented February 2, 2011, DSDS 201 – Special Event, IUCN-TERI.
43. Organizational Research Services. 2004. Theory of Change: A Practical Tool for Action, Results and Learning. Prepared for Annie E. Casey Foundation. Available at: http://www.aecf.org/up-load/publicationfiles/cc2977k440.pdf.
44. CIDA. 2004. CIDA Evaluation Guide. Available at: http://www.acdi-cida.gc.ca/inet/im-ages.nsf/vLUImages/Performancereview5/$file/English_E_guide.pdf
45. AFB. 2010a. An Approach to Implementing Results Based Management – RBM. Available at: http://www.adaptation-fund.org/system/files/AFB.EFC_.1.3.An%20Approach%20to%20Im-plementing%20RBM.pdf
46. UNDP. 2008. A Guide to the Vulnerability Reduction Assessment. Available at: http://www.undp-adaptation.org/projects/websites/docs/CBA_VRA_Guide_Dec_08.pdf.
47. GIZ. 2008. Results-based Monitoring: Guidelines for Technical Cooperation. http://www.csr-
weltweit.de/uploads/tx_jpdownloads/wirkungsorientiertes-monitoring-leitfaden-en_01.pdf.