Embed Size (px)
Citation preview

DEUTSCHE TELEKOM German Corporate ConferenCe niek Jan van Damme BoarD memBer for Germany
DISCLAIMER
This presentation contains forward-looking statements that reflect the current views of Deutsche Telekom management with respect to future events. These forward-looking statements include statements with regard to the expected development of revenue, earnings, profits from operations, depreciation and amortization, cash flows and personnel-related measures. You should consider them with caution. Such statements are subject to risks and uncertainties, most of which are difficult to predict and are generally beyond Deutsche Telekom’s control. Among the factors that might influence our ability to achieve our objectives are the progress of our workforce reduction initiative and other cost-saving measures, and the impact of other significant strategic, labor or business initiatives, including acquisitions, dispositions and business combinations, and our network upgrade and expansion initiatives. In addition, stronger than expected competition, technological change, legal proceedings and regulatory developments, among other factors, may have a material adverse effect on our costs and revenue development. Further, the economic downturn in our markets, and changes in interest and currency exchange rates, may also have an impact on our business development and the availability of financing on favorable conditions. Changes to our expectations concerning future cash flows may lead to impairment write downs of assets carried at historical cost, which may materially affect our results at the group and operating segment levels. If these or other risks and uncertainties materialize, or if the assumptions underlying any of these statements prove incorrect, our actual performance may materially differ from the performance expressed or implied by forward-looking statements. We can offer no assurance that our estimates or expectations will be achieved. Without prejudice to existing obligations under capital market law, we do not assume any obligation to update forward-looking statements to take new information or future events into account or otherwise. In addition to figures prepared in accordance with IFRS, Deutsche Telekom also presents non-GAAP financial performance measures, including, among others, EBITDA, EBITDA margin, adjusted EBITDA, adjusted EBITDA margin, adjusted EBIT, adjusted net income, free cash flow, gross debt and net debt. These non-GAAP measures should be considered in addition to, but not as a substitute for, the information prepared in accordance with IFRS. Non-GAAP financial performance measures are not subject to IFRS or any other generally accepted accounting principles. Other companies may define these terms in different ways.
2
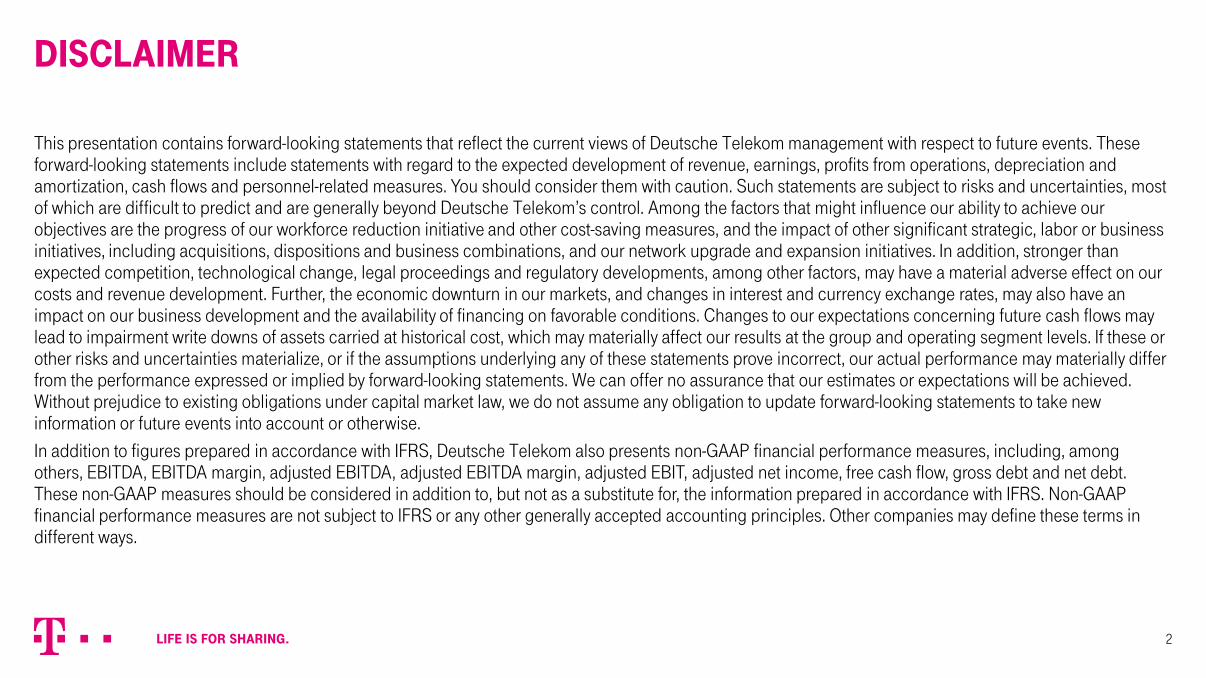
gERMAny: strateGy
3
LEADING EUROPEAN TELCO
INTEGRATED IP NETWORKS
WIN WITH PARTNERS
BEST CUSTOMER EXPERIENCE
LEAD IN BUSINESS
TRANSFORM PORTFOLIO
EVOLVE FINANCIAL TARGETS & EFFICIENCY
ENCOURAGE LEADERSHIP & PERFORMANCE DEVELOPMENT
Partnering Initiatives Steckerleiste
Mid-Market Initiative IT-Cloud DeutschlandLAN M2M
Integrated Network Strategy Network Quality IP- & Process
Transformation
MagentaEINS Next Generation TV E-Company
Stable revenues & EBITDA growth fund our transformation investments
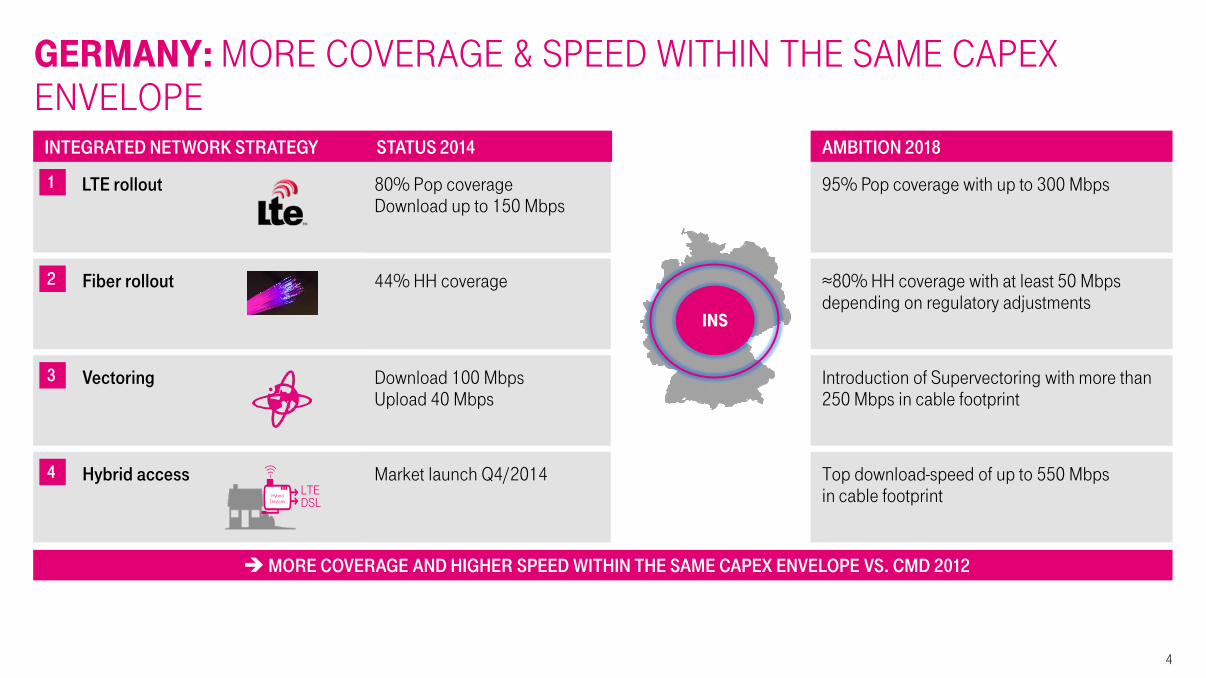
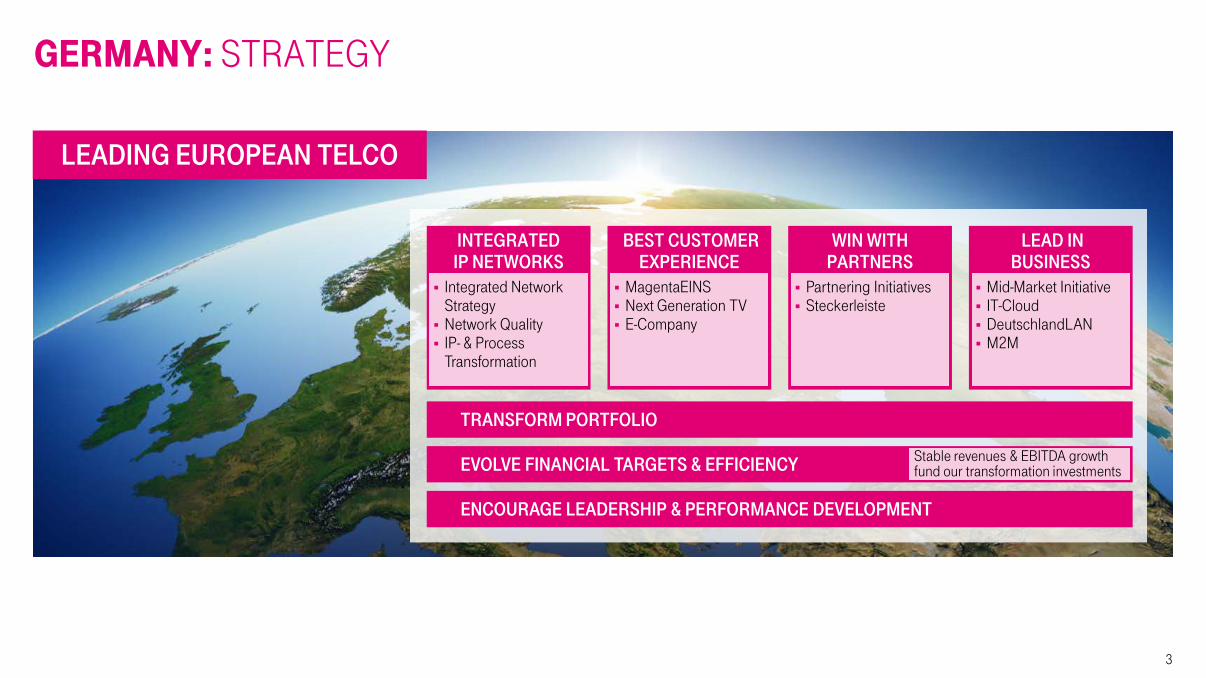
LTE rollout 1 80% Pop coverage Download up to 150 Mbps
Hybrid access 4 Market launch Q4/2014
Fiber rollout 2 44% HH coverage
Vectoring 3 Download 100 Mbps Upload 40 Mbps
gERMAny: more CoveraGe & speeD within the same Capex envelope
4
INTEGRATED NETWORK STRATEGY STATUS 2014 AMBITION 2018
DSL Hybrid
Devices
LTE
InS
MORE COVERAGE AND HIGHER SPEED WITHIN THE SAME CAPEX ENVELOPE VS. CMD 2012
95% Pop coverage with up to 300 Mbps
Top download-speed of up to 550 Mbps in cable footprint
≈80% HH coverage with at least 50 Mbps depending on regulatory adjustments
Introduction of Supervectoring with more than 250 Mbps in cable footprint

Higher Speed & Network Quality Easy self administration
Modular fixed mobile offers
Seamless Cloud integration & high scalability
BENEFITS FOR BUSINESS
gERMAny: transformation on traCk to aChieve 100% ip-Customers in 2018
5
Higher Speed & Network Quality Access to future Products and services Easy self-provisioning and set up via WEB & APP Less wiring at customer site
BENEFITS FOR CONSUMER
2014 2012 2016 2018
100%
≈60%
25%
4%
YE/14: 5.8 mn IP customer
FROM THE “OLD PSTN WORLD”… SHARE OF IP-ACCESS1 …TO THE “NEW IP ERA”
SP DP TP Business Mobile
Service
Control
Transport
Aggregation
Access
IAD & Inhouse
SP DP TP Business Mobile
Service
Control
Transport
Aggregation
Access
IAD & Inhouse
1 Incl. Wholesale

MARKET RESEARCH1
Customers prefer bundles from a single source
LOYALTY INCREASE
Reduce churn
NEW CUSTOMERS
Value based customer acquisition
CROSS-/UPSELLING
Leverage customer base
ADD ON MOBILE SIM’S
1.5 SIM cards per household
63%
gERMAny: maGenta eins: fixeD anD moBile are ConverGinG…
6
2.0
1.0 3.0
Add-on Mobile
Fixed-Mobile Household
MagentaEINS
OUR FIRST CONVERGED OFFER KEY GOALS 2018 (CONSUMER) CUSTOMER BASE
1
3
2
# mn
1 Market research based on customer survey (2014)
4

… anD GeneratinG aDDitional value throuGh Cross-/upsellinG
7
mob
ile
fixed
yes
no
yes no
Upsell/Fencing Cross-/Upsell
Cross-/Upsell New Customer
FMC CUSTOMER POTENTIAL MagentaEINS CUSTOMER BASE HIGHLIGHTS AFTER 4 MONTH
BOOST CUSTOMER LOYALTY1
75 Points TRI*M
INCREASED MAGENTAEINS REVENUES
≈4€/m per HH
GROWING SIM CARD PENETRATION
≈2 SIMs per HH
TRIPLE PLAY SHARE
>50%
1 TRI*M Index MagentaEINS customers
sim cards k
Q4/14
506
1% 37% 13%
49%
48%
1.266
15%
36%
906
37%
Q2/15 Q1/15
1%
15%
48%
1%
New Customers Cross/Up Upsell/Fencing Add on SIM 1
3
2
4

gERMAny: e-Company transformation with foCus on e-serviCe anD e-sales
8
Increase customer self service All sales and service processes are self-service enabled Customer self service via portal, app & magic button functionalities
Digital touch points & omni-channel approach Products and services are e-Channel enabled Seamless customer experience across all touch points
Optimized usability Plug and Play functionalities incl. optimized incident management
One Identity Management
EXCELLENT CUSTOMER EXPERIENCE “24/365”
Increase E-SALES1 1
Enhance LOYALTY (TRI*M)2 3
Reduce SERVICE CONTACTS 2
≈ 17% in 2018 10%
in 2014
-16% in 2018
≈ 64PP in 2018 60 PP
in 2014
1 Without IVM and Congstar 2 TRI*M Index for all Telekom customers

Q2/15
3,409
Q1/15
3,457
Q4/14
3,818
Q3/14
3,360
Q2/14
3,286
+3.7%2
Q1/15
2,211
Q4/14
2,000
Q3/14
2,324
Q2/14
2,256
-1.4%
2,224
Q2/15
845 840 858 840 845
2,507
1,881
2,452
2,061
5,723 5,589
Q4/14
236 264
Q1/15
2,503
2,098
Q3/14
5,587
241
2,500
2,006
Q2/14
5,464
231
Q2/15
5,580
+2.1%
2,047
2,439
249
gERMAny: revenues Continue to Grow supporteD By stronG moBile Growth anD staBle wholesale revenues
9
Wholesale services Mobile Others Core fixed
-2.7%
8.8%
+7.8%
0.0%
REVENUE1 ADJ. EBITDA AND MARGIN (IN %)
ADJ. OPEX
€ mn € mn
€ mn
41.3 41.6 34.9 39.6 39.9
1) Online consumer service revenues in “others” have been allocated to revenues from core fixed since Jan. 1st 2015. Prior year figures have been adjusted accordingly 2) Indirect costs reduced by 0.3% yoy

7,009
Q2/15 Q2/14
4,286
+63.5%
Q1/15
1,677
1,501
Q4/14
1,354 1,381
4,532 4,614
1,543
1,391
1,699
1,424
Q2/14
1,571
1,680
Q3/14
1,668
4,594 4,694 4,566
1,515
1,670
-0.6%
Q2/15
1,546
1,380
gERMAny MObILE: telekom Continues to outperform market
10
Telekom Vodafone Telefonica
1) Q1/15 impacted by reclassification of net +288k 2) Of own branded retail customers 3) Customers using a LTE-device and tariff plan including LTE
GERMAN MOBILE MARKET SERVICE REVENUE
SMARTPHONE PENETRATION2
€ mn
%
LTE CUSTOMERS3
000
+0.1%
236-194
198172
277197
4831
-524
289
-801
275 432 235
78
408 Own branded Service providers/MVNOs
+0.1%
CONTRACT NET ADDS
000
-2.0%
7770
Q2/14
+7pp
Q2/15
Q2/14 Q3/14 Q4/14 Q1/15 Q2/15
1,799
+11.2%
Q2/15
2,578
Q1/15
2,516
Q4/14
2,442
Q3/14
2,377
Q2/14
2,318
Q2/15
30.3
12.5 11.5
6.3
Q1/15
30.0
12.4 11.5
6.1
Q4/14
29.7
12.4 11.4
5.9
Q3/14
29.4
12.3 11.4
5.7
Q2/14
29.2
12.4 11.4
5.5
154 181 127128145
-9
410
-30%
Q2/15
118
Q1/15
131
Q4/14
155
Q3/14
193 12
Q2/14
168 14
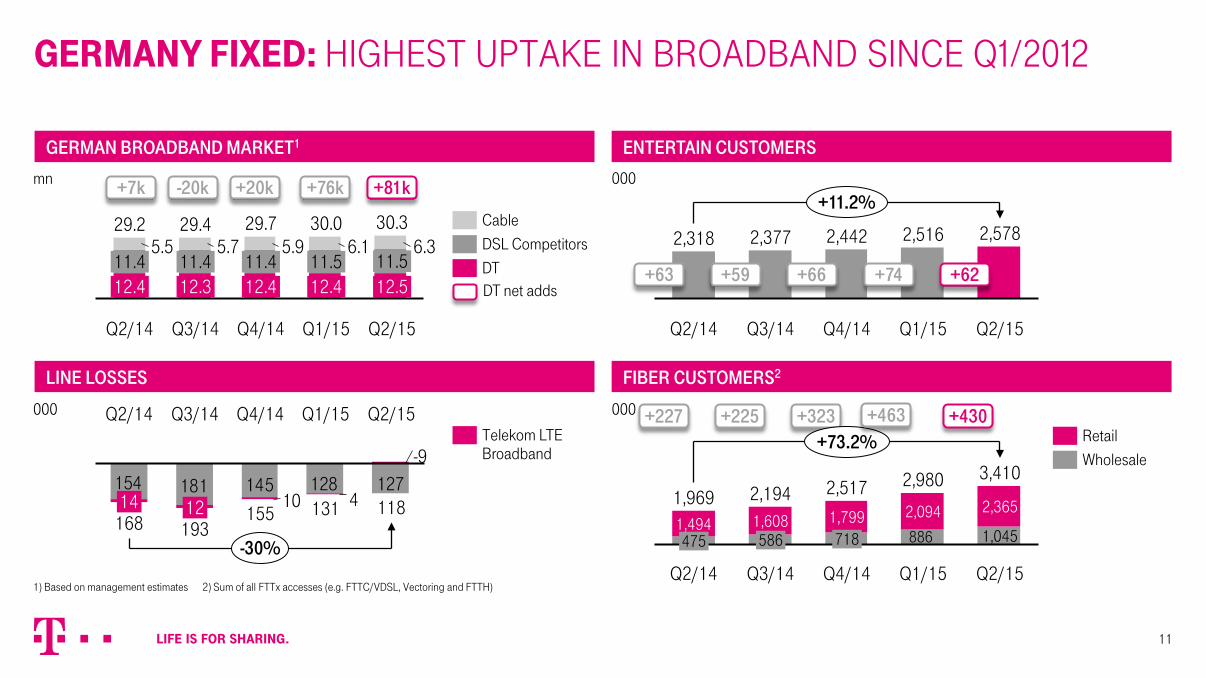
gERMAny FIxED: hiGhest uptake in BroaDBanD sinCe Q1/2012
11
Telekom LTE Broadband
DT DSL Competitors Cable
Wholesale Retail
GERMAN BROADBAND MARKET1
LINE LOSSES
ENTERTAIN CUSTOMERS
FIBER CUSTOMERS2
mn
000
000
000
DT net adds
+7k -20k +20k
+63 +59 +66
+227 +225 +323
+81k
+62
886 1,045
Q2/15
3,410
2,365
Q1/15
2,980
2,094
Q4/14
2,517
718 1,799
Q3/14
2,194
586 1,608
Q2/14
1,969
475 1,494
+73.2% +430
1) Based on management estimates 2) Sum of all FTTx accesses (e.g. FTTC/VDSL, Vectoring and FTTH)
+76k
+74
+463
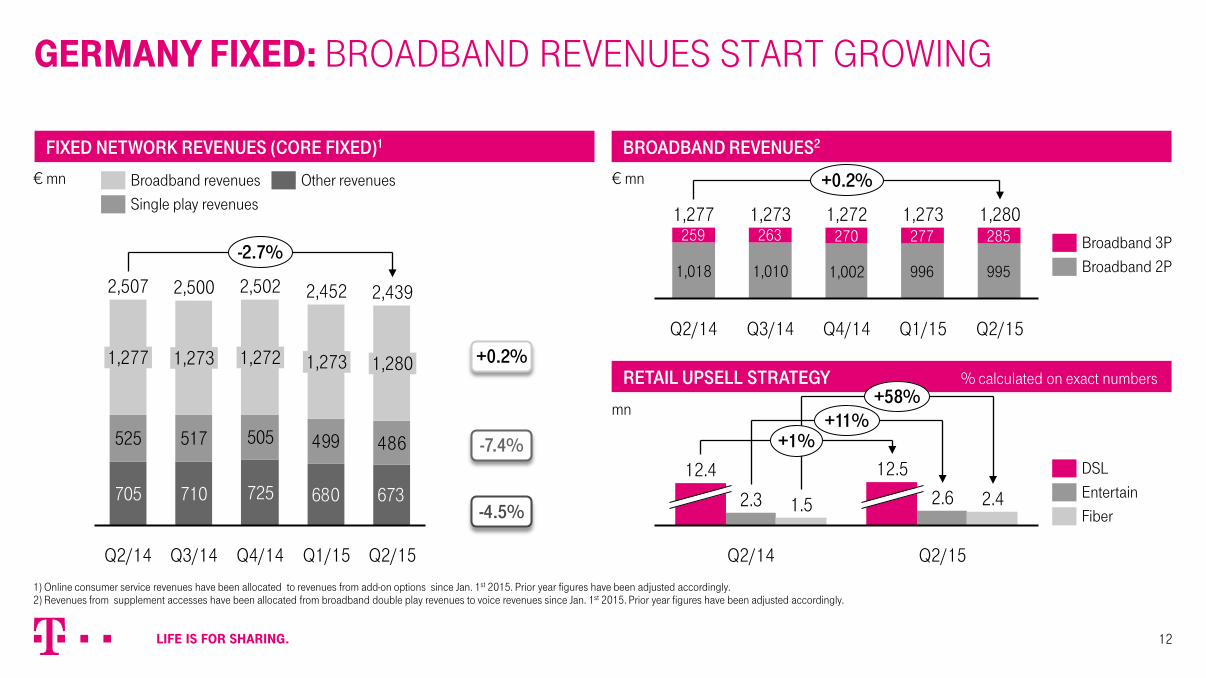
RETAIL UPSELL STRATEGY % calculated on exact numbers
259 263 270 277 285
995996
Q3/14
1,273 1,280
Q4/14 Q2/15
1,277
Q1/15 Q2/14
1,018
1,273
+0.2%
1,272
1,010 1,002
705 710 725 680 673
525 517 505 499 486
1,277
2,507
1,273
Q2/14
-2.7%
1,272
2,439
Q2/15
1,273
Q1/15
2,500
Q3/14
2,452
Q4/14
1,280
2,502
gERMAny FIxED: BroaDBanD revenues start GrowinG
12
Broadband revenues Single play revenues
Other revenues
Broadband 2P Broadband 3P
FIXED NETWORK REVENUES (CORE FIXED)1 BROADBAND REVENUES2
€ mn € mn
mn
+0.2%
-4.5%
-7.4%
1) Online consumer service revenues have been allocated to revenues from add-on options since Jan. 1st 2015. Prior year figures have been adjusted accordingly. 2) Revenues from supplement accesses have been allocated from broadband double play revenues to voice revenues since Jan. 1st 2015. Prior year figures have been adjusted accordingly.
Fiber Entertain DSL
2.4
12.5 +1%
+58%
Q2/14
12.4
Q2/15
+11%
1.5 2.6 2.3
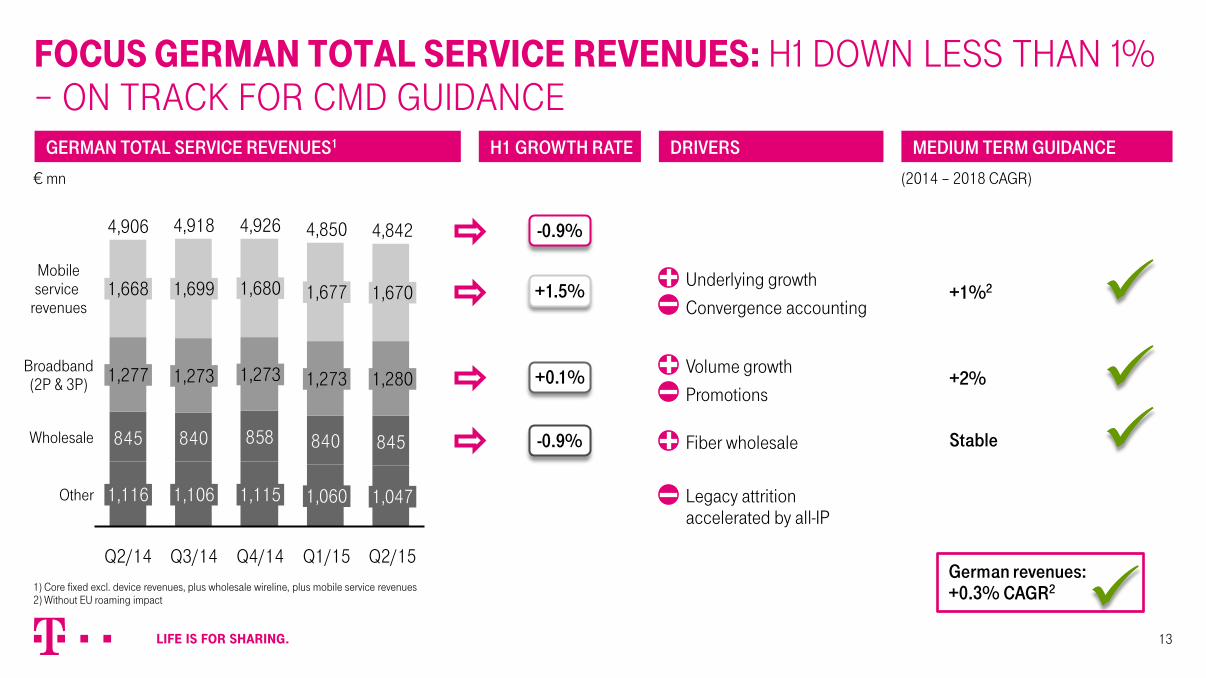
845 840 858 840 845
4,842
Q2/15
4,906
1,273 1,280
1,670
Q1/15
4,850
1,277
Q2/14
1,699 1,680
4,918
Q3/14 Q4/14
4,926
1,677
1,273 1,273
1,668
1,116 1,060 1,106 1,115 1,047 Other
Mobile service
revenues
Broadband (2P & 3P)
Wholesale
FOCUS gERMAn TOTAL SERvICE REvEnUES: h1 Down less than 1% – on traCk for CmD GuiDanCe
13
GERMAN TOTAL SERVICE REVENUES1
€ mn
+1.5%
-0.9%
+0.1%
H1 GROWTH RATE DRIVERS
Underlying growth
Convergence accounting
Volume growth
Promotions
Fiber wholesale
Legacy attrition accelerated by all-IP
MEDIUM TERM GUIDANCE
+1%2
+2%
Stable
1) Core fixed excl. device revenues, plus wholesale wireline, plus mobile service revenues 2) Without EU roaming impact
German revenues: +0.3% CAGR2
(2014 – 2018 CAGR)
-0.9%

gERMAny: miD term amBition level
14
1 Without EU roaming impact 2 Access market share in 2018
MID TERM AMBITION LEVEL YEAR
MARKET #1 in FMC with MagentaEINS: 3mn customers
#1 in mobile service revenue: CAGR ≈1%1/market share >36%
#1 broadband: CAGR ≈2%/market share >40%2
2018
2018
2018
QUALITY Customer loyalty index: ≈64 points 2018
FINANCIALS
Adj. EBITDA margin: ≈42%
Growing adj. EBITDA: CAGR 1–2%
Growing adj. cash contribution: CAGR ≈2% Revenue stabilization
2018
2014–2018
2014–2018 2016

Phone +49 228 181 - 8 88 80 +1 212 301 - 6114
www.telekom.com/investors www.twitter.com/DT_IR www.youtube.com/deutschetelekom
E-Mail [email protected]
Contact details for all IR representatives:
FURTHER QUESTIOnS please ContaCt the ir Department
15
INVESTOR RELATIONS CONTACT DETAILS
IR WEBPAGE
Follow us on
@DT_IR
IR TWITTER ACCOUNT IR YOUTUBE PLAYLIST
www.telekom.com/ircontacts

THAnK yOU!