Embed Size (px)
Citation preview

Deutsche Bank German & Austrian Corporate Conference
21 May 2010, Frankfurt
Dr Eckhard Cordes, CEO

1Deutsche Bank German & Austrian Corporate Conference
This presentation contains forward-looking statements which are based on certain expectations and assumptions at the time of publication of this presentation and are subject to risks and uncertainties that could cause actual results to differ materially from those expressed in these materials. Many of these risks and uncertainties relate to factors that are beyond METRO GROUP’s ability to control or estimate precisely, such as future market and economic conditions, the behaviour of other market participants, the ability to successfully integrate acquired businesses and achieve anticipated cost savings and productivity gains as well as the actions of government regulators. Readers are cautioned not to place undue reliance on these forward-looking statements, which apply only as of the date of this presentation. METRO GROUP does not undertake any obligation to publicly release any revisions to these forward-looking statements to reflect events or circumstances after the date of these materials.
This presentation merely serves the purpose of providing information. It neither represents an offer for sale nor for subscription of securities in any country including the USA. This presentation does not include an official offer of shares; an offering circular will not be published.
This presentation is not allowed to be reproduced, distributed or published without prior agreement of METRO GROUP.
All numbers are before special items, unless otherwise stated.
Please note that new accounting standards have been applied. More information regarding the application of accounting methods refer to the notes to the Annual Report 2009.
Extra’s activities are disclosed as discontinued operations in 2007 and 2008. Figures at Other are adjusted for Adler’s activities in 2007, 2008 and 2009.
The figures in this presentation are rounded to provide a better overview. The calculation of deviations is based on figures incl. fractions. Therefore rounding differences can occur.
Disclaimer and Notes

2Deutsche Bank German & Austrian Corporate Conference
In Q1 Return to Profitable Growth - First Earnings Increase since 2008
€ million Q1 2009 Q1 2010 Change
Metro Cash & Carry 10 25 150.0%
Real -53 -24 53.4%
Media Markt and Saturn 79 81 3.1%
Galeria Kaufhof -27 -19 28.9%
Real Estate 132 138 4.7%
Other -56 -67 -19.6%
Consolidation 3 3 -
METRO GROUP 87 136 55.9%
Q4
-0.1%
Q3
-0.1%
Q2
0.0%
Q1
1.1%
Sales development (in local currency)
2009 2010
� Total sales grew by 2.3% to€15.5 billion(pre-currency: +1.0%)
-0.1%
Q1
1.0%
� Adjusted EBIT increased significantlyby 55.9% to €136 million

3Deutsche Bank German & Austrian Corporate Conference
Strategy of Profitable Growth
Customer Orientation
+ International Expansion
+ Efficiency

4Deutsche Bank German & Austrian Corporate Conference
New METRO GROUP
� First step:
- Dissolving of central structures
- Undivided responsibility for the
divisions
� Second step:
- New organisational structure for
Metro Cash & Carry:
Two business units with different
strategic priorities
- Integration of Metro Cash & Carry
and METRO AG headquarters
Real Estate
NewGroup Structure
Europe/MENAAsia/New Markets

5Deutsche Bank German & Austrian Corporate Conference
Leveraging Strong International Presence as Platform for Further Growth
3.5%24.1%31.9%40.5%Share of sales
75 (+10)439 (+38)596 (+21)1,017 (-53)No. of stores (∆ YTD)
2,320
∆€: +4.8%; ∆LC: +0.6%
15,766∆€: -12.8%; ∆LC: +1.4%
20,932
∆€: -0.3%; ∆LC:+0.3%
26,511 ∆: -0.6%
Sales (€ million)
-35 (-2)765 (-263)708 (+99)587 (-40)EBIT* (€ million) (∆ YoY)
Asia / AfricaEastern EuropeWestern EuropeGermany
1 12 14 6Countries
As at 31 December 2009* pre-consolidation
2009

6Deutsche Bank German & Austrian Corporate Conference
EBIT 2012Market conditions,
price investments
Additional EBIT
potential 2012
1,500
EBIT 2009
2,024
Shape contribution
Market conditions,
price investments
Expansion
800
700
208-405
2,222 -1
EBIT 2008
illustrative
Shape Contributed €208 million already in 2009
€ million
� €1.5 billion EBIT potential targeted by 2012
� €800 million in cost savings to be largely effective in 2011
€700 million in productivity gains fully effective in 2012
Cost savings
Productivity gains

7Deutsche Bank German & Austrian Corporate Conference
Shape 2012 Well on Track
17%
14%
13%29%
21%16%
Q1 2010Q4 2009
108%
18%
15%
40%
Q3 2009
98%
7%
15%
30%
Q2 2009
56%
Q1 2009
0%
42%
116%
28%
17%
5 Effective
4 Implemented
3 Approved
2 Evaluated
1 Idea
Achievement of Shape 2012 Targets
Implementation Levels:
Key Topics
� Customer orientation
� Procurement
� Private labels
� New business models
� In-store and admin.
processes
� Logistics and supply chain
management

8Deutsche Bank German & Austrian Corporate Conference
Metro Cash & Carry
� Leading global Cash & Carry wholesaler
� B2B: Serves only professional customers
� Present in 30 countries
� Matchless international expansion:
international share of sales over 80%
� High operating RoCE (>35%) due to capital
efficient model
� Sales: Food 80%, Non-food 20%

9Deutsche Bank German & Austrian Corporate Conference
Market Entries
An Outstanding Success Story
Cumulated country population
~ 3.7 billion
2000 2001
437475
353
2002
384
+315
20092005
504584
2004
615
2006
544
2003 2007
668
2008
655
Stores
+46%
24.0
30.6
2006
26.425.1
20012000
22.7
2002
33.129.9
2008
31.7
21.0
20072004
28.1
2003 2005 2009
Sales
936963904
805716
641
200920052000
1,111
20082002 2006
1,013
2003
1,139
2001
1,243
2004 2007
EBIT€ million (since 2008 fully leased)
€ billionAsia/Africa
Eastern Europe
Western Europe
Germany
1964
Germany
1968
Nether-lands
1970
Belgium
1971
UK
1971
France
1971
Austria
1971
Denmark
1972
Spain
1972
Italy
1990
Turkey
1990
Portugal
1991
Morocco
1992
Greece
1994
Poland
1994
Hungary
1996
China
1996
Romania
1997
CzechRepublic
1999
Bulgaria
2000
Slovakia
2001
Russia
2001
Croatia
2002
Japan
2002
Vietnam
2003
Ukraine
2003
India
2004
Moldova
2005
Serbia
2007
Pakistan
2009
Kazakhstan
2010E
Egypt

10Deutsche Bank German & Austrian Corporate Conference
Different Business Units with Different Strategic Priorities
� Quality
� Freshness
� Availability
� Professional assortments
� Services
� Price
� Delivery
� Business Solutions
� Key account Management
� Customerproximity
+
+
USP
Priorities
Providing professional
solutions
Rapid
Expansion
Emerging Growing Developed
Asia/New Markets Europe/MENA

11Deutsche Bank German & Austrian Corporate Conference
� Satellite store supplied mainly by ‘mother store’with dedicated Trader focus
� Opened in October 2009in Tarnow, Poland
� Rapid expansion model to cover cities without further store potential
� Opened in October 2009 in Rodez, France,and managed by Toulouse store
� Online catalogue for food & non-food assortment
� Acquiring new high-ticket customers� Offering the full assortment in food and
non-food� Started in 2009
Delivery
Examples for Business Model Transformation
Metro Drive
Makro Punkt

12Deutsche Bank German & Austrian Corporate Conference
Productivity Gains are Gaining Traction
� Growing share of private label goods
Q4
31
Q3
29
Q2
27
Q1
17
Metro C&C Germany Delivery Services (€ m)
2009 2010
Q1
30
Q4
12.0%
Q3
11.7%
Q2
11.3%
Q1
11.4%
Private Label share development (total)
2009 2010
Q1
12.5%
� Sound development with new
delivery services

13Deutsche Bank German & Austrian Corporate Conference
China: Our Next Growth Driver
Targeted East Coast Expansion Areas
Suzhou
Wuxi
Dongguan
Shenzhen
Guangzhou
FoshanZhongshan
Zhuhai
Beijing
Tianjin
Shanghai
Shenyang
Harbin
Dalian
ZhengzhouXi’an
HefeiWuhan
Nanchang
Fuzhou
Xiamen
Quanzhou
Changsha
Chongqing
Chengdu
Kunming
Jiaxing
Changzhou
Nantong
Nanjing
Ningbo
Qingdao
Hangzhou
Metro New Stores
Metro Existing Store
ExistingPlanned
Bohai Bay (incl Beijing)
Pearl River Delta(incl. Guangzhou)
Yangtze River Delta
(incl. Shanghai)
� First priority to achieve
critical mass by focusing
on three targeted
expansion areas
(major long-term growth
potential due to high
population density)
� Still highly fragmented
market with no
established #1 player
� EBIT margin on store
level between 2%-3%
ExistingPotential
.

14Deutsche Bank German & Austrian Corporate Conference
Expansion Programme Subject to Signficant Ramp-up
2012 E
~50
2011 E
~40
2010 E
~30
2009
18
2008
40
2007
32
2006
41
2005
43
2004
33
2003
39
MCC Europe/MENAMCC Asia/New Markets
New Store Openings 2003 - 2009 Planned New Store Openings 2010 - 2012

15Deutsche Bank German & Austrian Corporate Conference
Real
� Leading player in Germany’s
hypermarket sector
� Presence in five Eastern European
countries
� Large range of fresh produce
complemented by attractive non-
food assortment
� Sales: food 70% and non-food 30%
� Range of up to 80,000 products

16Deutsche Bank German & Austrian Corporate Conference
� Adjusted for changes in store network outperformance in German hypermarkets (-0.7% vs. -1.9%*)
� Former Walmart stores turned positive
� Share of private label increasedto 16%; including fresh >22%
� EBIT margin improved by 40bps; in Germany EBIT margin at 1%
* Source: Nielsen Umsatzmonitor, adj. for store changes
Real: German EBIT Margin Improved to 1% in 2009
EBIT margin
2009
0.3%
Margin mixProductivity gains
Cost savings/ network
streamlining
EBITmargin2008
1.0%
Real Germany
Germany (€ million) 2008 2009 Change
Sales 8,750 8,573 -177
EBIT 23 83 +60
Margin 0.3% 1.0% +0.7 pp

17Deutsche Bank German & Austrian Corporate Conference
Value-for-money
Availability of
products
Choice/
range of
products
Quality of
products
Store atmosphere
Cleanliness/
store hygiene
Staff
expertise
Staff
friendliness
Real 2008
Real 2009
A Sharper Brand
� Higher attractiveness in all dimensions
� Only hypermarket with clear improvement in price perception
� Further ramp-up of private labels
Price Perception(2009 vs. 2007)
Retailer 3Retailer 1 Retailer 2Real
∅ -3
points
-3
-7-6
2
ne
ga
tive
po
sit
ive
Private Label
Articles[as at 31/03/2010]
870
1,500
220
60

18Deutsche Bank German & Austrian Corporate Conference
� 614 new concept modules in 2009
� Positive customer response after
concept module implementation
� Further 400 concept modules to be
implemented in 2010
c.80 conceptmodules
Q1
c.110 conceptmodules
Q2
c.130 conceptmodules
Q3
c.80 conceptmodules
Q4
∑c.400 concept
modules
Roll-out 2010
167
125
785446353331
2520
TOTAL
614
Beauty & More
OthersWine & Spirits
Service Centre
TextileHouse-hold
Electr.DIYF&VIntern. Spec.
Focus in 2010 on Further Concept Enhancements to Drive Customer Frequency and Basket
Concept Modules Implemented in 2009

19Deutsche Bank German & Austrian Corporate Conference
Media Markt and Saturn
� Pan-European market leader in consumer
electronics retailing
� Top market positions
� Consistent dual-brand strategy with
superior brand recognition
� Multi-channel approach:
e-commerce piloted in 2 countries
� Large-scale, full assortment and
highly capital efficient
� Aggressive pricing
� Store managers are partners:
- Up to 10% ownership of their stores
- Local entrepreneur: determines assortment, pricing and staffing
- Remuneration directly linked to the store’s success

20Deutsche Bank German & Austrian Corporate Conference
Market Shares Gained in Every Country
Source: GfK
Market
position2008 2009
∆-
points
Austria # 1 22.7% 24.5% 1.8%
Germany # 1 18.3% 19.7% 1.4%
Hungary # 1 17.3% 19.3% 2.0%
Poland # 1 16.5% 17.6% 1.1%
Italy # 1 13.0% 15.2% 2.2%
Luxemburg Newcomer 5.7% 14.9% 9.2%
Netherlands # 1 14.0% 14.3% 0.3%
Switzerland # 2 11.5% 13.1% 1.6%
Spain # 1 10.0% 11.0% 1.0%
Belgium # 1 9.0% 10.4% 1.4%
Sweden Early stage 5.5% 8.7% 3.2%
Greece # 2 6.1% 8.6% 2.5%
Portugal # 4 6.4% 6.8% 0.4%
Turkey Newcomer 1.5% 3.1% 1.6%
Russia Early stage 1.6% 2.7% 1.1%
France Relaunch 2.0% 2.2% 0.2%

21Deutsche Bank German & Austrian Corporate Conference
Multi-Channel Approach
� Complementing the store base
� Addressing and interacting directly with the
customers along all touchpoints
� Extending the assortment with content, services
and bundles
� Media Markt Pilot-Webshops now available in
the Netherlands and Austria

22Deutsche Bank German & Austrian Corporate Conference
China: Huge growing market with unique window of opportunity
� Chinese consumer electronics retail market* of~€82 billion to grow to more than €180 billion
over the next five years
� Consumer electronics market very fragmented with the market leader commanding currently~7% market share
� Entering the Chinese market with a joint venturepartner is the most efficient solution
from 2013
Phase 1: Pilot Phase
Phase 2:Expansion
Timeline:
# stores:(cum. market share):
2010 - 2012
~10(~8% in Shanghai)
>100
January 2012: Evaluation of options
+ target achievement
2010: 100% focus on Shanghai
(ultimate test of competitiveness)
2–Phase Approach to start in Shanghai and finetune the Chinese Business Model
* Source: Euromonitor 29/01/2010

23Deutsche Bank German & Austrian Corporate Conference
Galeria Kaufhof
�Concept and systems leader in Germany’s department store segment and market leader in Belgium
�Sales 2009: €3.5 billion
�EBIT 2009: €119 million
� 141 stores in Germany and Belgium
� Focus on mid-market and lifestyle orientation (sharper brand and private label portfolio)
� Strong cost and stock management
� Strong customer retention programme
� Sales: Food 10%; Non-food 90%
�Non-strategic asset

24Deutsche Bank German & Austrian Corporate Conference
Sales growth
EBIT(before special items)
Capex
New storeopenings
2009 2010Medium-
Term
-3.6% 0 – 6% > 6%
€2.0 billion > €2.0 billion > 10%
€1.5 billion
18
12
50
~ €1.9 billion > €2.2 billion
~ 30
~ 5
~ 60
~ 40
~ 15
> 70
Outlook

25Deutsche Bank German & Austrian Corporate Conference
METRO GROUP: Key Messages
� Portfolio of strong retail brands with diversified regional presence
� Efficiency- and value-enhancing programmeShape 2012 well on track
� METRO GROUP well positioned for future profitable growth

Deutsche Bank German & Austrian Corporate Conference
21 May 2010, Frankfurt
Dr Eckhard Cordes, CEO
Appendix

28Deutsche Bank German & Austrian Corporate Conference
€ million 2007 2008 2009 Change
Sales 64,210 67,955 65,529 -3.6%
EBITDAR - 4,451 4,335 -2.6%
EBITDAR margin (%) - 6.5% 6.6% -
EBITDA 3,343 3,540 3,328 -6.0%
EBITDA margin (%) 5.2% 5.2% 5.1% -
EBIT 2,078 2,222 2,024 -8.9%
EBIT margin (%) 3.2% 3.3% 3.1% -
EPS from continuing operations (€)* 2.77 3.04 2.10 -31.0%
Total assets 33,862 33,814 33,667 -0.4%
Equity ratio (%) 19.2% 17.9% 17.8% -
Capex 2,154 2,423 1,517 -37.4%
Capital Employed - 16,888 16,277 -3.6%
Dividend per ordinary share (€) 1.18 1.18 1.18 -
* After minority interests
Key Data
29Deutsche Bank German & Austrian Corporate Conference
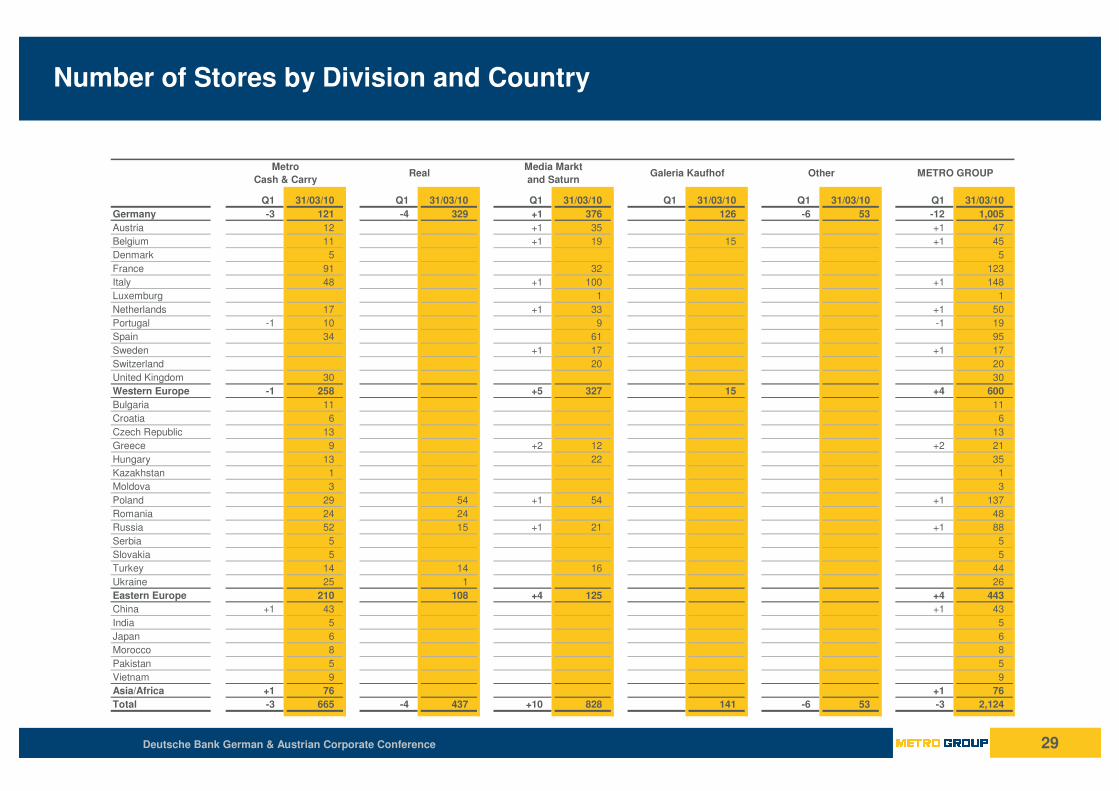
Number of Stores by Division and Country
Q1 31/03/10 Q1 31/03/10 Q1 31/03/10 Q1 31/03/10 Q1 31/03/10 Q1 31/03/10
Germany -3 121 -4 329 +1 376 126 -6 53 -12 1,005
Austria 12 +1 35 +1 47
Belgium 11 +1 19 15 +1 45
Denmark 5 5
France 91 32 123
Italy 48 +1 100 +1 148
Luxemburg 1 1
Netherlands 17 +1 33 +1 50
Portugal -1 10 9 -1 19
Spain 34 61 95
Sweden +1 17 +1 17
Switzerland 20 20
United Kingdom 30 30
Western Europe -1 258 +5 327 15 +4 600
Bulgaria 11 11
Croatia 6 6
Czech Republic 13 13
Greece 9 +2 12 +2 21
Hungary 13 22 35
Kazakhstan 1 1
Moldova 3 3
Poland 29 54 +1 54 +1 137
Romania 24 24 48
Russia 52 15 +1 21 +1 88
Serbia 5 5
Slovakia 5 5
Turkey 14 14 16 44
Ukraine 25 1 26
Eastern Europe 210 108 +4 125 +4 443
China +1 43 +1 43
India 5 5
Japan 6 6
Morocco 8 8
Pakistan 5 5
Vietnam 9 9
Asia/Africa +1 76 +1 76
Total -3 665 -4 437 +10 828 141 -6 53 -3 2,124
Metro
Cash & CarryReal METRO GROUPOtherGaleria Kaufhof
Media Markt
and Saturn

30Deutsche Bank German & Austrian Corporate Conference
Metro Cash & Carry
Sales
20062000 2001 2005200420032002
5,000
35,000
30,000
25,000
20,000
15,000
10,000
200920082007
Sales (€ million)
2009 Regional Sales Breakdown
Asia/Africa
7%
EasternEurope
36%
WesternEurope
40%
Germany
17%
Financials (€ million) 2000 2001 2002 2003 2004 2005 2006 2007 2008* 2009*
Sales 21,032 22,726 23,972 25,093 26,442 28,087 29,907 31,698 33,143 30,613
Change yoy in % 8.0% 8.1% 5.5% 4.7% 5.4% 6.2% 6.5% 6.0% 4.6% -7.6%
Change yoy in % - pre-currency 7.2% 8.8% 6.4% 7.7% 5.6% 4.4% 6.2% 5.7% 5.4% -2.5%
Change yoy in % - lfl (LC) - - 1.4% 1.6% 1.1% -0.3% 1.9% 2.2% 2.4% -4.9%
EBITDA 873 972 1,078 1,200 1,280 1,377 1,510 1,631 1,406 1,165
Change yoy in % 9.9% 11.4% 10.9% 11.2% 6.7% 7.6% 9.6% 8.0% - -17.2%
EBITDA margin 4.2% 4.3% 4.5% 4.8% 4.8% 4.9% 5.0% 5.1% 4.2% 3.8%
EBIT** 641 716 805 904 963 1013 1,111 1,243 1,139 936
Change yoy in % 6.9% 11.7% 12.4% 12.3% 6.5% 5.1% 9.7% 11.9% - -17.8%
EBIT margin 3.0% 3.2% 3.4% 3.6% 3.6% 3.6% 3.7% 3.9% 3.4% 3.1%
Capital Employed - - - - - - - - 2,565 2,605
RoCE - - - - - - - - 44.4% 35.9%
Capex 577 839 750 737 619 900 880 859 336 220
* New segment reporting structure
** until 2003: EBITA
Operating Statistics 2000 2001 2002 2003 2004 2005 2006 2007 2008 2009
Number of stores 353 384 437 475 504 544 584 615 655 668
Selling space (1,000 sqm) 2,972 3,182 3,423 3,725 3,952 4,218 4,507 4,875 5,176 5,291
Change yoy in % 6.6% 7.1% 7.5% 8.8% 6.1% 6.7% 6.9% 8.2% 6.2% 2.2%
Average store size (sqm) 8,419 8,287 7,832 7,841 7,841 7,754 7,717 7,927 7,902 7,921
Sales/Øsqm (€) 7,304 7,386 7,259 7,021 6,889 6,876 6,856 6,757 6,595 5,849

31Deutsche Bank German & Austrian Corporate Conference
Real
-1%
0%
1%
2%
3%
4%
2003200220012000
6,000
4,000
2,000
0
200920082007200620052004
12,000
8,000
10,000
EBIT margin
Sales
EasternEurope
24%
Germany
76%
Sales and EBIT Margin
2009 Regional Sales Breakdown
Financials* (€ million) 2000 2001 2002 2003 2004 2005 2006 2007 2008** 2009**
Sales 8,166 8,375 8,198 8,205 8,182 8,192 8,775 11,003 11,635 11,298
Change yoy in % 2.4% 2.6% -2.1% 0.1% -0.3% 0.1% 7.1% 25.4% 5.8% -2.9%
Change yoy in % - pre-currency 2.3% 3.0% -1.1% 1.2% 0.0% -1.2% 7.1% 25.0% 5.4% 1.3%
Change yoy in % - lfl (LC) - - -1.4% 0.1% -2.2% -4.7% -2.5% -0.1% 4.4% 0.0%
EBITDA 276 353 372 384 352 -121 192 160 191 235
Change yoy in % 13.6% 28.0% 5.3% 3.1% -8.3% - 45.4% -16.7% - 22.1%
EBITDA margin 3.4% 4.2% 4.5% 4.7% 4.3% -1.5% 2.2% 1.5% 1.6% 2.1%
EBIT*** 138 202 228 242 219 -2 19 -16 6 52
Change yoy in % 15.2% 46.0% 13.5% 5.9% -9.3% - - - - -
EBIT margin 1.7% 2.4% 2.8% 2.9% 2.7% 0.0% 0.2% -0.2% 0.1% 0.5%
Capital Employed - - - - - - - - 2,942 2,674
RoCE - - - - - - - - 0.2% 1.9%
Capex 323 248 160 174 110 255 854 345 250 193
* excluding Extra
** New segment reporting structure
*** until 2003: EBITA
Operating Statistics* 2000 2001 2002 2003 2004 2005 2006 2007 2008 2009
Number of stores 276 277 278 289 306 328 442 434 439 441
Selling space (1,000 sqm) 2,006 2,016 2,019 2,078 2,135 2,242 3,158 3,103 3,148 3,184
Change yoy in % 0.6% 0.5% 0.1% 3.0% 2.7% 5.0% 40.9% -1.7% 1.4% 1.1%
Average store size (sqm) 7,267 7,279 7,262 7,192 6,977 6,835 7,145 7,150 7,171 7,220
Sales/Øsqm (€) 4,058 4,165 4,063 4,005 3,884 3,743 3,250 3,515 3,723 3,569

32Deutsche Bank German & Austrian Corporate Conference
Media Markt and Saturn
Sales and EBITDA Margin
0%
1%
2%
3%
4%
5%
6%
7%
2009
7,500
5,000
20,000
17,500
15,000
12,500
10,000
Ø +11.1% p.a.
200820072006200520042003200220012000
EBITDA marginSales (€ million)
Eastern Europe
10%
WesternEurope
44%
Germany46%
2009 Regional Sales Breakdown
Financials (€ million) 2000 2001 2002 2003 2004 2005 2006 2007 2008 2009
Sales 7,619 8,341 9,583 10,563 12,210 13,306 15,156 17,444 18,993 19,693
Change yoy in % 24.0% 9.5% 14.9% 10.2% 15.6% 9.0% 13.9% 15.1% 8.9% 3.7%
Change yoy in % - pre-currency 23.8% 9.1% 14.8% 11.0% 15.8% 8.5% 13.9% 14.2% 8.4% 5.5%
Change yoy in % - lfl (LC) - - 3.2% 0.9% 4.6% -1.4% 3.0% 2.6% -2.1% -0.4%
EBITDA 375 368 431 506 612 679 776 818 839 851
Change yoy in % 17.9% -1.9% 17.0% 17.6% 20.8% 11.0% 14.4% 5.4% - 1.4%
EBITDA margin 4.9% 4.4% 4.5% 4.8% 5.0% 5.1% 5.1% 4.7% 4.4% 4.3%
EBIT* 272 228 290 360 452 510 587 610 603 608
Change yoy in % 17.8% -16.1% 27.0% 24.3% 25.5% 12.8% 15.2% 3.9% - 0.8%
EBIT margin 3.6% 2.7% 3.0% 3.4% 3.7% 3.8% 3.9% 3.5% 3.2% 3.1%
Capital Employed - - - - - - - - 960 795
RoCE - - - - - - - - 62.8% 76.4%
Capex 267 264 350 229 261 315 370 463 402 353
* until 2003: EBITA
Operating Statistics 2000 2001 2002 2003 2004 2005 2006 2007 2008 2009
Number of stores 314 357 386 436 503 558 621 702 768 818
Selling space (1,000 sqm) 852 976 1,129 1,307 1,514 1,704 1,914 2,213 2,439 2,633
Change yoy in % 16.9% 14.6% 15.6% 15.8% 15.8% 12.6% 12.3% 15.6% 10.2% 8.0%
Average store size (sqm) 2,714 2,735 2,925 2,999 3,010 3,054 3,082 3,152 3,176 3,219
Sales/Øsqm (€) 9,638 9,126 9,105 8,671 8,656 8,270 8,379 8,454 8,166 7,765

33Deutsche Bank German & Austrian Corporate Conference
Galeria Kaufhof
EBITDA and EBIT Margin
91%
9%
Germany
WesternEurope
0
50
100
150
200
250
300
350
0%
1%
2%
3%
4%
5%
20052001 2002 20042003 20072000 2006 20092008
EBITDAEBIT margin
2009 Regional Sales Breakdown
Financials (€ million) 2000 2001 2002 2003 2004 2005 2006 2007 2008* 2009*
Sales 3,941 3,971 3,900 3,819 3,768 3,575 3,609 3,556 3,607 3,539
Change yoy in % -1.5% 0.8% -1.8% -2.1% -1.3% -5.1% 0.9% -1.5% -1.1% -1.9%
Change yoy in % - lfl 0.1% -3.7% -4.5% -2.2% -1.2% -4.8% -0.6% -1.7% -1.4% -2.2%
EBITDA 324 349 292 249 199 189 192 211 223 223
Change yoy in % 10.2% 7.9% -16.3% -14.7% -19.9% -5.4% 1.8% 10.0% - 0.2%
EBITDA margin 8.2% 8.8% 7.5% 6.5% 5.3% 5.3% 5.3% 5.9% 6.2% 6.3%
EBIT** 181 190 139 99 57 69 82 107 115 119
Change yoy in % 10.5% 4.8% -26.8% -28.4% -43.6% 21.8% 18.1% 31.3% - 3.4%
EBIT margin 4.6% 4.8% 3.6% 2.6% 1.5% 1.9% 2.3% 3.0% 3.2% 3.4%
Capital Employed - - - - - - - - 826 785
RoCE - - - - - - - - 13.9% 15.2%
Capex 167 202 120 104 120 96 151 107 128 57
* New segment reporting structure; since 2009 including Dinea
** until 2003: EBITA
Operating Statistics 2000 2001 2002 2003 2004 2005 2006 2007 2008 2009
Number of stores 132 148 150 148 147 142 142 141 141 141
Selling space (1,000 sqm) 1,319 1,440 1,456 1,457 1,473 1,465 1,487 1,486 1,489 1,501
Change yoy in % 1.6% 9.1% 1.1% 0.1% 1.0% -0.5% 1.5% -0.1% 0.2% 0.7%
Average store size (sqm) 9,995 9,728 9,706 9,847 10,018 10,318 10,473 10,539 10,567 10,645
Sales/Øsqm (€) 3,011 2,879 2,693 2,622 2,572 2,434 2,445 2,392 2,363 2,367

34Deutsche Bank German & Austrian Corporate Conference
Real Estate
Asia/Africa
9%
EasternEurope
35%
WesternEurope
33%
Germany
23%
2009 Selling Space by RegionFinancials (€ million) 2008 2009
EBITDA 927 959
Change yoy in % - 3.4%
EBIT 538 551
Change yoy in % - 2.4%
Capital Employed 8,856 8,690
RoCE 6.1% 6.3%
Capex 1,060 580

35Deutsche Bank German & Austrian Corporate Conference
Long-Term Debt Maturity Profile
€ million
750
500
250
1,250
1,000
0
20172016201520142013201220112010
Refinancing already completed
7.625%EUR1,000,000,00005/03/201505/03/2009
4.250%EUR750,000,00022/02/201722/02/2010
5.750%EUR600,000,00014/07/201414/07/2009
9.375%EUR500,000,00028/11/201328/11/2008
11.550%RON23,800,00023/07/201223/07/2009
4.750%EUR500,000,00029/05/201229/05/2007
3.625%EUR350,000,00024/06/201124/06/2009
4.625%EUR750,000,00026/05/201126/05/2004
FRNEUR200,000,00008/09/201008/09/2006
CouponCurrencyNom. Outstanding (€)MaturityIssued
� Dependency on bank financing further reduced
� Well-balanced maturity profile
Bonds
Bonds
Promissory Notes (Schuldscheindarlehen)

36Deutsche Bank German & Austrian Corporate Conference
METRO Group
Investor Relations
Schlueterstrasse 1
40235 Duesseldorf
Germany
Tel.: +49 (0)211 6886-1936
Fax: +49 (0)211 6886-3759
Email: [email protected]
Internet: www.metrogroup.de
Contact