Embed Size (px)
Citation preview

U.S. BANCORP
Deutsche BankGlobal Financial Services Conference2021
June 2, 2021
Tim WelshVice Chair, Consumer and Business Banking
Shailesh KotwalVice Chair, Payment Services

2U.S. BANCORP |
The following information appears in accordance with the Private Securities Litigation Reform Act of 1995:
Today’s presentation contains forward-looking statements about U.S. Bancorp. Statements that are not historical or current facts, includingstatements about beliefs and expectations, are forward-looking statements and are based on the information available to, and assumptions andestimates made by, management as of the date hereof. These forward-looking statements cover, among other things, anticipated future revenueand expenses and the future plans and prospects of U.S. Bancorp. Forward-looking statements involve inherent risks and uncertainties, andimportant factors could cause actual results to differ materially from those anticipated. The COVID-19 pandemic is adversely affectingU.S. Bancorp, its customers, counterparties, employees, and third-party service providers, and the ultimate extent of the impacts on its business,financial position, results of operations, liquidity, and prospects is uncertain. Continued deterioration in general business and economic conditionsor turbulence in domestic or global financial markets could adversely affect U.S. Bancorp’s revenues and the values of its assets and liabilities,reduce the availability of funding to certain financial institutions, lead to a tightening of credit, and increase stock price volatility. In addition,changes to statutes, regulations, or regulatory policies or practices could affect U.S. Bancorp in substantial and unpredictable ways.U.S. Bancorp’s results could also be adversely affected by changes in interest rates; further increases in unemployment rates; deterioration in thecredit quality of its loan portfolios or in the value of the collateral securing those loans; deterioration in the value of its investment securities; legaland regulatory developments; litigation; increased competition from both banks and non-banks; civil unrest; changes in customer behavior andpreferences; breaches in data security, including as a result of work-from-home arrangements; failures to safeguard personal information; effectsof mergers and acquisitions and related integration; effects of critical accounting policies and judgments; and management’s ability to effectivelymanage credit risk, market risk, operational risk, compliance risk, strategic risk, interest rate risk, liquidity risk and reputation risk.
For discussion of these and other risks that may cause actual results to differ from expectations, refer to U.S. Bancorp’s Annual Report onForm 10-K for the year ended December 31, 2020, on file with the Securities and Exchange Commission, including the sections entitled “RiskFactors” and “Corporate Risk Profile” contained in Exhibit 13, and all subsequent filings with the Securities and Exchange Commission underSections 13(a), 13(c), 14 or 15(d) of the Securities Exchange Act of 1934. In addition, factors other than these risks also could adversely affectU.S. Bancorp’s results, and the reader should not consider these risks to be a complete set of all potential risks or uncertainties. Forward-lookingstatements speak only as of the date hereof, and U.S. Bancorp undertakes no obligation to update them in light of new information or futureevents.
This presentation includes non-GAAP financial measures to describe U.S. Bancorp’s performance. The calculations of these measures areprovided in the Appendix. These disclosures should not be viewed as a substitute for operating results determined in accordance with GAAP, norare they necessarily comparable to non-GAAP performance measures that may be presented by other companies.
Forward-looking statements and additional information

3U.S. BANCORP |
U.S. Bancorp
NYSE Traded USBFounded 1863Market Value $90B
Branches 2,306ATMs 4,079
Assets $553BDeposits $434BLoans $294B
As of 3/31/21, except market value as of 5/27/21
Regional National InternationalConsumer & Business Banking and Wealth Management
Corporate & Commercial Banking and Wealth Management & Investment Services
Payment Services and Investment Services

4U.S. BANCORP |
1 J.P. Morgan $3,689 1 J.P. Morgan $2,278 1 J.P. Morgan $498
2 Bank of America 2,970 2 Bank of America 1,885 2 Bank of America 365
3 Citigroup 2,314 3 Wells Fargo 1,437 3 Wells Fargo 193
4 Wells Fargo 1,960 4 Citigroup 1,301 4 Citigroup 163
5 U.S. Bancorp 553 5 U.S. Bancorp 434 5 U.S. Bancorp 90
6 Truist Financial 518 6 Truist Financial 396 6 Truist Financial 84
7 PNC 474 7 PNC 375 7 PNC 82
8 Fifth Third 207 8 Fifth Third 162 8 Fifth Third 30
9 Citizens Financial 187 9 Citizens Financial 151 9 KeyCorp 23
10 KeyCorp 176 10 KeyCorp 142 10 Citizens Financial 21
Our position in the industry
Assets Deposits Market Value
Source: company reports and BloombergAssets and deposits as of 3/31/21; market value as of 5/27/21

5U.S. BANCORP |
Consumer & Business BankingBranch banking, small business banking, consumer lending, mortgage banking and
omnichannel delivery
Corporate & Commercial BankingCorporate Banking, Commercial Banking and
Commercial Real Estate
Payment ServicesRetail Payment Solutions,
Global Merchant Acquiring andCorporate Payment Systems
Wealth Management & Investment ServicesWealth Management, Asset Management,
Corporate Trust, Fund Services and Custody
PaymentServices
27%
Wealth Management& Investment Services
13%
Corporate & Commercial Banking
18%
Consumer &Business Banking
42%
1Q 2021 YTD taxable-equivalent basisBusiness line revenue percentages exclude Treasury and Corporate Support; see slide 14 for reconciliation
Our differentiated business mix supports consistent growth

6U.S. BANCORP |
Our complete payments ecosystem is a differentiator
Cyclical rebound
Secular opportunities
Industry leading growth & returns
paired with
will drive
U.S. Bank Payments
Ecosystem
Card issuing
Merchant processing
AR and AP solutions
Omni-commerce capabilities
Lending
Deposits
Capital solutions
Cash management
Investment services
Banking services Payments services
Data & Technology
Human & Digital
As the lines between traditional banking and payments capabilities blur, the opportunity is here for us to provide integrated banking and payments solutions through a
complete payments ecosystem

7U.S. BANCORP |
We are benefiting from the cyclical rebound in spend activity
1Q20 2Q20 3Q20 4Q20 1Q21 1Q20 2Q20 3Q20 4Q20 1Q21 1Q20 2Q20 3Q20 4Q20 1Q21
Merchant Sales Volume Growth**
0%
CPS Sales Volume Growth**
0%
RPS**** Sales Volume Growth**
0%
Travel & Hospitality*** All Other TotalAirline Travel & Entertainment TotalAll Other Travel***** (Credit & Debit) All Other Total
Volume Growth vs. 2019 Comparable Period
* Business line revenue percentages exclude Treasury and Corporate Support; see slide 14 for reconciliation** Monthly data ranging from January 2020 – March 2021*** Travel & Hospitality includes hotels, restaurants, entertainment and travel**** RPS includes credit, debit, and prepaid***** Travel includes airlines, auto rental, hotel/motel, other transportation, and travel agencies
Payments Revenue - Segment Breakdown 1Q21 Drivers of the Cyclical Rebound
vv
v
v
Vaccines being rolled out
Fiscal stimulus
Economies re-opening
Consumer spend activity rebounding
Excluding COVID impacted travel, hospitality and entertainment sectors,
volumes in each of our payments businesses exceeded 2019 pre-
pandemic levels in 1Q2123%70%
7%
Merchant RPS CPS
RPS Revenue:
81% Credit Card
19% Debit / prepaid Card
CPS Revenue:
81% Corporate
19% Government
Merchant Revenue:
82% All Other
18% Europe
Payments revenue, which includes net interest income and fee revenue, accounted for 27%* of our 1Q21 net revenue

8U.S. BANCORP |
Weaving banking and payments together creates value for our customers
Our investments are focused on:U.S. Bank is a leader in the digital evolution
Building on our success… …to drive future growth through transformation
31%
58%
Digital* Loan Sales (% of Total)
1Q19 1Q21
68%
80%
Digital* Transactions (% of Total)
1Q21
Banking Payments Simple and holistic financial solutions+ =
Our banking and payments businesses are built with a digital advantage and human touch
Creating seamless customer experiences
Empowering real-time decision making, funding, and payments
Driving customer acquisition, usage and distribution
1Q19
* Digital includes both online and mobile platforms
9U.S. BANCORP |
2019 2020 1Q21
New talech Customers
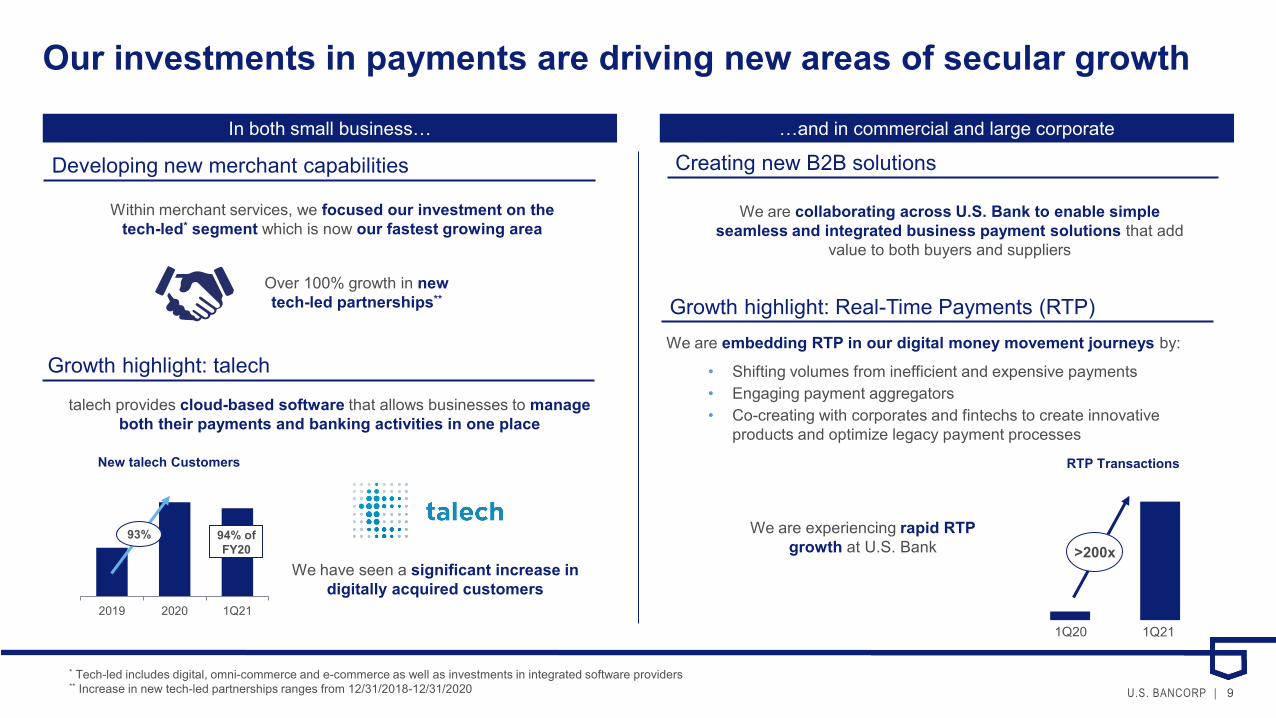
Growth highlight: Real-Time Payments (RTP)
RTP Transactions
Our investments in payments are driving new areas of secular growth
Over 100% growth in new tech-led partnerships**
Within merchant services, we focused our investment on the tech-led* segment which is now our fastest growing area
• Shifting volumes from inefficient and expensive payments• Engaging payment aggregators• Co-creating with corporates and fintechs to create innovative
products and optimize legacy payment processes
>200x
* Tech-led includes digital, omni-commerce and e-commerce as well as investments in integrated software providers** Increase in new tech-led partnerships ranges from 12/31/2018-12/31/2020
1Q20 1Q21
We are experiencing rapid RTP growth at U.S. Bank
We have seen a significant increase in digitally acquired customers
talech provides cloud-based software that allows businesses to manage both their payments and banking activities in one place
We are embedding RTP in our digital money movement journeys by:
We are collaborating across U.S. Bank to enable simple seamless and integrated business payment solutions that add
value to both buyers and suppliers
Developing new merchant capabilities Creating new B2B solutionsIn both small business… …and in commercial and large corporate
Growth highlight: talech
93% 94% of FY20

10U.S. BANCORP |
% Applications Through Portal
Branch Leads Contacted
Multiple growth opportunities in consumer bankImproving productivity of existing branches1 Digital first – branch lite expansion2
Growth through digital marketing3 Strategic partnerships4
Launched with cobrowse in 2Q20
58%
1Q19 1Q21
We are focused on expanding our relationship-based model that leverages the strengths of two like-minded cultures
Banking in the digital age means doing more with less branches
Named Best in IndustryDigital Mortgage Tools
Kiplinger
#1Customer Service Features
#1Mobile Check DepositCornerstone Advisors
Business Insider Intelligence
+21 ppt*
Over 95% of mortgage applications now move through the Blend platform
1Q19 1Q21
in Charlotte:• more than 800 employees• ~40k customers
Remodels and de novo branches built in 2019
Potential expansion states
2019 expansion market
* Percentage pointsNote: State Farm and logo are trademarks of State Farm Mutual Automobile Company
11U.S. BANCORP |
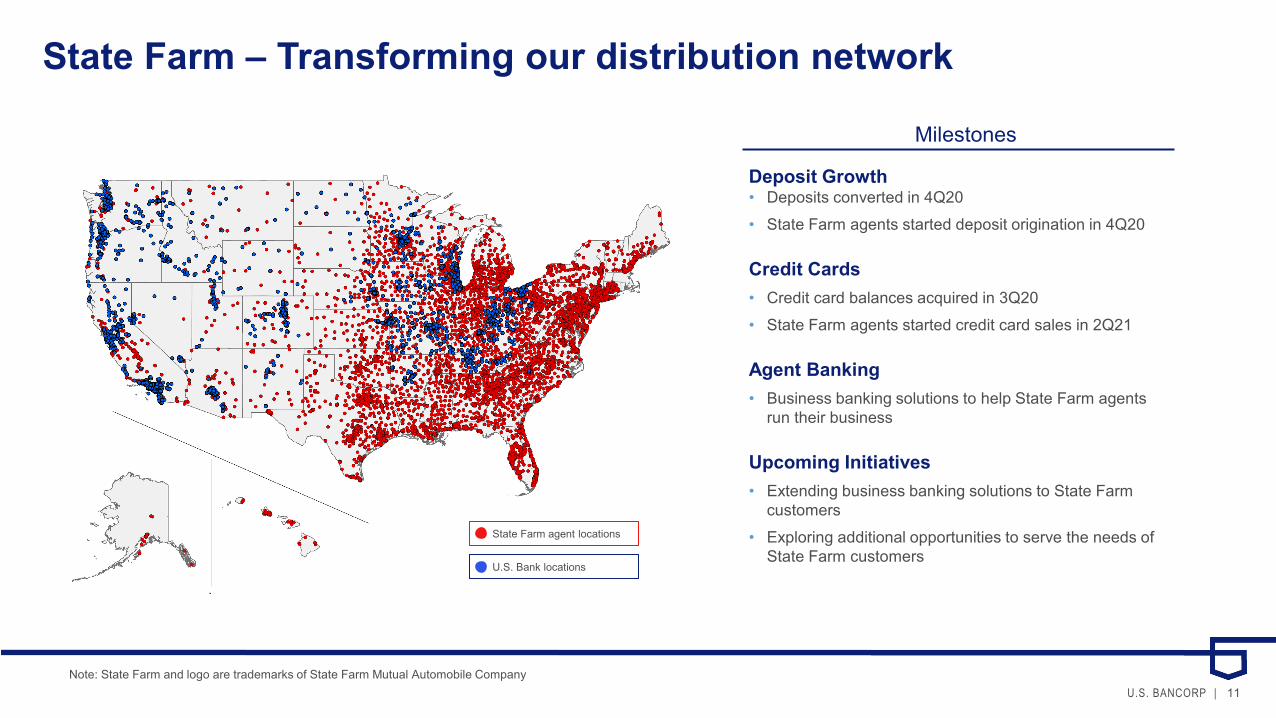
Milestones
Deposit Growth• Deposits converted in 4Q20• State Farm agents started deposit origination in 4Q20
Credit Cards• Credit card balances acquired in 3Q20• State Farm agents started credit card sales in 2Q21
Agent Banking• Business banking solutions to help State Farm agents
run their business
Upcoming Initiatives• Extending business banking solutions to State Farm
customers• Exploring additional opportunities to serve the needs of
State Farm customers
State Farm – Transforming our distribution network
State Farm agent locations
U.S. Bank locations
Note: State Farm and logo are trademarks of State Farm Mutual Automobile Company

12U.S. BANCORP |
Integrating our full set of banking solutions fuels long-term growth
• The investments in our payments ecosystem will create client experiences that are seamless, autonomous, real-time and optimized
• We believe we can grow our small business accounts over the next few years which in turn will drive revenue growth
• Our focus on digital capabilities, strategic partnerships and human capital will lead us to more customers and deeper relationships
Card issuing
Merchant processing
Omni-commerce capabilities
AR and AP solutions
Investment services
Capital solutions
Deposits
Customer
Lending
Cash management
Human & Digital
Data & Technology

13U.S. BANCORP |
Appendix

14U.S. BANCORP |
($ in millions) Net RevenueLine of Business Financial Performance 1Q21Corporate and Commercial Banking 925$ Consumer and Business Banking 2,242 Wealth Management and Investment Services 696 Payment Services 1,413 Treasury and Corporate Support 194 Total Company 5,470
Less Treasury and Corporate Support 194 Total Company excluding Treasury and Corporate Support 5,276$
Percent of Total CompanyCorporate and Commercial Banking 17%Consumer and Business Banking 41%Wealth Management and Investment Services 13%Payment Services 26%Treasury and Corporate Support 3%Total 100%
Percent of Total Company excluding Treasury and Corporate SupportCorporate and Commercial Banking 18%Consumer and Business Banking 42%Wealth Management and Investment Services 13%Payment Services 27%Total Company excluding Treasury and Corporate Support 100%
Non-GAAP financial measures