Embed Size (px)
Citation preview

Deutsche Bank2006 High Yield Conference
October 4, 2006

1
CFO
Dave Meyers

2
Forward-looking Statement Disclaimer
During the course of our discussion today, we will make statements that may constitute projections, expectations, beliefs or similar forward-looking statements. We would like to caution you that the Company’s actual results could differ materially from the results anticipated or projected in these forward-looking statements. Additional detailed information concerning important factors that could cause Del Monte’s actual future results to differ materially from the information we will give you today is included in our public filings, including our most recent annual report on Form 10-K, which are available on the SEC’s EDGAR database or on our website. The Company does not undertake to update any of these forward-looking statements in light of new information or future events.

3
Vision
Every productEvery innovationEvery program
Nourishing Families. Enriching Lives. Every Day.

4
A Branded, Top-Tier Consumer Packaged Foods Company
We are now:• More strategically focused
• Better positioned for brand-driven innovation
• More streamlined and efficient
• More aligned with consumer and customer trends
• Better competitively positioned
Margin ExpansionMargin Expansion
Higher GrowthHigher Growth
Successfully Executing Project Brand
To Drive:

5
($’s in Millions, except EPS)
FY 06: Selected Financial Results
(1) Reflects EPS from Continuing Operations
F 2005 F 2006 % ChangeNet Sales 2,899$ 2,999$ 3.4%
Gross Profit 744 785 5.5%Gross Margin (% of Sales) 25.7% 26.2%
SG&A 450 480 6.8%SG&A Margin (% of Sales) 15.5% 16.0%
Operating Income 294 305 3.6%OI Margin (% of Sales) 10.2% 10.2%
EPS ($ per share) (1) 0.48 0.67
Fiscal Year-End
Continuing Operations

6
Strong Foundation
Know our Market~90% of revenues in U.S. retail market
Brand share to support pricing and innovation~80% of Del Monte’s branded retail sales #1 and #2
Competitive scaleTop 10 marketer in the center store(1) providing customer and consumer leverage
Categories are strong and large
(1) Excluding beverage companies
Business Building Blocks

7
ConsumerProducts
~65%
PetProducts
~25%
ConsumerProducts
~60%
PetProducts
~40%
Strong Foundation
Note: New net sales is forward-looking
Net Sales (Pre-Acquisitions) Net Sales (Post- Acquisitions)
Streamlined Portfolio of Leading Brands
SIF~10%

8
Strong Foundation
#1 brand in Fruits, Vegetables and Tomatoes1
#1 brand in Tuna
#1 brand in Dog Biscuits
#2 brand in Soft and Chewy Dog Treats
#3 brand in Dry Cat Food
#2 brand in Wet Cat Food1. Solid Tomatoes tied for #1
Brand Strength

9
F06 Size ($B)
'03-'06 CAGR
Fruit $1.7 3.7%Vegetable $1.7 1.1%Tomato $1.1 -0.3%Broth $0.5 8.4%Tuna $1.6 0.4%
Total $6.6 1.8%
Strong Foundation
Growing Categories
Source: ACNielsen All-Outlet Household Panel and internal estimates
F06 Size ($B)
'03-'06 CAGR
Dry Dog $6.4 8.0%Dry Cat $2.6 4.2%Pet Snacks $1.9 10.1%
$10.9 7.4%
Wet Cat $1.8 1.9%Wet Dog $1.5 3.5%
$3.3 2.6%
Total $14.2 6.2%
Consumer Categories Pet Categories

10
Revenue Growth
Environment
Operating Margins
$2,856
$2,999
2,750
2,800
2,850
2,900
2,950
3,000
3,050
F04 F06
12.1%
10.2%
0%
2%
4%
6%
8%
10%
12%
14%
F04 F06
~3% CAGR (1)$M
Strong, topline momentum;Pressured operating margins
starting in F05
(1) Net Sales CAGR 2.5%

11
Strategic Plan
Revenue Target EPS Target
Project Brand tenets – driving performance
3-5%
7-9%
Del Monte Long-Term Growth Targets
Innovation and Brand-Driven Growth
Innovation and Brand-Driven Growth
M&Aw/ Integration
M&Aw/ Integration
Portfolio Optimizationw/ Recent Acquisitions, Pricing
and Mix Improvement
Portfolio Optimizationw/ Recent Acquisitions, Pricing
and Mix Improvement
Financial Flexibilityw/ Debt Reduction
Cost and AssetStreamlining
w/ Transformation Initiatives

12
Portfolio Optimization – Mix Improvement
Focus: branded, higher margin/growth businesses
Fiscal 2006 Going Forward
Post Acquisition~40% of Net Sales
Pre-Acquisition~30% of Net Sales
High Margin
High Growth
~10% NSV Growth Rates~2X Margins
Continue NSV and Margin Momentum
High Margin
High Growth

13
Non-branded businesses~$295 FY06 salesSingle-digit operating margins(1)
Portfolio Optimization – Recent Acquisitions
Improve portfolio mix through the divestiture and acquisitions
Long Term Guidance3-5% Topline Growth
7-9% EPS Growth
Long Term Guidance3-5% Topline Growth
7-9% EPS Growth
Divested Soup andInfant Feeding
Divested Soup andInfant Feeding
Acquired Meow Mix and Milk-Bone
Acquired Meow Mix and Milk-Bone
Branded businesses~$430 CY05 salesDouble-digit operating margins
(1) Reflects standalone businesses

14
Actions Taken – M&AAcquisitions enhance financial profile
Strong Category Growth Rates’03-’06
Center Store Scale’05 Net Sales
Healthy Gross Margins’05 Gross Margins
Large Categories
Milk-BoneMeow Mix
$2.6B $1.6B
4%
~$250M
>35%
11%
~$180M
>35%

15
Strategic Plan
Revenue Target EPS Target
Project Brand tenets – driving performance
3-5%
7-9%
Del Monte Long-Term Growth Targets
Innovation and Brand-Driven Growth
Innovation and Brand-Driven Growth
M&Aw/ Integration
M&Aw/ Integration
Portfolio Optimizationw/ Recent Acquisitions, Pricing
and Mix Improvement
Portfolio Optimizationw/ Recent Acquisitions, Pricing
and Mix Improvement
Financial Flexibilityw/ Debt Reduction
Cost and AssetStreamlining
w/ Transformation Initiatives
16
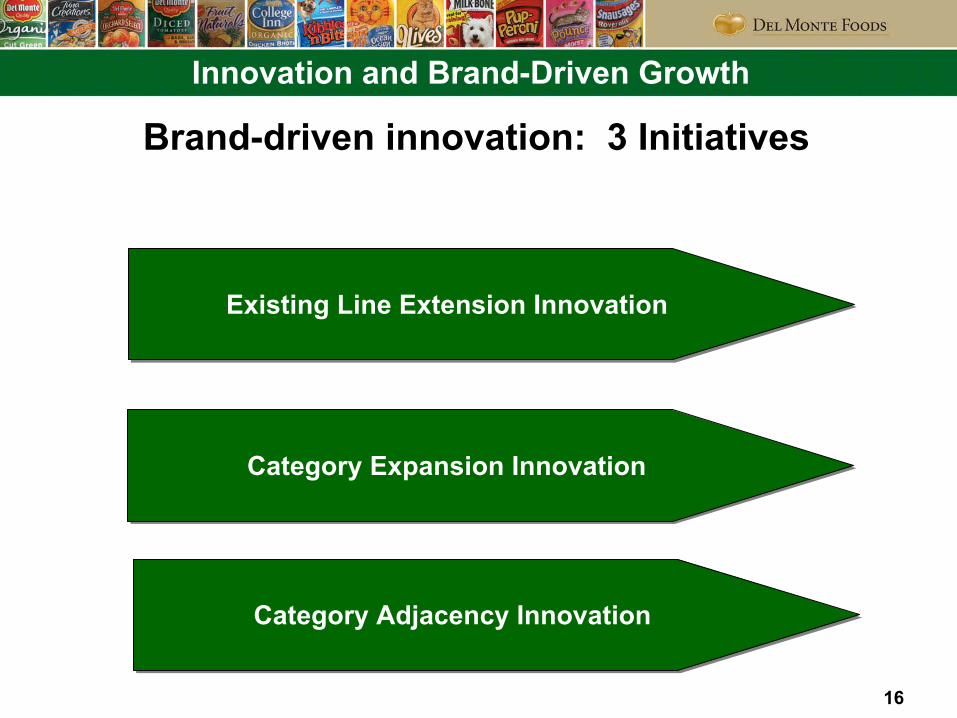
Innovation and Brand-Driven Growth
Brand-driven innovation: 3 Initiatives
Existing Line Extension InnovationExisting Line Extension Innovation
Category Expansion InnovationCategory Expansion Innovation
Category Adjacency InnovationCategory Adjacency Innovation
17
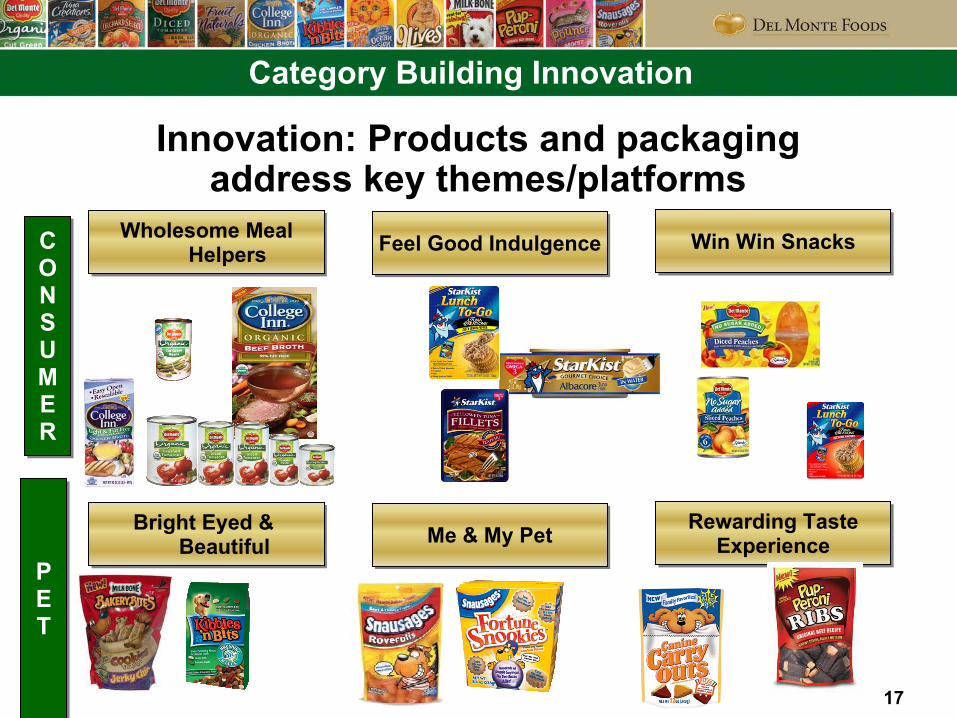
Category Building Innovation
Innovation: Products and packaging address key themes/platforms
Wholesome MealHelpers
Wholesome MealHelpers Feel Good IndulgenceFeel Good Indulgence Win Win SnacksWin Win Snacks
Bright Eyed & Beautiful
Bright Eyed & Beautiful Me & My PetMe & My Pet Rewarding Taste
ExperienceRewarding Taste
Experience
CONSUMER
CONSUMER
PET
PET

18
Category Building Innovation – F07 Pet Innovation
Pet Products leading F07 category building innovation
Pet SnacksPet Snacks Dry PetDry Pet

19
Strategic Plan
Revenue Target EPS Target
Project Brand tenets – driving performance
3-5%
7-9%
Del Monte Long-Term Growth Targets
Innovation and Brand-Driven Growth
Innovation and Brand-Driven Growth
M&Aw/ Integration
M&Aw/ Integration
Portfolio Optimizationw/ Recent Acquisitions, Pricing
and Mix Improvement
Portfolio Optimizationw/ Recent Acquisitions, Pricing
and Mix Improvement
Financial Flexibilityw/ Debt Reduction
Cost and AssetStreamlining
w/ Transformation Initiatives

20
Transforming Acquisitions
Del Monte Foods• Enhances portfolio of leading, high growth/margin brands• Improves platform for innovation• Increases annual sales growth and gross margin potential
Del Monte Pet Products• Increases representation from strategic priority pet snacks and dry
food business• Increases overall presence in Pet Aisle focused on dry pet and pet
treats• Expands distribution opportunities in under developed channels
Pet acquisitions significantly strengthen financial performance and strategic profile

21
33%28%Pet Snacks
22%5%Dry Cat
18%27%Other
100%100%Total DMPP
12%17%Wet Cat
2%3%Wet Dog
13%20%Dry Dog
Post-Acquisition
Pre-AcquisitionSegment
% of Total DMPP Net Sales by Segment
#2#4Dry Cat
#1#2Pet Snacks
#2#3Total Pet
#2#2Wet Cat
#3#3Wet Dog
#4#4Dry Dog
Post-Acquisition
Pre-AcquisitionSegment
DMPP Market Share Position*
Del Monte Pet Products
* Source: Nielsen 52 weeks ending April 2006; Food/Mass (xPL)
Today’s pet portfolio strategically positioned against high margin, high growth businesses

22
Key Success Drivers
Meow Mix
Milk-Bone
• Continue the marketing and innovation momentum• Capture the synergies• Retain talent/Transfer the entrepreneurial spirit• Leverage Meow Mix brand equity
• Revitalize the brand• Apply Del Monte’s innovation and R&D capabilities• Utilize the Del Monte platform• Leverage the wholesome brand heritage to capitalize on the growing health and wellness trend in Pet
Del Monte focus: Build value with the acquisitions

23
Vice President
Larry Bodner

24
Strategic Plan
Revenue Target EPS Target
Project Brand tenets – driving performance
3-5%
7-9%
Del Monte Long-Term Growth Targets
Innovation and Brand-Driven Growth
Innovation and Brand-Driven Growth
M&Aw/ Integration
M&Aw/ Integration
Portfolio Optimizationw/ Recent Acquisitions, Pricing
and Mix Improvement
Portfolio Optimizationw/ Recent Acquisitions, Pricing
and Mix Improvement
Financial Flexibilityw/ Debt Reduction
Cost and AssetStreamlining
w/ Transformation Initiatives

25
Inflationary and Other Cost Increases1
Challenging Cost Environment
$150
$120 $120
$0$20
$40$60$80
$100$120
$140$160
F05 F06 F07E
GROSS COST INCREASESvs. PRECEEDING YEAR, EXCLUDES SAVINGS INITIATIVES
35 – 40RAW MATERIALS
25 – 30LABOR, BENEFITS, OTHER
20 – 25 LOGISTICS
25 – 30PACKAGING
IMPACT $MCATEGORY
F07E vs. F06 COST INCREASES
($ in millions)
% Increase ~5%~6%
1 Reflects information that was provided on the July 20, 2006 Investor Day. The Company has not provided updates to these numbers since that time and does not do so in this presentation
1
1

26
Actions Taken - Cost and Asset Streamlining
Aggressive cost reduction programs,3x increase since F05
$50
$18
$50
$0
$10
$20
$30
$40
$50
$60
F05 F06 F07E
COST REDUCTION
STRUCTURAL CHANGES
E-SOURCING
LEAN MANUFACTURING
DRIVER
F07E COST REDUCTIONS
CAPITAL EXPENDITURES
YIELD MANAGEMENTINTENSIFYING ONGOING EFFORTS
($ in millions)
27
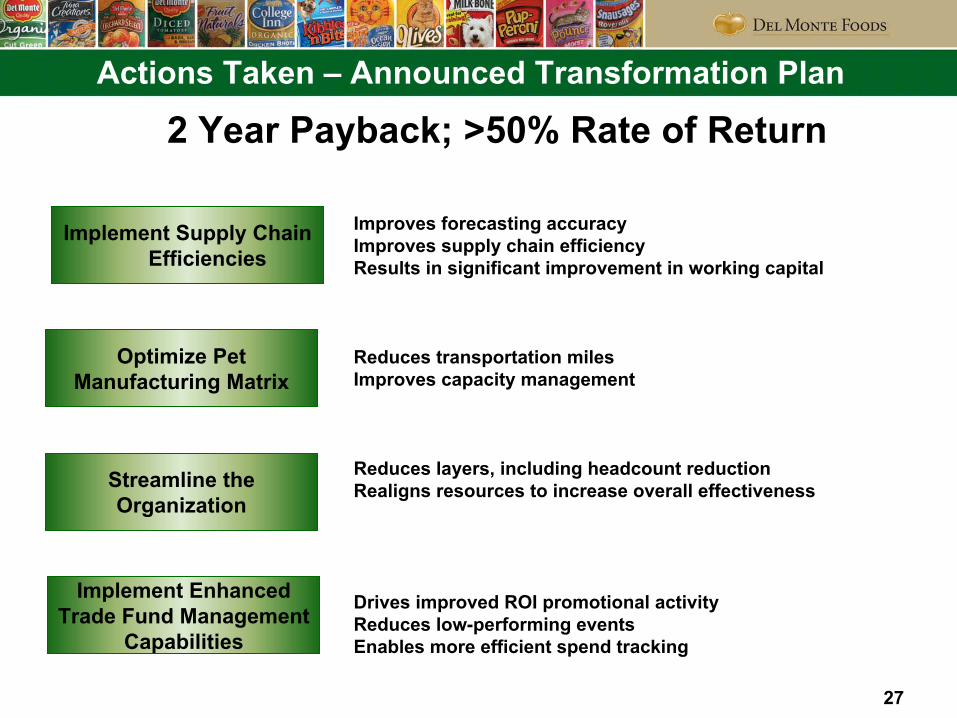
Actions Taken – Announced Transformation Plan
Improves forecasting accuracyImproves supply chain efficiencyResults in significant improvement in working capital
Reduces transportation milesImproves capacity management
Reduces layers, including headcount reductionRealigns resources to increase overall effectiveness
Drives improved ROI promotional activity Reduces low-performing eventsEnables more efficient spend tracking
Optimize Pet Manufacturing Matrix
Streamline the Organization
Implement Supply Chain Efficiencies
Implement Enhanced Trade Fund Management
Capabilities
2 Year Payback; >50% Rate of Return

28
Transformation Plan
Expected $110M in costs over the next two years; expect $50M in run rate savings in F09
Trade Fund Management
~15%
Supply Chain~25%
Streamline Organization
~15%
Pet Manufacturing
Matrix~45%
Streamline Organization
~30%
Supply Chain~30%
Trade Fund Management
~10%
Pet Manufacturing
Matrix~30%
Costs Savings

29
Strategic Plan
Revenue Target EPS Target
Project Brand tenets – driving performance
3-5%
7-9%
Del Monte Long-Term Growth Targets
Innovation and Brand-Driven Growth
Innovation and Brand-Driven Growth
M&Aw/ Integration
M&Aw/ Integration
Portfolio Optimizationw/ Recent Acquisitions, Pricing
and Mix Improvement
Portfolio Optimizationw/ Recent Acquisitions, Pricing
and Mix Improvement
Financial Flexibilityw/ Debt Reduction
Cost and AssetStreamlining
w/ Transformation Initiatives

30
Exceeded cash flow target
Financial Flexibility
F06 Execution Going Forward
Initiated a Dividend
Reduced Debt(Pre-Acquisitions)
Exceeded Cash Flow Target
Executed Share Buyback
Continue to Pay A Dividend1
Generate Strong Cash Flow
Reduce Debt
1. The actual declaration and payment of future dividends and the establishment of record and payment dates, if any, is subject to final determination by our Board of Directors each quarter after its review of our then current strategy, applicable debt covenants and financial performance and position, among other things

31
Long-Term Guidance
Revenue Target EPS Target
3-5%3-5%
7-9%7-9%
Operating Margin
12%12%
Cash Flow
$200M+$200M+
Revenue and EPS Growth Rates
Operating Margin Cash Flow
Project Brand, acquisitions and transformation plan drive increased long-term growth rate targets
32
CFO
Dave Meyers
33
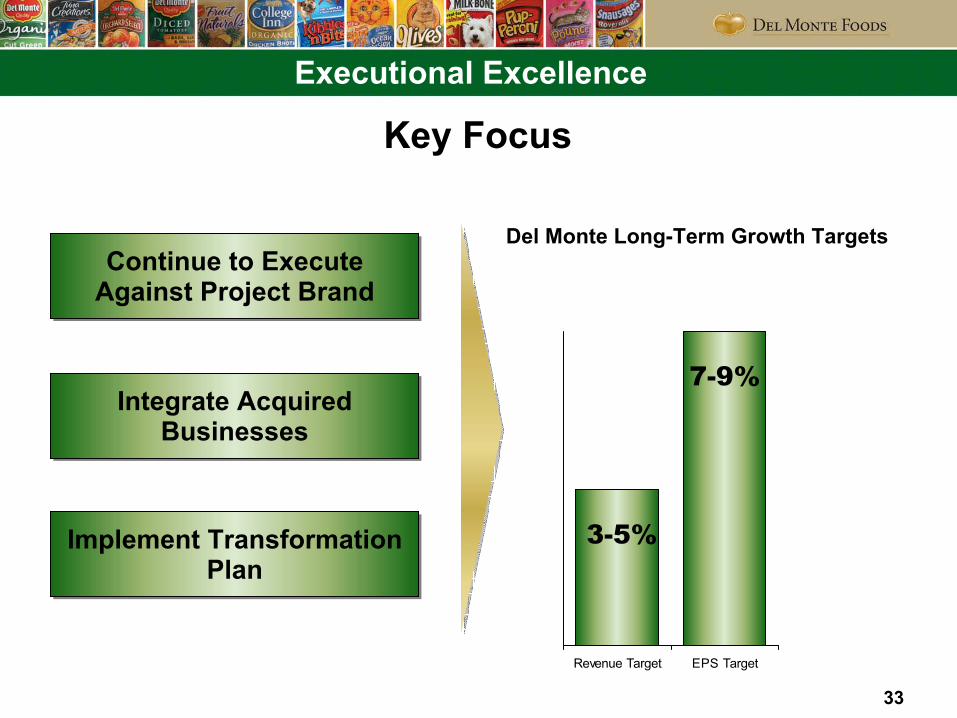
Executional Excellence
Key Focus
Continue to Execute Against Project BrandContinue to Execute
Against Project Brand
Integrate Acquired Businesses
Integrate Acquired Businesses
Implement Transformation Plan
Implement Transformation Plan
Revenue Target EPS Target
Del Monte Long-Term Growth Targets
3-5%
7-9%

34