Embed Size (px)
Citation preview

Determining the Fracture Energy Density of Asphalt
Binder Using the Binder Fracture Energy (BFE) Test
Roque Reynaldo, Ph.D., P.E. Yu Yan, Ph.D.
Department of Civil and Coastal Engineering University of Florida
Sept. 12th , 2016

Background
The fatigue resistance of asphalt binder strongly influences the fatigue performance of asphalt mixture and pavement
None of the existing test methods for asphalt binder was able to provide parameters consistently correlated with relative cracking performance of mixtures, including o DSR (G*sinδ), Elastic Recovery (ER), and
o Force-Ductility (FD)

Fracture energy is a good indicator of fatigue resistance of asphalt mixtures
Cumulative energy to failure from FD results showed improved ability to predict cracking performance at intermediate temperatures o FD was not optimized to determine fracture energy
accurately
A test designed to obtain fracture energy could provide a better parameter related to fatigue resistance of binder
Background (Cont.)

Traditional Direction Tension (DT) test has limitations.
Long middle part with uniform area: o Specimen may crack anywhere → high deviation in measured
failure strain o Often results in premature failure o Difficult to apply high enough strain rate to reduce excessive
deformation o May exceed loading rate capacity of equipment without fracture.
Background (Cont.)

There is a need to develop a new DT test that allows for accurate determination of stress-strain relationships and fracture energy density (FED) of binder at intermediate temperatures.
Background (Cont.)
UF research group developed a binder fracture energy (BFE) test with:
o Specially designed specimen geometry; and
o Data interpretation procedure.

3-D Specimen Shape Stress Distribution on Cross-Sections
A 5×5 mm uniform stress distribution area
Stress Concentration Factor is around 11.0
Geometry Development No.1: 3-D FEA
Geometry Development No.1: Prototype Test
Adhesion between asphalt and loading head was less than Cohesion of asphalt
Need to modify the specimen shape
Test on MTS Machine Asphalt peeled off from load head

Geometry Development No.2: 3-D FEA
Fairly uniform stress concentration area at the center Stress concentration factor is greater than 5
Bottleneck Shape Stress Distribution on Cross-Sections
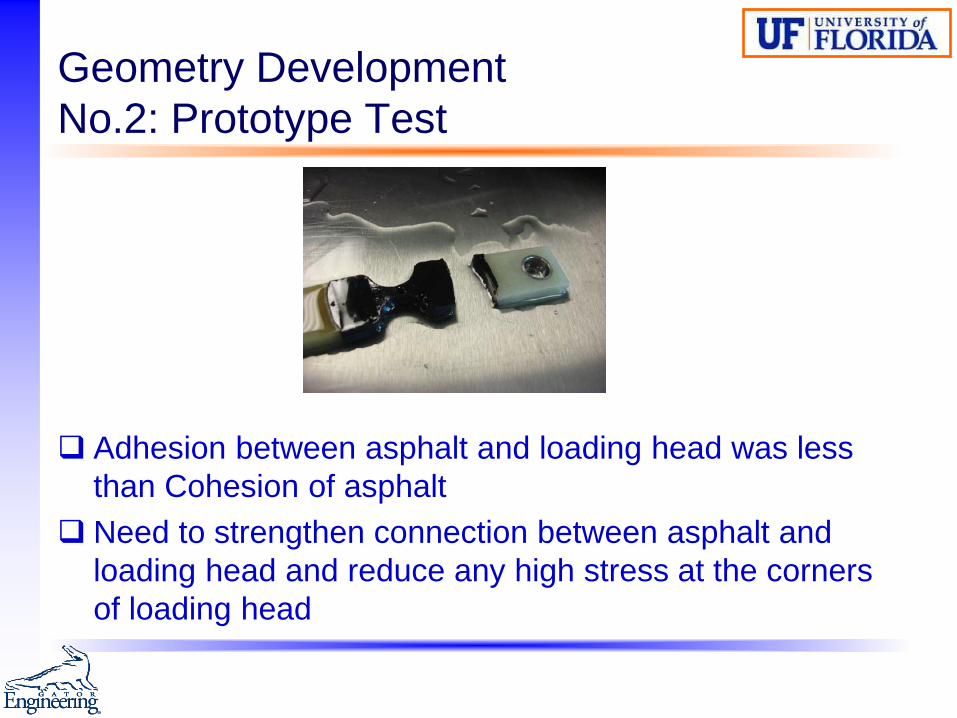
Geometry Development No.2: Prototype Test
Adhesion between asphalt and loading head was less than Cohesion of asphalt
Need to strengthen connection between asphalt and loading head and reduce any high stress at the corners of loading head

Geometry Development No.3: 3-D FEA
Stress Distribution on Cross-Sections Horizontal Cross Section
Fairly uniform stress concentration area at center Stress concentration at contact surface of loading head
eliminated

Geometry Development No.3: Prototype Test
Testing Equipment Crack at Center
b
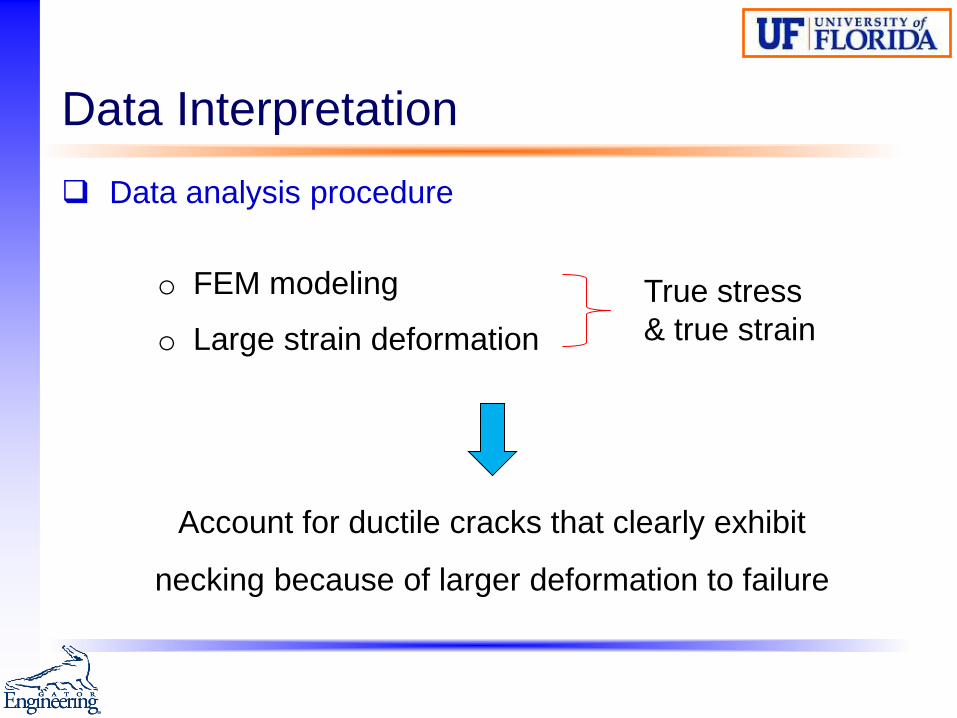
Data analysis procedure
o FEM modeling
o Large strain deformation
Data Interpretation
True stress & true strain
Account for ductile cracks that clearly exhibit
necking because of larger deformation to failure
y = 0.006x2 - 0.925x + 24 R² = 1
0.0
5.0
10.0
15.0
20.0
25.0
30.0
0 2 4 6 8 10 12 14A
rea
(mm
2 )
Extension (mm)
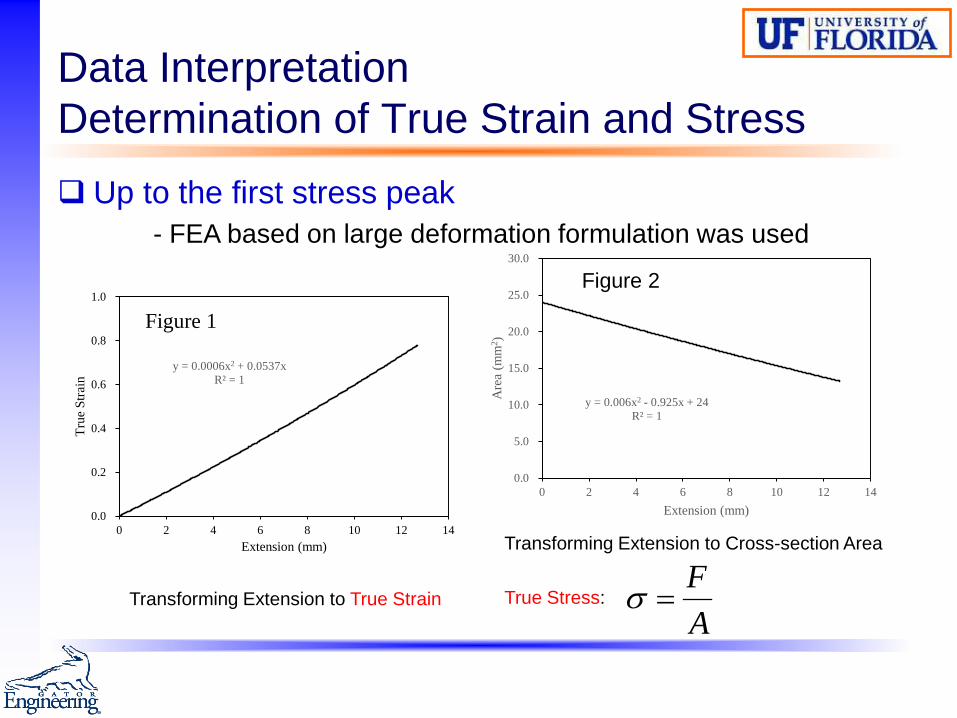
Figure 2
Data Interpretation Determination of True Strain and Stress Up to the first stress peak
- FEA based on large deformation formulation was used
Transforming Extension to True Strain
y = 0.0006x2 + 0.0537x R² = 1
0.0
0.2
0.4
0.6
0.8
1.0
0 2 4 6 8 10 12 14
True
Stra
in
Extension (mm) Transforming Extension to Cross-section Area
True Stress: AF
=σ
Figure 1

y = 0.0086x2 + 0.132x + 3.0 R² = 1
0.0
2.0
4.0
6.0
8.0
0 2 4 6 8 10 12 14
Leng
th (m
m)
Extension (mm)
Calculating Area of Cross-Section at Peak Calculating Length of 3mm Part at Peak
At the first stress peak - Length and Cross-sectional Area can be determined using FEA with large deformation formulation
Data Interpretation Determination of True Strain and Stress (Cont.)
y = 0.006x2 - 0.925x + 24 R² = 1
0.0
5.0
10.0
15.0
20.0
25.0
30.0
0 2 4 6 8 10 12 14
Are
a (m
m2 )
Extension (mm)
Figure 3 Figure 2
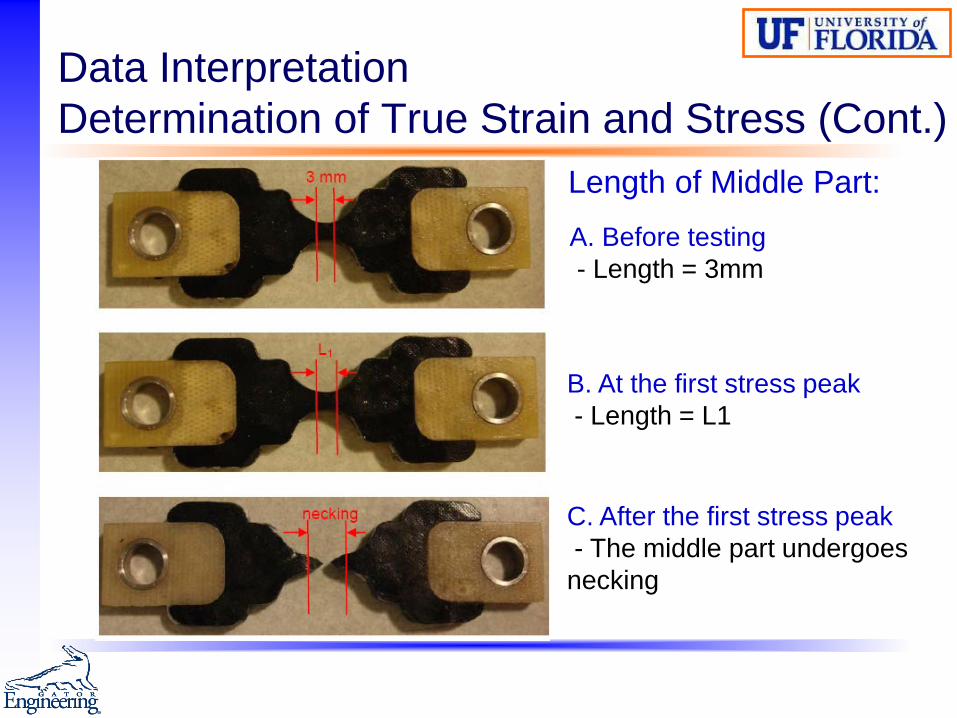
A. Before testing - Length = 3mm
Length of Middle Part:
B. At the first stress peak - Length = L1
C. After the first stress peak - The middle part undergoes necking
Data Interpretation Determination of True Strain and Stress (Cont.)

Data Interpretation Determination of True Strain and Stress (Cont.) After the first stress peak
LLAA )( 11 ⋅=
AF
=σ
=
1
lnLLε
Assume most strain occurs in the middle 3mm of the specimen, and use large strain formulation
True Stress: True Strain:

0
100
200
300
400
500
600
0.0 0.5 1.0 1.5
Tru
e St
ress
(psi
)
True Strain
After applying these calculation procedures, the point of initial fracture is clear
The post-peak energy after the point of initial fracture should not be considered
Example:
Binder Type: PG 67-22
Testing temperature: 15 ˚C
Displacement rate: 500mm/min
fracture First stress peak
Large deformation FEA
Large strain formula: ε = ln(L/L1)
Data Interpretation Determination of Fracture Energy Density

Premature Failure Identification
At low temperatures and/or faster loading rates, any imperfection of specimen may result in premature failure
Premature failure can be identified based on o Geometric characteristics of failed specimen o Fracture energy density o True stress-strain curve
Implication: there is an optimal combination of temperature and loading rate range to consistently obtain fracture energy of binder

0
100
200
300
400
500
0.0 0.2 0.4 0.6 0.8 1.0 1.2
True
Stre
ss (p
si)
True Strain
Proper Fracture Premature Fracture
0
100
200
300
400
500
600
700
0.0 0.2 0.4 0.6 0.8
True
Stre
ss (p
si)
True Strain
FE=12 psi FE=208 psi
Premature Failure Identification (Cont.)

Tests and Analyses of Binders o Preliminary Tests
o SUPERPAVE Section Recovered Binders
oHybrid and Highly Polymer-modified Binders

Preliminary Tests
Tests were run on the MTS machine
Test temperatures: 0, 5, 10, 15, 20 ˚C
Various loading rates: depend on the test temperature
PAV-aged Binders:
o PG 67-22 (unmodified)
o PG 76-22 (SBS Polymer modified)

Fracture Energy Density at 15 ˚C
Consistent for the same binder at different loading rates
Clearly differentiates between SBS-modified and unmodified binders
Fracture Energy Density at 15 ˚C:

The average FED values are consistent for the same binder at different temperatures
The difference between PG 76-22 and PG 67-22 is clear
Average FED at Each Temperature
Average Fracture Energy Density at Various Temperatures

Summary of Preliminary Tests
15 ˚C appeared to be the optimal test temperature for both PG 67-22 and PG 76-22
An optimal or acceptable range of loading rate should be used to obtain consistent and accurate fracture energy
o Avoid premature fracture and excessive deformation

Recovered from asphalt mixtures of 12 Superpave
Projects :
o Unmodified binders: AC-30, AC-20, PG 64-22 o SBS polymer modified binder: PG 76-22 o Rubber modified binder: ARB-5
Binders Recovered from Superpave Sections (Cont.)
Of note, RAP binder was present in the recovered binders because RAP is routinely used in Florida.

AC-20 recovered, FED vs. Loading Rate
Binders Recovered from Superpave Sections (Cont.)
Test temperature:
15 °C
Multiple loading
rates
o FED was consistent at different loading rates.

o The BFE test clearly distinguished between different types of binder.
Fracture Energy of binders recovered from Superpave sections
Rubber not recovered
Binders Recovered from Superpave Sections (Cont.)

All the binders are PAV residues
o 3 types of hybrid binder:
Wright: rubber and SBS
Hudson: 3.5% rubber+2.5%SBS
Geotech: 8% of rubber + 1% SBS
o 1 type of highly SBS modified binder: PG 82-22
Hybrid Binders and Highly Polymer Modified Binder
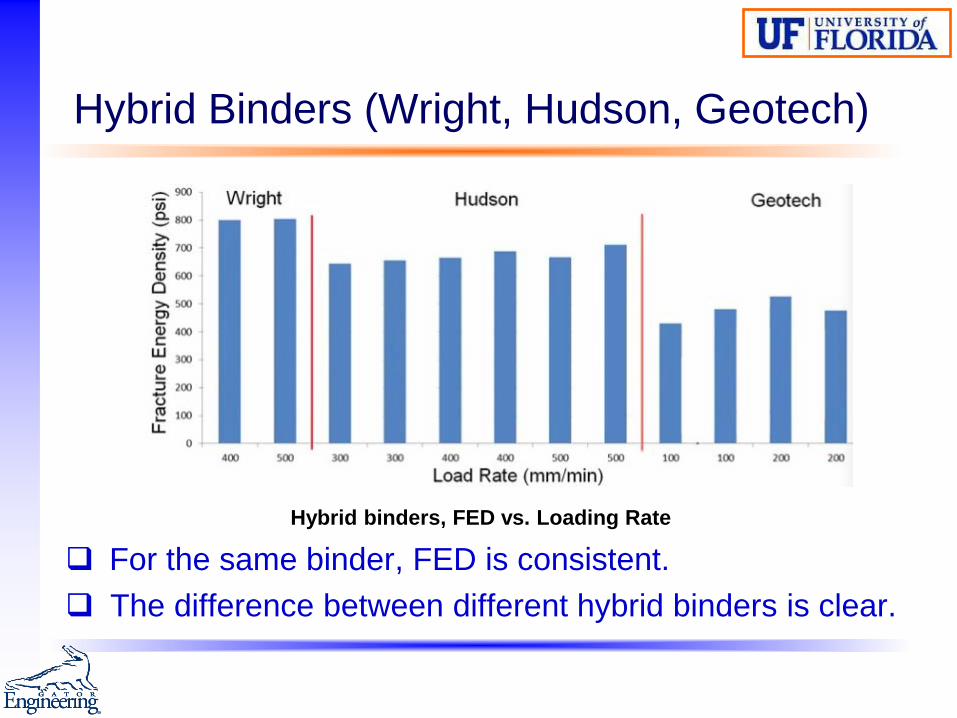
Hybrid Binders (Wright, Hudson, Geotech)
Hybrid binders, FED vs. Loading Rate
For the same binder, FED is consistent. The difference between different hybrid binders is clear.

FED of PG 82-22 is consistent regardless of loading rate and temperature.
PG 82-22, FED vs. Loading Rate
PG 82-22 (Cont.)

Fracture Energy Density of various binders
Binder FED Results: PAV residue

Statistical analyses showed:
o The BFE test effectively differentiated between binders in terms of FED
o For the same binder, the FED is independent of loading rate and temperature in a certain range
It indicates that FED is a fundamental property of binder
o It can be determined by tests performed at a single temperature and loading rate
Results of Statistical Analyses
Testing Standard Development o Binder conditioning RTFO +PAV (AASHTO 315)
o Displacement rate and testing temperature 500 mm/min at 15°C (Recommended)
o A broad range of asphalt binders

Materials Binder Types Modifying Components
Unmodified binders
PG 52-28
None PG 58-22 PG 64-22 PG 67-22
Rubber-modified binders
ARB-5 5% Type B GTR
ARB-12 12% Type B GTR
Hybrid binders
(rubber plus polymer)
Hybrid A 1% SBS (approximately 30 mesh, incorporated dry), 8% of Type B GTR, 1% hydrocarbon
Hybrid B 3.5% crumb rubber, 2.5% SBS, 0.4%-plus Link PT-743-cross linking agent
Hybrid C 10% rubber, 3±0.1% radial SBS PG 76-22 ARB I 7 - 7.5 % GTR and SBS (optional) PG 76-22 ARB II
Polymer-modified binders
PG 64-34 PMA 7.5% SBS content PG 76-22 PMA I 2-3.5 % SBS PG 76-22 PMA II 2-4.25 % SBS PG 82-22 PMA 8.5% SBS

Typical True Stress-True Strain Curve
0
1,500
3,000
4,500
6,000
7,500
9,000
0.0 0.5 1.0 1.5 2.0 2.5
True
Stre
ss (k
Pa)
True Strain
0
1,500
3,000
4,500
6,000
7,500
9,000
0.0 0.5 1.0 1.5 2.0 2.5
True
Stre
ss (k
Pa)
True Strain
0
1,500
3,000
4,500
6,000
7,500
9,000
0.0 0.5 1.0 1.5 2.0 2.5
True
Stre
ss (k
Pa)
True Strain
0
1,500
3,000
4,500
6,000
7,500
9,000
0.0 0.5 1.0 1.5 2.0 2.5
True
Stre
ss (k
Pa)
True Strain
Unmodified Rubber modified
Hybrid SBS modified

354432 461 488
720 698
944 9671,062 1,031 1,021
1,1991,260
1,684
2,431
0
800
1,600
2,400
3,200
Bin
der F
ract
ure
Ener
gy D
ensi
ty (p
si)
UnmodifiedRubber
Hybrid SBS
Fracture Energy Density Values

AASHTO Provisional Standard
Conclusion
The BFE test and data interpretation system developed
suitably measures FED of asphalt binders, including:
o Unmodified binder
o Modified binder (rubber, polymer, hybrid)
o Binder recovered from pavement (except rubber)
Recommendation
The BFE test may be an effective tool for binder
specification by state highway agencies to:
o Identify the presence of modifiers
o Provide a quantitative assessment of relative binder
performance based on FED values

![Fatigue performance evaluation of modified asphalt binder ...mahmoudameri.com/Articles/Fatigue performance evaluation.pdf · to represent the short term aging of asphalt binder [21,23]](https://img.dokumen.tips/doc/110x75/5eade3a5fac1863a1f405679/fatigue-performance-evaluation-of-modified-asphalt-binder-performance-evaluationpdf.jpg)