Embed Size (px)
Citation preview

`
Determining optimised H3 LOSP treatment options for decay protection in softwood glulam
PROJECT NUMBER: PNB038-0708 DECEMBER 2011
PROCESSING
This report can also be viewed on the FWPA website
www.fwpa.com.auFWPA Level 4, 10-16 Queen Street,
Melbourne VIC 3000, AustraliaT +61 (0)3 9927 3200 F +61 (0)3 9927 3288
E [email protected] W www.fwpa.com.au

Determining optimised H3 LOSP treatment options for decay protection in softwood glulam
Prepared for
Forest & Wood Products Australia
by
Laurie J. Cookson

ForesLevelT +61E infoW ww
Pubfor Proje © 201 Foresrespeall peany ofrom This wFWPAcommReprolicensFores This wFishe ISBN:
PrincLauriCSIR
Final
st & Wood Pl 4, 10-16 Qu1 3 9927 [email protected]
blicationdecay pr
ect No: PN
11 Forest & W
st & Wood Pect to this puersons assocopinion, advithe use of su
work is copyA logo may
mercial beneoduction or see of copyrst & Wood P
work is supperies and For
: 978-1-92176
cipal Researe J. Cookson
RO
l report rece
Products Auueen St, Mel00 F +61 3 9
m.au m.au
: Determrotection
B038.0708
Wood Produ
Products Aublication inclciated with itce or informauch opinion,
yright and probe reprodu
fit and its socopying for
right under throducts Aust
ported by funrestry (DAFF
63-29-8
rcher: n
eived by FW
ustralia Limbourne, Victo
9927 3288
mining opn in softw
8
ucts Australia
stralia Limiteluding merch exclude all ation containadvice or inf
otected undeuced in wholurce (Forestother purpo
he Copyrighttralia Limited
ding provideF).
WPA in April,
ited oria, 3000
ptimised wood glu
a Limited. All
ed (FWPA) hantability, fitliability (incl
ned in this puformation.
er the Copyrile or in partt & Wood Prooses, which t Act, is proh
d.
ed to FWPA b
, 2011
H3 LOSPulam
rights reserv
makes no wtness for puruding liabilityublication or
ight Act 1968t, provided toducts Austris strictly re
hibited witho
by the Depar
P treatm
ved.
warranties orrpose or othey for negligefor any cons
8 (Cth). All mhat it is notalia Limited)
eserved only ut the prior w
rtment of Agr
ment optio
r assuranceserwise. FWPence) in relatsequences a
material excet sold or use) is acknowley for the ownwritten cons
riculture,
ons
s with A and tion to arising
ept the ed for
edged. ner or
sent of

CLIENT REPORT No: EP112624
Page 2 of 55
EXECUTIVE SUMMARY
Objective
The objective of this research was to examine the LOSP treatment options available for H3 exposed glulam of Pinus radiata and P. elliottii. The options include treating before or after gluing, and treating to the usual retention of 35-40 l/m3 or the higher retention of 70-80 l/m3. Most test beams (260 x 65 mm profile) or laminates were treated with azole LOSP, while some were treated with TBTN or CCA for comparison. A spot test was used to examine LOSP penetration. Test specimens 200 mm long were cut from the beams, and exposed at Innisfail or in an Accelerated Field Simulator (AFS). Exposure methods were designed to give severe exposure and accelerated results. After 3.1-3.2 years, test specimens were given a performance rating from a scale of 8 (sound) to 0 (destroyed by decay).
Key Results
The spot test and image analysis technique used to assess TBTN penetration in glulam gave useful results, and there was a mean cross-sectional penetration of 67%. However, the addition of zinc tracer to azole LOSP at the concentrations described aided little in determining the penetration of LOSP, as there was insufficient colour reaction. The maximum penetration detected for azole LOSP was 15%, obviously much less than was achieved.
For untreated glulam exposed horizontally (flat) at Innisfail, both P. elliottii and P. radiata had mean ratings of 0.0 as they were fully decayed. There was less decay in the AFS, with mean ratings for untreated P. elliottii and P. radiata of 4.2 and 5.8 respectively. Untreated P. elliottii exposed vertically in the AFS had a mean rating of 0.7. Untreated P. elliottii was slightly more perishable than P. radiata.
Results for untreated glulam suggests that the decay rate at Innisfail was approximately 3 times faster than in the AFS.
For treated glulam, decay was more rapid in vertically exposed than horizontally exposed specimens, suggesting that glulam posts need special attention to prevent water penetration (such as with metal caps).
The use of end grain sealants based on ZnN or CuN gave improved decay resistance, but on their own were insufficient for post end protection (should be used in conjunction with a post cap).
There was little difference between the protection offered by ZnN and CuN, even though CuN is usually considered to be the more effective preservative.
For vertically exposed specimens, there were 4 paired comparisons where glulam was treated before or after gluing. The P. radiata comparisons at 37 with 40 l/m3 and 73 with 69 l/m3, and the P. elliottii comparison at 35-40 with 43 l/m3, all gave similar results where glulam treated before gluing performed better than when treated after gluing. This trend occurred in the field at Innisfail and in the AFS, and whether exposed sealed or unsealed. Nevertheless, glulam treated before gluing also often had significant levels of decay, suggesting that the protection of post ends is still important even for these treated timbers.
The exception to the previous point was P. elliottii treated to the higher pair of retentions. Unsealed specimens at Innisfail and in the AFS performed slightly better when treated after gluing than before gluing. This comparison had the greatest

CLIENT REPORT No: EP112624
Page 3 of 55
difference in treatment uptakes (56 l/m3 before gluing, 82 l/m3 after gluing), suggesting that the result may be partly due to the additional 26 l/m3 in the glulam that was treated after gluing. When these glulams were given additional end-grain protection with CuN or ZnN sealants, the performance result was virtually the same whether azole treated before or after gluing (mean ratings of 6.7 and 6.2 respectively).
There was generally less decay in horizontally exposed glulam so that fewer definitive comparisons could be made between the various treatments. In the AFS, mean ratings for treated glulam ranged from 7.6 to 8.0, so that no contrasts between treatments were evident at this stage.
For P. radiata at Innisfail, horizontally exposed glulam treated before gluing (37 l/m3) had slightly less decay than glulam treated after gluing (40 l/m3), with mean ratings of 7.8 and 6.7 respectively. There was insufficient decay at the higher retentions (73 with 69 l/m3 comparison) for any conclusions to be drawn.
For P. elliottii at Innisfail, horizontally exposed glulam treated before gluing (35-40 l/m3) was performing similarly to glulam treated after gluing (43 l/m3), with mean ratings of 7.0 and 7.3 respectively. At the higher retentions (56 with 82 l/m3), glulam treated after gluing was performing better than glulam treated before gluing, with mean ratings of 7.8 and 5.9 respectively. Again, this result may be due partly to the higher retention achieved in glulam treated after gluing. There may also be some influence from the fact that glulam treated before gluing is dressed after gluing, which would remove some of the treated envelope and perhaps expose some unpenetrated heartwood.
At this stage at Innisfail there was little difference in performance between horizontally exposed glulam treated with CCA (mean rating 7.8), TBTN (mean rating 7.6) and many of the azole treatments including P. radiata treated before gluing with 37 l/m3 (mean rating 7.8), 73 l/m3 (mean rating 8.0), after gluing with 69 l/m3 (mean rating 7.6) and P. elliottii treated after gluing with 82 l/m3 (mean rating 7.8).
Application of Results
The results suggest that treating glulam before gluing will generally give better performance than treatment after gluing. The sometimes disappointing results for ‘posts’ on the effectiveness of resealing with CuN or ZnN after docking in this trial suggests that a better approach would be to include barriers (caps) as well, or to use designs where the end is not exposed to rain or can drain away readily. While decay is occurring quickly in ‘posts’ made from even some of the ‘best’ glulam treatments, it should be remembered that this test was designed for accelerated results. The detailing of glulam for real-life exposure is obviously important when promoting its service life. A number of treatments for horizontally exposed beams are performing well.
Further Work
Further annual inspections of this trial could be considered, especially for the horizontally exposed specimens at Innisfail.

CLIENT REPORT No: EP112624
Page 4 of 55
TABLE OF CONTENTS
EXECUTIVE SUMMARY ....................................................................................................................... 2 Objective .............................................................................................................................................. 2 Key Results ......................................................................................................................................... 2 Application of Results ...................................................................................................................... 3 Further Work ....................................................................................................................................... 3
TABLE OF CONTENTS ......................................................................................................................... 4
INTRODUCTION ..................................................................................................................................... 5
RESULTS AND DISCUSSION ............................................................................................................. 6 Treatment and installation .............................................................................................................. 6 Penetration .......................................................................................................................................... 10 Three year inspections .................................................................................................................... 13 Horizontal exposure .............................................................................................................................. 13 Vertical exposure ................................................................................................................................... 19
CONCLUSIONS ...................................................................................................................................... 27
ACKNOWLEDGEMENTS ...................................................................................................................... 28
MATERIALS AND METHODS .............................................................................................................. 29 Timber treatment ............................................................................................................................... 29 Selection of test specimens ........................................................................................................... 30 Preservative penetration ................................................................................................................. 31 End sealing and painting................................................................................................................. 33 Accelerated Field Simulator exposure ........................................................................................ 33 Innisfail exposure .............................................................................................................................. 34 Glulam inspection ............................................................................................................................. 35
APPENDIX 1. Assessment of glulam after 3.2 years at Innisfail. .............................................. 36
APPENDIX 2. Assessment of glulam after 3.1 years at Clayton AFS. ..................................... 46

CLIENT REPORT No: EP112624
Page 5 of 55
INTRODUCTION
There are a number of benefits in treating glulam in final form (after gluing), such as no interference from preservative on the formation of the glue bond, and reduced preservative treated wood waste as wood is dressed before treating1,2,3. Penetration of Pinus radiata glulam is restricted in the tangential direction irrespective of the severity of treatment, but the timber is very permeable in the radial and longitudinal directions3. In 1985 in New Zealand, a minimum of 10 mm penetration was required from any exposed face3. The current joint standard requires all sapwood to be treated and a minimum 8 mm heartwood penetrated on exposed faces for critical members, when the lesser cross-sectional dimension is more than 35 mm, and unless the heartwood is of class 1 natural durability4. Glulam treated after gluing with creosote has performed well1; however most preservatives do not bleed or reseal like creosote, so there may be increased risk of fungal establishment in checks and other faults that develop during exposure. There have been some examples in Australia of premature failure of glulam treated after gluing to the LOSP retention of 35-40 l/m3. Some examples of failure occurred when the top end of glulam posts were docked to height after installation and simply painted. This example has raised concern about the level of preservative penetration that can be achieved in glulam that is LOSP treated after gluing, and whether it is an inferior product to glulam treated before the laminates are glued. Another problem can arise if the glulam end is docked to expose untreated heartwood and sapwood, and whether there is a need for a brush-on preservative or cap for the docked end. The aim of this trial was to compare the resistance to decay of LOSP azole-treated Pinus elliottii and P. radiata glulam, treated before or after gluing, and at two different preservative retentions. Other aspects were to examine the value of resealing ends cut after treatment, to calibrate decay rates between the field (Innisfail in the wet tropics) and a laboratory test facility called the Accelerated Field Simulator (AFS). For comparison, P. elliottii glulam treated with TBTN LOSP, and P. radiata treated with CCA, were included for exposure. The treatment, penetration, installation, and one and two year inspections of the trial were described earlier5,6. This report provides the three year inspection results.
1 Selbo, M.L. (1957). Laminating of preservative-treated wood. Proceedings of the American Wood-Preservers’ Association, 53: 48-55. 2 Hunter, A (1985). The installation and operation of a light organic solvent preservative treatment plant for glue-laminated radiata pine. NZ Wood Preservers’ Association. 25: 59-61. 3 Vinden, P (1985). Optimisation of light organic solvent preservative (LOSP) treatment of radiata pine. NZ Wood Preservers’ Association. 25: 87-104. 4 Australian/New Zealand Standard (2010). Specification for preservative treatment. Part 5: Glued laminated timber products. AS/NZS 1604.5:2010. 5 Cookson, L.J. (2009). Assessing the decay resistance of preservative treated glulam before and after gluing. Trial installation and first year inspection. FWPA project PN07.2035. CSIRO MSE Client Report No. CMSE (C)-2009-111. 6 Cookson, L.J. (2010). Assessing the decay resistance of preservative treated glulam before and after gluing. Second year inspection. FWPA project PN07.2035. CSIRO MSE Client Report No. CMSE (C)-2010-074.
CLIENT REPORT No: EP112624
Page 6 of 55
RESULTS AND DISCUSSION
Treatment and installation
P. radiata and P. elliottii was treated either before gluing as loose laminates (70 x 30 mm profile) or after gluing as glulam (260 x 65 mm profile). Lengths that were 3.0 or 3.6 m were treated with an azole LOSP that contained a trace amount of zinc octoate to aid spot testing. Most treatments occurred at Corbek Timber Preservation on the Gold Coast. However, the low retention loose laminates of P. elliottii were treated by Timbertec Treatment Pty Ltd at Meadowbrook (before gluing) and glulam treated in this way was taken from their standard commercial supply to Hyne & Son Pty Ltd. The low retention loose laminates of P. radiata were treated (before gluing) at CSIRO as 1.8 m lengths using timber supplied by Warrnambool Timber Industries Pty Ltd. The TBTN treatment was also conducted at CSIRO on 1.2 m P. radiata glulam beams supplied by Hyne. A further comparison added to the trial was the H3 CCA treatment (by CSIRO) of 200 mm long test specimens of P. radiata glulam for exposure at Innisfail. Table 1 provides a summary of the test timbers placed for exposure, and includes the treater and mean retentions achieved. After LOSP treatment, 200 mm long test specimens were cut from the glulam beams, and 50 mm long wafers cut from between the test specimens were retained for preservative penetration spot testing. Test specimens were exposed horizontally (flat) or vertically (like posts). Those exposed horizontally had their cut ends resealed with three coats of epoxy, so that decay should initiate through the original treated surface rather than the ends cut after treatment and glulam manufacture. The vertically exposed test specimens at Innisfail were painted on the sides, in an effort to reduce splitting during exposure. Similar vertical specimens in the AFS were not painted because they would not be exposed to outdoor weathering. Half of the vertically exposed test specimens at either site had no additional protection given to the ends cut after treatment (= unprotected ends). The other half had the cut ends resealed with LOSP, using either a brush application of copper naphthenate (CuN) or a spray can application of zinc naphthenate (ZnN). The AFS trial was installed on 5-8 February 2008 (Figure 1), while those at Innisfail were installed on 12-15 February 2008 (Figures 2-4). Test specimens at both Innisfail and AFS were placed upon two supporting planks of untreated P. radiata that would act as a water trap and decay bait. Specimens in the AFS were watered periodically.

CLIENT REPORT No: EP112624
Page 7 of 55
Table 1: Replicate number of each variation exposed in the glulam trial at each test site. Also showing
the treater and solution uptake achieved.
Test site Mean retention l/m3
(and treater) Treatment
stage
Exposed flat, epoxy protected
ends
Exposed vertically (like the top of a post)
No protection
Brush/spray with LOSP (half CuN, half ZnN)
Azole radiata pine Innisfail 37 (CSIRO) Pre gluing 10 10 10
40 (Corbek) After gluing 10 10 10 73 (Corbek) Pre gluing 10 10 10 69 (Corbek) After gluing 10 10 10
AFS 37 (CSIRO) Pre gluing 10 10 10 40 (Corbek) After gluing 10 10 10 73 (Corbek) Pre gluing 10 10 10 69 (Corbek) After gluing 10 10 10
Azole slash pine Innisfail 35-40 (Timbertec) Pre gluing 10 10 10
43 (Corbek) After gluing 10 10 10 56 (Corbek) Pre gluing 10 10 10 82 (Corbek) After gluing 10 10 10
AFS 35-40 (Timbertec) Pre gluing 10 10 10 43 (Corbek) After gluing 10 10 10 56 (Corbek) Pre gluing 10 10 10 82 (Corbek) After gluing 10 10 10
0.16% m/m tin TBTN treated slash pine Innisfail 37 (CSIRO) After gluing 10 NT NT
AFS 37 (CSIRO) After gluing 10 NT NT untreated controls radiata pine
Innisfail 0 None 10 NT NT AFS 0 None 10 NT NT
Untreated controls slash pine Innisfail 0 None- 10 NT NT
AFS 0 None 10 10 NT H3 CCA (0.38% TAE) radiata pine
Innisfail 570 (CSIRO) After gluing 10 NT NT NT = Not tested

CLIENT REPORT No: EP112624
Page 8 of 55
Figure 1. Three tanks in the AFS containing rows and layers of glulam test specimens, with irrigation
and drainage system. Green ends are test specimens brushed with CuN end seal.
Figure 2. Two frames of test specimens laying flat (horizontally) and exposed at Innisfail. Top wires
aid retention of test specimens during cyclones. Test specimens sealed with epoxy on their ends.

CLIENT REPORT No: EP112624
Page 9 of 55
Figure 3. Another frame of test specimens laying flat and exposed at Innisfail.
Figure 4. Vertical test specimens at Innisfail, and a small set of flat laying test specimens (in top right
frame). Note that the sides of the vertical specimens at Innisfail were painted. Specimens with green ends had been resealed with CuN.

CLIENT REPORT No: EP112624
Page 10 of 55
Penetration
Wafers 50 mm long were cut from between each 200 mm long test specimen. For preservative penetration analysis, the wafer taken from the centre of each glulam beam was sprayed with PAN indicator to detect zinc in the azole-treated specimens, and tin in the TBTN-treated specimens. A new method of image analysis was developed to so that the percentage of the cross sectional area penetrated according to the spot test could be accurately determined (see Materials and Methods). The best colour reaction obtained with PAN was in the TBTN-treated P. radiata beams (Figures 5-6), and there was a mean cross-sectional penetration of 67% (Table 2). Of the azole treatments with zinc octoate tracer the most penetration detected was 15% (Figure 7, Table 2), and was achieved at the CSIRO treatment plant where 50% more zinc than recommended had been added to the treatment solution. At the Corbek commercial treatment plant, the recommended amount of zinc octoate was added, but proved to be insufficient for spot testing (Figure 8). These results suggest that much higher concentrations of zinc are needed when acting as a ‘trace’ for spot testing in azole formulations.
Figure 5: TBTN-treated P. radiata beam JC, showing PAN stained wafers JC3, JC5, JC7 (left to right) removed from between test specimens (which were JC2, JC4, JC6, JC8). Showing good spot test for tin (red coloured regions).

CLIENT REPORT No: EP112624
Page 11 of 55
Figure 6: TBTN-treated P. radiata beam JE, showing PAN stained wafers JE3, JE5, JE7 (left to right) removed from between test specimens (which were JE2, JE4, JE6, JE8). Showing good spot test for tin (red coloured regions).
Table 2: Percentage penetration calculated from image analysis of centre wafers of treated glulam
boards. Mean (sd) of 10 replicates.
Treatment code
Mean retention l/m3
(and treater) Treatment
stage Mean area of cross-
section penetrated (sd) Azole radiata pine
A 37 (CSIRO) Pre gluing 15.2 (3.8) B 40 (Corbek) After gluing 4.4 (2.2) C 73 (Corbek) Pre gluing 2.7 (1.5) D 69 (Corbek) After gluing 5.0 (2.8)
Azole slash pine E 35-40 (Timbertec) Pre gluing 5.6 (3.0) F 43 (Corbek) After gluing 0.8 (0.2) G 56 (Corbek) Pre gluing 0.8 (0.7) H 82 (Corbek) After gluing 0.9 (0.7)
0.16% m/m tin TBTN treated slash pine J 37 (CSIRO) After gluing 66.6 (6.9)

CLIENT REPORT No: EP112624
Page 12 of 55
Figure 7: Azole-treated (before gluing) P. radiata beam AJ, showing PAN stained wafers AJ3, AJ5, AJ7, AJ9, AJ11 (left to right) removed from between test specimens (which were AJ2, AJ4, AJ6, AJ8, AJ10, AJ12). Showing limited success (mean of 15% penetration) as spot test for zinc (red coloured regions).
Figure 8: Azole-treated (after gluing) P. radiata beam DA, showing PAN stained wafers DA3, DA5, DA7, DA9, DA11 (left to right) removed from between test specimens (which were DA2, DA4, DA6, DA8, DA10, DA12). Showing poor spot test result for zinc (few red coloured regions).

CLIENT REPORT No: EP112624
Page 13 of 55
Three year inspections
Horizontal exposure
Test specimens were inspected after 3.2 years at Innisfail and 3.1 years in the AFS. Depth of decay was measured in each laminate, and test specimens assigned a rating using a scale of 0 to 8 where 8 is sound and 0 destroyed by decay. Results for each test specimen are given in the Appendices. A summary of the results for those specimens exposed flat (horizontally) are given in Table 3, and the appearance of some of the test specimens after 3.2 years at Innisfail is given in Figure 9. Unpainted horizontal test specimens at Innisfail often had many splits, mainly on their top surfaces, and the number of full length splits found on each test specimen is also recorded in the Appendices. Table 3: Mean (sd) ratings for specimens exposed horizontally (flat) for 3.1 or 3.2 years, with cut ends
protected by epoxy. Mean of 10 replicates. 8 = sound, 0 = destroyed.
Test site Treatment code
Mean retention l/m3
(and treater) Treatment
stage Mean rating
(sd) Rating range
Azole radiata pine Innisfail A 37 (CSIRO) Pre gluing 7.8 (0.6) 6-8
B 40 (Corbek) After gluing 6.7 (2.2) 2-8 C 73 (Corbek) Pre gluing 8.0 (0.0) 8 D 69 (Corbek) After gluing 7.6 (1.3) 4-8
AFS A 37 (CSIRO) Pre gluing 7.6 (1.3) 4-8 B 40 (Corbek) After gluing 8.0 (0.0) 8 C 73 (Corbek) Pre gluing 7.9 (0.3) 7-8 D 69 (Corbek) After gluing 8.0 (0.0) 8
Azole slash pine Innisfail E 35-40 (Timbertec) Pre gluing 7.0 (1.1) 5-8
F 43 (Corbek) After gluing 7.3 (1.6) 3-8 G 56 (Corbek) Pre gluing 5.9 (2.7) 0-8 H 82 (Corbek) After gluing 7.8 (0.6) 6-8
AFS E 35-40 (Timbertec) Pre gluing 7.8 (0.6) 6-8 F 43 (Corbek) After gluing 8.0 (0.0) 8 G 56 (Corbek) Pre gluing 7.8 (0.6) 6-8 H 82 (Corbek) After gluing 7.9 (0.3) 7-8
0.16% m/m tin TBTN treated slash pine Innisfail J 37 (CSIRO) After gluing 7.6 (0.5) 7-8
AFS J 37 (CSIRO) After gluing 7.8 (0.4) 7-8 Untreated controls slash pine
Innisfail K 0 - 0.0 (0.0) 0 AFS K 0 - 4.2 (1.7) 2-7
Untreated controls radiata pine Innisfail L 0 - 0.0 (0.0) 0
AFS L 0 - 5.8 (1.4) 4-8 H3 CCA (0.38% TAE) radiata pine
Innisfail N 570 (CSIRO) After gluing 7.8 (0.6) 6-8

CLIENT REPORT No: EP112624
Page 14 of 55
Figure 9. Frames 3 (near) and 4 (far) after 3.2 years at Innisfail with specimens laying horizontally
(compare to Figure 2 when first installed). Blank positions held untreated controls that had crumbled due to decay.
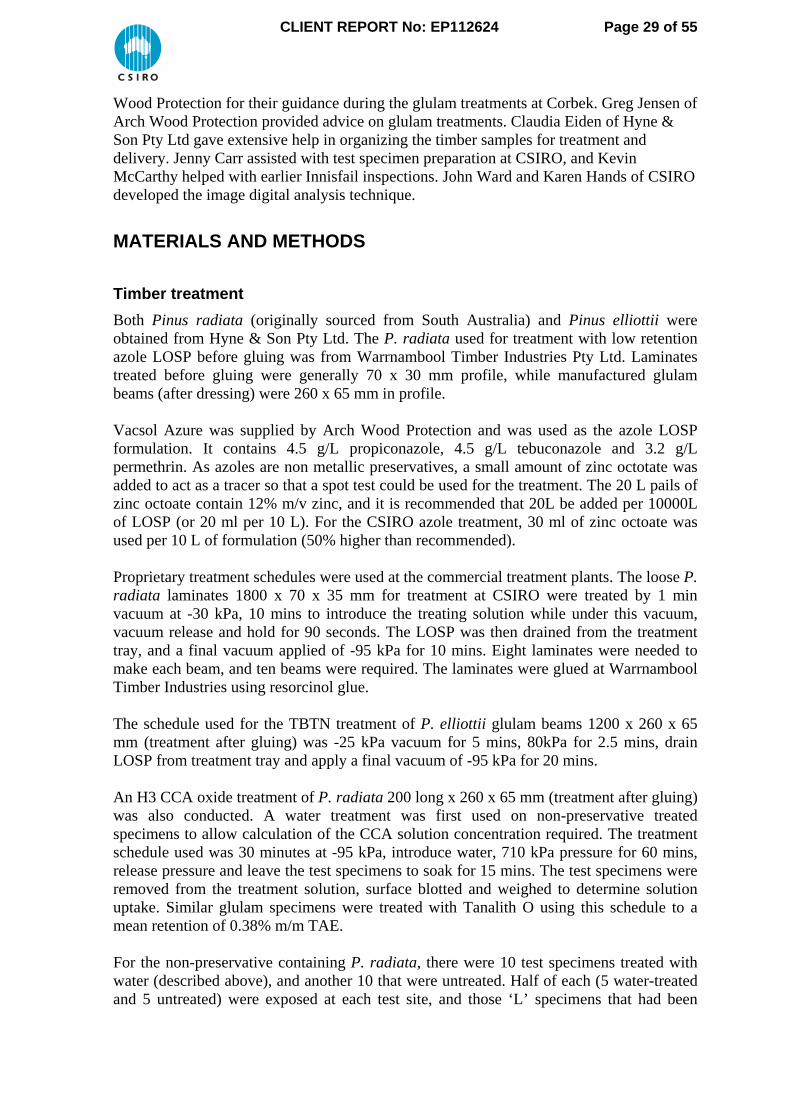
Most untreated test specimens in this trial were exposed horizontally. Untreated P. elliottii and P. radiata at Innisfail both had mean decay ratings of 0.0 as they were fully decayed and often disintegrated (Table 3, Figures 10-12). Decay was marginally slower in untreated P. radiata than untreated P. elliottii (Figure 13). There was less decay in the AFS, with mean ratings for untreated P. elliottii and P. radiata of 4.2 and 5.8 respectively (Table 3, Figures 14-15). These ratings after 3 years in the AFS were closer to the Innisfail one year results (5.2 and 7.3 respectively) than the two year results (0.4 and 1.4 mean ratings respectively), suggesting that the decay rate was 3 times faster at Innisfail than in the AFS. Untreated P. elliottii was also exposed vertically in the AFS, and had a mean rating of 0.7 (Table 4). Some of these latter test specimens had bell-shaped fruiting bodies growing on their sides (Figure 16). All decay found in test specimens at Innisfail and in the AFS was caused by brown-rotting fungi.

CLIENT REPORT No: EP112624
Page 15 of 55
Figure 10. Underside of test specimens after 3.2 years at Innisfail. HB4 = P. elliottii treated (82 l/m3)
after gluing with light-moderate decay rating 6; FJ4 = P. elliottii treated (43 l/m3) after gluing without decay rating 8; EG2 = P. elliottii treated (35-40 l/m3) before gluing with light decay rating 7; JD6 = TBTN-treated (37 l/m3) P. elliottii without decay rating 8; KA3 = untreated P. elliottii fully brown rotted rating 0.
Figure 11. Underside of test specimens after 3.2 years at Innisfail. JB4 = TBTN-treated (37 l/m3) P.
elliottii with light decay rating 7; KD2 = top side of untreated P. elliottii fully brown rotted rating 0; EA2 = P. elliottii treated (35-40 l/m3) before gluing with light-moderate decay rating 6.
CLIENT REPORT No: EP112624
Page 16 of 55
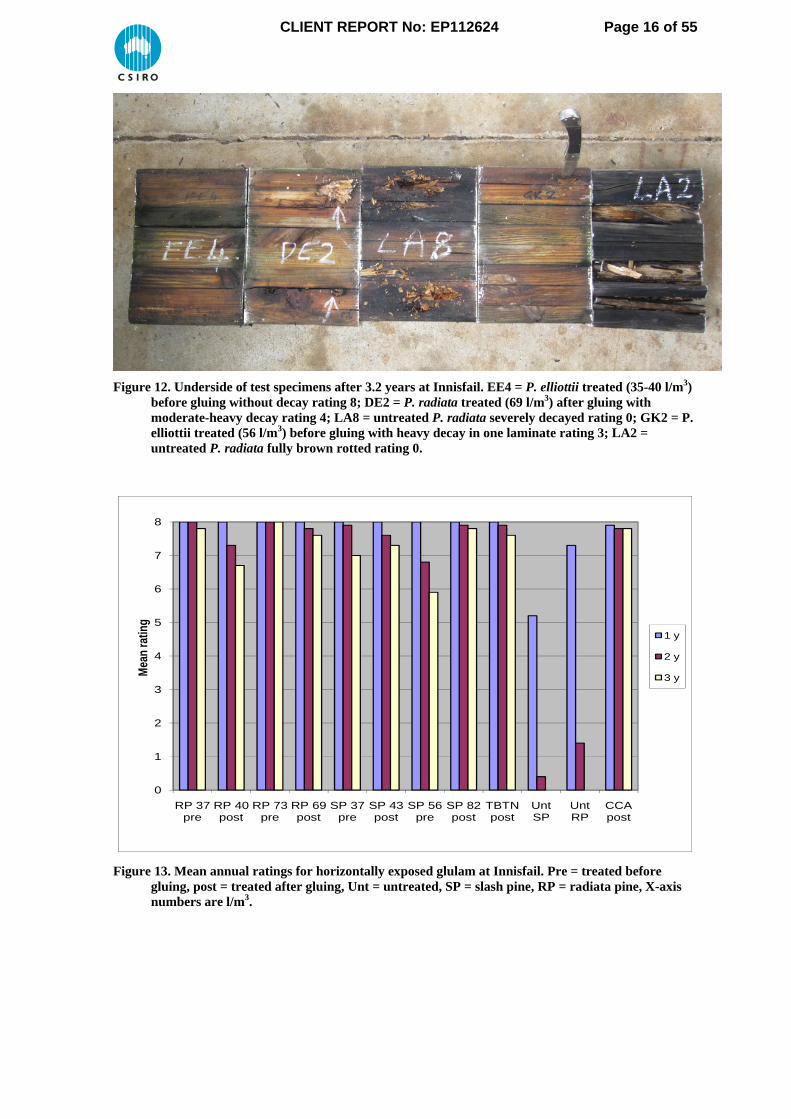
Figure 12. Underside of test specimens after 3.2 years at Innisfail. EE4 = P. elliottii treated (35-40 l/m3)
before gluing without decay rating 8; DE2 = P. radiata treated (69 l/m3) after gluing with moderate-heavy decay rating 4; LA8 = untreated P. radiata severely decayed rating 0; GK2 = P. elliottii treated (56 l/m3) before gluing with heavy decay in one laminate rating 3; LA2 = untreated P. radiata fully brown rotted rating 0.
0
1
2
3
4
5
6
7
8
RP 37 pre
RP 40 post
RP 73 pre
RP 69 post
SP 37 pre
SP 43 post
SP 56 pre
SP 82 post
TBTN post
Unt SP
Unt RP
CCA post
Mea
n ra
ting
1 y
2 y
3 y
Figure 13. Mean annual ratings for horizontally exposed glulam at Innisfail. Pre = treated before
gluing, post = treated after gluing, Unt = untreated, SP = slash pine, RP = radiata pine, X-axis numbers are l/m3.

CLIENT REPORT No: EP112624
Page 17 of 55
0
1
2
3
4
5
6
7
8
RP 37 pre
RP 40 post
RP 73 pre
RP 69 post
SP 37 pre
SP 43 post
SP 56 pre
SP 82 post
TBTN post
Unt SPUnt RP
Mea
n ra
ting
1 y
2 y
3 y
Figure 14. Mean annual ratings for horizontally exposed glulam in the AFS. Pre = treated before
gluing, post = treated after gluing, Unt = untreated, SP = slash pine, RP = radiata pine, X-axis numbers are l/m3.
Figure 15. Untreated glulam exposed horizontally for 3.1 years in the AFS. LA7 =top face of P. radiata with 8 mm brown rot in 1 laminate and fruiting bodies on side (closest face) rating 5; KB2 = bottom face of P. elliottii with 11-16 mm brown rot in 5 laminates rating 5.

CLIENT REPORT No: EP112624
Page 18 of 55
Figure 16. KD1 = untreated P. elliottii exposed vertically for 2.1 years in the AFS, showing bell-shaped
fruiting bodies over 2 laminates. Most horizontally exposed LOSP azole-treated test specimens (P. elliottii and P. radiata) in the AFS were sound after 3.1 years of exposure (Table 3). Of the 80 such test specimens exposed, only 5 had decay. The worst example was ‘AF2’, a P. radiata specimen treated before gluing (37 l/m3) with 21 mm decay on one face and 8 mm on the opposing face (rating 4). The other 4 test specimens with decay had only light or light-moderate decay (rating 7 or 6). For P. radiata, glulam treated before gluing (37 l/m3) had a mean rating of 7.6 compared to 8.0 when treated after gluing (40 l/m3). At the higher retentions, glulam treated before gluing (73 l/m3) had a mean rating of 7.9 compared to 8.0 when treated after gluing (69 l/m3). For P. elliottii, glulam treated before gluing (35-40 l/m3) had a mean rating of 7.8 compared to 8.0 when treated after gluing (43 l/m3). At the higher retentions, glulam treated before gluing (56 l/m3) had a mean rating of 7.8 compared to 7.9 when treated after gluing (82 l/m3). These results suggest marginally better results for glulam treated after gluing. One possible explanation for any minor difference is that glulam treated before gluing has some of the treatment envelope lost during dressing, which may expose untreated or poorly treated heartwood if present. Similar specimens at Innisfail often had more decay. Of the 80 azole-treated test specimens exposed, 21 had decay. For P. radiata, glulam treated before gluing (37 l/m3) had a mean rating of 7.8 compared to 6.7 when treated after gluing (40 l/m3). At the higher retentions, glulam treated before gluing (73 l/m3) had a mean rating of 8.0 compared to 7.6 when treated after gluing (69 l/m3). Unlike the AFS, these results suggest that treating P. radiata glulam before gluing gave slightly improved results. For P. elliottii, glulam treated before

CLIENT REPORT No: EP112624
Page 19 of 55
gluing (35-40 l/m3) had a mean rating of 7.0 compared to 7.3 when treated after gluing (43 l/m3). At the higher retentions, glulam treated before gluing (56 l/m3) had a mean rating of 5.9 compared to 7.8 when treated after gluing (82 l/m3). The results for P. elliottii therefore suggest that improved performance was obtained by treating glulam after gluing. This result at the higher retentions may be partly due to this comparison having the greatest difference in preservative uptakes (56 and 82 l/m3), a difference of 26 l/m3. For the comparative preservatives exposed horizontally, TBTN-treated P. elliottii had four specimens at Innisfail and two in the AFS with light decay (rating 7), so that mean ratings were 7.6 and 7.8 respectively (Table 3). CCA-treated P. radiata at Innisfail was also mostly sound, although one specimen had light-moderate decay, and the mean rating was 7.8.
Vertical exposure
There was more decay in the vertically exposed test specimens (‘posts’) at Innisfail (Figure 17) and in the AFS (Figure 18). Interestingly at Innisfail, whereas after one year most decay occurred in the bottom end resting upon untreated pine ‘feeder’ boards, after the second year there was much more decay originating from the top end where inoculation mostly likely occurred from air-borne spores (Figure 19). Further examples of vertically exposed test specimens at Innisfail are given in Figure 20, and for the AFS in Figure 21.
Figure 17. Frames 1 (left) and 2 (right) after 3.2 years at Innisfail, most specimens standing vertically
(compare to Figure 4 when first installed).

CLIENT REPORT No: EP112624
Page 20 of 55
Figure 18. Trough containing glulam test specimens after 3.1 years in the AFS.
Figure 19. Top ends of azole-treated test specimens exposed vertically for 3.2 years at Innisfail. BC12 =
P. radiata treated (40 l/m3) after gluing with deep decay in 5 laminates rating 0; FG6 = P. elliottii treated (43 l/m3) after gluing and sealed with CuN with deep decay in 5 laminates rating 0; GC8 = P. elliottii treated (56 l/m3) before gluing with deep decay in 7 laminates rating 0; BC10 = P. radiata treated (40 l/m3) after gluing with deep decay in 8 laminates rating 0; DC12 = P. radiata treated (69 l/m3) after gluing with 6 laminates rating 0; EH8 = P. elliottii treated (35-40 l/m3) before gluing with moderate decay in 1 laminate rating 5.

CLIENT REPORT No: EP112624
Page 21 of 55
Figure 20. Top ends of azole-treated test specimens exposed vertically for 3.2 years at Innisfail. BG10 =
P. radiata treated (40 l/m3) after gluing and sealed with ZnN; DF10 = P. radiata treated (69 l/m3) after gluing. Chalk marks show outline of decayed or discoloured regions where preservative penetration may have been lacking.
Figure 21. Top ends of specimens exposed vertically for 3.1 years in the AFS. EK8 = P. elliottii treated
(35-40 l/m3) before gluing and sealed with ZnN with 16-19 mm brown rot in 2 laminates rating 3; FD10 = P. elliottii treated (43 l/m3) after gluing and sealed with ZnN with 5-65 mm brown rot in 3 laminates rating 0 (failed); DG6 = P. radiata treated (69 l/m3) after gluing with 17 mm brown rot in 2 laminates rating 4; KC8 = untreated P. elliottii with 18-44 mm decay in all laminates rating 0; BF12 = P. radiata treated (40 l/m3) after gluing with 5-22 mm brown rot in 6 laminates rating 0.

CLIENT REPORT No: EP112624
Page 22 of 55
For the vertically exposed azole-treated test specimens, the worst performing glulam were generally those treated after gluing, although decay was also often well established in glulam treated before gluing (Table 4, Figures 22-23). Figure 20 shows the top ends to two specimens treated after gluing, with dark discoloured or decaying regions outlined in chalk, which probably also delineates the areas of limited preservative penetration. P. elliottii treated after gluing to 43 l/m3 with unprotected ends had a mean rating of 0.1 at Innisfail and 2.3 in the AFS, compared to treatment before gluing with 35-40 l/m3 where the mean ratings were 2.6 at Innisfail and 3.2 in the AFS. At the higher treatment levels, P. elliottii treated after gluing to 82 l/m3 with unprotected ends had a mean rating of 5.0 at Innisfail and 5.9 in the AFS, compared to treatment before gluing with 56 l/m3 where the mean ratings were 3.1 at Innisfail and 3.4 in the AFS. Again, the better performance in this comparison of glulam treated after gluing may be due to the comparatively higher retention (82 l/m3) tested. Table 4: Mean (sd) ratings for specimens exposed vertically for 3.1 or 3.2 years, with cut ends
unprotected or protected by LOSP spray or brush. Mean (sd) of 10 replicates. 8 = sound, 0 = destroyed.
Test site
Treatment code
Mean retn l/m3, treatment stage
Unprotected ends LOSP sealed ends Mean
rating (sd)Rating range
Mean rating (sd)
Rating range
Azole radiata pine Innisfail A 37 pre glue 2.9 (3.5) 0-8 5.0 (3.2) 0-8
B 40 post glue 1.5 (2.6) 0-8 0.8 (1.7) 0-4 C 73 pre glue 4.3 (3.0) 0-8 5.8 (3.4) 0-8 D 69 post glue 1.6 (2.1) 0-5 2.3 (3.1) 0-7
AFS A 37 pre glue 6.1 (2.7) 0-8 7.5 (1.1) 5-8 B 40 post glue 3.0 (2.5) 0-8 6.5 (2.5) 0-8 C 73 pre glue 7.6 (1.0) 5-8 7.7 (0.7) 6-8 D 69 post glue 4.4 (2.8) 0-8 5.9 (3.0) 0-8
Azole slash pine Innisfail E 35-40 pre glue 2.6 (3.5) 0-8 4.5 (3.5) 0-8
F 43 post glue 0.1 (0.3) 0-8 1.1 (2.6) 0-8 G 56 pre glue 3.1 (3.7) 0-8 1.4 (2.8) 0-8 H 82 post glue 5.0 (3.2) 2-8 1.0 (2.5) 0-8
AFS E 35-40 pre glue 3.2 (3.3) 0-8 5.2 (3.3) 0-8 F 43 post glue 2.3 (2.8) 0-7 5.0 (3.3) 0-8 G 56 pre glue 3.4 (3.7) 0-8 6.7 (2.8) 0-8 H 82 post glue 5.9 (2.6) 0-8 6.2 (3.3) 0-8
Untreated control slash pine AFS K 0 0.7 (1.3) 0-4 NT NT
NT = not tested

CLIENT REPORT No: EP112624
Page 23 of 55
0
1
2
3
4
5
6
7
8
RP 37 pre
RP 40 post
RP 73 pre
RP 69 post
SP 37 pre
SP 43 post
SP 56 pre
SP 82 post
Mea
n r
atin
g 1 y
1 y seal
2 y
2 y seal
3 y
3 y seal
Figure 22. Mean annual ratings for vertically exposed glulam at Innisfail, for unsealed or end sealed
test specimens. Pre = treated before gluing, post = treated after gluing, RP = radiata pine, SP = slash pine, X-axis numbers are l/m3.
0
1
2
3
4
5
6
7
8
RP 37 pre
RP 40 post
RP 73 pre
RP 69 post
SP 37 pre
SP 43 post
SP 56 pre
SP 82 post
Unt SP
Mea
n r
atin
g 1 y
1 y seal
2 y
2 y seal
3 y
3 y seal
Figure 23. Mean annual ratings for vertically exposed glulam in the AFS, for unsealed or end sealed
test specimens. Pre = treated before gluing, post = treated after gluing, Unt = untreated, RP = radiata pine, SP = slash pine, X-axis numbers are l/m3.
End sealing P. elliottii glulam docked after treatment with CuN or ZnN did not necessarily improve performance compared to those mentioned above where there was no end sealing (Table 4). Improvement by re-sealing was suggested in the AFS for glulam treated after gluing (43 l/m3) with a mean rating of 5.0 compared to 2.3 without sealing. Similarly at Innisfail, glulam treated before gluing (35-40 l/m3) and sealed had a mean rating of 4.5 compared to 2.6 for unsealed specimens. However also at Innisfail, P. elliottii treated after gluing (82 l/m3) only had a mean rating of 1.0 when sealed compared to 5.0 when left unsealed. For P. elliottii, there were eight paired comparisons of sealed and unsealed specimens exposed in the AFS or at Innisfail. The mean decay rating for sealed specimens

CLIENT REPORT No: EP112624
Page 24 of 55
was higher than unsealed specimens in six of these comparisons, suggesting it was beneficial to apply preservative sealant. For vertically exposed azole-treated P. radiata, trends similar to P. elliottii generally occurred (Table 4). P. radiata treated after gluing to 40 l/m3 with unprotected ends had a mean rating of 1.5 at Innisfail and 3.0 in the AFS, compared to treatment before gluing with 37 l/m3 where the mean rating was 2.9 at Innisfail and 6.1 in the AFS. At the higher treatment levels, P. radiata treated after gluing to 69 l/m3 with unprotected ends had a mean rating of 1.6 at Innisfail and 4.4 in the AFS, compared to treatment before gluing with 73 l/m3 where the mean rating was 4.3 at Innisfail and 7.6 in the AFS. Again, end sealing P. radiata glulam docked after treatment with CuN or ZnN did not necessarily improve performance compared to those mentioned above where there was no end sealing (Table 4). Some improvement by re-sealing was suggested in the AFS for glulam treated after gluing (40 l/m3) with a mean rating of 6.5 compared to 3.0 without sealing. Similarly in the AFS, glulam treated after gluing (69 l/m3) and sealed had a mean rating of 5.9 compared to 4.4 for unsealed specimens. However at Innisfail, P. radiata treated after gluing (40 l/m3) only had a mean rating of 0.8 when sealed compared to 1.5 when left unsealed. For P. radiata, there were eight paired comparisons of sealed and unsealed specimens exposed in the AFS or at Innisfail. The mean decay rating for sealed specimens was higher than unsealed specimens in seven of these comparisons, again suggesting that it was beneficial to apply preservative sealant. The ratings given to specimens do not take into account the number of individual laminates with decay. A specimen with 32 mm of decay in one laminate has the same rating as another specimen with 32 mm of decay in every laminate. Another way to look at the results for vertical exposure is to total the depth of decay in the top and bottom ends of every laminate (add all depths of laminate decay at either end). This approach provides a greater contrast of results (Table 5, Figures 24-25), especially for the top end of specimens exposed at Innisfail. For P. radiata specimens at Innisfail, the mean depth of totalled laminate decay in the top end was 12 mm or less if treated before gluing, and 61 to 234 mm if treated after gluing (Table 5). There was less contrast at the bottom end of specimens where the untreated P. radiata ‘feeder’ board encouraged more overwhelming fungal inoculation of any treatment. There was also less contrast between the ends of specimens exposed in the AFS as specimens were stacked one upon the other in rows. For P. elliottii at Innisfail a similar contrast was found for the 35 to 43 l/m3 treatments, with 5-7 mm depths of decay if treated before gluing and 69-102 mm decay if treated after gluing (Table 5). This contrast was less or reversed for P. elliottii at the higher treatment levels, perhaps due to the greater difference in uptakes (56 vs 82 l/m3). Therefore, unsealed specimens treated before gluing had 50 mm mean totalled depth of decay in laminates at the top end compared to 6 mm when treated after gluing, while the depths for sealed specimens were more similar at 42 and 24 mm respectively.

CLIENT REPORT No: EP112624
Page 25 of 55
Table 5: Mean depth of decay in top or bottom ends summed from all laminates for specimens
exposed vertically for 3.1 or 3.2 years, with cut ends unprotected or protected by LOSP spray or brush. Mean of 10 replicates.
Test site
Treatment code
Mean retn l/m3, treatment stage
Unprotected ends LOSP sealed ends Top end
mm Bottom end mm
Top end mm
Bottom end mm
Azole radiata pine Innisfail A 37 pre glue 12 33 6 21
B 40 post glue 130 88 234 196 C 73 pre glue 4 34 2 29 D 69 post glue 61 81 79 97
AFS A 37 pre glue 4 10 0 2 B 40 post glue 26 28 1 15 C 73 pre glue 2 1 0 1 D 69 post glue 21 14 11 16
Azole slash pine Innisfail E 35-40 pre glue 5 82 7 71
F 43 post glue 69 183 102 133 G 56 pre glue 50 128 42 149 H 82 post glue 6 61 24 158
AFS E 35-40 pre glue 20 44 14 20 F 43 post glue 51 34 29 24 G 56 pre glue 40 44 8 9 H 82 post glue 7 11 6 9
0
50
100
150
200
250
RP 37 pre
RP 40 post
RP 73 pre
RP 69 post
SP 37 pre
SP 43 post
SP 56 pre
SP 82 post
Mea
n d
ecay
dep
th m
m
top
btm
seal top
seal btm
Figure 24. Mean depth of decay (mm) in either end summed from all laminates for vertically exposed
glulam at Innisfail, for unsealed or end sealed test specimens. Pre = treated before gluing, post = treated after gluing, RP = radiata pine, SP = slash pine, X-axis numbers are l/m3.

CLIENT REPORT No: EP112624
Page 26 of 55
0
10
20
30
40
50
60
RP 37 pre
RP 40 post
RP 73 pre
RP 69 post
SP 37 pre
SP 43 post
SP 56 pre
SP 82 post
Mea
n d
ecay
dep
th m
m
top
btm
seal top
seal btm
Figure 25. Mean depth of decay (mm) in either end summed from all laminates for vertically exposed
glulam in the AFS, for unsealed or end sealed test specimens. Pre = treated before gluing, post = treated after gluing, RP = radiata pine, SP = slash pine, X-axis numbers are l/m3.
There was no clear trend to show whether the CuN or ZnN used was better for sealing the ends of glulam (Tables 6 and 7). At Innisfail, there were eight paired comparisons of CuN and ZnN sealed specimens in either timber. The mean decay rating for CuN sealed specimens was higher or equal to ZnN sealed specimens in four of these comparisons, suggesting the sealants had similar activity. In the AFS, there were eight paired comparisons of CuN and ZnN sealed specimens in either timber. The mean decay rating for CuN sealed specimens was higher than ZnN sealed specimens in five of these comparisons, again suggesting that the sealants had similar activity. Table 6: Mean (sd) ratings for specimens exposed vertically for 3.2 years at Innisfail, with cut ends
protected by LOSP spray/brush (CuN or ZnN). Mean (sd) of 10 replicates, or 5 replicates when separated into CuN or ZnN resealing. 8 = sound, 0 = destroyed.
Treat. code
Mean retn l/m3, treatment
stage
LOSP sealed ends CuN sealed ends* ZnN sealed ends* Mean
rating (sd) Rating range
Mean rating (sd)
Rating range
Mean rating (sd)
Rating range
Azole radiata pine A 37 pre glue 5.0 (3.2) 0-8 4.2 (4.0) 0-8 5.8 (2.3) 3-8 B 40 post glue 0.8 (1.7) 0-4 0.8 (1.8) 0-4 0.8 (1.8) 0-4 C 73 pre glue 5.8 (3.4) 0-8 5.4 (3.7) 0-8 6.2 (3.5) 0-8 D 69 post glue 2.3 (3.1) 0-7 1.8 (3.0) 0-7 2.8 (3.4) 0-7
Azole slash pine E 35-40 pre glue 4.5 (3.5) 0-8 7.4 (1.3) 5-8 1.6 (2.3) 0-5 F 43 post glue 1.1 (2.6) 0-8 1.6 (3.6) 0-8 0.6 (1.3) 0-3 G 56 pre glue 1.4 (2.8) 0-8 2.6 (3.7) 0-8 0.2 (0.4) 0-1 H 82 post glue 1.0 (2.5) 0-8 0.4 (0.9) 0-2 1.6 (3.6) 0-8 *Mean of 5 replicates

CLIENT REPORT No: EP112624
Page 27 of 55
Table 7. Mean (sd) ratings for specimens exposed vertically for 3.1 years in the AFS at Clayton, with cut ends protected by LOSP spray/brush (CuN or ZnN). Mean (sd) of 10 replicates, or 5 replicates when separated into CuN or ZnN resealing. 8 = sound, 0 = destroyed.
Treat. code
Mean retn l/m3, treatment
stage
LOSP sealed ends CuN sealed ends* ZnN sealed ends* Mean
rating (sd) Rating range
Mean rating (sd)
Rating range
Mean rating (sd)
Rating range
Azole radiata pine A 37 pre glue 7.5 (1.1) 5-8 7.4 (1.3) 5-8 7.6 (0.9) 6-8 B 40 post glue 6.5 (2.5) 0-8 7.0 (1.2) 5-8 6.0 (3.4) 0-8 C 73 pre glue 7.7 (0.7) 6-8 7.4 (0.9) 6-8 8.0 (0.0) 8 D 69 post glue 5.9 (3.0) 0-8 7.2 (0.8) 6-8 4.6 (3.8) 0-8
Azole slash pine E 35-40 pre glue 5.2 (3.3) 0-8 6.8 (1.8) 4-8 3.6 (3.8) 0-8 F 43 post glue 5.0 (3.3) 0-8 5.4 (2.5) 3-8 4.6 (4.2) 0-8 G 56 pre glue 6.7 (2.8) 0-8 7.0 (2.2) 3-8 6.4 (3.6) 0-8 H 82 post glue 6.2 (3.3) 0-8 6.0 (3.5) 0-8 6.4 (3.6) 0-8 *Mean of 5 replicates
CONCLUSIONS The following conclusions for glulam can be made: 1. The spot test and image analysis technique used to assess TBTN penetration in glulam
gave useful results, and there was a mean cross-sectional penetration of 67%. However, the addition of zinc tracer to azole LOSP at the concentrations described aided little in determining the penetration of LOSP, as there was insufficient colour reaction. The maximum penetration detected for azole LOSP was 15%, obviously much less than was achieved.
2. Untreated P. radiata and P. elliottii at Innisfail were unserviceable at the second year of exposure (mean rating less than 3.0), while similar specimens in the AFS were still ‘serviceable’ (mean rating greater than 3.0) after three years. The decay rate at Innisfail was approximately 3 times faster than in the AFS.
3. Untreated P. elliottii was slightly more perishable than untreated P. radiata. 4. Decay was much more rapid in vertically exposed than horizontally exposed
specimens, suggesting that glulam posts need special attention to prevent water penetration (such as with metal caps).
5. The use of end grain sealants based on ZnN or CuN gave improved decay resistance, but on their own were insufficient for post end protection (should be used in conjunction with a post cap).
6. There was little difference between the protection offered by ZnN and CuN, even though CuN is usually considered to be the more effective preservative.
7. For vertically exposed specimens, there were 4 paired comparisons where glulam was treated before or after gluing. The P. radiata comparisons at 37 with 40 l/m3 and 73 with 69 l/m3, and the P. elliottii comparison at 35-40 with 43 l/m3, all gave similar results where glulam treated before gluing performed better than when treated after gluing. This trend occurred in the field at Innisfail and in the AFS, and whether exposed sealed or unsealed. Nevertheless, glulam treated before gluing also often had

CLIENT REPORT No: EP112624
Page 28 of 55
significant levels of decay, suggesting that the protection of post ends is still important even for these treated timbers.
8. The exception to the previous point was P. elliottii treated to the higher pair of retentions. Unsealed specimens at Innisfail and in the AFS performed slightly better when treated after gluing than before gluing. This was the comparison with greatest difference in treatment uptakes (56 l/m3 before gluing, 82 l/m3 after gluing), suggesting that the result may be partly due to the additional 26 l/m3 in the glulam that was treated after gluing. When these glulams were given additional end-grain protection with CuN or ZnN sealants, the performance result was virtually the same whether azole treated before or after gluing.
9. There was generally less decay in horizontally exposed glulam so that fewer definitive comparisons can be made between the various treatments. In the AFS, mean ratings for treated glulam ranged from 7.6 to 8.0, so that no contrasts between treatments were evident at this stage.
10. For P. radiata at Innisfail, horizontally exposed glulam treated before gluing (37 l/m3) had slightly less decay than glulam treated after gluing (40 l/m3), with mean ratings of 7.8 and 6.7 respectively. There was insufficient decay at the higher retentions (73 with 69 l/m3 comparison) for conclusions to be drawn.
11. For P. elliottii at Innisfail, horizontally exposed glulam treated before gluing (35-40 l/m3) was performing similarly to glulam treated after gluing (43 l/m3), with mean ratings of 7.0 and 7.3 respectively. At the higher retentions (56 with 82 l/m3), glulam treated after gluing was performing better than glulam treated before gluing, with mean ratings of 7.8 and 5.9 respectively. Again, this result may be due partly to the higher retention achieved in glulam treated after gluing. There may also be some influence from the fact that glulam treated before gluing is dressed after treatment, which would remove some of the treated envelope and perhaps expose some unpenetrated or poorly treated heartwood.
12. At this stage at Innisfail there was little difference in performance between horizontally exposed glulam treated with CCA (mean rating 7.8), TBTN (mean rating 7.6) and many of the azole treatments including P. radiata treated before gluing with 37 l/m3 (mean rating 7.8), 73 l/m3 (mean rating 8.0), after gluing with 69 l/m3 (mean rating 7.6) and P. elliottii treated after gluing with 82 l/m3 (mean rating 7.8).
The results suggest that treating glulam before gluing will generally give better performance than treatment after gluing. The sometimes disappointing results for ‘posts’ on the effectiveness of resealing with CuN or ZnN after docking in this trial suggests that a better approach would be to include barriers (caps) as well, or to use designs where the end is not exposed to rain or can drain away readily. While decay is occurring quickly in ‘posts’ made from even some of the ‘best’ glulam treatments, it should be remembered that this test was designed for accelerated results. The detailing of glulam for real-life exposure is obviously important when promoting its service life7. A number of treatments for horizontally exposed beams are performing well.
ACKNOWLEDGEMENTS
I would like to thank Forest and Wood Products Australia, and the Glued Laminated Timber Association of Australia, for supporting this research. I also appreciate the help provided by Grahame Henderson of Corbek Timber Preservation and Steve Koch of Arch 7 Bolden, S and Greaves, H (2008). Guide to the specification, installation and use of preservative treated engineered wood products. Forest and Wood Products Australia Project No. PR08.1062, 38 pp.
CLIENT REPORT No: EP112624
Page 29 of 55
Wood Protection for their guidance during the glulam treatments at Corbek. Greg Jensen of Arch Wood Protection provided advice on glulam treatments. Claudia Eiden of Hyne & Son Pty Ltd gave extensive help in organizing the timber samples for treatment and delivery. Jenny Carr assisted with test specimen preparation at CSIRO, and Kevin McCarthy helped with earlier Innisfail inspections. John Ward and Karen Hands of CSIRO developed the image digital analysis technique.
MATERIALS AND METHODS
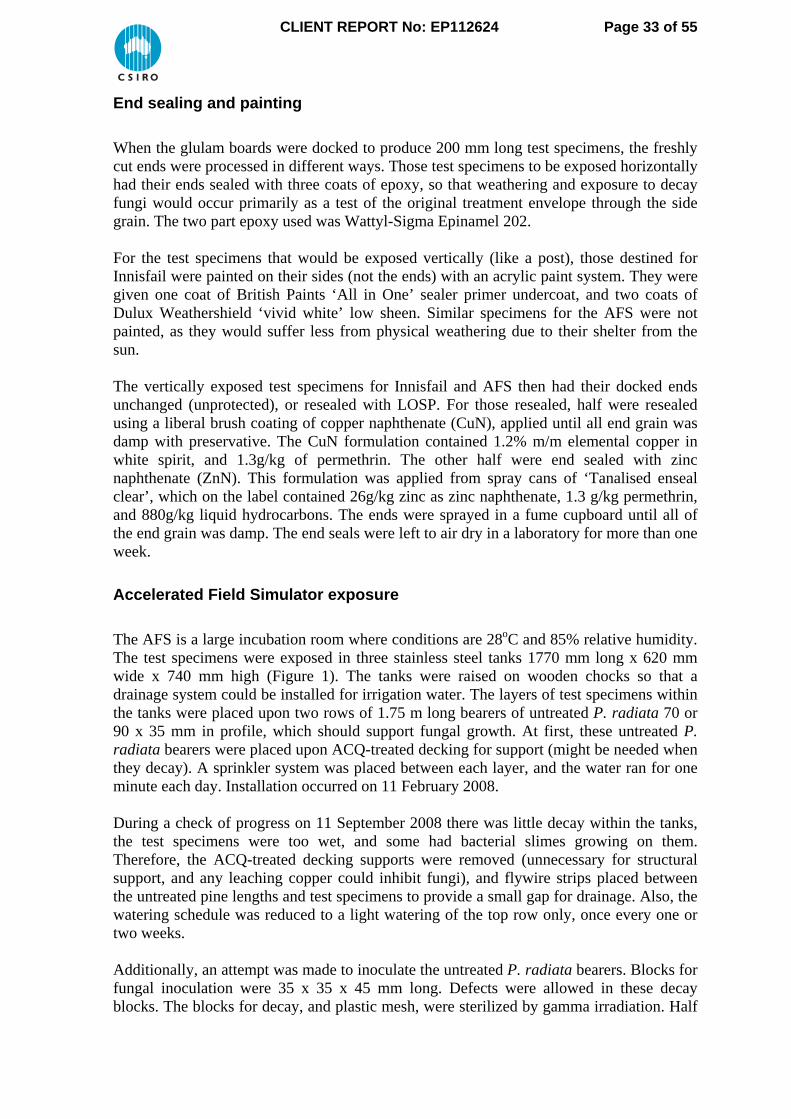
Timber treatment
Both Pinus radiata (originally sourced from South Australia) and Pinus elliottii were obtained from Hyne & Son Pty Ltd. The P. radiata used for treatment with low retention azole LOSP before gluing was from Warrnambool Timber Industries Pty Ltd. Laminates treated before gluing were generally 70 x 30 mm profile, while manufactured glulam beams (after dressing) were 260 x 65 mm in profile. Vacsol Azure was supplied by Arch Wood Protection and was used as the azole LOSP formulation. It contains 4.5 g/L propiconazole, 4.5 g/L tebuconazole and 3.2 g/L permethrin. As azoles are non metallic preservatives, a small amount of zinc octotate was added to act as a tracer so that a spot test could be used for the treatment. The 20 L pails of zinc octoate contain 12% m/v zinc, and it is recommended that 20L be added per 10000L of LOSP (or 20 ml per 10 L). For the CSIRO azole treatment, 30 ml of zinc octoate was used per 10 L of formulation (50% higher than recommended). Proprietary treatment schedules were used at the commercial treatment plants. The loose P. radiata laminates 1800 x 70 x 35 mm for treatment at CSIRO were treated by 1 min vacuum at -30 kPa, 10 mins to introduce the treating solution while under this vacuum, vacuum release and hold for 90 seconds. The LOSP was then drained from the treatment tray, and a final vacuum applied of -95 kPa for 10 mins. Eight laminates were needed to make each beam, and ten beams were required. The laminates were glued at Warrnambool Timber Industries using resorcinol glue. The schedule used for the TBTN treatment of P. elliottii glulam beams 1200 x 260 x 65 mm (treatment after gluing) was -25 kPa vacuum for 5 mins, 80kPa for 2.5 mins, drain LOSP from treatment tray and apply a final vacuum of -95 kPa for 20 mins. An H3 CCA oxide treatment of P. radiata 200 long x 260 x 65 mm (treatment after gluing) was also conducted. A water treatment was first used on non-preservative treated specimens to allow calculation of the CCA solution concentration required. The treatment schedule used was 30 minutes at -95 kPa, introduce water, 710 kPa pressure for 60 mins, release pressure and leave the test specimens to soak for 15 mins. The test specimens were removed from the treatment solution, surface blotted and weighed to determine solution uptake. Similar glulam specimens were treated with Tanalith O using this schedule to a mean retention of 0.38% m/m TAE. For the non-preservative containing P. radiata, there were 10 test specimens treated with water (described above), and another 10 that were untreated. Half of each (5 water-treated and 5 untreated) were exposed at each test site, and those ‘L’ specimens that had been

CLIENT REPORT No: EP112624
Page 30 of 55
water treated are marked with a ‘W’ in the appendices. All P. elliottii non-preservative treated controls were untreated (i.e. none were water treated). The treatments produced for the trial are shown in Table 1.
Selection of test specimens
The test specimens, and wafers for spot testing, were removed from the beams and given code numbers (e.g. AD6). The first letter of each code represents the timber species, nominal retentions per cubic metre, respective treaters, and the beam length when treated according to the following: A = 35L azole, pre gluing treatment radiata (CSIRO treated), 10 x 1.8 m beams. B = 35L azole, post gluing treatment radiata (Corbek treated), 5 x 3.6 m beams. C = 70L azole, pre gluing treatment radiata (Corbek treated), 5 x 3.6 m beams. D = 70L azole, post gluing treatment radiata (Corbek treated), 5 x 3.6 m beams. E = 35L azole, pre gluing treatment slash (Timbertec treated), 5 x 3.0 m beams. F = 35L azole, post gluing treatment slash (Corbek treated), 5 x 3.0 m beams. G = 70L azole, pre gluing treatment slash (Corbek treated), 5 x 3.6 m beams. H = 70L azole, post gluing treatment slash (Corbek treated), 5 x 3.0 m beams. J = 35L of 0.16% tin post gluing treatment slash (CSIRO treated), 6 x 1.2 m beams. K = Untreated slash pine. L = Untreated radiata pine. N = H3 CCA, post gluing treatment radiata (CSIRO treated), 10 x 0.2 m lengths. The second letter in the code represents the board number. The 3 and 3.6 m azole treated beams were cut in half to produce the boards. The halves were given the second letter pairs of A and B, or C and D, or E and F etc. The third number in the code indicates the positions from which test specimens or wafers were cut from the 1.8, 1.5 or 1.2 m boards according to Figure 26. Blocks 1 were discarded and were cut at least 20 mm from an original treatment end. 1.8 m boards, treatment or first letter codes = A, B, C, D or G 1 2 3 4 5 6 7 8 9 10 11 12 13 1.5 m boards, treatment or first letter codes = E, F or H 1 2 3 4 5 6 7 8 9 10 11 12 1.2 m boards, treatment or first letter code = J 1 2 3 4 5 6 7 8 9
Figure 26. Cutting plan for treated glulam boards. Blocks 1 were at least 20 mm long and discarded. Other unshaded blocks were the 200 mm long test specimens for exposure. Shaded blocks were the 50 mm wafers for spot testing.
A further coding used to aid test specimen sorting is given in Table 8, where the first letter stands for Innisfail (I) or AFS (A) and the second letter is for flat or horizontal exposed (F), vertical and end grain resealed (S) or vertical and end grain not resealed but unprotected (N). Use of this code can be found in the Appendices.

CLIENT REPORT No: EP112624
Page 31 of 55
Table 8: Test specimen exposure codes.
Exp. Code Site Alignment Paint sides Ends IF Innisfail flat no Epoxy IS Innisfail vertical yes LOSP CuN or ZnN* IN Innisfail vertical yes No protection AF AFS flat no Epoxy AS AFS vertical no LOSP CuN or ZnN* AN AFS vertical no No protection *ISC and ASC = CuN reseal, ISZ and ASZ = ZnN reseal
Preservative penetration
A PAN indicator, described in ASTM A3-058, was used as a spot test for the zinc tracer in azoles, and tin in the TBTN-treated wood. Before spraying, the wafer surface to be sprayed was docked to give a fresh clean face. The PAN indicator was sprayed on the surface, and a photograph taken within minutes of indicator application. To quantify preservative penetration, the digital photographs of the central pieces of each board were analysed using Soft Imaging Systems (SIS) image analysis software (analySIS). As an example, the image of the wafer JE5 (Figure 27) was processed. The intensity of the red, green and blue components of the full colour image were separated (Figures 28-30). The red image was then subtracted from the green image (Figure 31). The red minus green image was then ‘thresholded’ to highlight regions of stain on the wood sample (aided by comparing back to the original image in Fig. 27). The red pixels in Figure 32 were then counted by the software and a percentage area (relating to penetration) was provided. It would also be possible to analyse individual laminates for penetration using this method.
Figure 27. Original image of JE5 after spot testing with PAN indicator.
8 AWPA (2005). Standard methods for determining penetration of preservatives and fire retardants. American Wood-Preservers’ Association Standard A3-05, Method 14, Method for determining penetration of copper-containing preservatives.

CLIENT REPORT No: EP112624
Page 32 of 55
Figure 28. Intensity of red signals for JE5.
Figure 29. Intensity of green signals for JE5.
Figure 30. Intensity of blue signals for JE5.
Figure 31. The intensity of the red image was subtracted from the green image.
Figure 32. The red minus green image (from Fig. 23) was ‘thresholded’ to highlight regions of stain on the wood sample.
CLIENT REPORT No: EP112624
Page 33 of 55
End sealing and painting
When the glulam boards were docked to produce 200 mm long test specimens, the freshly cut ends were processed in different ways. Those test specimens to be exposed horizontally had their ends sealed with three coats of epoxy, so that weathering and exposure to decay fungi would occur primarily as a test of the original treatment envelope through the side grain. The two part epoxy used was Wattyl-Sigma Epinamel 202. For the test specimens that would be exposed vertically (like a post), those destined for Innisfail were painted on their sides (not the ends) with an acrylic paint system. They were given one coat of British Paints ‘All in One’ sealer primer undercoat, and two coats of Dulux Weathershield ‘vivid white’ low sheen. Similar specimens for the AFS were not painted, as they would suffer less from physical weathering due to their shelter from the sun. The vertically exposed test specimens for Innisfail and AFS then had their docked ends unchanged (unprotected), or resealed with LOSP. For those resealed, half were resealed using a liberal brush coating of copper naphthenate (CuN), applied until all end grain was damp with preservative. The CuN formulation contained 1.2% m/m elemental copper in white spirit, and 1.3g/kg of permethrin. The other half were end sealed with zinc naphthenate (ZnN). This formulation was applied from spray cans of ‘Tanalised enseal clear’, which on the label contained 26g/kg zinc as zinc naphthenate, 1.3 g/kg permethrin, and 880g/kg liquid hydrocarbons. The ends were sprayed in a fume cupboard until all of the end grain was damp. The end seals were left to air dry in a laboratory for more than one week.
Accelerated Field Simulator exposure
The AFS is a large incubation room where conditions are 28oC and 85% relative humidity. The test specimens were exposed in three stainless steel tanks 1770 mm long x 620 mm wide x 740 mm high (Figure 1). The tanks were raised on wooden chocks so that a drainage system could be installed for irrigation water. The layers of test specimens within the tanks were placed upon two rows of 1.75 m long bearers of untreated P. radiata 70 or 90 x 35 mm in profile, which should support fungal growth. At first, these untreated P. radiata bearers were placed upon ACQ-treated decking for support (might be needed when they decay). A sprinkler system was placed between each layer, and the water ran for one minute each day. Installation occurred on 11 February 2008. During a check of progress on 11 September 2008 there was little decay within the tanks, the test specimens were too wet, and some had bacterial slimes growing on them. Therefore, the ACQ-treated decking supports were removed (unnecessary for structural support, and any leaching copper could inhibit fungi), and flywire strips placed between the untreated pine lengths and test specimens to provide a small gap for drainage. Also, the watering schedule was reduced to a light watering of the top row only, once every one or two weeks. Additionally, an attempt was made to inoculate the untreated P. radiata bearers. Blocks for fungal inoculation were 35 x 35 x 45 mm long. Defects were allowed in these decay blocks. The blocks for decay, and plastic mesh, were sterilized by gamma irradiation. Half

CLIENT REPORT No: EP112624
Page 34 of 55
of the blocks were grown with the brown-rotting fungus Gloeophyllum abietinum (DFP 13851) and the other half with the brown-rotting fungus Coniophora olivacea (DFP 1779). Fungi were grown in stainless steel trays 370 x 225 x 95 mm high. A solution containing 1.2L of 2% agar and 1% malt extract was poured into each tray, covered with aluminium foil and autoclaved for 30 minutes. The trays were then placed in a sterile air bench to cool overnight. Each tray was inoculated with about 15 plugs of the appropriate fungus, and incubated at 25oC. After the fungi had grown sufficiently, a plastic mesh was placed upon the fungal mat. Sterilised blocks were placed end grain down upon the mesh and close packed within the trays. Pre-inoculated blocks were removed after 5 weeks. To inoculate the test specimens, blocks were split in half if needed for the spacing available, and placed upon the flywire mats between test specimens on both untreated pine bearers. The height of the rows of test specimens in the AFS was altered after each annual inspection, so that the top row became the bottom row.
Innisfail exposure
Test specimens were installed at Innisfail on 13 February 2008. The test specimens were placed upon two rows of untreated P. radiata 70 x 20 mm x frame length, which should become a source of fungal inoculum. The untreated P. radiata strips were nailed onto CCA-treated P. radiata bearers 70 x 35 mm x frame length (up to 2.4 m) (Figure 33). The test specimens were further secured with cloths line wire (Figure 31).
Figure 33. A test frame newly installed at Innisfail. Test specimens rest upon untreated pine strips
(hidden) which were nailed upon 70 x 35 mm CCA-treated pine bearers (visible at one end of frame).

CLIENT REPORT No: EP112624
Page 35 of 55
Glulam inspection
For the three year inspection, the test specimens in the AFS were inspected on 11-16 March 2011, while those at Innisfail were inspected on 11-13 April 2011. The test specimens were inspected by probing the exposed wood surfaces with a knife to detect decay. The depth of decay was noted, and test specimens given a performance rating of 8-0 based on the amount of cross-section lost9 (Table 9). A specimen rating 3 is considered to be unserviceable.
Table 9: Rating scale used to assess glulam test specimens in an above-ground exposure trial. Glulam with 260 x 65 mm profile.
Rating Decay in broad flat surfaces Depth of end grain decay,
mm. (add top and bottom ends)
Description of decay
Cross-section lost Depth of decay or weathering from one surface, mm
8 No loss, sound 0 0 No decay 7 Up to 15% 0-8 0-5 Light decay 6 15–30% 8-16 5-10 Light-moderate decay 5 30–45% 16-25 10-15 Moderate decay 4 45–60% 25-35 15-20 Moderate-heavy decay 3 60–75% 35-45 20-25 Heavy decay 2 75–90% 45-57 25-30 Severe decay 1 90–99% 57-64 30-35 Severe-destroyed 0 100% 65 35+ Destroyed
9 Thornton, J.D., Johnson, G.C. and Nguyen, N-K. (1991). An in-ground natural durability field test of Australian timbers and exotic reference species. VI. Results after approximately 21 years exposure. Material und Organismen 26 (2): 145-155.

CLIENT REPORT No: EP112624
Page 36 of 55
APPENDIX 1. Assessment of glulam after 3.2 years at Innisfail. Horizontally exposed Boa-rd No.
Blo -ck No. Code
Fra-me Row
Depth of decay, mm Full length splits*
Rating
Top face Bottom face
AA 2 IF 2 5 0 0 1T 8
AB 2 IF 3 1 0 0 4T 8
AC 6 IF 5 2 0 0 2T 8
AD 2 IF 5 4 0 0 2T1B 8
AE 6 IF 4 2 0 16,6 BR 2T 6
AF 6 IF 3 3 0 0 4T 8
AG 2 IF 4 1 0 0 3T 8
AH 10 IF 3 4 0 0 3T 8
AJ 2 IF 2 8 0 0 2T 8
AK 10 IF 4 4 0 0 2T 8
Mean 7.8
BA 2 IF 4 4 0 0 5T 8
BB 10 IF 5 4 5 BR 27 BR under FB 3T1B 4
BC 2 IF 2 8 0 0 4T2B 8
BD 10 IF 4 1 0 0 4T 8
BE 6 IF 4 3 0 21 end laminate, 3 BR 4T2B 5
BF 2 IF 2 5 0 0 7T2B 8
BG 12 IF 5 1 0 0 5T 8
BH 10 IF 3 2 0 0 5T 8
BJ 2 IF 3 4 0 47 mm BR 1L (pocket) 5T3B 2
BK 2 IF 3 1 0 0 7T 8
Mean 6.7
CA 2 IF 3 4 0 0 6T2B 8
CB 6 IF 4 4 0 0 4T1B 8
CC 10 IF 3 2 0 0 4T 8
CD 12 IF 2 7 0 0 2T 8
CE 2 IF 4 1 0 0 4T1B 8
CF 10 IF 5 3 0 0 5T1B 8
CG 2 IF 3 3 0 0 5T1B 8
CH 2 IF 3 2 0 0 6T 8
CJ 6 IF 4 3 0 0 7T 8
CK 2 IF 5 2 0 0 4T1B 8
Mean 8.0 *T = number of full length splits on top surface, B = number of splits on bottom surface. Depth of decay notes: BR = brown rot. FB = number of fruiting bodies present. E.g. 65,19,18x2,12,6 BR shows depths of brown rot in 6 laminates. 10 BR shows 10 mm brown rot in only one laminate.

CLIENT REPORT No: EP112624
Page 37 of 55
Horizontally exposed at Innisfail Boa-rd No.
Blo -ck No. Code
Fra-me Row
Depth of decay, mm Full length splits*
Rating
Top face Bottom face
DA 8 IF 2 7 0 0 1T 8
DB 2 IF 5 1 0 0 3T1B 8
DC 2 IF 4 1 0 0 6T2B 8
DD 8 IF 3 4 0 0 8T1B 8
DE 2 IF 5 3 0 28,27,12 BR 7T3B 4
DF 6 IF 3 3 0 0 7T1B 8
DG 4 IF 3 1 0 0 6T 8
DH 2 IF 3 3 0 0 7T2B 8
DJ 6 IF 3 1 0 0 3T 8
DK 2 IF 4 2 0 0 6T1B 8
Mean 7.6
EA 2 IF 3 2 0 9 BR 7T2B 6
EB 11 IF 3 3 0 0 6T1B 8
EC 8 IF 4 4 0 1 BR 7T 7
ED 2 IF 5 1 0 13,9,6,3 BR 5T 6
EE 4 IF 5 3 0 0 6T1B 8
EF 2 IF 4 3 0 0 6T 8
EG 2 IF 2 6 0 6,5 BR 4T 7
EH 6 IF 2 7 0 0 5T 8
EJ 2 IF 3 4 0 4,2 BR 6T 7
EK 6 IF 4 2 0 22,12,5,2 BR 5T1B 5
Mean 7.0
FA 2 IF 5 2 0 0 7T1B 8
FB 10 IF 4 3 0, FB on side 0 7T1B 8
FC 10 IF 3 2 0 0 8T1B 8
FD 2 IF 3 3 0 0 7T1B 8
FE 8 IF 4 2 0 3,1 BR 7T1B 7
FF 2 IF 3 1 0 42,23 BR 6T1B 3
FG 10 IF 2 5 0 2 BR 5T 7
FH 2 IF 3 4 0 0 3T 8
FJ 4 IF 2 6 0 0 6T 8
FK 2 IF 5 4 0 0 7T 8
Mean 7.3 *T = number of full length splits on top surface, B = number of splits on bottom surface. Depth of decay notes: BR = brown rot. FB = number of fruiting bodies present. E.g. 65,19,18x2,12,6 BR shows depths of brown rot in 6 laminates. 10 BR shows 10 mm brown rot in only one laminate.

CLIENT REPORT No: EP112624
Page 38 of 55
Horizontally exposed at Innisfail Boa-rd No.
Blo -ck No. Code
Fra-me Row
Depth of decay, mm Full length splits*
Rating
Top face Bottom face
GA 4 IF 3 1 0 1 BR 7T1B 7
GB 8 IF 4 2 0 7 BR 8T1B 7
GC 2 IF 3 1 0 32,32,5 BR 5T1B 4
GD 2 IF 5 4 0 0 5T3B 8
GE 6 IF 3 3 0 0 5T1B 8
GF 2 IF 3 4 0 15,3 BR 8T1B 6
GG 2 IF 2 5 0 0 7T1B 8
GH 8 IF 4 1 0 0 7T1B 8
GJ 10 IF 2 8 0 59,34,28 BR 3T 0
GK 2 IF 5 2 0 38 end laminate, 4 BR 7T2B 3
Mean 5.9
HA 10 IF 3 3 0 0 6T2B 8
HB 2 IF 2 6 0 10,7 BR 6T 6
HC 4 IF 4 4 0 0 6T1B 8
HD 2 IF 3 4 0 0 5T 8
HE 2 IF 4 3 0 0 7T 8
HF 6 IF 5 1 0 0 6T 8
HG 2 IF 5 3 0 0 5T2B 8
HH 4 IF 3 2 0 0 6T1B 8
HJ 11 IF 4 2 0 0 7T2B 8
HK 2 IF 3 2 0 0 5T2B 8
Mean 7.8
JB 4 IF 3 1 0 4 BR, 1 FB 7T1B 7
JB 8 IF 3 4 0 2 BR 8T 7
JC 6 IF 3 2 0 0 7T1B 8
JC 2 IF 4 4 0 0 7T2B 8
JD 6 IF 2 6 0 0 7T 8
JD 2 IF 4 3 0 0 6T 8
JE 2 IF 2 7 0 6,4 BR 5T2B 7
JE 6 IF 5 1 5 BR 2 BR 5T1B 7
JF 8 IF 4 1 0 0 7T1B 8
JF 4 IF 5 4 0 0 7T1B 8
Mean 7.6 *T = number of full length splits on top surface, B = number of splits on bottom surface. Depth of decay notes: BR = brown rot. FB = number of fruiting bodies present. E.g. 65,19,18x2,12,6 BR shows depths of brown rot in 6 laminates. 10 BR shows 10 mm brown rot in only one laminate.

CLIENT REPORT No: EP112624
Page 39 of 55
Horizontally exposed at Innisfail Boa-rd No.
Blo -ck No. Code
Fra-me Row
Depth of decay, mm Full length splits*
Rating
Top face Bottom face
KA 3 IF 2 6 All BR All BR 5T 0
KA 4 IF 5 4 Missing Failed to BR 5T2B 0
KB 4 IF 2 8 Missing Failed to BR 4T2B 0
KB 5 IF 3 1 Missing Failed to BR 4T2B 0
KB 1 IF 4 3 Missing Failed to BR 4T1B 0
KC 3 IF 3 4 Missing Failed to BR 5T 0
KC 2 IF 4 1 Missing Failed to BR 5T1B 0
KD 2 IF 3 2 All BR All BR 7T 0
KD 6 IF 4 4 All BR All BR 7T2B 0
KD 8 IF 5 1 65,19,18x2,12,6 BR 65,34,27,22x2,16,7,4 BR 8T2B 0
Mean 0.0
LA 4W IF 2 5 All BR All BR 5T2B 0
LA 9W IF 3 1 All BR All BR 6T2B 0
LA 5 IF 3 3 All BR All BR 7T2B 0
LA 2W IF 5 2 All BR All BR 6T2B 0
LA 8 IF 5 3 37,32 BR 57,42,38,37,34,29 BR 5T1B 0
LB 8W IF 2 7 Missing Failed to BR 6T1B 0
LB 10 IF 3 2 Missing Failed to BR 3T2B 0
LB 7 IF 3 3 All BR All BR 7T2B 0
LB 2 IF 4 2 All BR All BR 6T2B 0
LB 5W IF 4 2 All BR All BR 7T 0
W = water treated Mean 0.0
N 62 IF 2 8 0 0 4T 8
N 63 IF 3 1 0 0 6T2B 8
N 57 IF 3 2 0 0 5T1B 8
N 60 IF 3 3 0 0 7T1B 8
N 54 IF 3 4 0 0 5T2B 8
N 56 IF 4 1 0 0 7T2B 8
N 59 IF 4 3 0 0 6T1B 8
N 58 IF 4 4 0 0 6T2B 8
N 64 IF 5 2 0 0 5T2B 8
N 61 IF 5 3 10 BR 0 4T 6
Mean 7.8 *T = number of full length splits on top surface, B = number of splits on bottom surface. Depth of decay notes: BR = brown rot. FB = number of fruiting bodies present. E.g. 65,19,18x2,12,6 BR shows depths of brown rot in 6 laminates. 10 BR shows 10 mm brown rot in only one laminate.

CLIENT REPORT No: EP112624
Page 40 of 55
Vertically exposed at Innisfail, no end grain protection Boa-rd No.
Blo -ck No. Code
Fra-me Row
Depth of decay, mm Full length splits*
Rating
Top end Bottom end
AA 12 IN 1 2 6 BR 70+, 14 BR 0 0
AB 8 IN 2 2 17 BR 22 BR 1 0
AC 12 IN 2 1 0 12,8,7,5 BR 0 5
AD 10 IN 1 3 0 42end,17,5 BR 0 0
AE 12 IN 1 4 0 7 BR 0 6
AF 8 IN 1 2 0 26 BR end laminate 0 2
AG 8 IN 2 4 48 BR 22,18 BR 0 0
AH 6 IN 1 4 0 0 1 8
AJ 4 IN 2 3 47 BR 34,18,5 BR 0 0
AK 4 IN 1 1 0 0 0 8
Mean 2.9
BA 10 IN 1 2 70+ x 6, ends OK 70+x4, 35,20 BR 0 0
BB 6 IN 1 3 5 BR 33,13,5 BR 0 0
BC 12 IN 2 4 70+x4,45 BR 70+x4,37,25 BR 1 0
BD 4 IN 1 4 70+x4,26 BR 70+x2,16,5 BR 1 0
BE 4 IN 1 3 0 16,12,5 BR 2 4
BF 10 IN 1 2 0 28,25,15,15 BR 1 2
BG 8 IN 1 1 32 BR 0 0 1
BH 4 IN 1 1 0 0 0 8
BJ 12 IN 2 1 34,28,22,16 BR 32,22,14,12,6,2 BR 0 0
BK 6 IN 2 2 52,23,16,16 BR 51,37,19,15 BR 0 0
Mean 1.5
CA 10 IN 1 2 42 BR end lamin. 42,32,27,6 BR 0 0
CB 4 IN 1 1 0 0 0 8
CC 12 IN 1 3 0 18,12,5 BR 1 4
CD 4 IN 1 4 0 70+,28,5 BR 0 0
CE 8 IN 2 3 0 32,5 BR 1 1
CF 4 IN 2 1 0 8,4 BR 0 6
CG 8 IN 2 2 0 0 0 8
CH 8 IN 1 2 0 10 BR 0 6
CJ 12 IN 1 4 0 15 BR 0 5
CK 6 IN 1 3 0 13,3 BR 0 5
Mean 4.3 *Number of full length splits on either side of the vertical specimens. Depth of decay notes: BR = brown rot. FB = number of fruiting bodies present. E.g. 65,19,18x2,12,6 BR shows depths of brown rot in 6 laminates. 10 BR shows 10 mm brown rot in only one laminate. 70+ means that depth of decay was greater than 70 mm.

CLIENT REPORT No: EP112624
Page 41 of 55
Vertically exposed at Innisfail, no end grain protection Boa-rd No.
Blo -ck No. Code
Fra-me Row
Depth of decay, mm Full length splits*
Rating
Top end Bottom end
DA 6 IN 2 3 23,17,12,8,7 BR 7,4 BR 1 3
DB 6 IN 2 4 70+x4,27,16 BR 70+x3,32,18 BR 1 0
DC 6 IN 2 3 62,17 BR 37,8 BR 1 0
DD 12 IN 2 1 0 70+,24 BR 0 0
DE 4 IN 1 3 0 12,5 BR 2 5
DF 10 IN 1 3 43,24 BR 70+,47,5 BR 0 0
DG 8 IN 1 1 45,15,5 BR 70+, 17,12 BR 1 0
DH 10 IN 1 2 10 BR 70+ x 3, 42 BR 1 0
DJ 8 IN 1 1 0 8 BR. 26 BR side 1 4
DK 6 IN 1 4 0 18 BR 0 4
Mean 1.6
EA 11 IN 1 3 0 38,24,18,12,9,8 BR 2 0
EB 4 IN 2 4 0 65,19 BR 2 0
EC 6 IN 1 2 15 BR 0 0 5
ED 11 IN 1 4 12 BR knot 70+,36,19,7 BR 0 0
EE 8 IN 2 1 0 52,30,27,23,9,9,4 BR 3 0
EF 4 IN 1 2 6,5 BR 70+,28,23,16,14,5 BR 2 0
EG 11 IN 1 4 8 BR 70+end,37,27,22,12 BR 1 0
EH 8 IN 2 4 0 14 BR 0 5
EJ 11 IN 2 2 0 0 0 8
EK 4 IN 1 1 0 0 0 8
Mean 2.6
FA 4 IN 2 4 32 BR 70+x3,43,13,12 BR 2 0
FB 11 IN 1 3 13,5 BR 18,15,12,12 BR 0 1
FC 8 IN 1 2 28 BR 70+,65,56,28,15,9 BR 0 0
FD 11 IN 1 3 43 BR 56,48,38,23,18,12,12BR 1 0
FE 11 IN 2 1 0 52,32,19,8,5 BR 1 0
FF 8 IN 2 3 70+x3,25,19,12BR 70+x6 BR 2 0
FG 11 IN 1 1 38 BR 49 BR 0 0
FH 11 IN 2 2 37,32,16 BR 18 BR 0 0
FJ 6 IN 1 2 70+,21,18,5 BR 50+x3,36,12,8 BR 0 0
FK 4 IN 1 4 70+ BR 70+x2,35,31,25 BR 1 0
Mean 0.1 *Number of full length splits on either side of the vertical specimens. Depth of decay notes: BR = brown rot. FB = number of fruiting bodies present. E.g. 65,19,18x2,12,6 BR shows depths of brown rot in 6 laminates. 10 BR shows 10 mm brown rot in only one laminate. 70+ means that depth of decay was greater than 70 mm.

CLIENT REPORT No: EP112624
Page 42 of 55
Horizontally exposed at Innisfail, no end grain protection Boa-rd No.
Blo -ck No. Code
Fra-me Row
Depth of decay, mm Full length splits*
Rating
Top end Bottom end
GA 12 IN 1 1 0 19 BR end laminate 0 4
GB 10 IN 1 1 0 0 0 8
GC 8 IN 2 4 70+x7 BR 70+x7 BR 1 0
GD 10 IN 1 2 0 0 0 8
GE 12 IN 1 3 0 70+,14,8,4 BR 1 0
GF 12 IN 1 1 0 43,22,16 BR 2 0
GG 4 IN 1 4 8 BR 70+x3,46,27 BR 2 0
GH 4 IN 2 3 0 23,22,17,15,7,5 BR 2 3
GJ 8 IN 2 1 0 63,48,31,23,16,14,12,11BR 2 0
GK 12 IN 2 4 0 0 1 8
Mean 3.1
HA 4 IN 1 1 0 5 BR 0 7
HB 4 IN 2 2 0 0 0 8
HC 11 IN 1 3 0 16,10 BR 0 4
HD 10 IN 1 1 0 42,36,16,7 BR 0 0
HE 8 IN 2 3 0 70+x2,6,3 BR 0 0
HF 4 IN 1 4 0 0 0 8
HG 6 IN 2 2 29 BR 0 1 2
HH 6 IN 1 2 27 BR 25 BR 0 0
HJ 6 IN 1 4 0 70+,65,44,33,23,15 BR 2 0
HK 11 IN 1 3 0 14,13,10,9,7 BR 0 5
Mean 3.4 *Number of full length splits on either side of the vertical specimens. Depth of decay notes: BR = brown rot. FB = number of fruiting bodies present. E.g. 65,19,18x2,12,6 BR shows depths of brown rot in 6 laminates. 10 BR shows 10 mm brown rot in only one laminate. 70+ means that depth of decay was greater than 70 mm.

CLIENT REPORT No: EP112624
Page 43 of 55
Vertically exposed at Innisfail, with end grain LOSP protection Boa-rd No.
Blo -ck No. Code
Fra-me Row
Depth of decay, mm Full length splits*
Rating
Top end Bottom end
AA 4 ISC 2 3 0 70+end,14 BR 0 0
AC 4 ISC 2 3 0 14 BR 0 5
AD 6 ISC 1 2 22,10 BR 70+,5 BR 0 0
AF 10 ISC 1 3 0 0 0 8
AJ 6 ISC 1 1 0 0 0 8
Mean 4.2
BD 8 ISC 1 1 70+ x 5, 23 BR 70+, 38,5,5 BR. Ends OK 2 0
BE 10 ISC 1 4 70+x6, ends OK 70+x5,9, ends OK 0 0
BF 6 ISC 1 2 70+ x 6, 12 70+x4,50,35 BR 0 0
BH 8 ISC 2 2 0 17,10 BR 1 4
BJ 4 ISC 1 3 70+ x 2,6 BR 16,3,3,3 BR 0 0
Mean 0.8
CA 8 ISC 2 1 0 0 0 8
CC 6 ISC 1 3 0 0 0 8
CE 6 ISC 1 4 0 24 BR 1 3
CG 6 ISC 1 4 0 70+,8 BR 0 0
CJ 4 ISC 2 3 0 0 0 8
Mean 5.4
DA 12 ISC 2 1 14,7 BR 14,4 BR 0 2
DB 8 ISC 1 1 64,7 BR 52,17 BR 0 0
DC 12 ISC 2 4 70+x5,23 BR 70+x7 BR 2 0
DD 6 ISC 1 3 70+,20 BR 0 1 0
DG 12 ISC 1 2 0 5 BR 1 7
Mean 1.8
EA 10 ISC 1 1 0 0 3 8
EC 11 ISC 1 3 0 14,5 BR 0 5
EE 11 ISC 1 2 0 0 1 8
EG 6 ISC 1 1 0 0 0 8
EJ 10 ISC 2 1 0 0 0 8
Mean 7.4
FA 6 ISC 2 1 42,18,5 BR 38,33,4 BR 2 0
FC 4 ISC 2 2 0 0 0 8
FE 6 ISC 1 4 43 BR 0 0 0
FG 6 ISC 2 4 70+x5 BR 70+x7,32 BR 0 0
FJ 10 ISC 1 4 70+ x 2 BR 42,12,5,4 BR 0 0
Mean 1.6 *Number of full length splits on either side of the vertical specimens. Depth of decay notes: BR = brown rot. FB = number of fruiting bodies present. E.g. 65,19,18x2,12,6 BR shows depths of brown rot in 6 laminates. 10 BR shows 10 mm brown rot in only one laminate. 70+ means that depth of decay was greater than length of inspection knife.

CLIENT REPORT No: EP112624
Page 44 of 55
Vertically exposed at Innisfail, with end grain LOSP protection Boa-rd No.
Blo -ck No. Code
Fra-me Row
Depth of decay, mm Full length splits*
Rating
Top end Bottom end
GA 6 ISC 1 2 12,10,5 BR 70+ x 3,5 BR 0 0
GB 12 ISC 2 2 0 0 0 8
GC 6 ISC 1 2 0 60,15 BR 0 0
GD 8 ISC 1 4 70+x2 BR 70+x6 BR 1 0
GF 8 ISC 1 1 14 BR 0 1 5
Mean 2.6
HA 8 ISC 1 4 0 70+,35 BR 0 0
HC 8 ISC 2 4 70+,22,5,5 BR 70+x8 BR 1 0
HE 10 ISC 2 3 0 70+x2 BR 0 0
HG 10 ISC 1 2 0 70+ x 2,7 BR 2 0
HJ 8 ISC 2 2 18 BR 9 BR 2 2
Mean 0.4
AB 4 ISZ 2 2 0 0 0 8
AE 4 ISZ 1 1 0 0 0 8
AG 4 ISZ 1 4 18,5 BR 7 BR 0 3
AH 8 ISZ 1 1 0 16 BR end 5 BR 1L 0 4
AK 12 ISZ 1 3 0 6 BR 0 6
Mean 5.8
BA 6 ISZ 1 2 0 18,5,2 BR 0 4
BB 12 ISZ 2 1 15,7 BR 21,13,12,10,7,6,5 BR 1 0
BC 10 ISZ 2 4 32,17 BR 23,12,10,7,5 BR 0 0
BG 10 ISZ 1 3 70+x6,32,24 BR 70+x7 BR 0 0
BK 10 ISZ 1 4 70+x6, ends OK 70+x6, ends OK 0 0
Mean 0.8
CB 8 ISZ 1 2 0 3 mm BR 1 7
CD 6 ISZ 1 1 0 0 1 8
CF 12 ISZ 1 2 0 0 0 8
CH 10 ISZ 2 2 0 0 1 8
CK 10 ISZ 2 4 12,5 BR 70+x2,27,14 BR 0 0
Mean 6.2
DE 6 ISZ 1 3 0 5,3 BR 0 7
DF 8 ISZ 2 2 7,5 BR 25,12,9 BR 1 1
DH 4 ISZ 1 2 14 BR 50 x 2 BR 1 0
DJ 10 ISZ 1 4 70+ x 3 BR 70+ x 3,15 BR 1 0
DK 12 ISZ 1 4 0 7,3,2 BR 0 6
Mean 2.8 *Number of full length splits on either side of the vertical specimens. Depth of decay notes: BR = brown rot. FB = number of fruiting bodies present. E.g. 65,19,18x2,12,6 BR shows depths of brown rot in 6 laminates. 10 BR shows 10 mm brown rot in only one laminate. 70+ means that depth of decay was greater than length of inspection knife.
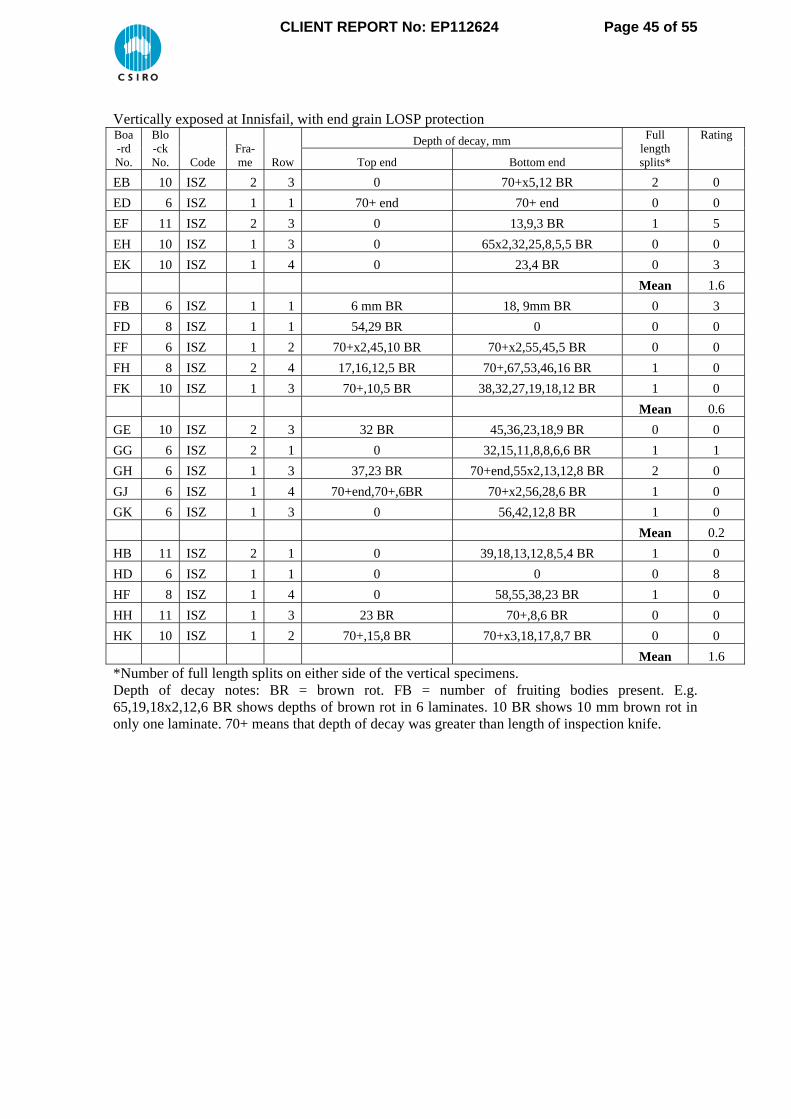
CLIENT REPORT No: EP112624
Page 45 of 55
Vertically exposed at Innisfail, with end grain LOSP protection Boa-rd No.
Blo -ck No. Code
Fra-me Row
Depth of decay, mm Full length splits*
Rating
Top end Bottom end
EB 10 ISZ 2 3 0 70+x5,12 BR 2 0
ED 6 ISZ 1 1 70+ end 70+ end 0 0
EF 11 ISZ 2 3 0 13,9,3 BR 1 5
EH 10 ISZ 1 3 0 65x2,32,25,8,5,5 BR 0 0
EK 10 ISZ 1 4 0 23,4 BR 0 3
Mean 1.6
FB 6 ISZ 1 1 6 mm BR 18, 9mm BR 0 3
FD 8 ISZ 1 1 54,29 BR 0 0 0
FF 6 ISZ 1 2 70+x2,45,10 BR 70+x2,55,45,5 BR 0 0
FH 8 ISZ 2 4 17,16,12,5 BR 70+,67,53,46,16 BR 1 0
FK 10 ISZ 1 3 70+,10,5 BR 38,32,27,19,18,12 BR 1 0
Mean 0.6
GE 10 ISZ 2 3 32 BR 45,36,23,18,9 BR 0 0
GG 6 ISZ 2 1 0 32,15,11,8,8,6,6 BR 1 1
GH 6 ISZ 1 3 37,23 BR 70+end,55x2,13,12,8 BR 2 0
GJ 6 ISZ 1 4 70+end,70+,6BR 70+x2,56,28,6 BR 1 0
GK 6 ISZ 1 3 0 56,42,12,8 BR 1 0
Mean 0.2
HB 11 ISZ 2 1 0 39,18,13,12,8,5,4 BR 1 0
HD 6 ISZ 1 1 0 0 0 8
HF 8 ISZ 1 4 0 58,55,38,23 BR 1 0
HH 11 ISZ 1 3 23 BR 70+,8,6 BR 0 0
HK 10 ISZ 1 2 70+,15,8 BR 70+x3,18,17,8,7 BR 0 0
Mean 1.6 *Number of full length splits on either side of the vertical specimens. Depth of decay notes: BR = brown rot. FB = number of fruiting bodies present. E.g. 65,19,18x2,12,6 BR shows depths of brown rot in 6 laminates. 10 BR shows 10 mm brown rot in only one laminate. 70+ means that depth of decay was greater than length of inspection knife.

CLIENT REPORT No: EP112624
Page 46 of 55
APPENDIX 2. Assessment of glulam after 3.1 years at Clayton AFS. Horizontally exposed Boa-rd No.
Blo -ck No. Code Bin
Depth of decay, mm Full length splits*
Rating
Top face Bottom face
AA 6 AF 2 0 0 0 8
AB 10 AF 2 0 0 0 8
AC 2 AF 2 0 0 0 8
AD 4 AF 2 0 0 0 8
AE 2 AF 2 0 0 0 8
AF 2 AF 1 8,2 mm BR 21 mm BR 1L 0 4
AG 6 AF 2 0 0 0 8
AH 2 AF 2 0 0 0 8
AJ 12 AF 2 0 0 0 8
AK 2 AF 2 0 0 0 8
Mean 7.6
BA 8 AF 2 0 0 2 split 8
BB 2 AF 2 0 0 0 8
BC 8 AF 1 0 0 1 split 8
BD 2 AF 2 0 0 0 8
BE 2 AF 2 0 0 1 split 8
BF 4 AF 1 0 0 1 split 8
BG 2 AF 2 0 0 0 8
BH 2 AF 2 0 0 0 8
BJ 6 AF 2 0 0 0 8
BK 12 AF 2 0 0 0 8
Mean 8.0
CA 6 AF 2 0 0 0 8
CB 2 AF 2 0 0 0 8
CC 2 AF 2 0 0 0 8
CD 2 AF 2 0 0 0 8
CE 10 AF 2 0 0 0 8
CF 2 AF 2 0 0 0 8
CG 10 AF 2 0 0 0 8
CH 4 AF 2 0 0 0 8
CJ 2 AF 2 0 0 0 8
CK 8 AF 1 2 mm BR 1L 0 0 7
Mean 7.9 *Number of full length splits on either face of test specimens.

CLIENT REPORT No: EP112624
Page 47 of 55
Horizontally exposed at Clayton AFS Boa-rd No.
Blo -ck No. Code Bin
Depth of decay, mm Full length splits*
Rating
Top face Bottom face
DA 2 AF 2 0 0 0 8
DB 4 AF 2 0 0 0 8
DC 10 AF 2 0 0 0 8
DD 2 AF 2 0 0 0 8
DE 8 AF 1 0 0 1 split 8
DF 2 AF 2 0 0 0 8
DG 2 AF 2 0 0 0 8
DH 12 AF 2 0 0 0 8
DJ 2 AF 2 0 0 0 8
DK 10 AF 1 0 0 0 8
Mean 8.0
EA 6 AF 2 0 0 2 split 8
EB 2 AF 2 0 0 0 8
EC 2 AF 2 0 0 0 8
ED 4 AF 1 12,8,6,5 mm BR 0 1 split 6
EE 2 AF 2 0 0 0 8
EF 6 AF 2 0 0 0 8
EG 10 AF 2 0 0 1 split 8
EH 2 AF 2 0 0 0 8
EJ 6 AF 2 0 0 0 8
EK 2 AF 2 0 0 0 8
Mean 7.8
FA 11 AF 2 0 0 4 split 8
FB 2 AF 1 0 0 0 8
FC 2 AF 2 0 0 0 8
FD 4 AF 2 0 0 2 split 8
FE 2 AF 2 0 0 0 8
FF 4 AF 2 0 0 0 8
FG 2 AF 2 0 0 0 8
FH 4 AF 2 0 0 0 8
FJ 2 AF 2 0 0 0 8
FK 11 AF 2 0 0 1 split 8
Mean 8.0 *Number of full length splits on either face of test specimens.

CLIENT REPORT No: EP112624
Page 48 of 55
Horizontally exposed at Clayton AFS Boa-rd No.
Blo -ck No. Code Bin
Depth of decay, mm Full length splits*
Rating
Top face Bottom face
GA 2 AF 2 0 0 0 8
GB 2 AF 2 0 0 1 split 8
GC 12 AF 2 0 0 1 split 8
GD 6 AF 2 0 0 2 split 8
GE 2 AF 2 0 0 0 8
GF 10 AF 2 0 0 0 8
GG 12 AF 1 0 12 mm BR 1L 0 6
GH 2 AF 2 0 0 0 8
GJ 2 AF 2 0 0 0 8
GK 4 AF 2 0 0 0 8
Mean 7.8
HA 2 AF 2 0 0 0 8
HB 10 AF 2 0 0 0 8
HC 2 AF 1 6 mm BR 1L 0 0 7
HD 4 AF 2 0 0 1 split 8
HE 6 AF 2 0 0 0 8
HF 2 AF 2 0 0 1 split 8
HG 8 AF 2 0 0 0 8
HH 2 AF 2 0 0 0 8
HJ 2 AF 2 0 0 1 split 8
HK 8 AF 2 0 0 0 8
Mean 7.9
JB 6 AF 2 0 0 0 8
JB 2 AF 2 0 0 0 8
JC 4 AF 1 1,2 mm BR 5,3 mm BR 1 split 7
JC 8 AF 2 0 0 0 8
JD 8 AF 2 0 0 1 split 8
JD 4 AF 2 0 0 1 split 8
JE 8 AF 2 0 0 0 8
JE 4 AF 2 0 2 mm rot 1L 0 7
JF 6 AF 2 0 0 0 8
JF 2 AF 2 0 0 1 split 8
Mean 7.8 *Number of full length splits on either face of test specimens.

CLIENT REPORT No: EP112624
Page 49 of 55
Horizontally exposed at Clayton AFS Boa-rd No.
Blo -ck No. Code Bin
Depth of decay, mm Full length splits*
Rating
Top face Bottom face
KA 2 AF 2 12,6,4,3 mm BR 7,7,6,4 mm BR 0 5
KA 1 AF 2 1 mm rot 1L 7,7,6,5,2,2 BR 0 7
KA 5 AF 1 29,5,5 mm BR, FBs 15,22,12,15 mm BR 0 2
KB 7 AF 2 18,15,15,5 mm FB 22,12,12,8 BR 0 3
KB 2 AF 2 8,4,2 mm BR 16,14,13,11x2 BR 3 split 5
KC 6 AF 1 20,14,12,6 mm BR 27x2,21,16,12,10x2 0 2
KC 5 AF 2 5 mm BR 1L 11,9,6,5 mm BR 1 split 6
KC 1 AF 2 12,8,4,3,2 mm BR 12,8,6,2 mm BR 0 5
KD 7 AF 2 13,12,12 mm BR 14,8,7 mm BR 3 split 4
KD 5 AF 2 24,18,15,8,5 BR 12,11,8,7 mm BR 2 split 3
Mean 4.2
LA 3 AF 1 12 mm 1L 22,10,12 mm BR 2 split 4
LA 1 AF 2 0 2 mm BR 1L 1 split 7
LA 6 AF 2 0 4,3,3 mm BR 0 7
LA 10 AF 2 2 mm BR 1L FBs 1 split 7
LA 7 AF 2 8 mm BR 1L, FBs 16 mm BR 1L 3 split 5
LB 3 AF 2 16,11,8 mm BR 6 mm BR 0 5
LB 6 AF 2 5 mm BR 1L 21 mm BR 1L 1 split 4
LB 1 AF 2 5,4 mm BR 5 mm BR 1L 0 6
LB 4 AF 2 6,6,3,3 mm BR 13,2 mm BR 0 5
LB 9 AF 2 0 0 2 split 8
Mean 5.8 *Number of full length splits on either face of test specimens.

CLIENT REPORT No: EP112624
Page 50 of 55
Vertically exposed at Clayton AFS, without end grain protection Boa-rd No.
Blo -ck No. Code Bin
Depth of decay, mm Full length splits*
Rating
Top end Bottom end
AA 8 AN 1 2 mm BR 1L 5,2 mm BR 0 6
AB 6 AN 3 3,3 mm BR 0 0 7
AC 10 AN 3 0 0 0 8
AD 8 AN 3 0 0 0 8
AE 8 AN 1 16mm1L,7mm knot 0 0 4
AF 12 AN 1 4 mm BR 1L 16,16,10 mm BR 0 4
AG 12 AN 3 0 0 0 8
AH 12 AN 3 0 0 0 8
AJ 8 AN 1 5 mm BR 1L 37,10 mm BR 0 0
AK 6 AN 3 0 0 0 8
Mean 6.1
BA 4 AN 3 0 7,5,3 mm BR 6
BB 8 AN 3 0 35,19,7 mm BR 0 1
BC 6 AN 3 18,17,11 mm BR 17,15,13,12 BR 0 1
BD 6 AN 1 17,5 mm BR 7,5 mm BR 0 3
BE 8 AN 3 16 mm BR 1L 14 mm BR 1L 0 2
BF 12 AN 3 22x2,15,13,12,5 17,16,15,9 BR 0 0
BG 4 AN 3 0 0 0 8
BH 6 AN 1 22,18,8,5,5 mm BR 12,11,5 mm BR 1 split 1
BJ 8 AN 1 0 16,7,5,5 mm BR 0 4
BK 4 AN 1 12,11,10 mm BR 5 mm BR 1L 0 4
Mean 3.0
CA 4 AN 3 0 0 0 8
CB 12 AN 3 0 0 0 8
CC 4 AN 3 0 0 0 8
CD 8 AN 1 0 5,2 mm BR 0 7
CE 12 AN 1 0 0 0 8
CF 8 AN 1 11,5 mm BR 2,1 mm BR 0 5
CG 4 AN 3 0 0 0 8
CH 6 AN 3 0 0 0 8
CJ 8 AN 1 0 0 0 8
CK 4 AN 3 0 0 0 8
Mean 7.6 *Number of full length splits on either side of the vertical specimens.
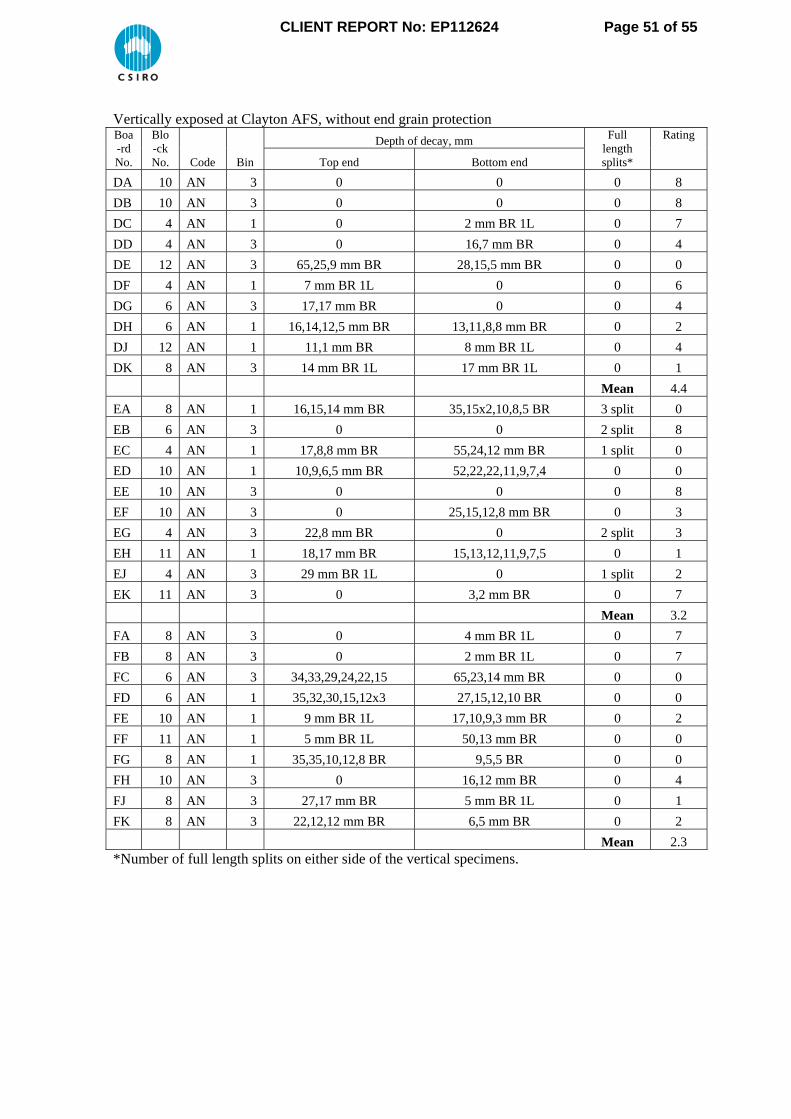
CLIENT REPORT No: EP112624
Page 51 of 55
Vertically exposed at Clayton AFS, without end grain protection Boa-rd No.
Blo -ck No. Code Bin
Depth of decay, mm Full length splits*
Rating
Top end Bottom end
DA 10 AN 3 0 0 0 8
DB 10 AN 3 0 0 0 8
DC 4 AN 1 0 2 mm BR 1L 0 7
DD 4 AN 3 0 16,7 mm BR 0 4
DE 12 AN 3 65,25,9 mm BR 28,15,5 mm BR 0 0
DF 4 AN 1 7 mm BR 1L 0 0 6
DG 6 AN 3 17,17 mm BR 0 0 4
DH 6 AN 1 16,14,12,5 mm BR 13,11,8,8 mm BR 0 2
DJ 12 AN 1 11,1 mm BR 8 mm BR 1L 0 4
DK 8 AN 3 14 mm BR 1L 17 mm BR 1L 0 1
Mean 4.4
EA 8 AN 1 16,15,14 mm BR 35,15x2,10,8,5 BR 3 split 0
EB 6 AN 3 0 0 2 split 8
EC 4 AN 1 17,8,8 mm BR 55,24,12 mm BR 1 split 0
ED 10 AN 1 10,9,6,5 mm BR 52,22,22,11,9,7,4 0 0
EE 10 AN 3 0 0 0 8
EF 10 AN 3 0 25,15,12,8 mm BR 0 3
EG 4 AN 3 22,8 mm BR 0 2 split 3
EH 11 AN 1 18,17 mm BR 15,13,12,11,9,7,5 0 1
EJ 4 AN 3 29 mm BR 1L 0 1 split 2
EK 11 AN 3 0 3,2 mm BR 0 7
Mean 3.2
FA 8 AN 3 0 4 mm BR 1L 0 7
FB 8 AN 3 0 2 mm BR 1L 0 7
FC 6 AN 3 34,33,29,24,22,15 65,23,14 mm BR 0 0
FD 6 AN 1 35,32,30,15,12x3 27,15,12,10 BR 0 0
FE 10 AN 1 9 mm BR 1L 17,10,9,3 mm BR 0 2
FF 11 AN 1 5 mm BR 1L 50,13 mm BR 0 0
FG 8 AN 1 35,35,10,12,8 BR 9,5,5 BR 0 0
FH 10 AN 3 0 16,12 mm BR 0 4
FJ 8 AN 3 27,17 mm BR 5 mm BR 1L 0 1
FK 8 AN 3 22,12,12 mm BR 6,5 mm BR 0 2
Mean 2.3 *Number of full length splits on either side of the vertical specimens.

CLIENT REPORT No: EP112624
Page 52 of 55
Vertically exposed at Clayton AFS, without end grain protection Boa-rd No.
Blo -ck No. Code Bin
Depth of decay, mm Full length splits*
Rating
Top end Bottom end
GA 8 AN 3 0 0 0 8
GB 6 AN 1 19,17,12 mm BR 10,5 mm BR 0 2
GC 10 AN 3 38,15,10 mm BR 35,26,22,18,15,5 0 0
GD 12 AN 3 0 0 1 split 8
GE 4 AN 1 12,12,7 mm BR 17,9,8,8 mm BR 0 2
GF 4 AN 3 0 0 0 8
GG 8 AN 1 45,25,10,12,8 BR 12,8,5,3 mm BR 1 split 0
GH 10 AN 1 45,39,20,14,12x3 33,25,20,18,12x2,6 0 0
GJ 12 AN 3 0 36,14,12,11,9,8 BR 0 0
GK 8 AN 3 0 9,6,3,3 mm BR 0 6
Mean 3.4
HA 6 AN 3 3 mm BR 1L 11 mm BR 1L 0 5
HB 8 AN 3 0 0 0 8
HC 10 AN 1 16,8,5 mm BR 0 0 4
HD 11 AN 3 0 6,3 mm BR 0 6
HE 4 AN 1 2 mm BR 1L 9 mm BR 1L 0 5
HF 10 AN 3 0 0 0 8
HG 11 AN 1 14,14,8 mm BR 55,15,7,3 BR 0 0
HH 10 AN 3 0 0 0 8
HJ 4 AN 1 3 mm BR 1L 2,2 mm BR 2 split 7
HK 6 AN 3 0 0 0 8
Mean 5.9
KA 7 AN 1 18,9,6,5 mm BR 50,35,25,20,10,10,6 0 0
KA 6 AN 3 65x3,25,8 mm BR 65,35,20,16,9 BR 0 0
KB 6 AN 1 14,7,5,5,4 mm BR 16,7,6,5,4,3 mm 0 2
KB 8 AN 3 8,2 mm BR 24,23,18,10 BR 0 1
KB 3 AN 3 26,3,2 mm BR 28x2,25,18x2,10x2 0 0
KC 7 AN 1 38,35,20x5 BR 45,29,25,20,15x3 0 0
KC 8 AN 3 44,38,24,22,19x2,14 32,27x2,22x2,8x2 0 0
KD 1 AN 1 50,40,35x3,20,15 55,35x2,25,20x3 2 split 0
KD 4 AN 3 65,50x2,40,17,15 65x3,50,45,30,28 2 split 0
KD 3 AN 3 0 14,12 mm BR 3 split 4
Mean 0.7 *Number of full length splits on either side of the vertical specimens. Depth of decay notes: BR = brown rot. L = number of laminates affected. E.g. 35+ BR 3L = 35 mm plus of brown rot in three laminates.

CLIENT REPORT No: EP112624
Page 53 of 55
Vertically exposed at Clayton AFS, with end grain LOSP protection Boa-rd No.
Blo -ck No. Code Bin
Depth of decay, mm Full length splits*
Rating
Top end Bottom end
AA 10 ASC 1 0 0 0 8
AD 12 ASC 1 0 0 0 8
AG 10 ASC 3 0 0 0 8
AH 4 ASC 1 0 13,5 mm BR 1 split 5
AK 8 ASC 3 0 0 0 8
Mean 7.4
BB 4 ASC 1 0 1 mm BR 1L 0 7
BD 12 ASC 1 0 5,4 mm BR 0 7
BE 12 ASC 3 0 0 0 8
BJ 10 ASC 3 0 0 0 8
BK 8 ASC 1 0 11 mm BR 1L 0 5
Mean 7.0
CA 12 ASC 3 0 0 0 8
CC 8 ASC 3 0 9 mm BR 1L 0 6
CE 4 ASC 1 0 0 0 8
CG 12 ASC 1 0 2 mm BR 1L 0 7
CJ 10 ASC 1 0 0 0 8
Mean 7.4
DA 4 ASC 1 2,2 mm BR 5 mm BR 1L 0 6
DB 12 ASC 1 0 2 mm BR 1L 0 7
DC 8 ASC 3 0 0 0 8
DD 10 ASC 1 0 1 mm BR 1L 0 7
DG 10 ASC 3 0 0 0 8
Mean 7.2
EA 4 ASC 3 0 0 0 8
EC 10 ASC 3 0 0 0 8
EE 6 ASC 1 0 0 0 8
EG 8 ASC 1 9 mm BR 1L 8,8 mm BR 1 split 4
EJ 8 ASC 1 7 mm BR 1L 3 mm BR 1L 0 6
Mean 6.8
FA 10 ASC 3 0 0 0 8
FC 11 ASC 3 12,2 mm BR 9 mm BR 1L 0 3
FE 4 ASC 1 13 mm BR 1L 12,4 mm BR 0 3
FG 4 ASC 1 0 0 0 8
FJ 11 ASC 1 15,5 mm BR 0 1 split 5
Mean 5.4 *Number of full length splits on either side of the vertical specimens.

CLIENT REPORT No: EP112624
Page 54 of 55
Vertically exposed at Clayton AFS, with end grain LOSP protection Boa-rd No.
Blo -ck No. Code Bin
Depth of decay, mm Full length splits*
Rating
Top end Bottom end
GE 8 ASC 3 0 0 0 8
GG 10 ASC 3 0 0 0 8
GH 12 ASC 1 0 0 0 8
GJ 4 ASC 1 13,9,5,5 mm BR 12,6,5,3 mm BR 1 split 3
GK 10 ASC 1 0 FBs on side 1 split 8
Mean 7.0
HA 11 ASC 3 0 0 0 8
HC 6 ASC 3 0 0 0 8
HE 11 ASC 1 0 0 0 8
HG 4 ASC 1 0 45,11 mm BR 0 0
HJ 10 ASC 1 6 mm BR 1L 0 0 6
Mean 6.0
AB 12 ASZ 3 0 0 0 8
AC 8 ASZ 3 0 0 0 8
AE 10 ASZ 3 0 6 mm BR 1L 0 6
AF 4 ASZ 1 0 0 0 8
AJ 10 ASZ 3 0 0 0 8
Mean 7.6
BA 12 ASZ 1 5 mm BR 1L 38,32,28,15 mm BR 0 0
BC 4 ASZ 3 0 0 0 8
BF 8 ASZ 3 0 0 0 8
BG 6 ASZ 3 0 5,4 mm BR 0 7
BH 12 ASZ 3 0 3,3 mm BR 0 7
Mean 6.0
CB 10 ASZ 1 0 0 0 8
CD 10 ASZ 3 0 0 0 8
CF 6 ASZ 3 0 0 0 8
CH 12 ASZ 3 0 0 0 8
CK 12 ASZ 3 0 0 0 8
Mean 8.0
DE 10 ASZ 1 55,15,12,10 BR 20x2,18,14 mm BR 0 0
DF 12 ASZ 3 0 0 0 8
DH 8 ASZ 3 0 0 0 8
DJ 4 ASZ 3 8,8 mm BR 0 0 6
DK 4 ASZ 3 2 mm BR 1L 33,23,16,8 mm BR 0 1
Mean 4.6 *Number of full length splits on either side of the vertical specimens.

CLIENT REPORT No: EP112624
Page 55 of 55
Vertically exposed at Clayton AFS, with end grain LOSP protection Boa-rd No.
Blo -ck No. Code Bin
Depth of decay, mm Full length splits*
Rating
Top end Bottom end
EB 8 ASZ 3 0 0 1 split 8
ED 8 ASZ 3 0 5 mm BR 1L 0 7
EF 8 ASZ 3 0 40,32,24,9 BR 0 0
EH 4 ASZ 1 55,20,9 mm BR 45,25 mm BR 0 0
EK 8 ASZ 3 19,16 mm BR 5 mm BR 1L 0 3
Mean 3.6
FB 4 ASZ 3 0 0 0 8
FD 10 ASZ 3 65,6,5 mm BR 12 mm BR 1L 0 0
FF 10 ASZ 3 0 5 mm BR 1L 0 7
FH 6 ASZ 3 0 0 0 8
FK 6 ASZ 1 55,55,35,25 BR 70,55,45,25 BR 1 split 0
Mean 4.6
GA 10 ASZ 3 0 0 0 8
GB 4 ASZ 1 33,10,5 mm BR 42,15 mm BR 0 0
GC 4 ASZ 3 0 0 1 split 8
GD 4 ASZ 3 0 0 0 8
GF 6 ASZ 3 0 0 0 8
Mean 6.4
HB 6 ASZ 3 0 0 0 8
HD 8 ASZ 3 0 0 0 8
HF 11 ASZ 3 0 0 0 8
HH 8 ASZ 1 16,14,8,8,7,5 BR 22,13 mm BR 0 0
HK 4 ASZ 3 0 0 0 8
Mean 6.4 *Number of full length splits on either side of the vertical specimens.