Embed Size (px)
Citation preview

DETERMINING BOUNDS FOR A PRESSURE HAZARD RATING TO AUGMENT
THE NFPA 704 STANDARD
A Thesis
by
PHILLIP RAYMOND HODGE
Submitted to the Office of Graduate Studies of
Texas A&M University
in partial fulfillment of the requirements for the degree of
MASTER OF SCIENCE
December 2011
Major Subject: Chemical Engineering

Determining Bounds for a Pressure Hazard Rating to Augment the NFPA 704 Standard.
Copyright 2011 Phillip Raymond Hodge

DETERMINING BOUNDS FOR A PRESSURE HAZARD RATING TO AUGMENT
THE NFPA 704 STANDARD
A Thesis
by
PHILLIP RAYMOND HODGE
Submitted to the Office of Graduate Studies of
Texas A&M University
in partial fulfillment of the requirements for the degree of
MASTER OF SCIENCE
Approved by:
Chair of Committee, Sam M. Mannan
Committee Members, Debjyoti Banerjee
Dan Shantz
Interim Head of Department, Charles Glover
December 2011
Major Subject: Chemical Engineering

iii
ABSTRACT
Determining Bounds for a Pressure Hazard Rating to Augment the NFPA 704 Standard.
(December 2011)
Phillip Raymond Hodge, B.S., Rice University
Chair of Advisory Committee: Dr. Sam M. Mannan
Hazard communication is an essential part of a comprehensive safety plan,
especially for those facilities that contain reactive chemicals. There are a variety of
means of communicating a chemical hazard, but one of the most prevalent in the United
States is the Instability Rating found in the NFPA 704 standard. While the NFPA 704
identifies hazards associated with exothermically decomposing compounds, it neglects
compounds that decompose endothermicly to form large quantities of gas. Such
compounds have been known to cause accidents due to pressure buildup, such as in the
BP Amoco Polymers explosion in 2001.
In this work, twenty-five compounds were examined via an APTAC to determine
their pressure and temperature profiles. These profiles were then used to determine the
amount of gas generated, the gas generation rate, the gas generation product, the onset
temperature, and the instantaneous power density. These properties were analyzed to
determine those that best represented the instability hazard of the chemical. Ultimately,
the molar gas generation rate and onset temperature were chosen to rate the selected

iv
chemicals, and new cut-offs were established to divide the chemicals into revised
instability groupings.
Compounds that did not decompose in the temperature range examined were
given the rating of zero. Compounds with low onset temperatures and high gas
generation rates were assigned the rating of 4, while chemicals with high Tonset and low
dn/dtmaxn were assigned a value of 1. Chemicals with high onset temperatures and high
gas generation rates were grouped into rating 3. Group 2 included low onset temperature
compounds with low gas generation rates. The cut-offs used to define these regions
were 130°C for the onset temperature and 0.01 (1/min) for the gas generation rate. The
ratings were found to be comparable to the current NFPA system, but improved upon it
by providing a valid rating (group 1) for the chemicals that endothermically generated
gas. Detailed plots of the data are provided as well as suggestions for future work.

v
DEDICATION
To Chemistry Lunch and the 8th
Floor, because I wouldn't be here without them.

vi
ACKNOWLEDGEMENTS
I would like to express my sincerest thanks to Dr. Sam M. Mannan for the
opportunities that he has given me to explore the many facets of process safety. His
support and confidence have been much appreciated throughout this process.
Dr. Ray Mentzer has also been of invaluable aid while conducting this research.
He pushed me to stay on pace and to be always looking to the next step. For this and the
borrowed courses on tape that kept me awake on the trek to and from College Station
each day I am immensely grateful.
I would like to say a special word of thanks to my advisory committee members
Dr. Debjyoti Banerjee and Dr. Dan Shantz for their time and assistance as well as to Mr.
Harold Johnstone of DOW Chemical who provided technical support for this research.
The faculty, staff, and students of the MKOPSC have provided both camaraderie
and critique during this work that lightened the load substantially. Dr. Victor Carreto
and Lina Saenz, however, have gone above and beyond the call of duty. They have both
answered hundreds of questions and helped me over significant hurdles. Moreover, they
have always done this cheerfully even when I was not been so upbeat.
Finally, I would like to thank my wife who agreed to my hair-brained scheme to
go back to school. She has vicariously experienced the ups and downs of my two years
at A&M and now knows more than she ever wanted to know about adiabatic
calorimetry. She agreed to the headache that is a Houston commute and continues to put
up with me through it all. I don't know where I'd be without her.

vii
NOMENCLATURE
APTAC Automatic Pressure Tracking Adiabatic Calorimeter
ARC Accelerated Rate Calorimeter
ASTM American Society for Testing and Materials
avg Average
CHETAH Computer Program for Chemical Thermodynamic and Energy
Release Evaluation
Cc Heat capacity of the cell
Cs Heat capacity of the sample
dn/dt Molar gas generation rate
dn/dti Molar gas generation rate for any given time
dn/dtmax Maximum molar gas generation rate
dn/dtmaxn Normalized maximum molar gas generation rate
dP/dt Pressure rate
dP/dti Pressure rate at any given time
dT/dt Temperature rate
dT/dti Temperature rate at any given time
DSC Differential Screening Calorimeter
DTBP Di-Tert-Butyl Peroxide
EA Activation energy
GGP Gas Generation Product

viii
HWS Heat – Wait – Search
IPD Instantaneous Power Density
ki Rate constant at any given time
lg Large
m Mass
mc Mass of the cell
ms Mass of the sample
md Medium
min Minute
mL milliliter
MKOPSC Mary K. O'Connor Process Safety Center
MW Molar (or Molecular) weight
n Number of moles
ni Number of moles of generated gas at any given time
nmax Maximum number of moles of generated gas
nmaxn Normalized maximum number of moles of generated gas
ns Number of moles of sample
NFPA National Fire Protection Association
NOx Mono-Nitrogen oxides
NRIFD National Research Institute of Fire and Disaster
P Pressure
Pi Pressure at any given time

ix
P0 Initial pressure
psi Pounds per Square Inch
psia Pounds per Square Inch Absolute
R Ideal gas law constant
rdecomp rate of decomposition reaction
s Second
sm Small
t Time
T Temperature
Ti Temperature at any given time
Tmax Maximum temperature at the end of an exothermic reaction
Tonset Onset temperature – temperature at which a reaction begins
T0 Initial temperature
V Volume
Vcell Volume of the cell
Vv-s Gas expansion volume
ΔHdecomp Enthalpy of decomposition
Φ phi factor
ρs Density of the sample
°C degrees Celcius

x
TABLE OF CONTENTS
Page
ABSTRACT .............................................................................................................. iii
DEDICATION .......................................................................................................... v
ACKNOWLEDGEMENTS ...................................................................................... vi
NOMENCLATURE .................................................................................................. vii
TABLE OF CONTENTS .......................................................................................... x
LIST OF FIGURES ................................................................................................... xii
LIST OF TABLES .................................................................................................... xxii
1. INTRODUCTION ............................................................................................... 1
2. METHODOLOGY .............................................................................................. 6
2.1 Chemical Selection and Preparation .................................................... 6
2.2 Automatic Pressure Tracking Adiabatic Calorimeter .......................... 11
2.3 Normalization and Data Manipulation ................................................. 15
2.4 Thermal Properties Determination ....................................................... 18
2.5 Precision and Normalization Studies ................................................... 19
2.6 Measured Uncertainties, Calibration, and Cleaning Procedures .......... 20
3. RESULTS AND DISCUSSION ......................................................................... 24
3.1 Normalization Study ............................................................................ 24
3.2 Test Results .......................................................................................... 27
3.3 Interpretation of Results ....................................................................... 29
4. CONCLUSIONS AND RECOMMENDATIONS .............................................. 36
4.1 Conclusions .......................................................................................... 36
4.2 Recommendations ............................................................................... 37
REFERENCES .......................................................................................................... 39
APPENDIX A ........................................................................................................... 41

xi
Page
APPENDIX B ........................................................................................................... 102
VITA ......................................................................................................................... 193

xii
LIST OF FIGURES
FIGURE Page
2.1 Typical Temperature Profile from an APTAC HWS Experiment .......... 14
2.2 APTAC Accuracy Check 20% Tertbutyl Peroxide in Toluene ............... 22
2.3 APTAC Standard Curves ........................................................................ 22
2.4 APTAC Accuracy Check 20% Tertbutyl
Peroxide in Toluene – Glass Cell ............................................................ 23
3.1 Cut-Off Analysis - Onset Temperature and Gas Generation Rate .......... 32
3.2 Cut-Off Determination ............................................................................ 33
A.1 Normalized Gas Generation - Tertbutyl Peroxide 1.3g lg – 1 ................ 43
A.2 Normalized Gas Generation Rate - Tertbutyl Peroxide 1.3g lg – 1 ........ 43
A.3 Temperature and Pressure Profiles - Tertbutyl Peroxide 1.3g lg – 1 ...... 44
A.4 Temperature and Pressure Rate Profiles -
Tertbutyl Peroxide 1.3g lg – 1 ................................................................. 44
A.5 Rate Constant Determination - Tertbutyl Peroxide 1.3g lg – 1 ............... 45
A.6 Normalized Gas Generation - Tertbutyl Peroxide 1.3g lg – 2 ................ 47
A.7 Normalized Gas Generation Rate - Tertbutyl Peroxide 1.3g lg – 2 ........ 47
A.8 Temperature and Pressure Profiles - Tertbutyl Peroxide 1.3g lg – 2 ...... 48
A.9 Temperature and Pressure Rate Profiles -
Tertbutyl Peroxide 1.3g lg – 2 ................................................................. 48
A.10 Rate Constant Determination - Tertbutyl Peroxide 1.3g lg – 2 ............... 49
A.11 Normalized Gas Generation - Tertbutyl Peroxide 1.3g lg – 3 ................ 51
A.12 Normalized Gas Generation Rate - Tertbutyl Peroxide 1.3g lg – 3 ........ 51
A.13 Temperature and Pressure Profiles - Tertbutyl Peroxide 1.3g lg – 3 ...... 52

xiii
FIGURE Page
A.14 Temperature and Pressure Rate Profiles -
Tertbutyl Peroxide 1.3g lg – 3 ................................................................. 52
A.15 Rate Constant Determination - Tertbutyl Peroxide 1.3g lg – 3 ............... 53
A.16 Normalized Gas Generation - Tertbutyl Peroxide 1.3g lg – 4 ................ 55
A.17 Normalized Gas Generation Rate - Tertbutyl Peroxide 1.3g lg – 4 ........ 55
A.18 Temperature and Pressure Profiles - Tertbutyl Peroxide 1.3g lg – 4 ...... 56
A.19 Temperature and Pressure Rate Profiles -
Tertbutyl Peroxide 1.3g lg – 4 ................................................................. 56
A.20 Rate Constant Determination - Tertbutyl Peroxide 1.3g lg – 4 ............... 57
A.21 Normalized Gas Generation - Tertbutyl Peroxide 1.3g lg – 5 ................ 59
A.22 Normalized Gas Generation Rate - Tertbutyl Peroxide 1.3g lg – 5 ........ 59
A.23 Temperature and Pressure Profiles - Tertbutyl Peroxide 1.3g lg – 5 ...... 60
A.24 Temperature and Pressure Rate Profiles -
Tertbutyl Peroxide 1.3g lg – 5 ................................................................. 60
A.25 Rate Constant Determination - Tertbutyl Peroxide 1.3g lg – 5 ............... 61
A.26 Normalized Gas Generation - Tertbutyl Peroxide 1.3g - md .................. 63
A.27 Normalized Gas Generation Rate - Tertbutyl Peroxide 1.3g - md .......... 63
A.28 Temperature and Pressure Profiles - Tertbutyl Peroxide 1.3g - md ........ 64
A.29 Temperature and Pressure Rate Profiles -
Tertbutyl Peroxide 1.3g - md .................................................................. 64
A.30 Rate Constant Determination - Tertbutyl Peroxide 1.3g - md ................ 65
A.31 Normalized Gas Generation - Tertbutyl Peroxide 1.3g - sm ................... 67
A.32 Normalized Gas Generation Rate - Tertbutyl Peroxide 1.3g - sm .......... 67

xiv
FIGURE Page
A.33 Temperature and Pressure Profiles - Tertbutyl Peroxide 1.3g - sm ........ 68
A.34 Temperature and Pressure Rate Profiles -
Tertbutyl Peroxide 1.3g - sm ................................................................... 68
A.35 Rate Constant Determination - Tertbutyl Peroxide 1.3g – sm ................ 69
A.36 Normalized Gas Generation - Tertbutyl Peroxide 3g - lg ....................... 71
A.37 Normalized Gas Generation Rate - Tertbutyl Peroxide 3g - lg ............... 71
A.38 Temperature and Pressure Profiles - Tertbutyl Peroxide 3g - lg ............. 72
A.39 Temperature and Pressure Rate Profiles - Tertbutyl Peroxide 3g - lg..... 72
A.40 Rate Constant Determination - Tertbutyl Peroxide 3g - lg ..................... 73
A.41 Normalized Gas Generation - Tertbutyl Peroxide 3g - md ..................... 75
A.42 Normalized Gas Generation Rate - Tertbutyl Peroxide 3g - md ............. 75
A.43 Temperature and Pressure Profiles - Tertbutyl Peroxide 3g - md ........... 76
A.44 Temperature and Pressure Rate Profiles - Tertbutyl Peroxide 3g - md... 76
A.45 Rate Constant Determination - Tertbutyl Peroxide 3g - md ................... 77
A.46 Normalized Gas Generation - Tertbutyl Peroxide 0.5g - lg .................... 79
A.47 Normalized Gas Generation Rate - Tertbutyl Peroxide 0.5g - lg ............ 79
A.48 Temperature and Pressure Profiles - Tertbutyl Peroxide 0.5g - lg .......... 80
A.49 Temperature and Pressure Rate Profiles - Tertbutyl Peroxide 0.5g - lg.. 80
A.50 Rate Constant Determination - Tertbutyl Peroxide 0.5g - lg .................. 81
A.51 Normalized Gas Generation - Tertbutyl Peroxide 0.5g - md .................. 83
A.52 Normalized Gas Generation Rate - Tertbutyl Peroxide 0.5g - md .......... 83
A.53 Temperature and Pressure Profiles - Tertbutyl Peroxide 0.5g - md ........ 84

xv
FIGURE Page
A.54 Temperature and Pressure Rate Profiles -
Tertbutyl Peroxide 0.5g - md .................................................................. 84
A.55 Rate Constant Determination - Tertbutyl Peroxide 0.5g - md ................ 85
A.56 Normalized Gas Generation - Tertbutyl Peroxide 0.5g - sm ................... 87
A.57 Normalized Gas Generation Rate - Tertbutyl Peroxide 0.5g - sm .......... 87
A.58 Temperature and Pressure Profiles - Tertbutyl Peroxide 0.5g - sm ........ 88
A.59 Temperature and Pressure Rate Profiles -
Tertbutyl Peroxide 0.5g - sm ................................................................... 88
A.60 Rate Constant Determination - Tertbutyl Peroxide 0.5g - sm ................. 89
A.61 Normalized Gas Generation - Tertbutyl Peroxide 6g - lg ....................... 91
A.62 Normalized Gas Generation Rate - Tertbutyl Peroxide 6g - lg ............... 91
A.63 Temperature and Pressure Profiles - Tertbutyl Peroxide 6g - lg ............. 92
A.64 Temperature and Pressure Rate Profiles - Tertbutyl Peroxide 6g - lg..... 92
A.65 Rate Constant Determination - Tertbutyl Peroxide 6g - lg ..................... 93
A.66 Normalized Gas Generation - Tertbutyl Peroxide 0.9g - lg .................... 95
A.67 Normalized Gas Generation Rate - Tertbutyl Peroxide 0.9g - lg ............ 95
A.68 Temperature and Pressure Profiles - Tertbutyl Peroxide 0.9g - lg .......... 96
A.69 Temperature and Pressure Rate Profiles - Tertbutyl Peroxide 0.9g - lg.. 96
A.70 Rate Constant Determination - Tertbutyl Peroxide 0.9g - lg .................. 97
A.71 Normalized Gas Generation - Tertbutyl Peroxide 18g - lg ..................... 99
A.72 Normalized Gas Generation Rate - Tertbutyl Peroxide 18g - lg ............. 99
A.73 Temperature and Pressure Profiles - Tertbutyl Peroxide 18g - lg ........... 100

xvi
FIGURE Page
A.74 Temperature and Pressure Rate Profiles - Tertbutyl Peroxide 18g - lg... 100
A.75 Rate Constant Determination - Tertbutyl Peroxide 18g - lg ................... 101
B.1 Normalized Gas Generation - 1, 2 - Dinitrobenzene ............................... 104
B.2 Normalized Gas Generation Rate - 1, 2 - Dinitrobenzene ...................... 104
B.3 Temperature and Pressure Profiles - 1, 2 - Dinitrobenzene .................... 105
B.4 Temperature and Pressure Rate Profiles - 1, 2 - Dinitrobenzene ............ 105
B.5 Rate Constant Determination - 1, 2 - Dinitrobenzene ............................. 106
B.6 Normalized Gas Generation - 2 - Butanone Peroxide ............................. 108
B.7 Normalized Gas Generation Rate - 2 - Butanone Peroxide .................... 108
B.8 Temperature and Pressure Profiles - 2 - Butanone Peroxide................... 109
B.9 Temperature and Pressure Rate Profiles - 2 - Butanone Peroxide .......... 109
B.10 Rate Constant Determination - 2 - Butanone Peroxide ........................... 110
B.11 Normalized Gas Generation - 2, 4 - Dinitroaniline ................................. 112
B.12 Normalized Gas Generation Rate - 2, 4 – Dinitroaniline ........................ 112
B.13 Temperature and Pressure Profiles - 2, 4 - Dinitroaniline ....................... 113
B.14 Temperature and Pressure Rate Profiles - 2, 4 - Dinitroaniline .............. 113
B.15 Rate Constant Determination - 2, 4 - Dinitroaniline ............................... 114
B.16 Normalized Gas Generation - Acrylonitrile ............................................ 116
B.17 Normalized Gas Generation Rate - Acrylonitrile .................................... 116
B.18 Temperature and Pressure Profiles - Acrylonitrile .................................. 117
B.19 Temperature and Pressure Rate Profiles - Acrylonitrile ......................... 117

xvii
FIGURE Page
B.20 Rate Constant Determination - Acrylonitrile .......................................... 118
B.21 Normalized Gas Generation - Cumene ................................................... 120
B.22 Normalized Gas Generation Rate - Cumene ........................................... 120
B.23 Temperature and Pressure Profiles - Cumene ......................................... 121
B.24 Temperature and Pressure Rate Profiles - Cumene ................................. 121
B.25 Rate Constant Determination - Cumene .................................................. 122
B.26 Normalized Gas Generation - Cumene Hydroperoxide .......................... 124
B.27 Normalized Gas Generation Rate - Cumene Hydroperoxide .................. 124
B.28 Temperature and Pressure Profiles - Cumene Hydroperoxide ................ 125
B.29 Temperature and Pressure Rate Profiles - Cumene Hydroperoxide........ 125
B.30 Rate Constant Determination - Cumene Hydroperoxide ........................ 126
B.31 Normalized Gas Generation - Ethylene Oxide ........................................ 128
B.32 Normalized Gas Generation Rate - Ethylene Oxide ............................... 128
B.33 Temperature and Pressure Profiles - Ethylene Oxide ............................. 129
B.34 Temperature and Pressure Rate Profiles - Ethylene Oxide ..................... 129
B.35 Rate Constant Determination - Ethylene Oxide ...................................... 130
B.36 Normalized Gas Generation - Hydrogen Peroxide - 12.5% .................... 132
B.37 Normalized Gas Generation Rate - Hydrogen Peroxide - 12.5% ........... 132
B.38 Temperature and Pressure Profiles - Hydrogen Peroxide - 12.5% ......... 133
B.39 Temperature and Pressure Rate Profiles - Hydrogen Peroxide - 12.5% . 133
B.40 Rate Constant Determination - Hydrogen Peroxide - 12.5% .................. 134

xviii
FIGURE Page
B.41 Normalized Gas Generation - Hydroxylamine Chloride ......................... 136
B.42 Normalized Gas Generation Rate - Hydroxylamine Chloride ................ 136
B.43 Temperature and Pressure Profiles - Hydroxylamine Chloride .............. 137
B.44 Temperature and Pressure Rate Profiles - Hydroxylamine Chloride ...... 137
B.45 Rate Constant Determination - Hydroxylamine Chloride ....................... 138
B.46 Normalized Gas Generation - Isoprene ................................................... 140
B.47 Normalized Gas Generation Rate - Isoprene ........................................... 140
B.48 Temperature and Pressure Profiles - Isoprene ......................................... 141
B.49 Temperature and Pressure Rate Profiles - Isoprene ................................ 141
B.50 Rate Constant Determination - Isoprene ................................................. 142
B.51 Normalized Gas Generation - Isopropyl Alcohol ................................... 144
B.52 Normalized Gas Generation Rate - Isopropyl Alcohol ........................... 144
B.53 Temperature and Pressure Profiles - Isopropyl Alcohol ......................... 145
B.54 Temperature and Pressure Rate Profiles - Isopropyl Alcohol ................. 145
B.55 Normalized Gas Generation - Maleic Anhydride ................................... 147
B.56 Normalized Gas Generation Rate - Maleic Anhydride ........................... 147
B.57 Temperature and Pressure Profiles - Maleic Anhydride ......................... 148
B.58 Temperature and Pressure Rate Profiles - Maleic Anhydride ................. 148
B.59 Rate Constant Determination - Maleic Anhydride .................................. 149
B.60 Normalized Gas Generation - Manganese Carbonate ............................. 151
B.61 Normalized Gas Generation Rate - Manganese Carbonate ..................... 151

xix
FIGURE Page
B.62 Temperature and Pressure Profiles - Manganese Carbonate ................... 152
B.63 Temperature and Pressure Rate Profiles - Manganese Carbonate .......... 152
B.64 Rate Constant Determination - Manganese Carbonate ........................... 153
B.65 Normalized Gas Generation - Methyl Methacrylate ............................... 155
B.66 Normalized Gas Generation Rate - Methyl Methacrylate ....................... 155
B.67 Temperature and Pressure Profiles - Methyl Methacrylate ..................... 156
B.68 Temperature and Pressure Rate Profiles - Methyl Methacrylate ............ 156
B.69 Rate Constant Determination - Methyl Methacrylate ............................. 157
B.70 Normalized Gas Generation - Nitrobenzene ........................................... 159
B.71 Normalized Gas Generation Rate - Nitrobenzene ................................... 159
B.72 Temperature and Pressure Profiles - Nitrobenzene ................................. 160
B.73 Temperature and Pressure Rate Profiles - Nitrobenzene ........................ 160
B.74 Rate Constant Determination - Nitrobenzene ......................................... 161
B.75 Normalized Gas Generation - Nitroethane .............................................. 163
B.76 Normalized Gas Generation Rate - Nitroethane ..................................... 163
B.77 Temperature and Pressure Profiles - Nitroethane ................................... 164
B.78 Temperature and Pressure Rate Profiles - Nitroethane ........................... 164
B.79 Rate Constant Determination - Nitroethane ............................................ 165
B.80 Normalized Gas Generation - Picoline .................................................... 167
B.81 Normalized Gas Generation Rate - Picoline ........................................... 167
B.82 Temperature and Pressure Profiles - Picoline ......................................... 168

xx
FIGURE Page
B.83 Temperature and Pressure Rate Profiles - Picoline ................................. 168
B.84 Normalized Gas Generation - Polyacrylic Acid ...................................... 170
B.85 Normalized Gas Generation Rate - Polyacrylic Acid ............................. 170
B.86 Temperature and Pressure Profiles - Polyacrylic Acid ........................... 171
B.87 Temperature and Pressure Rate Profiles - Polyacrylic Acid ................... 171
B.88 Normalized Gas Generation - Polyarylamide ......................................... 173
B.89 Normalized Gas Generation Rate - Polyarylamide ................................. 173
B.90 Temperature and Pressure Profiles - Polyarylamide ............................... 174
B.91 Temperature and Pressure Rate Profiles - Polyarylamide ....................... 174
B.92 Normalized Gas Generation - Polyethylene Glycol ................................ 176
B.93 Normalized Gas Generation Rate - Polyethylene Glycol ........................ 176
B.94 Temperature and Pressure Profiles - Polyethylene Glycol ...................... 177
B.95 Temperature and Pressure Rate Profiles - Polyethylene Glycol ............. 177
B.96 Normalized Gas Generation - Polyvinyl Acetate .................................... 179
B.97 Normalized Gas Generation Rate - Polyvinyl Acetate ............................ 179
B.98 Temperature and Pressure Profiles - Polyvinyl Acetate .......................... 180
B.99 Temperature and Pressure Rate Profiles - Polyvinyl Acetate ................. 180
B.100 Normalized Gas Generation - Styrene .................................................... 182
B.101 Normalized Gas Generation Rate - Styrene ............................................ 182
B.102 Temperature and Pressure Profiles - Styrene .......................................... 183
B.103 Temperature and Pressure Rate Profiles - Styrene .................................. 183

xxi
FIGURE Page
B.104 Rate Constant Determination - Styrene ................................................... 184
B.105 Normalized Gas Generation - Vinyl Acetate .......................................... 187
B.106 Normalized Gas Generation Rate - Vinyl Acetate .................................. 187
B.107 Temperature and Pressure Profiles - Vinyl Acetate ................................ 188
B.108 Temperature and Pressure Rate Profiles - Vinyl Acetate ........................ 188
B.109 Rate Constant Determination - Vinyl Acetate ......................................... 189
B.110 Normalized Gas Generation - Water ....................................................... 191
B.111 Normalized Gas Generation Rate - Water ............................................... 191
B.112 Temperature and Pressure Profiles - Water ............................................. 192
B.113 Temperature and Pressure Rate Profiles - Water .................................... 192

xxii
LIST OF TABLES
TABLE Page
2.1 Chemical List from Hofelich et al.1997 .................................................. 7
2.2 MKOPSC List of Reactive Chemicals That Warrant Further Study ...... 8
2.3 Final Chemical List ................................................................................. 10
2.4 Chemical Origin and Purity ..................................................................... 11
2.5 Normal Test Parameters .......................................................................... 15
3.1 Repeatability Study ................................................................................. 24
3.2 The Effect of Volume on the Test Procedures ........................................ 25
3.3 Normalization Study – All Tests ............................................................. 26
3.4 Normalization Study – Explosion Incidents Removed ........................... 27
3.5 Gas Generation Hazard Summary ........................................................... 28
3.6 Gas Generation Rate Hazard Summary .................................................. 30
3.7 Gas Generation Rate Hazard Proposed Cut-Offs .................................... 30
3.8 New Rating Using Combined Methodology ........................................... 34
3.9 Comparison of Rating Systems ............................................................... 35
A.1 Material Properties - Tertbutyl Peroxide 1.3g lg – 1 ............................... 42
A.2 Cell Properties - Tertbutyl Peroxide 1.3g lg – 1 ..................................... 42
A.3 IPD Properties - Tertbutyl Peroxide 1.3g lg – 1 ...................................... 42
A.4 Gas Properties - Tertbutyl Peroxide 1.3g lg – 1 ...................................... 42
A.5 Material Properties - Tertbutyl Peroxide 1.3g lg – 2 ............................... 46
A.6 Cell Properties - Tertbutyl Peroxide 1.3g lg – 2 ..................................... 46

xxiii
TABLE Page
A.7 IPD Properties - Tertbutyl Peroxide 1.3g lg – 2 ...................................... 46
A.8 Gas Properties - Tertbutyl Peroxide 1.3g lg – 2 ...................................... 46
A.9 Material Properties - Tertbutyl Peroxide 1.3g lg – 3 ............................... 50
A.10 Cell Properties - Tertbutyl Peroxide 1.3g lg – 3 ..................................... 50
A.11 IPD Properties - Tertbutyl Peroxide 1.3g lg – 3 ...................................... 50
A.12 Gas Properties - Tertbutyl Peroxide 1.3g lg – 3 ...................................... 50
A.13 Material Properties - Tertbutyl Peroxide 1.3g lg – 4 ............................... 54
A.14 Cell Properties - Tertbutyl Peroxide 1.3g lg – 4 ..................................... 54
A.15 IPD Properties - Tertbutyl Peroxide 1.3g lg – 4 ...................................... 54
A.16 Gas Properties - Tertbutyl Peroxide 1.3g lg – 4 ...................................... 54
A.17 Material Properties - Tertbutyl Peroxide 1.3g lg – 5 ............................... 58
A.18 Cell Properties - Tertbutyl Peroxide 1.3g lg – 5 ..................................... 58
A.19 IPD Properties - Tertbutyl Peroxide 1.3g lg – 5 ...................................... 58
A.20 Gas Properties - Tertbutyl Peroxide 1.3g lg – 5 ...................................... 58
A.21 Material Properties - Tertbutyl Peroxide 1.3g - md ................................ 62
A.22 Cell Properties - Tertbutyl Peroxide 1.3g - md ....................................... 62
A.23 IPD Properties - Tertbutyl Peroxide 1.3g - md ....................................... 62
A.24 Gas Properties - Tertbutyl Peroxide 1.3g - md ........................................ 62
A.25 Material Properties - Tertbutyl Peroxide 1.3g - sm ................................. 66
A.26 Cell Properties - Tertbutyl Peroxide 1.3g - sm ........................................ 66
A.27 IPD Properties - Tertbutyl Peroxide 1.3g - sm ........................................ 66

xxiv
TABLE Page
A.28 Gas Properties - Tertbutyl Peroxide 1.3g - sm ........................................ 66
A.29 Material Properties - Tertbutyl Peroxide 3g - lg ..................................... 70
A.30 Cell Properties - Tertbutyl Peroxide 3g - lg ............................................ 70
A.31 IPD Properties - Tertbutyl Peroxide 3g - lg ............................................ 70
A.32 Gas Properties - Tertbutyl Peroxide 3g - lg ............................................. 70
A.33 Material Properties - Tertbutyl Peroxide 3g - md ................................... 74
A.34 Cell Properties - Tertbutyl Peroxide 3g - md .......................................... 74
A.35 IPD Properties - Tertbutyl Peroxide 3g - md .......................................... 74
A.36 Gas Properties - Tertbutyl Peroxide 3g - md ........................................... 74
A.37 Material Properties - Tertbutyl Peroxide 0.5g - lg .................................. 78
A.38 Cell Properties - Tertbutyl Peroxide 0.5g - lg ......................................... 78
A.39 IPD Properties - Tertbutyl Peroxide 0.5g - lg ......................................... 78
A.40 Gas Properties - Tertbutyl Peroxide 0.5g - lg .......................................... 78
A.41 Material Properties - Tertbutyl Peroxide 0.5g - md ................................ 82
A.42 Cell Properties - Tertbutyl Peroxide 0.5g - md ....................................... 82
A.43 IPD Properties - Tertbutyl Peroxide 0.5g - md ....................................... 82
A.44 Gas Properties - Tertbutyl Peroxide 0.5g - md ........................................ 82
A.45 Material Properties - Tertbutyl Peroxide 0.5g - sm ................................. 86
A.46 Cell Properties - Tertbutyl Peroxide 0.5g - sm ........................................ 86
A.47 IPD Properties - Tertbutyl Peroxide 0.5g - sm ........................................ 86
A.48 Gas Properties - Tertbutyl Peroxide 0.5g - sm ........................................ 86

xxv
TABLE Page
A.49 Material Properties - Tertbutyl Peroxide 6g - lg ..................................... 90
A.50 Cell Properties - Tertbutyl Peroxide 6g - lg ............................................ 90
A.51 IPD Properties - Tertbutyl Peroxide 6g - lg ............................................ 90
A.52 Gas Properties - Tertbutyl Peroxide 6g - lg ............................................. 90
A.53 Material Properties - Tertbutyl Peroxide 0.9g - lg .................................. 94
A.54 Cell Properties - Tertbutyl Peroxide 0.9g - lg ......................................... 94
A.55 IPD Properties - Tertbutyl Peroxide 0.9g - lg ......................................... 94
A.56 Gas Properties - Tertbutyl Peroxide 0.9g - lg .......................................... 94
A.57 Material Properties - Tertbutyl Peroxide 18g - lg ................................... 98
A.58 Cell Properties - Tertbutyl Peroxide 18g - lg .......................................... 98
A.59 IPD Properties - Tertbutyl Peroxide 18g - lg .......................................... 98
A.60 Gas Properties - Tertbutyl Peroxide 18g - lg ........................................... 98
B.1 Material Properties - 1, 2 - Dinitrobenzene ............................................. 103
B.2 Cell Properties - 1, 2 - Dinitrobenzene .................................................... 103
B.3 IPD Properties - 1, 2 - Dinitrobenzene .................................................... 103
B.4 Gas Properties - 1, 2 - Dinitrobenzene .................................................... 103
B.5 Material Properties - 2 - Butanone Peroxide ........................................... 107
B.6 Cell Properties - 2 - Butanone Peroxide .................................................. 107
B.7 IPD Properties - 2 - Butanone Peroxide .................................................. 107
B.8 Gas Properties - 2 - Butanone Peroxide .................................................. 107
B.9 Material Properties - 2, 4 - Dinitroaniline ............................................... 111

xxvi
TABLE Page
B.10 Cell Properties - 2, 4 - Dinitroaniline ...................................................... 111
B.11 IPD Properties - 2, 4 - Dinitroaniline ...................................................... 111
B.12 Gas Properties - 2, 4 - Dinitroaniline ...................................................... 111
B.13 Material Properties - Acrylonitrile .......................................................... 115
B.14 Cell Properties - Acrylonitrile ................................................................. 115
B.15 IPD Properties - Acrylonitrile ................................................................. 115
B.16 Gas Properties – Acrylonitrile ................................................................. 115
B.17 Material Properties - Cumene ................................................................. 119
B.18 Cell Properties - Cumene ........................................................................ 119
B.19 IPD Properties - Cumene ......................................................................... 119
B.20 Gas Properties – Cumene ........................................................................ 119
B.21 Material Properties - Cumene Hydroperoxide ........................................ 123
B.22 Cell Properties - Cumene Hydroperoxide ............................................... 123
B.23 IPD Properties - Cumene Hydroperoxide ............................................... 123
B.24 Gas Properties - Cumene Hydroperoxide ................................................ 123
B.25 Material Properties - Ethylene Oxide ...................................................... 127
B.26 Cell Properties - Ethylene Oxide ............................................................. 127
B.27 IPD Properties - Ethylene Oxide ............................................................. 127
B.28 Gas Properties - Ethylene Oxide ............................................................. 127
B.29 Material Properties - Hydrogen Peroxide - 12.5% .................................. 131
B.30 Cell Properties - Hydrogen Peroxide - 12.5% ......................................... 131

xxvii
TABLE Page
B.31 IPD Properties - Hydrogen Peroxide - 12.5% ......................................... 131
B.32 Gas Properties - Hydrogen Peroxide - 12.5% ......................................... 131
B.33 Material Properties - Hydroxylamine Chloride ....................................... 135
B.34 Cell Properties - Hydroxylamine Chloride .............................................. 135
B.35 IPD Properties - Hydroxylamine Chloride .............................................. 135
B.36 Gas Properties - Hydroxylamine Chloride .............................................. 135
B.37 Material Properties - Isoprene ................................................................. 139
B.38 Cell Properties - Isoprene ........................................................................ 139
B.39 IPD Properties - Isoprene ........................................................................ 139
B.40 Gas Properties - Isoprene ........................................................................ 139
B.41 Material Properties - Isopropyl Alcohol .................................................. 143
B.42 Cell Properties - Isopropyl Alcohol ........................................................ 143
B.43 IPD Properties - Isopropyl Alcohol ......................................................... 143
B.44 Gas Properties - Isopropyl Alcohol ......................................................... 143
B.45 Material Properties - Maleic Anhydride .................................................. 146
B.46 Cell Properties - Maleic Anhydride ........................................................ 146
B.47 IPD Properties - Maleic Anhydride ......................................................... 146
B.48 Gas Properties - Maleic Anhydride ......................................................... 146
B.49 Material Properties - Manganese Carbonate ........................................... 150
B.50 Cell Properties - Manganese Carbonate .................................................. 150
B.51 IPD Properties - Manganese Carbonate .................................................. 150

xxviii
TABLE Page
B.52 Gas Properties - Manganese Carbonate .................................................. 150
B.53 Material Properties - Methyl Methacrylate ............................................. 154
B.54 Cell Properties - Methyl Methacrylate .................................................... 154
B.55 IPD Properties - Methyl Methacrylate .................................................... 154
B.56 Gas Properties - Methyl Methacrylate .................................................... 154
B.57 Material Properties - Nitrobenzene ......................................................... 158
B.58 Cell Properties - Nitrobenzene ................................................................ 158
B.59 IPD Properties - Nitrobenzene ................................................................ 158
B.60 Gas Properties - Nitrobenzene ................................................................. 158
B.61 Material Properties - Nitroethane ............................................................ 162
B.62 Cell Properties - Nitroethane ................................................................... 162
B.63 IPD Properties - Nitroethane ................................................................... 162
B.64 Gas Properties - Nitroethane ................................................................... 162
B.65 Material Properties - Picoline .................................................................. 166
B.66 Cell Properties - Picoline ......................................................................... 166
B.67 IPD Properties - Picoline ......................................................................... 166
B.68 Gas Properties - Picoline ......................................................................... 166
B.69 Material Properties - Polyacrylic Acid .................................................... 169
B.70 Cell Properties - Polyacrylic Acid ........................................................... 169
B.71 IPD Properties - Polyacrylic Acid ........................................................... 169
B.72 Gas Properties - Polyacrylic Acid ........................................................... 169

xxix
TABLE Page
B.73 Material Properties - Polyarylamide ....................................................... 172
B.74 Cell Properties - Polyarylamide .............................................................. 172
B.75 IPD Properties - Polyarylamide ............................................................... 172
B.76 Gas Properties - Polyarylamide ............................................................... 172
B.77 Material Properties - Polyethylene Glycol .............................................. 175
B.78 Cell Properties - Polyethylene Glycol ..................................................... 175
B.79 IPD Properties - Polyethylene Glycol ..................................................... 175
B.80 Gas Properties - Polyethylene Glycol ..................................................... 175
B.81 Material Properties - Polyvinyl Acetate .................................................. 178
B.82 Cell Properties - Polyvinyl Acetate ......................................................... 178
B.83 IPD Properties - Polyvinyl Acetate ......................................................... 178
B.84 Gas Properties - Polyvinyl Acetate ......................................................... 178
B.85 Material Properties - Styrene ................................................................... 181
B.86 Cell Properties - Styrene ......................................................................... 181
B.87 IPD Properties - Styrene .......................................................................... 181
B.88 Gas Properties - Styrene .......................................................................... 181
B.89 Material Properties - Tertbutyl Peroxide 1.3g-avg .................................. 185
B.90 Cell Properties - Tertbutyl Peroxide 1.3g-avg ........................................ 185
B.91 IPD Properties - Tertbutyl Peroxide 1.3g-avg ......................................... 185
B.92 Gas Properties - Tertbutyl Peroxide 1.3g-avg ......................................... 185
B.93 Material Properties - Vinyl Acetate ........................................................ 186

xxx
TABLE Page
B.94 Cell Properties - Vinyl Acetate ............................................................... 186
B.95 IPD Properties - Vinyl Acetate ................................................................ 186
B.96 Gas Properties - Vinyl Acetate ................................................................ 186
B.97 Material Properties - Water ..................................................................... 190
B.98 Cell Properties - Water ............................................................................ 190
B.99 IPD Properties - Water ............................................................................ 190
B.100 Gas Properties - Water ............................................................................ 190

1
1. INTRODUCTION
Reactive chemicals are those chemicals that are inherently unstable and
susceptible to a rapid reaction mechanism, typically decomposition or polymerization.
These chemicals may react alone or with other substances under specific conditions to
liberate heat or gases in an uncontrolled manner. In 2002 the CSB released a study,
Improving Reactive Hazard Management, which compiled twenty years of reactive
chemical incidents (CSB, 2002a). The report estimated that eight serious reactive
chemical incidents occur each year, causing an average of six fatalities per year. The
CSB has affirmed that serious reactive chemical incidents continue to occur at an
alarming rate (CSB, 2009).
While the hazards of reactive chemicals can be severe, they are balanced by a
wide variety of useful chemistries that make them ideal reactants in the synthesis of
pharmaceuticals, plastics, and other products. While some reactive chemicals may be
replaced with inherently safer alternatives, it is still necessary and advantageous to use a
wide range of reactive chemicals in some situations. As such, an emphasis needs to be
placed on the correct management of the hazards from these chemicals.
In order to correctly utilize reactive chemicals, it is necessary to understand the
conditions under which a chemical can undergo an uncontrolled reaction, as well as the
likely results. This can be done in a variety of ways, ranging from expert opinion to
quantitative structure property relationship (QSPR) or calorimetry. These methods range
____________
This thesis follows the style of the Journal of Loss Prevention in the Process Industries.

2
in their predictive ability and testing cost.
Whichever means is used, it becomes necessary to disseminate this information
in a clear and easily understood manner. Lack of awareness of the potential for reactive
hazards is often cited as a cause of reactive chemical incidents (CSB 2009). As a means
of mitigating this problem, several methods of communicating reactive hazards are in
place. Material safety data sheets (MSDS) are often the primary means of hazard
communication for a chemical, and may contain a variety of different measures of the
reactivity of a chemical. Other commonly used methods are the Global Harmonized
System for hazard classification and labeling of chemicals (GHS), the Comprehensive
Environmental Response, Compensation, and Liability Act (CERCLA), and the
Hazardous Materials Information System (HMIS). While all these systems are in place,
one of the most prevalent systems used in the United States is the NFPA 704.
The NFPA 704 standard classifies chemicals according to four separate
categories: Health, Flammability, Instability, and Special Hazards. This results in the
common safety diamond that appears on MSDSs, transports, and chemical labels. The
Dow Fire and Explosion Index (FEI) incorporates the NFPA instability rating as well.
Excluding special hazards, the categories are rated on a five-point scale (between 0 and
4). Though these classifications may be based on quantitative data, they are placed in
categories based on relative boundaries established by the NFPA. The system was
designed to allow workers and first responders an easy method of determining the
relative threat when dealing with these chemicals. Though it is the instability rating of
chief concern in this work, a brief explanation of the other ratings will be provided.

3
Health Hazard: The health hazard rating is based on the LC50 of the substance.
LC50's are determined for inhaled, dermal, and oral routes of entry, and the most severe
category is used to determine the health hazard rating. Only acute effects are considered
for this number.
Flammability Hazard: The flammability rating is primarily based on flash points
for liquids and particle size for dusts. There are special allowances made for chemicals
which easily liberate flammable gasses or have self-contained oxygen.
Special Hazards: There are several special hazards that may be listed in a NFPA
704 diamond. The most common special hazards are water reactive and strong oxidizer.
Radioactive materials and asphyxiants may also be labeled with a special hazard symbol.
Instability: The instability rating was originally called the reactivity rating. In its
first incarnation, the instability rating was largely determined by qualitative assessment
and expert opinion. The rating was augmented in 1997 by a method from Hofelich et al.
(1997) which quantified the rating using a value called the Instantaneous Power Density
(IPD). IPD was defined as the enthalpy of reaction multiplied by the initial reaction rate
determined at 250°C expressed in Watts per milliliter per second. Although testing is
the preferred method of obtaining parameters to determine instability, the NFPA 704
does allow for other methods such as the ASTM CHETAH program.
IPD methodology is effective in quantifying the relative hazards of exothermic
reactions; however, it only considers reactive hazards associated with self-heating.
While the potential to runaway is an important consideration, it is not the only parameter

4
that contributes to an unstable chemical. Another important parameter is the generation
of gas.
Substantial gas generation often occurs during the exothermic decompositions
associated with runaway but can occur during endothermic reactions as well (Barton &
Rogers, 1997). Under IPD methodology these reactions would be classified as having an
instability rating of 0. This failure can lead to unexpected events (Fenlon, 1987). For
example, a lack of awareness of the instability of an endothermic process resulted in
three fatalities in a BP Amoco Polymers nylon production facility (now Solvay
Advanced Polymers, LLC) in March of 2001 (CSB, 2002b). Amodel (a polymer in the
nylon family) was heated prior to being sequestered in a waste tank. As it cooled, the
polymer blocked pressure valves and generated gas. Workers were killed while opening
the tank to clean out the polymer. Although the reaction literature did mention the
possibility of pressure generation at high temperatures, this information was not
adequately communicated to operators. Other incidents involving gas generation can be
found in Bretherick's Handbook (Urben, 2007).
As this incident shows, the current NFPA instability rating is not comprehensive
enough to identify all reactive chemical hazards. In an effort to correct this, researchers
at the Mary K. O’Connor Process Safety Center (MKOPSC) developed a methodology
incorporating gas generation into the instability rating (Carreto-Vasquez et al., 2010).
Carreto-Vasquez et al. sought to use an automatic pressure tracking adiabatic calorimeter
(APTAC) to explore the gas evolution of several long chain polymers. They measured
the maximum pressure as well as the maximum pressure rate and normalized these

5
values based upon the amount of material in the cell and the headspace in the cell.
These processes will both be explored in further detail in the methodology section of this
document.
Carreto-Vasquez et al. used these two measurements in an initial attempt to
designate cut-offs for pressure generation hazards. To do this, they looked at a set of
sample data obtained using an accelerating rate calorimeter (ARC). It was ultimately
determined that the justification for the intervals was minimal and more detailed
measurements were needed. This work seeks to expand upon the work of Carreto-
Vasquez et al. by exploring how a broad range of common chemicals release gas when
tested with an APTAC. The following sections will describe the methods of testing the
chemicals and normalizing the data. The data will then be compiled and conclusions
presented on the new proposed instability rating system.

6
2. METHODOLOGY
2.1 Chemical Selection and Preparation
Properly selecting a sample set is important when trying to draw inferences about
the broad spectrum of available chemicals. The chemicals were principally drawn from
three different lists. The following explains the rationale behind using each list.
There were several different considerations when selecting chemicals for this
study. The first consideration was that chemicals from each of the five current NFPA
classes be selected. As such, a minimum of three chemicals from each class was tested.
A second criterion was that a preference would be given in the selection process to those
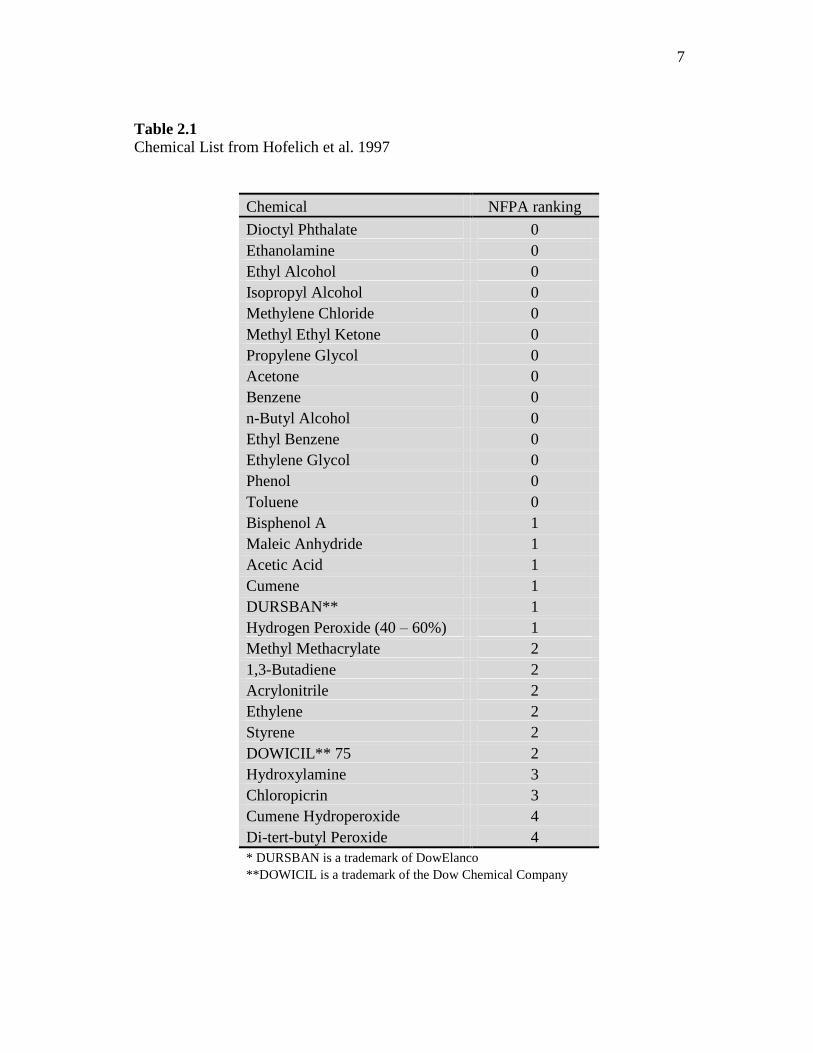
chemicals that are produced and used in bulk across the chemical industry. Hofelich et
al. used similar grounds for compiling their list of chemicals when proposing the IPD
methodology. (Hofelich et al., 1997) Table 2.1 lists the chemicals tested by Hofelich et
al.
The leading concern with the list from Hofelich et al. is a lack of chemicals in the
3 or 4 rating. To correct for this, chemicals that have known reactive hazards were
added to this list. These chemicals were selected from the MKOPSC list of reactive
chemicals that warrant further study, originally presented at the 3rd
NRIFD Symposium
in Mitaka, Tokyo, Japan (Rogers et al., 2004). Table 2.2 lists these chemicals. The
chemicals were chosen based on a history of instability, the presence of reactive
functional groups, or the ability to initiate free-radical reactions.
7
Table 2.1
Chemical List from Hofelich et al. 1997
Chemical NFPA ranking
Dioctyl Phthalate 0
Ethanolamine 0
Ethyl Alcohol 0
Isopropyl Alcohol 0
Methylene Chloride 0
Methyl Ethyl Ketone 0
Propylene Glycol 0
Acetone 0
Benzene 0
n-Butyl Alcohol 0
Ethyl Benzene 0
Ethylene Glycol 0
Phenol 0
Toluene 0
Bisphenol A 1
Maleic Anhydride 1
Acetic Acid 1
Cumene 1
DURSBAN** 1
Hydrogen Peroxide (40 – 60%) 1
Methyl Methacrylate 2
1,3-Butadiene 2
Acrylonitrile 2
Ethylene 2
Styrene 2
DOWICIL** 75 2
Hydroxylamine 3
Chloropicrin 3
Cumene Hydroperoxide 4
Di-tert-butyl Peroxide 4
* DURSBAN is a trademark of DowElanco
**DOWICIL is a trademark of the Dow Chemical Company

8
Table 2.2 MKOPSC List of Reactive Chemicals That Warrant Further Study
9,10-Dibenzocyclopentadiene Di-tert-amyl peroxide Methyl pentadiene
Acetal Di-tert-butyl peroxide Monomethyl ether
Acetic anhydride Dicumyl peroxide Nitric acid
Acetyl chloride Dicyclopentadiene Nitroanisole
Acetylene Dinitroaniline Nitrobenzene
Acrylic Acid Dinitrobenzene Nitrocellulose
Aluminum hydride Dinitrocresol Nitrocyclohexane
Amlene Dinitrotoluene Nitroethane
Amyl nitrate Dintriophenol Nitroglycerine
Barium Hydrides Dioxane Nitropropane
Benzoyl peroxide Dipentene Nitropyrene
Butadiene Divinyl acetylene Pentadiene
Butadiene Ethyl nitrate Pentene
Butene Ethylene Picric acid
Butyne Ethylene glycol dimethyl ether Propylene oxide
Chlorbutadiene Ethylene oxide Silane
Chlorosulfonic acid Glyceryl trinitrate Sulfuric acid
Chlorotrifluoroethylene Hexene t-Butyl alcohol
Cumene hydroperoxide Hydrogen peroxide Tert-butyl hydroperoxide
Cycloheptane Hydroxylamine Tetrahydronaphthalene
Cycloheptatriene Isobutylene Tetramethyl aluminum
Cyclohexane Isohexene Trinitrotoluene
Cyclohexene Isoprene Vinyl acetate
Cyclooctadiene Isopropyl ether Vinyl chloride
Di-borane Methycyclopentane Vinyl ethers
Di-isobutyl Methyl i-butyl ketone Vinyl pyridine
These lists provide an overabundance of chemicals to test, so the next goal
became to limit the choices. The first means of limiting the chemicals was to have an
authoritative value for the NFPA instability rating. NFPA 325M (NFPA 1994) was used
for this purpose. Although all of the chemicals tested could not be found on this list, as
it tends to favor the lower-rated chemicals, the majority of them are present. A final

9
limitation was a preference to test solids and liquids. One gas, ethylene oxide, was
included, but due to testing constraints, solids and liquids were used for all other
samples.
Since this research was conducted primarily to incorporate endothermic reactions
which produce non-condensable gases, it would seem prudent to incorporate chemicals
that exhibit this behavior. Four such chemicals were included. These chemicals were
not found on any of the lists, but were chosen because of knowledge of their
decomposition reactions. These chemicals do increase the number of 0 rated chemicals
in the list, but will be considered a separate class in the analysis. Table 2.3 shows the
final list of chemicals and the respective lists where they can be found. Four chemicals
(picoline, water, ethylene oxide, and 2 – butanone peroxide) were included because they
were previously tested by the MKOPSC and are indicated by the heading ―tested‖.
Chemicals were tested as received to mimic typical storage conditions. The
manufacturing company and purity of each chemical can be found in Table 2.4. While
small amounts of contaminants are known to affect reactive chemicals (Dinh, 2008) it is
unlikely that significant quantities of highly pure compound are stored long-term without
some contamination. Regarding the presence of inhibitors or stabilizers in radical
polymerizers, the choice to use the Heat-Wait-Search mode described below helps to
alleviate these effects by allowing the chemical time to stabilize at a given temperature.

10
Table 2.3
Final Chemical List
Chemical Name Instability DOW
List
MKOPSC
List
NFPA
325M
Endothermic
Potential Tested
Isopropyl Alcohol 0 X X
Picoline 0 X
Polyacrylic Acid 0 X
Polyarylamide 0 X
Polyethylene Glycol 0 X
Polyvinyl Acetate 0 X
Water 0 X
Cumene 1 X X X
Dicyclopentadiene 1 X X
Maleic Anhydride 1 X X
Manganese Carbonate 1 X
Nitrobenzene 1 X X
Acrylonitrile 2 X X X
Isoprene 2 X X
Methyl Methacrylate 2 X X
Styrene 2 X X X
Vinyl Acetate 2 X X
2,4-Dinitroaniline 3 X X
Ethylene Oxide 3 X X X X
Hydrogen Peroxide 3 X X
Hydroxylamine 3 X X
Nitroethane 3 X X
1,2-Dinitrobenzene 4 X X
2-Butanone Peroxide 4 X
Cumene Hydroperoxide 4 X X X
Tertbutyl Peroxide 4 X X

11
Table 2.4
Chemical Origin and Purity
Chemical Name Manufacturer Avg. MW (g) Purity (%)
Isopropyl Alcohol OmniSolv 60.1 99.9
Picoline OmniSolv 93.13 99.9
Polyacrylic Acid Aldrich 450000 99.5
Polyarylamide Aldrich 100000 99
Polyethylene Glycol Aldrich 4600 99
Polyvinyl Acetate Aldrich 100000 99
Cumene Sigma Aldrich 120.19 99.9
Dicyclopentadiene Sigma Aldrich 132.2 99
Maleic Anhydride Sigma Aldrich 98.06 99
Manganese Carbonate Sigma Aldrich 114.95 99.9
Nitrobenzene Sigma Aldrich 123.11 99
Acrylonitrile Aldrich 53.06 99
Isoprene Sigma Aldrich 68.12 99
Methyl Methacrylate Sigma Aldrich 100.12 99
Styrene Aldrich 104.15 99
Vinyl Acetate Sigma Aldrich 86.09 99
2,4-Dinitroaniline Sigma Aldrich 183.12 98
Ethylene Oxide Sigma Aldrich 44.05 99
Hydrogen Peroxide Aldrich 34.01 12.5
Hydroxylamine Aldrich 69.49 99.9
Nitroethane Sigma Aldrich 75.07 98
1,2-Dinitrobenzene Sigma Aldrich 168.11 97
2-Butanone Peroxide Aldrich 210.22 35
Cumene hydroperoxide Aldrich 152.19 88
Tertbutyl Peroxide Sigma Aldrich 146.23 98
2.2 Automatic Pressure Tracking Adiabatic Calorimeter
The Automatic Pressure Tracking Adiabatic Calorimeter (APTAC) was used to
examine each of the chemicals. The APTAC is a closed cell calorimeter that can run in
several different modes that will be described later. The cell is placed inside a 500-mL
pressurized vessel and is heated by four different heaters: top, bottom, side, and tube.

12
Measurements are taken by two pressure transducers and seven thermocouples. The
pressure transducers measure pressure inside the cell as well as the pressure within the
larger vessel. Four of the thermocouples are used to monitor the temperature of the
heaters. The other three thermocouples measure the temperature of the gas inside the
pressure vessel, the temperature of the sample cell's wall, and the temperature of the
sample inside the cell. Pressures can be varied from 10 psia to 2000 psia, while the
temperature range is from 0 to 500°C. The controlling software adjusts settings or will
shut down the experiment if necessary to avoid exceeding these limits.
The APTAC can be operated in a variety of modes. Though only the Heat-Wait-
Search (HWS) mode was used for this research, the other modes will be described
briefly.
Heat-Soak-Search: In this mode the APTAC heats a sample to a desired
temperature for a given time period. If an exotherm is detected during the soak period,
the APTAC will switch to adiabatic mode and follow the exotherm. This mode is often
used to test the efficacy of reaction inhibitors.
Heat Ramp: In this mode the APTAC heats the sample at a given rate until a
given temperature is reached. No exotherm detection is provided in this mode and
heating continues even during a reaction. This could cause heat loss from the sample to
the environment if the self-heating rate exceeds the set heat rate of the experiment. This
mode is often used as a screening tool prior to other, costlier tests being done.
Isothermal: In this mode the APTAC heats the sample to a given temperature
and attempts to maintain that temperature inside the cell for a given time period.

13
Because the APTAC is not fitted with any cooling equipment, this mode is most
effective at temperatures far above room temperature. This mode is often used to
determine reaction kinetics.
HWS: This is the mode that will be used to test the samples for this research. In
this mode the APTAC heats the sample to a given temperature and then attempts to
maintain that temperature for a given time interval. During the wait period, the APTAC
searches for exotherms. An exotherm is detected when the self-heating rate exceeds a
user-selected value (normally 0.05°C/min). If an exotherm is not detected by the end of
the interval the APTAC increases the temperature by a set amount (typically 10°C) and
initiates the waiting period again. This cycle will repeat until a preset temperature cut-
off is reached or an exotherm is detected. If an exotherm is detected by the APTAC it
switches to adiabatic mode. While in the adiabatic mode, the calorimeter seeks to
maintain zero heat flow across the cell boundary. It does this by adjusting the heaters to
maintain the temperature outside the cell at the same level as that of the sample.
Adiabatic mode continues until the self-heating rate falls below the user-defined rate or
the defined temperature limit is reached. If the temperature limit is not reached, the
APTAC switches back to the HWS mode and continues the experiment. Figure 2.1
shows a typical temperature profile from a HWS experiment.
As mentioned previously, the APTAC is a closed cell calorimeter. This means
that there is no material flow in or out of the sample cell. This allows the machine to
accurately measure the amount of gas produced during an experiment. Normally, to
compensate for the high pressures generated in a closed cell test, thick walled cells are

14
needed to prevent failure of the cell. While many calorimeters make use of such cells
(the accelerating rate calorimeter is a prime example), the thickness of the cells can
cause strong deviations from adiabatic conditions. Deviations from adiabatic conditions
create errors because process units approximate adiabatic conditions during runaway
reactions (Wei et al., 2006). The APTAC, however, is able to use thin-walled vessels. It
accomplishes this through pressure tracking. The pressure outside the cell is maintained
at the same level as that inside the cell. If a set pressure difference between the two is
exceeded, safety shut-offs stop the experiment to prevent cell rupture.
Fig. 2.1 Typical Temperature Profile from an APTAC HWS Experiment
(Extracted from the APTAC Manual)

15
The sample cell can be made from a variety of materials: glass, titanium,
hastalloy, tantalum, and stainless steel. Because of the wide variety of chemicals
studied, glass was chosen for the current set of experiments. Although this does make
for thicker walled vessels, it also prevents accidental catalysis that could be caused by
interactions with the various metallurgies. Table 2.5 details the normal parameters that
were used to conduct the tests required for this thesis.
Table 2.5
Normal Test Parameters
Setting Value
Mode HWS
Start Temp. °C 50.00
Final Temp. °C 350.00
Temp. Increment °C 10.00
Cool Down Temp. °C 50.00
Shutdown Temp. °C 390.00
Shutdown Temp. Rate °C/min 400.00
Exotherm Threshold °C/min 0.05
Exotherm Limit °C 390.00
Heating Rate, °C/min 2.00
Max Pressure psia 1050.00
Max Pressure Rate, psi/min 1000.00
Max Pressure Imbalance psi 50.00
2.3 Normalization and Data Manipulation
Pressure and pressure rate data are obtained from the APTAC. These pressures
and pressure rates are then converted to a molar quantity of gas present in the sample
and a molar rate of gas generation using the ideal gas equation of state. Equations 2.1
and 2.2 show the ideal gas equations for number of moles of gas generated and molar
gas generation rate respectively (Iwata & Koseki, 2008).

16
Although gases deviate from the ideal gas law at high pressures, it is still a good
approximation for the quantity of gas formed during decomposition. A more complex
equation of state cannot be used without extensive knowledge about the composition of
the gases formed in the headspace. Although these are assumed to be gases such as
carbon monoxide, carbon dioxide, various NOx compounds and water, without explicit
knowledge of the relative composition of each of these, it is not feasible to use a more
complicated equation of state. Furthermore, as the reaction proceeded the composition
of the gas would change. This would necessitate a change in the constants used in more
complicated equation of state.
In order to utilize the ideal gas equation of state, the volume of the cell must be
known. The volume of the cell is determined by measuring the change in mass from an
empty cell to one filled with water. This volume is then corrected using the initial
volume of sample. Equation 2.3 demonstrates this. The volume of the sample is likely
to change during the trial due to vaporization or thermal expansion of the sample. To
limit the effect of vaporization, the APTAC is run at a minimum pressure of 100 psia.
The change in volume likely contributes to some error in the molar conversions, but is
thought to be small in relation to the overall volume of the cell.
Once the conversion to moles has been made, the values for n must be corrected
for the initial amount of gas in the cell. Equation 2.4 demonstrates this. Variables with
a subscript i in Equations 2.4 and 2.5 indicate that the variable is replaced with its value
at a given time and then evaluated at all other times to create a complete data series and

17
0 indicates the initial value of that variable. Once this is done, the maximum values for
the gas generated (nmax) and gas generation rate (dn/dtmax) are found.
Finally both parameters must be normalized based on the amount of material
considered. The sample will be normalized on a per mol basis. This results in a pseudo-
unitless value for the normalized maximum gas generated (nmaxn) and a pseudo-unitless
rate for the normalized maximum gas generation rate (dn/dtmaxn). Equations 2.6 and 2.7
demonstrate this. These values will be multiplied to yield a gas generation product
(GGP) as shown in Equation 2.8. Further data analysis is developed in the Results and
Discussion section.
Equation 2.1
Equation 2.2
Equation 2.3
Equation 2.4
Equation 2.5
Equation 2.6

18
Equation 2.7
Equation 2.8
2.4 Thermal Properties Determination
The information gathered from the APTAC also allows for an examination of the
thermal properties of the compounds. Both the onset temperature of the decomposition
and the IPD of the material are measures of the instability of the compound. The onset
temperature can easily be determined by examining the temperature output from the
APTAC. The value for the IPD requires more analysis however.
IPD is calculated by finding the enthalpy of the decomposition and the initial
reaction rate of the material calculated at 250°C. This is shown in Equation 2.9. The
enthalpy of the decomposition is shown in Equation 2.10 and is a product of the specific
heat capacity of the material, the phi factor of the experiment, and the difference in the
onset temperature and maximum temperature reached by the compound under self-
heating. All of these can be gathered from the APTAC output except for the phi factor
which is a ratio of the heat capacity of the cell to the heat capacity of the sample material
(Equation 2.11).
The kinetic component of the IPD calculation can be determined by Equation
2.12. The density of the compound is known, and IPD methodology defines the
temperature to equal 250°C. To determine the value for the pre-exponential factor and
the activation energy, the inverse temperature is graphed versus the natural log of the

19
rate constant, k. This creates a line with slope equal to the activation energy and y-
intercept equal to the natural log of the pre-exponential factor as shown in Equation
2.13. Equation 2.14 can be used to determine the values for k.
Equation 2.9
Equation 2.10
Equation 2.11
Equation 2.12
Equation 2.13
Equation 2.14
2.5 Precision and Normalization Studies
It is vital that the APTAC provides consistent results for the amount of gas
generated. To ensure the precision of the APTAC data, multiple trials should be run.
Due to the limited time frame and high number of samples selected for this study it is not
feasible to run each of the compounds a statistically significant number of times. Instead
one compound will be used to determine that the APTAC provides consistent results.
The compound used will be tertbutyl peroxide. This compound was chosen because it is
a well-studied compound with ample literature available for comparison. Moreover, the

20
compound has a low onset temperature that allows tests to be run more quickly. Finally,
the reaction decomposes relatively cleanly, and only the normal cleaning regimen is
required between each trial. Five trials will be conducted under as close to identical
conditions as possible, and the resulting nmaxn and dn/dtmaxn values compared.
In addition to the precision study, a second study will be conducted to determine
whether the volume of the reaction cell causes nmaxn and dn/dtmaxn to vary. Smaller
reaction cells allow smaller sample sizes to be run. This can increase the coverage of the
sample thermocouple. Not having sufficient coverage can lead to results deviating from
adiabatic. Three different volumes of reaction cells will be used.
The final set of tests will be a normalization study. Three different initial
amounts of tertbutyl peroxide will be tested to determine that normalizing the gas
generated and the gas generation rate by the number of moles of sample results in a
consistent value.
2.6 Measured Uncertainties, Calibration, and Cleaning Procedures.
The thermocouples measure the temperature to one thousandth of a degree
Celsius. The pressure transducers measure to one hundredth of a psi. Masses were
measured using a Metler Toledo balance accurate to the one hundredth of a gram.
The thermocouples were calibrated relative to each other to minimize
temperature drift. This was done using the APTAC's calibration software using a clean
glass cell. The calibration was performed every time the sample calorimeter was
changed, the size of the cell was changed, or after every ten trials. Absolute calibration
was handled by submersing the sample in deionized ice water.

21
Between trials the APTAC was cleaned using a variety of different physical and
chemical methods to ensure that there was no cross contamination. The connectors
exposed to chemicals during testing and the pressure lines of the APTAC were cleaned
using water and acetone depending on the polarity of the chemical under consideration.
This was done by physically scrubbing the lines and by flushing superheated solvent
through the lines. In the cases of a more serious clog in the line, a small hand drill was
used to remove the obstruction.
Prior to each trial, a leak test was performed. The location where leaks are of the
most concern is in and out of the sample vessel. The cell was pressurized to above 100
psia and allowed to equilibrate for 30 minutes. At the end of this time the leak rate
should be within the range of +/- 0.01 psi/min. If the pressure rate was outside this
region then the vessel was inspected, modifications were made to fittings, and the leak
test conducted again until the pressure rate fell within the expected range.
The APTAC was tested using a standard sample of 20% tertbutyl peroxide in
toluene prior to any tests being conducted and compared to open literature values to
check for accuracy. Figure 2.2 shows the results of this test and Figure 2.3 shows the
standard results from the ATPAC manual. The tests show good agreement. Figures 2.2
and 2.3 were run in titanium cells. Figure 2.4 shows the same test run in a glass cell.
The maximum heat rate is lower for this test due to the increased phi factor which is to
be expected with glass, but otherwise the tests show good agreement.

22
Fig. 2.2 APTAC Accuracy Check 20% Tertbutyl Peroxide in Toluene (Dinh 2008)
Fig. 2.3 APTAC Standard Curves (Extracted from the ATPAC Manual)
Temperature (°C)

23
Fig. 2.4 APTAC Accuracy Check 20% Tertbutyl Peroxide in Toluene – Glass Cell
Tem
pe
ratu
re R
ate
(°C
/min
)

24
3. RESULTS AND DISCUSSION
3.1 Normalization Study
The five identical tests for DTBP are summarized in Table 3.1. The results and
graphs of individual tests can be found in Appendix A. The tests showed a strong
repeatability. The value for nmaxn shows an average value of 2.20 +/- 0.120. The value
for the dn/dtmaxn is 0.0217 +/- 0.00602 1/min. All errors in this thesis are calculated at a
95% confidence interval using a standard normal Gaussian distribution. The gas
generation rate has a higher relative variability, but this can be attributed to the fact that
the molar rate is two orders of magnitude smaller than the maximum amount of gas
generated. Overall these results show that the APTAC provides consistent
measurements and a low variance.
Table 3.1 Repeatability Study
Name nmax
(mol)
dn/dtmax
(mol/min) nmaxn
dn/dtmaxn
(1/min)
GGP
(1/min)
DTBP 1.3g-1 1.98E-02 9.43E-05 2.18E+00 1.04E-02 2.25E-02
DTBP 1.3g-2 2.15E-02 2.06E-04 2.32E+00 2.21E-02 5.13E-02
DTBP 1.3g-3 2.11E-02 2.43E-04 2.30E+00 2.65E-02 6.11E-02
DTBP 1.3g-4 1.84E-02 2.00E-04 1.98E+00 2.15E-02 4.25E-02
DTBP 1.3g-5 2.10E-02 2.62E-04 2.23E+00 2.78E-02 6.18E-02
averages 2.04E-02 2.01E-04 2.20E+00 2.17E-02 4.79E-02
+/- error 1.13E-03 5.70E-05 1.20E-01 6.02E-03 1.42E-02
The second set of normalization tests was designed to look at the role that the
volume of the sample played on the values obtained for the test. The results are
displayed in Table 3.2 and individual tests are listed in Appendix A. The value for nmaxn

25
shows an average value of 1.76 +/- 0.343. The value for the dn/dtmaxn is 0.0148 +/-
0.00165 1/min. Once again the relative errors for these tests are small. Surprisingly the
value for dn/dtmaxn had a lower error than the previous trial. One would expect the larger
phi factors of the larger containers to play a role in the rate of gas generation, but
perhaps the increased volume for expansion helped to counter this effect. The value for
nmaxn does have a higher variance than the previous set of trials, by a factor of three.
This indicates that changes in the cell size may cause increased error in this quantity. As
such, it would appear that the methodology adequately accounts for the difference in
volume, and any size cell could be used. To decrease the number of variables, however,
the large-sized sample cell will be used for all cases.
Table 3.2 The Effect of Volume on the Test Procedures
Name nmax
(mol)
dn/dtmax
(mol/min) nmaxn
dn/dtmaxn
(1/min)
GGP
(1/min)
DTBP 0.5g-lg 5.32E-03 5.97E-05 1.47E+00 1.65E-02 2.42E-02
DTBP 0.5g-md 7.09E-03 4.77E-05 2.07E+00 1.40E-02 2.90E-02
DTBP 0.5g-sm 6.20E-03 4.96E-05 1.74E+00 1.39E-02 2.43E-02
averages 6.21E-03 5.24E-05 1.76E+00 1.48E-02 2.58E-02
+/- error 1.00E-03 7.32E-06 3.43E-01 1.65E-03 3.06E-03
The final set of preliminary tests was run to determine if the APTAC could
provide consistent results when using different sample sizes. This is primarily a concern
for designing a standardized test across chemical species. The results appear to show
good agreement when a per-mole normalization is used, with one caveat. Multiple tests
with DTBP resulted in an explosion incident which led to ruptured cells. These
explosion incidents resulted in larger than expected pressure and pressure rate values.

26
While the threat of explosion is an important consideration when determining a
chemical's instability, this is already handled by other aspects of the NFPA standard.
Table 3.3 shows the averaged results of all tests run. When the explosion events are
removed the normalization appears to be much more consistent with the previous
findings. Table 3.4 displays these results. The value for nmaxn shows an average value of
1.75 +/- 0.447. The value for the dn/dtmaxn is 0.0168 +/- 0.00541.
It is important to note that many effects such as autocatalysis and phi factor are
dependent on the amount of material in the cell. While neither of these effects is likely
to contribute to variance in the amount of gas generated, it can play a role in the molar
rate of generation. To mitigate these errors, compounds will be run on an equimolar
basis whenever possible.
Table 3.3 Normalization Study – All Tests
Name nmax
(mol)
dn/dtmax
(mol/min) nmaxn
dn/dtmaxn
(1/min)
GGP
(1/min)
DTBP 1.3g-avg 2.04E-02 2.01E-04 2.20E+00 2.17E-02 4.79E-02
DTBP 3g-lg 1.70E-02 1.00E-04 7.85E-01 4.63E-03 3.64E-03
DTBP 0.5g-lg 5.32E-03 5.97E-05 1.47E+00 1.65E-02 2.42E-02
DTBP 6g-lg 2.23E-02 2.78E-02 5.25E-01 6.55E-01 3.44E-01
DTBP 18g-lg 5.84E-02 8.85E-02 4.75E-01 7.20E-01 3.42E-01
DTBP 0.9g-lg 1.00E-02 7.71E-05 1.57E+00 1.21E-02 1.91E-02
averages 2.22E-02 1.95E-02 1.17E+00 2.38E-01 1.30E-01
+/- error 1.51E-02 2.85E-02 5.50E-01 2.79E-01 1.32E-01

27
Table 3.4 Normalization Study – Explosion Incidents Removed
Name nmax
(mol)
dn/dtmax
(mol/min) nmaxn
dn/dtmaxn
(1/min)
GGP
(1/min)
DTBP 0.5g-lg 2.04E-02 2.01E-04 2.20E+00 2.17E-02 4.79E-02
DTBP 0.5g-md 5.32E-03 5.97E-05 1.47E+00 1.65E-02 2.42E-02
DTBP 0.5g-sm 1.00E-02 7.71E-05 1.57E+00 1.21E-02 1.91E-02
averages 1.19E-02 1.13E-04 1.75E+00 1.68E-02 3.04E-02
+/- error 8.71E-03 8.72E-05 4.47E-01 5.41E-03 1.74E-02
3.2 Test Results
The results of the various chemical trials are displayed in Table 3.5. As noted
above, explosion events can give higher values than normal for maximum pressure rate.
In addition, a few chemicals reached the maximum temperature for the APTAC while in
exotherm mode. This prohibits a true measure of the maximum temperature and may
impact the maximum amount of gas generated. Trials with either of these concerns are
included in Appendix B along with the summary tables and graphs used to obtain these
data points.
It should be noted that dicyclopentadiene was removed from the study. This
chemical caused blockages in the APTAC’s pressure lines and created substantial
problems with the pressure transducers, yielding poor-quality pressure data. The
blockage was believed to have been caused by dicyclopentadiene vapors that condensed
in the small pressure tubing leading to the pressure transducer. Extensive cleaning and
refurbishing was needed to remove the blockages, and subsequent trials were deemed
too likely to result in damage to the equipment.

28
Table 3.5 Gas Generation Hazard Summary
Appendix Name nmaxn dn/dtmaxn
(1/min)
GGP
(1/min)
Tonset
(°C)
IPD
(W/mL)
6.1 1, 2 - Dinitrobenzene 1.40E+00 1.21E-01 1.70E-01 190 3.56E-01
6.2 2 - Butanone Peroxide 4.56E-01 1.37E+00 6.25E-01 80 2.22E+06
6.3 2, 4 - Dinitroaniline 4.89E+00 9.40E+00 4.60E+01 180 7.57E-01
6.4 Acrylonitrile 5.21E-01 9.84E-03 5.13E-03 100 8.73E-01
6.5 Cumene 0.00E+00 3.16E-04 0.00E+00 130 1.18E+00
6.6 Cumene Hydroperoxide 1.16E+00 3.56E-01 4.14E-01 120 3.41E+02
6.7 Ethylene Oxide 1.31E+00 1.40E+00 1.84E+00 180 2.36E-03
6.8 Hydrogen Peroxide - 12.5% 2.26E+00 8.14E-01 1.84E+00 140 7.47E+02
6.9 Hydroxylamine Chloride 8.27E-01 5.76E-02 4.76E-02 150 3.63E+04
6.10 Isoprene 3.99E-01 1.18E-03 4.72E-04 90 4.42E-01
6.11 Isopropyl Alcohol 8.14E-01 6.19E-03 5.04E-03 N/A 0.00E+00
6.12 Maleic Anhydride 7.93E-01 2.14E-01 1.70E-01 220 5.32E-02
6.13 Manganese Carbonate 1.27E-01 2.89E-04 3.66E-05 140 7.93E-02
6.14 Methyl Methacrylate 6.24E-01 1.35E-02 8.43E-03 100 2.43E+02
6.15 Nitrobenzene 6.54E-01 1.94E-03 1.27E-03 190 8.84E-01
6.16 Nitroethane 2.38E-01 1.30E-02 3.08E-03 160 1.56E+00
6.17 Picoline 7.04E-01 4.72E-03 3.32E-03 N/A 0.00E+00
6.18 Polyacrylic Acid 1.04E+00 4.08E-03 4.23E-03 260 0.00E+00
6.19 Polyarylamide 5.87E-01 5.66E-03 3.32E-03 300 0.00E+00
6.20 Polyethylene Glycol 3.18E-03 1.19E-03 3.80E-06 290 0.00E+00
6.21 Polyvinyl Acetate 7.65E-01 3.83E-03 2.93E-03 240 0.00E+00
6.22 Styrene 1.24E-01 9.67E-03 1.20E-03 120 3.85E+01
6.23 Tertbutyl Peroxide 1.3g-avg 2.20E+00 2.17E-02 4.79E-02 100 8.88E+01
6.24 Vinyl Acetate 5.52E-01 7.85E-03 4.33E-03 160 4.05E+02
6.25 Water 1.12E-01 3.44E-03 3.84E-04 N/A 0.00E+00
Also are included in Table 3.5 are estimates for the IPD value for each chemical.
These values assume a first order reaction rate and simple one step reaction mechanisms.
These values should not be taken as official values for IPD. A more thorough
examination of each compound's reaction kinetics would be necessary for determining
true values of IPD. This, however, is beyond the scope of the current research. Tonset

29
values are also displayed. Four chemicals did not have onset temperatures within the
temperature range considered and are indicated as such by N/A. Intermediate values and
graphical determination of the activation energy can be found in Appendix B.
3.3 Interpretation of Results
The values for nmaxn vary widely for chemicals known to be very reactive
(nitroethane, for example, would be ranked a 1 under nmaxn) and those known to be
nonreactive (isopropyl alcohol would be a ranked a 3). Moreover, nmaxn is more
susceptible to errors arising from testing conditions. Since nmaxn occurs most frequently
at the end of a test, the maximum testing temperature can affect this quantity. The value
for dn/dtmaxn is found almost exclusively at the beginning of an exotherm. Because of
the length of time of the experiment, the presence of even the smallest air leaks will
affect nmaxn. The gas generation rate, however, would not be significantly altered by a
slow leak (less than 0.01 psi/min). As the gas generation potential is a multiple of nmaxn,
it will be subject to the same errors as nmaxn. For these reasons it was determined that the
gas generation rate will be used to estimate the gas generation hazard.
Table 3.6 lists the compounds in order of their gas generation rate. This could
allow for a set of cut-offs to be made based solely on the gas generation potential. The
cut-offs would be based on order of magnitude of the gas generation potential, and likely
candidates for cut-offs are displayed in Table 3.7 and indicated by color in Table 3.6 as
well.

30
Table 3.6 Gas Generation Rate Hazard Summary
Name dn/dtmaxn
Manganese Carbonate 2.888E-04
Cumene 3.164E-04
Isoprene 1.183E-03
Polyethylene Glycol 1.194E-03
Nitrobenzene 1.938E-03
Water 3.437E-03
Polyvinyl Acetate 3.828E-03
Polyacrylic Acid 4.080E-03
Picoline 4.718E-03
Polyarylamide 5.663E-03
Isopropyl Alcohol 6.194E-03
Vinyl Acetate 7.848E-03
Styrene 9.674E-03
Acrylonitrile 9.841E-03
Nitroethane 1.297E-02
Methyl Methacrylate 1.352E-02
Tertbutyl Peroxide 1.3g – avg 2.166E-02
Hydroxylamine Chloride 5.756E-02
1, 2 – Dinitrobenzene 1.215E-01
Maleic Anhydride 2.144E-01
Cumene Hydroperoxide 3.558E-01
Hydrogen Peroxide - 12.5% 8.138E-01
2 - Butanone Peroxide 1.371E+00
Ethylene Oxide 1.404E+00
2, 4 – Dinitroaniline 9.404E+00
Table 3.7 Gas Generation Rate Hazard Proposed Cut-Offs
Rating Range (1/min)
0 < 1.00E-03
1 1.00E-03 - 5.00E-03
2 5.00E-03 - 1.00E-02
3 1.00E-02 - 2.50E-01
4 > 1.00E+00

31
Although gas generation rate is an important consideration when determining
overall instability, it should not be the sole factor. First, if chemicals are listed solely by
gas generation rate, solvents such as water, isopropyl alcohol and picoline are considered
to be more reactive than nitrobenzene. The solvents have gas generation solely from
evaporation, whereas nitrobenzene undergoes an exothermic decomposition. As such, it
should be considered more reactive.
Secondly, one of the reasons previously cited for conducting this research was
that the current method of determining the NFPA instability rating did not include
pressure generation in its criteria. As such, it is prudent to consider how decomposition
temperature interacts with the gas generation rate to avoid making a similar omission.
There are two different methods to incorporate thermal data. Knorr et al (2007) used
temperature as the determining characteristic of thermal decomposition. IPD, however,
is an accepted method of determining the thermal decomposition hazard. Both of these
methods will be explored below.
Where available, the values for IPD were compared to literature values. Upon
comparison, the approximations used do not appear to adequately represent the values
for IPD. More analysis and likely further experimentation would need to be to
determine the true kinetic parameters for each chemical. Moreover, chemicals such as
polyvinyl acetate have IPD values of zero. If the IPD methodology is used, then the
hazards from endothermic gas generation will continue to be under-ranked. For these
reasons, the IPD values will not be used as a thermal component.

32
The onset temperature can be easily used as a measure of the thermal stability
with a slight modification. Instead of defining the onset temperature as the temperature
at which an exotherm begins, one could define it as the temperature at which any
decomposition begins, whether it is an exothermic or endothermic reaction. With this
modification, Figure 3.1 was created to determine likely regions for the NFPA rankings.
The key indicates the current NFPA ranking, and the y axis is a logarithmic display.
Water, picoline, and isopropyl alcohol do not appear on Figure 3.1 because they do not
have onset temperatures.
Fig. 3.1 Cut-Off Analysis - Onset Temperature and Gas Generation Rate
From Figure 3.1 it appears that cut-offs can be constructed at 130°C and 0.01
1/min. These cut-offs are displayed in Figure 3.2 and Table 3.8. Drawing lines at these
cut-off points creates four different regions corresponding to the ratings 1-4. Low onset

33
temperature and high gas generation rates indicate the greatest instability, while
chemicals with high Tonset and low dn/dtmaxn are the most stable. Since gas generation is
needed for an explosion event, chemicals with high onset temperatures and high gas
generation rates will be grouped into rating 3. Group 2 will include low onset
temperature compounds with a low gas generation rate. Compounds that do not
decompose in the temperature range under consideration are given the rating of 0.
Fig. 3.2 – Cut-Off Determination
This proposed methodology displays good agreement with the previous NFPA
ranking while incorporating the endothermic gas generation of the polymer groups.
These polymer groups would be given a rating of 1. This is a reasonable rating as
endothermic reactions in general should not pose as great a threat as compounds with
strong exothermic behavior.
1 2
3 4

34
Table 3.8
New Rating Using Combined Methodology
Name dn/dtmaxn Tonset Current
NFPA Rating
Water 3.44E-03 0 0
Picoline 4.72E-03 0 0
Isopropyl Alcohol 6.19E-03 0 0
Polyarylamide 5.66E-03 300 0
Polyethylene Glycol 1.19E-03 290 0
Polyacrylic Acid 4.08E-03 260 0
Polyvinyl Acetate 3.83E-03 240 0
Nitrobenzene 1.94E-03 190 1
Vinyl Acetate 7.85E-03 160 2
Manganese Carbonate 2.89E-04 140 1
Cumene 3.16E-04 130 1
Styrene 9.67E-03 120 2
Acrylonitrile 9.84E-03 100 2
Isoprene 1.18E-03 90 2
Maleic Anhydride 2.14E-01 220 1
1, 2 - Dinitrobenzene 1.21E-01 190 4
Ethylene Oxide 1.40E+00 180 3
2, 4 - Dinitroaniline 9.40E+00 180 3
Nitroethane 1.30E-02 160 3
Hydroxylamine Chloride 5.76E-02 150 3
Hydrogen Peroxide - 12.5% 8.14E-01 140 3
Cumene Hydroperoxide 3.56E-01 120 4
Methyl Methacrylate 1.35E-02 100 2
Tertbutyl Peroxide 1.3g - avg 2.17E-02 100 4
2 - Butanone Peroxide 1.37E+00 80 4
The cut-offs were chosen such that the number of compounds belonging to each
rating are approximately the same under each system (with the exception of the
endothermic reactions). Table 3.8 lists the current NFPA rating, and Table 3.9 compares
the number of compounds belonging to each rating under the current rating system and
the proposed system. Sixteen out of twenty-five chemical ratings did not change under

35
the proposed methodology. Of the nine remaining chemicals, four of them are
endothermic gas generators, one chemical (cumene) moved up a rating and two
chemicals (1, 2 dinitrobenzene and vinyl acetate) moved down a rating. The two
remaining chemicals (maleic anhydride and methyl methacrylate) moved up two spots.
The increase in rank is due to large gas generation for both compounds. Further
investigation into the instability of these compounds is likely warranted.
Table 3.9 Comparison of Rating Systems
Rating Current number at
this rating
Proposed number
at this rating
0 7 3
1 4 7
2 5 4
3 5 7
4 4 4
To a certain extent, the boundaries for the different regions are arbitrary and
could be varied slightly. The current IPD methodology for determining NFPA ratings
acknowledges this point. The temperature value of 250°C was chosen as the
temperature at which to calculate IPD specifically because it gave values that
corresponded with accepted rating for the chemicals considered. The proposed
methodology meets this criterion as discussed above.

36
4. CONCLUSIONS AND RECOMMENDATIONS
4.1 Conclusions
This thesis examined the problems associated with defining instability solely in
terms of exothermic decomposition, or more specifically the hazards associated with not
taking into account endothermic reactions that produce significant gaseous components.
To this end, 25 chemicals were tested for the amount of gas generated, the gas
generation rate, and the gas generation product. The onset temperature and IPD of each
chemical were also explored as a measure of thermal instability. The definition for onset
temperature was expanded to include the temperature at which any decomposition
reaction began, not just an exothermic reaction.
It was determined that the onset temperature and the gas generation rate were the
most suitable measures for the instability of each chemical. These parameters were
graphed and divided into quadrants corresponding to the NFPA ratings 1 through 4.
Compounds that did not decompose in the temperature range examined were given the
rating of zero. Compounds with low onset temperature and high gas generation rates
were assigned the rating of 4, while chemicals with high Tonset and low dn/dtmaxn were
assigned a value of 1. Chemicals with high onset temperatures and high gas generation
rates were grouped into rating 3. Group 2 included low onset temperature compounds
with a low gas generation rate. The cut-offs used to define these regions were 130°C
for the onset temperature and 0.01 (1/min) for the gas generation rate.

37
This methodology was found to provide good agreement with the current NFPA
704 Instability rating while taking into consideration those compounds that
endothermicly release gases. Out of 25 compounds, 19 ratings did not change. Four of
the chemicals are endothermic gas generators, one chemical (cumene) moved up a rating
and two chemicals (1, 2 dinitrobenzene and vinyl acetate) moved down a rating. Maleic
anhydride and methyl methacrylate moved up two spots. These two compounds had
much higher gas generation rates than the other chemicals within their former group.
4.2 Recommendations
The following is a list of recommendations for the use of the information
contained in this thesis, as well as suggestions for future work in the area of instability
ratings.
This thesis contains a thorough and consistent data set for a wide range of
compounds. While the vast majority of these chemicals are mid-molecular weight
organic compounds, they comprise a diverse set of functional groups and chemistries.
Future researchers could use this data set as a starting point when conducting more
focused research—for example, exploring nitrated compounds or peroxides in detail.
Many of the compounds in this study were only tested once. As such, there may
be some benefit to repeating some of the experiments in this thesis for replication
purposes, especially those compounds that are border cases or that have drastically
different ratings under the proposed methodology. Future students may want to pursue a
more rigorous equation of state or more detailed kinetic analysis.

38
Access to APTAC equipment is quite rare and few companies operate such a
device. It is therefore prudent to determine another means of obtaining the same
information using equipment that is readily available. Other calorimeters (such as ARC
or closed cell Dewar calorimeters for example) should be tested and a methodology
established so that a wide range of chemical producers can test and establish accurate
ratings. While it is always advisable to thoroughly test new chemicals, it would be
useful to have a means of obtaining the needed onset temperature and molar generation
rate. While ASTM CHETAH can be used to predict the onset temperature, detailed
modeling and analysis would need to be done to construct software to predict the molar
generation rate.
At the same time, it is suggested that smaller sample cells be utilized. This will
allow smaller samples to be tested more quickly. Moreover, this should allow less
expensive and less time-consuming determination of the gas generation rate and onset
temperature. Finally, it may be prudent to switch to testing at atmospheric pressure
instead of at elevated pressure, again to lower costs and provide an easier method of
testing.

39
REFERENCES
Barton, J., & Rogers, R. (1997). Chemical reaction hazards: a guide to safety. Rugby,
UK: Institution of Chemical Engineers.
Carreto-Vasquez, V.H., Hernandez, I. Ng, D., Rogers, W.J., & Mannan, M.S. (2010).
Inclusion of pressure hazards into NFPA 704 instability rating system. Journal
Loss Prevention in the Process Industries, 23, 30–38.
CSB. (2002a). Improve reactive hazard management. Washington, DC, US: Chemical
Safety and Hazard Investigation Board. pp. 1–150.
CSB. (2002b). Thermal decomposition incident – BP Amoco Polymers, Inc, Washington,
DC, US: Chemical Safety and Hazard Investigation Board.
CSB. (2009). T2 Laboritories Inc. runaway reaction. Washington, DC, US: Chemical
Safety and Hazard Investigation Board.
Dinh, L. (2008). Reactivity of ethylene oxide in contact with contaminants. Masters of
Science Thesis, Texas A&M University. College Station.
Fenlon, W. (1987). Calorimetric methods used in the assessment of thermally unstable or
reactive chemicals. Proceedings of the International Symposium on Prevention of
Major Chemical Accidents. New York, US: Center for Chemical Process
Safety/American Institute of Chemical Engineers. 4.27.
Hofelich, T. C., Prine, B. A., & Scheffler, N. E. (1997). A quantitative approach to
determination of NFPA reactivity hazard rating parameters. Process Safety
Progress, 16, 121–125.

40
Iwata, I., & Koseki, H. (2008). Risk evaluation on the basis of pressure rate measured by
automatic pressure tracking adiabatic calorimeter. Journal of Hazardous
Material, 20, 35–41.
Knorr, A., Koseki, H., Li, X-R., Tamura, M., Wehrstedt, K.D., & Whitmore, M.W.
(2007). A closed pressure vessel test (CPVT) screen for explosive properties of
energetic organic compounds. Journal of Loss Prevention in the Process
Industries, 20 (1) 1–6.
Lu, Y., Ng, D., & Mannan, M.S. (2010), Effects of metal contaminants on the reactivity
of hazards of organic peroxides, Proceedings of the 2010 Mary Kay O’Connor
Process Safety Center Symposium. College Station, TX, October 26-28
NFPA (1994). NFPA 325M: Fire hazard properties of flammable liquids gases and
volatile solids. http://www.hazmat.msu.edu/nfpa/ (accessed February 2010).
Rogers, W., Liu, Y., & Mannan, M.S. (2004). Experimental and computational methods
for process safety research. Proceedings of the 3rd NRIFD Symposium. Mitaka,
Tokyo, Japan, March 10-12, pp. 55–66.
Saenz, L., Carreto-Vazquez, V., Liu, L,. Rogers, W.J., Mannan, M.S., & Papadaki, M.
(2009) 2-methylpyridine N-oxidation runaway studies. Journal of Loss
Prevention in the Process Industries, 22. 839–843
Urben, P. G. (2007). Bretherick’s handbook of reactive chemical hazards. Elsevier
Wei, C, Rogers, W., & Mannan, M.S. (2006). Detection of autocatalystic decomposition
behavior of energetic materials using APTAC. J. Thermal Analysis and
Calorimetry, 83, 125–130.

41
APPENDIX A
The following is the data used in the normalization study. Each chemical is
listed followed by pertinent information in four summary tables. Normal experiment
parameters were used except where indicated. Each chemical is accompanied by five
graphs. These graphs are the profiles for normalized gas generation, normalized gas
generation rate, temperature and pressure, temperature and pressure rate, and rate
constant determination.

42
A.1 Tertbutyl Peroxide 1.3g lg – 1
Table A.1 Material Properties - Tertbutyl Peroxide 1.3g lg – 1
Property Value
ms (g) 1.33
ρs (g/mL) 0.796
Cs (J/(g*K)) 1.499
MW (g/mol) 146.23
Table A.2
Cell Properties - Tertbutyl Peroxide 1.3g lg – 1
Property Value
mcell (g) 51.74
Vcell (mL) 96.90
φ 22.80
Table A.3
IPD Properties - Tertbutyl Peroxide 1.3g lg – 1
Property Value
A (1/s) 8.411E+06
EA (J/(mol*K)) 8.472E+04
Tonset (°C) 100
Tmax (°C) 165
ΔH (J/g) 2221.
IPD (W/ml) 51.65
Table A.4
Gas Properties - Tertbutyl Peroxide 1.3g lg – 1
Property Value
nmax (mol) 1.979E-02
dn/dtmax (mol/min) 9.426E-05
nmaxn 2.176E+00
dn/dtmaxn (1/min) 1.036E-02
GGP (1/min) 2.255E-02

43
Fig. A.1 Normalized Gas Generation - Tertbutyl Peroxide 1.3g lg – 1
Fig. A.2 Normalized Gas Generation Rate - Tertbutyl Peroxide 1.3g lg – 1

44
Fig. A.3 Temperature and Pressure Profiles - Tertbutyl Peroxide 1.3g lg – 1
Fig. A.4 Temperature and Pressure Rate Profiles - Tertbutyl Peroxide 1.3g lg – 1

45
Fig. A.5 Rate Constant Determination - Tertbutyl Peroxide 1.3g lg – 1

46
A.2 Tertbutyl Peroxide 1.3g lg – 2
Table A.5 Material Properties - Tertbutyl Peroxide 1.3g lg – 2
Property Value
ms (g) 1.36
ρs (g/mL) 0.796
Cs (J/(g*K)) 1.499
MW (g/mol) 146.23
Table A.6
Cell Properties - Tertbutyl Peroxide 1.3g lg – 2
Property Value
mcell (g) 51.74
Vcell (mL) 96.90
φ 22.32
Table A.7
IPD Properties - Tertbutyl Peroxide 1.3g lg – 2
Property Value
A (1/s) 9.704E+06
EA (J/(mol*K)) 8.497E+04
Tonset (°C) 100
Tmax (°C) 177
ΔH (J/g) 2576.
IPD (W/ml) 65.38
Table A.8
Gas Properties - Tertbutyl Peroxide 1.3g lg – 2
Property Value
nmax (mol) 2.154E-02
dn/dtmax (mol/min) 2.059E-04
nmaxn 2.316E+00
dn/dtmaxn (1/min) 2.213E-02
GGP (1/min) 5.127E-02

47
Fig. A.6 Normalized Gas Generation - Tertbutyl Peroxide 1.3g lg – 2
Fig. A.7 Normalized Gas Generation Rate - Tertbutyl Peroxide 1.3g lg – 2

48
Fig. A.8 Temperature and Pressure Profiles - Tertbutyl Peroxide 1.3g lg – 2
Fig. A.9 Temperature and Pressure Rate Profiles - Tertbutyl Peroxide 1.3g lg – 2

49
Fig. A.10 Rate Constant Determination - Tertbutyl Peroxide 1.3g lg – 2

50
A.3 Tertbutyl Peroxide 1.3g lg – 3
Table A.9 Material Properties - Tertbutyl Peroxide 1.3g lg – 3
Property Value
ms (g) 1.34
ρs (g/mL) 0.796
Cs (J/(g*K)) 1.499
MW (g/mol) 146.23
Table A.10
Cell Properties - Tertbutyl Peroxide 1.3g lg – 3
Property Value
mcell (g) 51.74
Vcell (mL) 96.90
φ 22.637
Table A.11
IPD Properties - Tertbutyl Peroxide 1.3g lg – 3
Property Value
A (1/s) 7.500E+07
EA (J/(mol*K)) 9.159E+04
Tonset (°C) 100
Tmax (°C) 178
ΔH (J/g) 2647.
IPD (W/ml) 113.17
Table A.12
Gas Properties - Tertbutyl Peroxide 1.3g lg – 3
Property Value
nmax (mol) 2.112E-02
dn/dtmax (mol/min) 2.431E-04
nmaxn 2.304E+00
dn/dtmaxn (1/min) 2.653E-02
GGP (1/min) 6.112E-02

51
Fig. A.11 Normalized Gas Generation - Tertbutyl Peroxide 1.3g lg – 3
Fig. A.12 Normalized Gas Generation Rate - Tertbutyl Peroxide 1.3g lg – 3

52
Fig. A.13 Temperature and Pressure Profiles - Tertbutyl Peroxide 1.3g lg – 3
Fig. A.14 Temperature and Pressure Rate Profiles - Tertbutyl Peroxide 1.3g lg – 3

53
Fig. A.15 Rate Constant Determination - Tertbutyl Peroxide 1.3g lg – 3

54
A.4 Tertbutyl Peroxide 1.3g lg – 4
Table A.13 Material Properties - Tertbutyl Peroxide 1.3g lg – 4
Property Value
ms (g) 1.36
ρs (g/mL) 0.796
Cs (J/(g*K)) 1.499
MW (g/mol) 146.23
Table A.14
Cell Properties - Tertbutyl Peroxide 1.3g lg – 4
Property Value
mcell (g) 51.74
Vcell (mL) 96.90
φ 22.32
Table A.15
IPD Properties - Tertbutyl Peroxide 1.3g lg – 4
Property Value
A (1/s) 6.013E+07
EA (J/(mol*K)) 9.093E+04
Tonset (°C) 100
Tmax (°C) 178
ΔH (J/g) 2610.
IPD (W/ml) 104.23
Table A.16
Gas Properties - Tertbutyl Peroxide 1.3g lg – 4
Property Value
nmax (mol) 1.839E-02
dn/dtmax (mol/min) 2.001E-04
nmaxn 1.977E+00
dn/dtmaxn (1/min) 2.152E-02
GGP (1/min) 4.254E-02
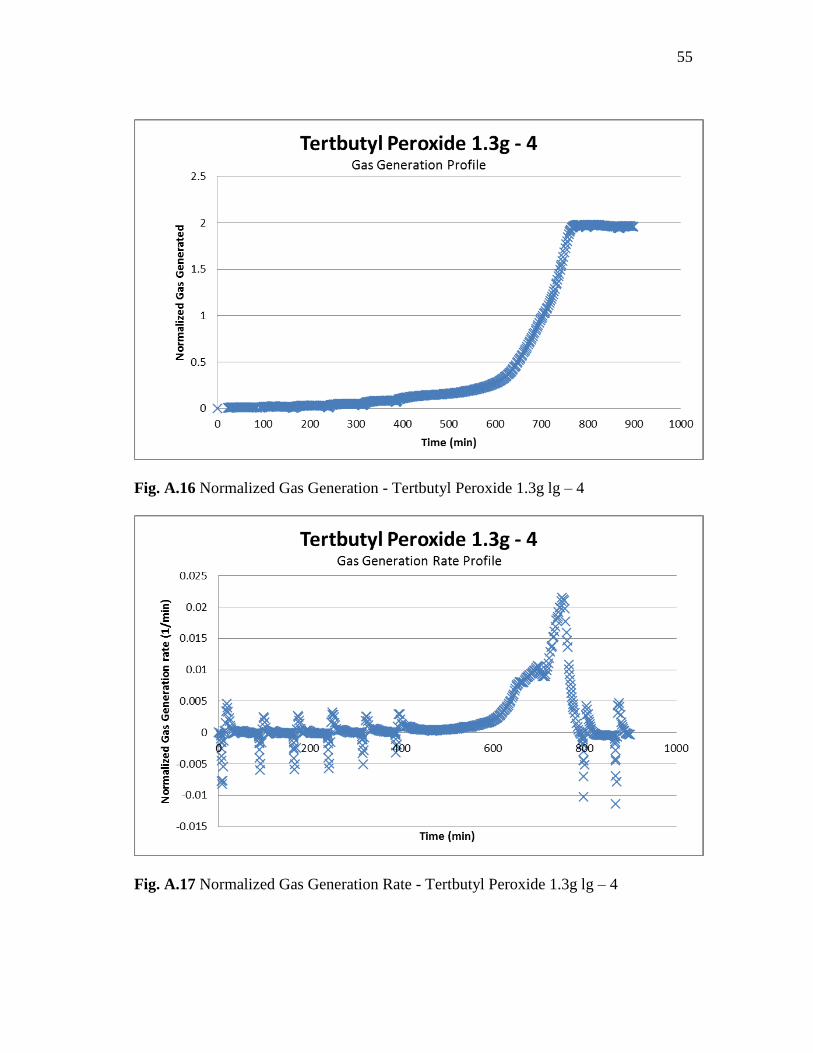
55
Fig. A.16 Normalized Gas Generation - Tertbutyl Peroxide 1.3g lg – 4
Fig. A.17 Normalized Gas Generation Rate - Tertbutyl Peroxide 1.3g lg – 4

56
Fig. A.18 Temperature and Pressure Profiles - Tertbutyl Peroxide 1.3g lg – 4
Fig. A.19 Temperature and Pressure Rate Profiles - Tertbutyl Peroxide 1.3g lg – 4

57
Fig. A.20 Rate Constant Determination - Tertbutyl Peroxide 1.3g lg – 4

58
A.5 Tertbutyl Peroxide 1.3g lg – 5
Table A.17 Material Properties - Tertbutyl Peroxide 1.3g lg – 5
Property Value
ms (g) 1.38
ρs (g/mL) 0.796
Cs (J/(g*K)) 1.499
MW (g/mol) 146.23
Table A.18
Cell Properties - Tertbutyl Peroxide 1.3g lg – 5
Property Value
mcell (g) 51.74
Vcell (mL) 96.90
φ 22.01
Table A.19
IPD Properties - Tertbutyl Peroxide 1.3g lg – 5
Property Value
A (1/s) 8.052E+07
EA (J/(mol*K)) 9.187E+04
Tonset (°C) 100
Tmax (°C) 177
ΔH (J/g) 2540.
IPD (W/ml) 109.49
Table A.20
Gas Properties - Tertbutyl Peroxide 1.3g lg – 5
Property Value
nmax (mol) 2.100E-02
dn/dtmax (mol/min) 2.620E-04
nmaxn 2.225E+00
dn/dtmaxn (1/min) 2.776E-02
GGP (1/min) 6.178E-02

59
Fig. A.21 Normalized Gas Generation - Tertbutyl Peroxide 1.3g lg – 5
Fig. A.22 Normalized Gas Generation Rate - Tertbutyl Peroxide 1.3g lg – 5

60
Fig. A.23 Temperature and Pressure Profiles - Tertbutyl Peroxide 1.3g lg – 5
Fig. A.24 Temperature and Pressure Rate Profiles - Tertbutyl Peroxide 1.3g lg – 5

61
Fig. A.25 Rate Constant Determination - Tertbutyl Peroxide 1.3g lg – 5

62
A.6 Tertbutyl Peroxide 1.3g – md
Table A.21 Material Properties - Tertbutyl Peroxide 1.3g - md
Property Value
ms (g) 1.36
ρs (g/mL) 0.796
Cs (J/(g*K)) 1.499
MW (g/mol) 146.23
Table A.22
Cell Properties - Tertbutyl Peroxide 1.3g - md
Property Value
mcell (g) 35.21
Vcell (mL) 43.68
φ 15.51
Table A.23
IPD Properties - Tertbutyl Peroxide 1.3g - md
Property Value
A (1/s) 2.715E+09
EA (J/(mol*K)) 1.024E+05
Tonset (°C) 90
Tmax (°C) 200
ΔH (J/g) 2557.
IPD (W/ml) 327.91
Table A.24
Gas Properties - Tertbutyl Peroxide 1.3g - md
Property Value
nmax (mol) 1.824E-02
dn/dtmax (mol/min) 2.590E-03
nmaxn 1.961E+00
dn/dtmaxn (1/min) 2.784E-01
GGP (1/min) 5.460E-01

63
Fig. A.26 Normalized Gas Generation - Tertbutyl Peroxide 1.3g - md
Fig. A.27 Normalized Gas Generation Rate - Tertbutyl Peroxide 1.3g - md

64
Fig. A.28 Temperature and Pressure Profiles - Tertbutyl Peroxide 1.3g - md
Fig. A.29 Temperature and Pressure Rate Profiles - Tertbutyl Peroxide 1.3g - md

65
Fig. A.30 Rate Constant Determination - Tertbutyl Peroxide 1.3g - md

66
A.7 Tertbutyl Peroxide 1.3g – sm
Table A.25 Material Properties - Tertbutyl Peroxide 1.3g - sm
Property Value
ms (g) 1.32
ρs (g/mL) 0.796
Cs (J/(g*K)) 1.499
MW (g/mol) 146.23
Table A.26
Cell Properties - Tertbutyl Peroxide 1.3g - sm
Property Value
mcell (g) 23.19
Vcell (mL) 31.02
φ 10.84
Table A.27
IPD Properties - Tertbutyl Peroxide 1.3g - sm
Property Value
A (1/s) 1.869E+10
EA (J/(mol*K)) 1.066E+05
Tonset (°C) 80
Tmax (°C) 198
ΔH (J/g) 1918.
IPD (W/ml) 648.52
Table A.28
Gas Properties - Tertbutyl Peroxide 1.3g - sm
Property Value
nmax (mol) 1.645E-02
dn/dtmax (mol/min) 5.030E-02
nmaxn 1.823E+00
dn/dtmaxn (1/min) 5.572E+00
GGP (1/min) 1.016E+01

67
Fig. A.31 Normalized Gas Generation - Tertbutyl Peroxide 1.3g - sm
Fig. A.32 Normalized Gas Generation Rate - Tertbutyl Peroxide 1.3g - sm

68
Fig. A.33 Temperature and Pressure Profiles - Tertbutyl Peroxide 1.3g - sm
Fig. A.34 Temperature and Pressure Rate Profiles - Tertbutyl Peroxide 1.3g - sm

69
Fig. A.35 Rate Constant Determination - Tertbutyl Peroxide 1.3g - sm

70
A.8 Tertbutyl Peroxide 3g – lg
Table A.29 Material Properties - Tertbutyl Peroxide 3g - lg
Property Value
ms (g) 3.17
ρs (g/mL) 0.796
Cs (J/(g*K)) 1.499
MW (g/mol) 146.23
Table A.30
Cell Properties - Tertbutyl Peroxide 3g - lg
Property Value
mcell (g) 55.42
Vcell (mL) 92.69
φ 10.80
Table A.31
IPD Properties - Tertbutyl Peroxide 3g - lg
Property Value
A (1/s) 8.928E+27
EA (J/(mol*K)) 2.257E+05
Tonset (°C) 80
Tmax (°C) 198
ΔH (J/g) 1910.
IPD (W/ml) 3.949E+08
Table A.32
Gas Properties - Tertbutyl Peroxide 3g - lg
Property Value
nmax (mol) 1.702E-02
dn/dtmax (mol/min) 1.004E-04
nmaxn 7.853E-01
dn/dtmaxn (1/min) 4.631E-03
GGP (1/min) 3.636E-03

71
Fig. A.36 Normalized Gas Generation - Tertbutyl Peroxide 3g - lg
Fig. A.37 Normalized Gas Generation Rate - Tertbutyl Peroxide 3g - lg

72
Fig. A.38 Temperature and Pressure Profiles - Tertbutyl Peroxide 3g - lg
Fig. A.39 Temperature and Pressure Rate Profiles - Tertbutyl Peroxide 3g - lg

73
Fig. A.40 Rate Constant Determination - Tertbutyl Peroxide 3g - lg

74
A.9 Tertbutyl Peroxide 3g – md
Table A.33 Material Properties - Tertbutyl Peroxide 3g - md
Property Value
ms (g) 3.19
ρs (g/mL) 0.796
Cs (J/(g*K)) 1.499
MW (g/mol) 146.23
Table A.34
Cell Properties - Tertbutyl Peroxide 3g - md
Property Value
mcell (g) 38.8
Vcell (mL) 42.15
φ 7.816
Table A.35
IPD Properties - Tertbutyl Peroxide 3g - md
Property Value
A (1/s) 4.569E+15
EA (J/(mol*K)) 1.488E+05
Tonset (°C) 100
Tmax (°C) 220
ΔH (J/g) 1406.
IPD (W/ml) 7116.
Table A.36 Gas Properties - Tertbutyl Peroxide 3g - md
Property Value
nmax (mol) 2.033E-02
dn/dtmax (mol/min) 5.475E-02
nmaxn 9.319E-01
dn/dtmaxn (1/min) 2.510E+00
GGP (1/min) 2.339E+00

75
Fig. A.41 Normalized Gas Generation - Tertbutyl Peroxide 3g - md
Fig. A.42 Normalized Gas Generation Rate - Tertbutyl Peroxide 3g - md

76
Fig. A.43 Temperature and Pressure Profiles - Tertbutyl Peroxide 3g - md
Fig. A.44 Temperature and Pressure Rate Profiles - Tertbutyl Peroxide 3g - md

77
Fig. A.45 Rate Constant Determination - Tertbutyl Peroxide 3g - md

78
A.10 Tertbutyl Peroxide 0.5g - lg
Table A.36 Material Properties - Tertbutyl Peroxide 0.5g - lg
Property Value
ms (g) 0.53
ρs (g/mL) 0.796
Cs (J/(g*K)) 1.499
MW (g/mol) 146.23
Table A.37
Cell Properties - Tertbutyl Peroxide 0.5g - lg
Property Value
mcell (g) 51.74
Vcell (mL) 96.90
φ 55.71
Table A.38
IPD Properties - Tertbutyl Peroxide 0.5g - lg
Property Value
A (1/s) 1.269E+03
EA (J/(mol*K)) 5.670E+04
Tonset (°C) 120
Tmax (°C) 170
ΔH (J/g) 4175.
IPD (W/ml) 9.195
Table A.39
Gas Properties - Tertbutyl Peroxide 0.5g - lg
Property Value
nmax (mol) 5.323E-03
dn/dtmax (mol/min) 5.975E-05
nmaxn 1.469E+00
dn/dtmaxn (1/min) 1.648E-02
GGP (1/min) 2.421E-02

79
Fig. A.46 Normalized Gas Generation - Tertbutyl Peroxide 0.5g - lg
Fig. A.47 Normalized Gas Generation Rate - Tertbutyl Peroxide 0.5g - lg

80
Fig. A.48 Temperature and Pressure Profiles - Tertbutyl Peroxide 0.5g - lg
Fig. A.49 Temperature and Pressure Rate Profiles - Tertbutyl Peroxide 0.5g - lg

81
Fig. A.50 Rate Constant Determination - Tertbutyl Peroxide 0.5g - lg

82
A.11 Tertbutyl Peroxide 0.5g - md
Table A.40 Material Properties - Tertbutyl Peroxide 0.5g - md
Property Value
ms (g) 0.5
ρs (g/mL) 0.796
Cs (J/(g*K)) 1.499
MW (g/mol) 146.23
Table A.41
Cell Properties - Tertbutyl Peroxide 0.5g - md
Property Value
mcell (g) 35.96
Vcell (mL) 42.09
φ 41.30
Table A.43
IPD Properties - Tertbutyl Peroxide 0.5g - md
Property Value
A (1/s) 2.786E+09
EA (J/(mol*K)) 9.938E+04
Tonset (°C) 90
Tmax (°C) 140
ΔH (J/g) 3095.
IPD (W/ml) 820.12
Table A.44
Gas Properties - Tertbutyl Peroxide 0.5g - md
Property Value
nmax (mol) 7.093E-03
dn/dtmax (mol/min) 4.772E-05
nmaxn 2.075E+00
dn/dtmaxn (1/min) 1.396E-02
GGP (1/min) 2.895E-02

83
Fig. A.51 Normalized Gas Generation - Tertbutyl Peroxide 0.5g - md
Fig. A.52 Normalized Gas Generation Rate - Tertbutyl Peroxide 0.5g - md

84
Fig. A.53 Temperature and Pressure Profiles - Tertbutyl Peroxide 0.5g - md
Fig. A.54 Temperature and Pressure Rate Profiles - Tertbutyl Peroxide 0.5g - md

85
Fig. A.55 Rate Constant Determination - Tertbutyl Peroxide 0.5g - md

86
A.12 Tertbutyl Peroxide 0.5g - sm
Table A.45 Material Properties - Tertbutyl Peroxide 0.5g - sm
Property Value
ms (g) 0.52
ρs (g/mL) 0.796
Cs (J/(g*K)) 1.499
MW (g/mol) 146.23
Table A.46
Cell Properties - Tertbutyl Peroxide 0.5g - sm
Property Value
mcell (g) 23.65
Vcell (mL) 30.87
φ 26.47
Table A.47
IPD Properties - Tertbutyl Peroxide 0.5g - sm
Property Value
A (1/s) 2.728E+06
EA (J/(mol*K)) 7.917E+04
Tonset (°C) 90
Tmax (°C) 150
ΔH (J/g) 2382.
IPD (W/ml) 64.39
Table A.48
Gas Properties - Tertbutyl Peroxide 0.5g - sm
Property Value
nmax (mol) 6.204E-03
dn/dtmax (mol/min) 4.961E-05
nmaxn 1.745E+00
dn/dtmaxn (1/min) 1.395E-02
GGP (1/min) 2.434E-02

87
Fig. A.56 Normalized Gas Generation - Tertbutyl Peroxide 0.5g - sm
Fig. A.57 Normalized Gas Generation Rate - Tertbutyl Peroxide 0.5g - sm

88
Fig. A.58 Temperature and Pressure Profiles - Tertbutyl Peroxide 0.5g - sm
Fig. A.59 Temperature and Pressure Rate Profiles - Tertbutyl Peroxide 0.5g - sm

89
Fig. A.60 Rate Constant Determination - Tertbutyl Peroxide 0.5g - sm

90
A.13 Tertbutyl Peroxide 6g – lg
Table A.49 Material Properties - Tertbutyl Peroxide 6g - lg
Property Value
ms (g) 6.2
ρs (g/mL) 0.796
Cs (J/(g*K)) 1.499
MW (g/mol) 146.23
Table A.50
Cell Properties - Tertbutyl Peroxide 6g - lg
Property Value
mcell (g) 52.54
Vcell (mL) 93.30
φ 5.749
Table A.51
IPD Properties - Tertbutyl Peroxide 6g - lg
Property Value
A (1/s) 7.547E+22
EA (J/(mol*K)) 1.877E+05
Tonset (°C) 80
Tmax (°C) 160
ΔH (J/g) 689.4
IPD (W/ml) 7.452E+06
Table A.52
Gas Properties - Tertbutyl Peroxide 6g - lg
Property Value
nmax (mol) 2.226E-02
dn/dtmax (mol/min) 2.779E-02
nmaxn 5.250E-01
dn/dtmaxn (1/min) 6.553E-01
GGP (1/min) 3.441E-01

91
Fig. A.61 Normalized Gas Generation - Tertbutyl Peroxide 6g - lg
Fig. A.62 Normalized Gas Generation Rate - Tertbutyl Peroxide 6g - lg

92
Fig. A.63 Temperature and Pressure Profiles - Tertbutyl Peroxide 6g - lg
Fig. A.64 Temperature and Pressure Rate Profiles - Tertbutyl Peroxide 6g - lg

93
Fig. A.65 Rate Constant Determination - Tertbutyl Peroxide 6g - lg

94
A.14 Tertbutyl Peroxide 0.9g - lg
Table A.53 Material Properties - Tertbutyl Peroxide 0.9g - lg
Property Value
ms (g) 0.93
ρs (g/mL) 0.796
Cs (J/(g*K)) 1.499
MW (g/mol) 146.23
Table A.54
Cell Properties - Tertbutyl Peroxide 0.9g - lg
Property Value
mcell (g) 51.74
Vcell (mL) 96.90
φ 32.18
Table A.55
IPD Properties - Tertbutyl Peroxide 0.9g - lg
Property Value
A (1/s) 3.795E+09
EA (J/(mol*K)) 1.052E+05
Tonset (°C) 100
Tmax (°C) 160
ΔH (J/g) 2894.
IPD (W/ml) 274.0
Table A.56
Gas Properties - Tertbutyl Peroxide 0.9g - lg
Property Value
nmax (mol) 1.000E-02
dn/dtmax (mol/min) 7.707E-05
nmaxn 1.573E+00
dn/dtmaxn (1/min) 1.212E-02
GGP (1/min) 1.906E-02

95
Fig. A.66 Normalized Gas Generation - Tertbutyl Peroxide 0.9g - lg
Fig. A.67 Normalized Gas Generation Rate - Tertbutyl Peroxide 0.9g - lg

96
Fig. A.68 Temperature and Pressure Profiles - Tertbutyl Peroxide 0.9g - lg
Fig. A69 Temperature and Pressure Rate Profiles - Tertbutyl Peroxide 0.9g - lg

97
Fig. A.70 Rate Constant Determination - Tertbutyl Peroxide 0.9g - lg

98
A.15 Tertbutyl Peroxide 18g - lg
Table A.57 Material Properties - Tertbutyl Peroxide 18g - lg
Property Value
ms (g) 17.99
ρs (g/mL) 0.796
Cs (J/(g*K)) 1.499
MW (g/mol) 146.23
Table A.58
Cell Properties - Tertbutyl Peroxide 18g - lg
Property Value
mcell (g) 53.01
Vcell (mL) 93.99
φ 2.651
Table A.59
IPD Properties - Tertbutyl Peroxide 18g - lg
Property Value
A (1/s) 5.917E+14
EA (J/(mol*K)) 1.327E+05
Tonset (°C) 80
Tmax (°C) 220
ΔH (J/g) 556.4
IPD (W/ml) 1.473E+04
Table A.60
Gas Properties - Tertbutyl Peroxide 18g - lg
Property Value
nmax (mol) 5.840E-02
dn/dtmax (mol/min) 8.854E-02
nmaxn 4.747E-01
dn/dtmaxn (1/min) 7.197E-01
GGP (1/min) 3.417E-01

99
Fig. A.71 Normalized Gas Generation - Tertbutyl Peroxide 18g - lg
Fig. A.72 Normalized Gas Generation Rate - Tertbutyl Peroxide 18g - lg

100
Fig. A.73 Temperature and Pressure Profiles - Tertbutyl Peroxide 18g - lg
Fig. A.74 Temperature and Pressure Rate Profiles - Tertbutyl Peroxide 18g - lg

101
Fig. A.75 Rate Constant Determination - Tertbutyl Peroxide 18g - lg

102
APPENDIX B
The following is the data used in the main study to determine cutoffs. Each
chemical is listed followed by pertinent information in four summary tables. Normal
experiment parameters were used except where indicated. Each chemical is
accompanied by five graphs. These graphs are the profiles for normalized gas
generation, normalized gas generation rate, temperature and pressure, temperature and
pressure rate, and rate constant determination.

103
B.1 1, 2 - Dinitrobenzene
Table B.1 Material Properties - 1, 2 - Dinitrobenzene
Property Value
ms (g) 0.83
ρs (g/mL) 1.31
Cs (J/(g*K)) 1.192
MW (g/mol) 168.107
Table B.1
Cell Properties - 1, 2 - Dinitrobenzene
Property Value
mcell (g) 50.87
Vcell (mL) 97.53
φ 44.19
Table B.1
IPD Properties - 1, 2 - Dinitrobenzene
Property Value
A (1/s) 1.086E+02
EA (J/(mol*K)) 6.676E+04
Tonset (°C) 190
Tmax (°C) 410
ΔH (J/g) 1.158E+04
IPD (W/ml) 0.3564
Table B.1
Gas Properties - 1, 2 - Dinitrobenzene
Property Value
nmax (mol) 6.910E-03
dn/dtmax (mol/min) 5.998E-04
nmaxn 1.399E+00
dn/dtmaxn (1/min) 1.215E-01
GGP (1/min) 1.700E-01
Note – This compound exhibited an explosion event.

104
Fig. B.1 Normalized Gas Generation - 1, 2 - Dinitrobenzene
Fig. B.2 Normalized Gas Generation Rate - 1, 2 - Dinitrobenzene

105
Fig. B.3 Temperature and Pressure Profiles - 1, 2 - Dinitrobenzene
Fig. B.4 Temperature and Pressure Rate Profiles - 1, 2 - Dinitrobenzene

106
Fig. B.5 Rate Constant Determination - 1, 2 - Dinitrobenzene

107
B.2 2 - Butanone Peroxide
Table B.5 Material Properties - 2 - Butanone Peroxide
Property Value
ms (g) 8.13
ρs (g/mL) 1.053
Cs (J/(g*K)) 2.3
MW (g/mol) 210.22
Table B.6
Cell Properties - 2 - Butanone Peroxide
Property Value
mcell (g) 57.61
Vcell (mL) 91.69
φ 3.588
Table B.7
IPD Properties - 2 - Butanone Peroxide
Property Value
A (1/s) 3.047E+22
EA (J/(mol*K)) 1.901E+05
Tonset (°C) 80
Tmax (°C) 160
ΔH (J/g) 6.602E+02
IPD (W/ml) 2.223E+06
Table B.8
Gas Properties - 2 - Butanone Peroxide
Property Value
nmax (mol) 1.764E-02
dn/dtmax (mol/min) 5.301E-02
nmaxn 4.562E-01
dn/dtmaxn (1/min) 1.371E+00
GGP (1/min) 6.253E-01
Note – This compound exhibited an explosion event. This compound was run at
atmospheric pressure and was not assumed to be pure (Lu et al., 2010).

108
Fig. B.6 Normalized Gas Generation - 2 - Butanone Peroxide
Fig. B.7 Normalized Gas Generation Rate - 2 - Butanone Peroxide

109
Fig. B.8 Temperature and Pressure Profiles - 2 - Butanone Peroxide
Fig. B.9 Temperature and Pressure Rate Profiles - 2 - Butanone Peroxide

110
Fig. B.10 Rate Constant Determination - 2 - Butanone Peroxide

111
B.3 2, 4 - Dinitroaniline
Table B.9 Material Properties - 2, 4 - Dinitroaniline
Property Value
ms (g) 0.95
ρs (g/mL) 1.615
Cs (J/(g*K)) 2
MW (g/mol) 183.12
Table B.10
Cell Properties - 2, 4 - Dinitroaniline
Property Value
mcell (g) 51.38
Vcell (mL) 97.13
φ 23.72
Table B.11
IPD Properties - 2, 4 - Dinitroaniline
Property Value
A (1/s) 6.032E+05
EA (J/(mol*K)) 1.003E+05
Tonset (°C) 180
Tmax (°C) 350
ΔH (J/g) 8063.
IPD (W/ml) 7.574E-01
Table B.12
Gas Properties - 2, 4 - Dinitroaniline
Property Value
nmax (mol) 2.539E-02
dn/dtmax (mol/min) 4.878E-02
nmaxn 4.894E+00
dn/dtmaxn (1/min) 9.404E+00
GGP (1/min) 4.602E+01
Note – This compound exhibited an explosion event.

112
Fig. B.11 Normalized Gas Generation - 2, 4 - Dinitroaniline
Fig. B.12 Normalized Gas Generation Rate - 2, 4 - Dinitroaniline

113
Fig. B.13 Temperature and Pressure Profiles - 2, 4 - Dinitroaniline
Fig. B.14 Temperature and Pressure Rate Profiles - 2, 4 - Dinitroaniline

114
Fig. B.15 Rate Constant Determination - 2, 4 - Dinitroaniline

115
B.4 Acrylonitrile
Table B.13 Material Properties - Acrylonitrile
Property Value
ms (g) 4.00
ρs (g/mL) 0.806
Cs (J/(g*K)) 2.09
MW (g/mol) 53.06
Table B.14
Cell Properties - Acrylonitrile
Property Value
mcell (g) 52.63
Vcell (mL) 92.61
φ 6.288
Table B.15
IPD Properties - Acrylonitrile
Property Value
A (1/s) 1.785E+02
EA (J/(mol*K)) 5.365E+04
Tonset (°C) 100
Tmax (°C) 205
ΔH (J/g) 1.380E+03
IPD (W/ml) 8.734E-01
Table B.16
Gas Properties - Acrylonitrile
Property Value
nmax (mol) 3.926E-02
dn/dtmax (mol/min) 7.419E-04
nmaxn 5.208E-01
dn/dtmaxn (1/min) 9.841E-03
GGP (1/min) 5.125E-03
Note – This compound exhibited two exotherms with a sharp drop in pressure during the
second. The second exotherm exceeded the temperature capabilities of the APTAC.

116
Fig. B.16 Normalized Gas Generation - Acrylonitrile
Fig. B.17 Normalized Gas Generation Rate - Acrylonitrile
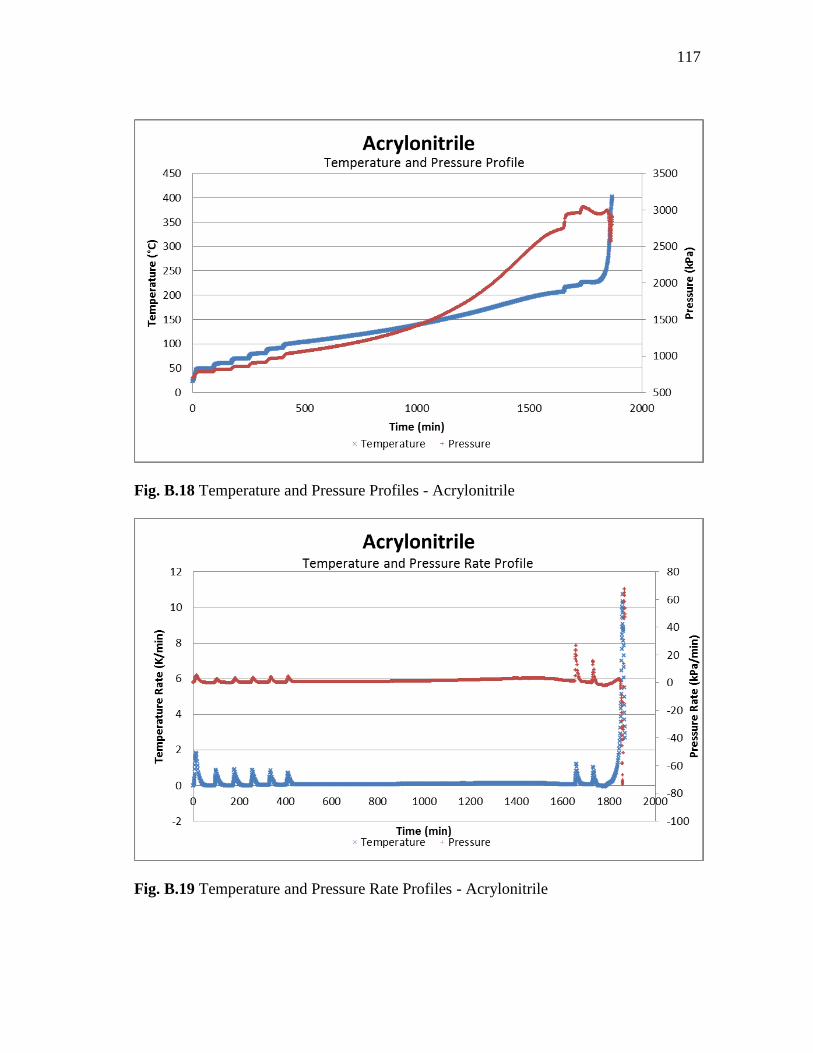
117
Fig. B.18 Temperature and Pressure Profiles - Acrylonitrile
Fig. B.19 Temperature and Pressure Rate Profiles - Acrylonitrile

118
Fig. B.20 Rate Constant Determination - Acrylonitrile

119
B.5 Cumene
Table B.17 Material Properties - Cumene
Property Value
ms (g) 1.95
ρs (g/mL) 0.862
Cs (J/(g*K)) 1.670
MW (g/mol) 120.19
Table B.18
Cell Properties - Cumene
Property Value
mcell (g) 50.77
Vcell (mL) 97.38
φ 14.09
Table B.19
IPD Properties - Cumene
Property Value
A (1/s) 4.374E+02
EA (J/(mol*K)) 5.839E+04
Tonset (°C) 130
Tmax (°C) 220
ΔH (J/g) 2.119E+03
IPD (W/ml) 1.181E+00
Table B.20
Gas Properties - Cumene
Property Value
nmax (mol) 0.000E+00
dn/dtmax (mol/min) 5.134E-06
nmaxn 0.000E+00
dn/dtmaxn (1/min) 3.164E-04
GGP (1/min) 0.000E+00
Note – This compound showed a large pressure drop likely due to the endothermic
reaction incorporating oxygen.

120
Fig. B.21 Normalized Gas Generation - Cumene
Fig. B.22 Normalized Gas Generation Rate - Cumene

121
Fig. B.23 Temperature and Pressure Profiles - Cumene
Fig. B.24 Temperature and Pressure Rate Profiles - Cumene

122
Fig. B.25 Rate Constant Determination - Cumene

123
B.6 Cumene Hydroperoxide
Table B.21 Material Properties - Cumene Hydroperoxide
Property Value
ms (g) 0.99
ρs (g/mL) 1.02
Cs (J/(g*K)) 1.884
MW (g/mol) 152.19
Table B.22
Cell Properties - Cumene Hydroperoxide
Property Value
mcell (g) 51.9
Vcell (mL) 97.00
φ 24.37
Table B.23
IPD Properties - Cumene Hydroperoxide
Property Value
A (1/s) 6.675E+08
EA (J/(mol*K)) 1.006E+05
Tonset (°C) 120
Tmax (°C) 240
ΔH (J/g) 5.510E+03
IPD (W/ml) 3.409E+02
Table B.24
Gas Properties - Cumene Hydroperoxide
Property Value
nmax (mol) 7.562E-03
dn/dtmax (mol/min) 2.314E-03
nmaxn 1.162E+00
dn/dtmaxn (1/min) 3.558E-01
GGP (1/min) 4.136E-01
Note – This compound exhibited an explosion event.

124
Fig. B.26 Normalized Gas Generation - Cumene Hydroperoxide
Fig. B.27 Normalized Gas Generation Rate - Cumene Hydroperoxide

125
Fig. B.28 Temperature and Pressure Profiles - Cumene Hydroperoxide
Fig. B.29 Temperature and Pressure Rate Profiles - Cumene Hydroperoxide

126
Fig. B.30 Rate Constant Determination - Cumene Hydroperoxide

127
B.7 Ethylene Oxide
Table B.25 Material Properties - Ethylene Oxide
Property Value
ms (g) 14.0
ρs (g/mL) N/A
Cs (J/(g*K)) 1.093
MW (g/mol) 44.05
Table B.26
Cell Properties - Ethylene Oxide
Property Value
mcell (g) 31.61
Vcell (mL) 130.00
φ 2.073
Table B.27
IPD Properties - Ethylene Oxide
Property Value
A (1/s) 8.846E+03
EA (J/(mol*K)) 8.598E+04
Tonset (°C) 180
Tmax (°C) 600
ΔH (J/g) 9.526E+02
IPD (W/ml) 2.362E-03
Table B.28
Gas Properties - Ethylene Oxide
Property Value
nmax (mol) 4.157E-01
dn/dtmax (mol/min) 4.462E-01
nmaxn 1.308E+00
dn/dtmaxn (1/min) 1.404E+00
GGP (1/min) 1.836E+00
Note – This compound exhibited an explosion event, was run at atmospheric initial
pressure, under nitrogen (Dinh, 2008). A titanium bomb was used.

128
Fig. B.31 Normalized Gas Generation - Ethylene Oxide
Fig. B.32 Normalized Gas Generation Rate - Ethylene Oxide

129
Fig. B.33 Temperature and Pressure Profiles - Ethylene Oxide
Fig. B.34 Temperature and Pressure Rate Profiles - Ethylene Oxide

130
Fig. B.35 Rate Constant Determination - Ethylene Oxide

131
B.8 Hydrogen Peroxide - 12.5%
Table B.29 Material Properties - Hydrogen Peroxide - 12.5%
Property Value
ms (g) 2.52
ρs (g/mL) 1.13
Cs (J/(g*K)) 2.619
MW (g/mol) 34.015
Table B.30
Cell Properties - Hydrogen Peroxide - 12.5%
Property Value
mcell (g) 58.81
Vcell (mL) 100.00
φ 16.02
Table B.31
IPD Properties - Hydrogen Peroxide - 12.5%
Property Value
A (1/s) 8.609E+14
EA (J/(mol*K)) 1.580E+05
Tonset (°C) 140
Tmax (°C) 250
ΔH (J/g) 4.614E+03
IPD (W/ml) 7.472E+02
Table B.32
Gas Properties - Hydrogen Peroxide - 12.5%
Property Value
nmax (mol) 1.671E-01
dn/dtmax (mol/min) 6.029E-02
nmaxn 2.256E+00
dn/dtmaxn (1/min) 8.138E-01
GGP (1/min) 1.836E+00
Note – This compound exhibited an explosion event and was run under atmospheric
pressure (Saenz et al., 2009). It was not assumed to be pure.

132
Fig. B.36 Normalized Gas Generation - Hydrogen Peroxide - 12.5%
Fig. B.37 Normalized Gas Generation Rate - Hydrogen Peroxide - 12.5%

133
Fig. B.38 Temperature and Pressure Profiles - Hydrogen Peroxide - 12.5%
Fig. B.39 Temperature and Pressure Rate Profiles - Hydrogen Peroxide - 12.5%

134
Fig. B.40 Rate Constant Determination - Hydrogen Peroxide - 12.5%

135
B.9 Hydroxylamine Chloride
Table B.33 Material Properties - Hydroxylamine Chloride
Property Value
ms (g) 1.00
ρs (g/mL) 1.67
Cs (J/(g*K)) 0.6687
MW (g/mol) 69.49
Table B.34
Cell Properties - Hydroxylamine Chloride
Property Value
mcell (g) 53.04
Vcell (mL) 92.96
φ 67.62
Table B.35
IPD Properties - Hydroxylamine Chloride
Property Value
A (1/s) 7.991E+25
EA (J/(mol*K)) 2.490E+05
Tonset (°C) 150
Tmax (°C) 194
ΔH (J/g) 1.990E+03
IPD (W/ml) 3.633E+04
Table B.36
Gas Properties - Hydroxylamine Chloride
Property Value
nmax (mol) 1.189E-02
dn/dtmax (mol/min) 8.283E-04
nmaxn 8.266E-01
dn/dtmaxn (1/min) 5.756E-02
GGP (1/min) 4.757E-02

136
Fig. B.41 Normalized Gas Generation - Hydroxylamine Chloride
Fig. B.42 Normalized Gas Generation Rate - Hydroxylamine Chloride

137
Fig. B.43 Temperature and Pressure Profiles - Hydroxylamine Chloride
Fig. B.44 Temperature and Pressure Rate Profiles - Hydroxylamine Chloride

138
Fig. B.45 Rate Constant Determination - Hydroxylamine Chloride

139
B.10 Isoprene
Table B.37 Material Properties - Isoprene
Property Value
ms (g) 5.13
ρs (g/mL) 0.681
Cs (J/(g*K)) 2.139
MW (g/mol) 68.12
Table B.38
Cell Properties - Isoprene
Property Value
mcell (g) 52.41
Vcell (mL) 96.61
φ 5.011
Table B.39
IPD Properties - Isoprene
Property Value
A (1/s) 2.892E+00
EA (J/(mol*K)) 4.041E+04
Tonset (°C) 90
Tmax (°C) 317
ΔH (J/g) 2.434E+03
IPD (W/ml) 4.420E-01
Table B.40
Gas Properties - Isoprene
Property Value
nmax (mol) 3.004E-02
dn/dtmax (mol/min) 8.909E-05
nmaxn 3.989E-01
dn/dtmaxn (1/min) 1.183E-03
GGP (1/min) 4.719E-04
Note – The exotherm for this compound exceeded the temperature range for the
APTAC. The compound also exhibited a sharp drop in pressure during the exotherm.

140
Fig. B.46 Normalized Gas Generation - Isoprene
Fig. B.47 Normalized Gas Generation Rate - Isoprene
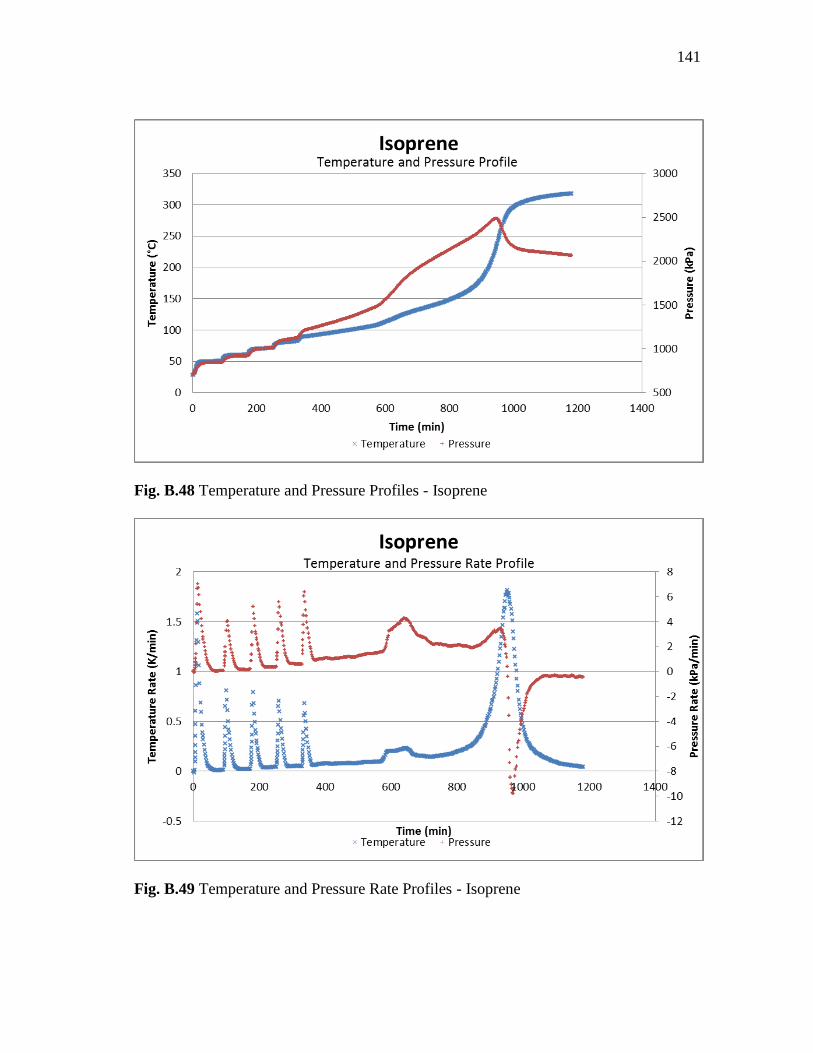
141
Fig. B.48 Temperature and Pressure Profiles - Isoprene
Fig. B.49 Temperature and Pressure Rate Profiles - Isoprene

142
Fig. B.50 Rate Constant Determination - Isoprene

143
B.11 Isopropyl Alcohol
Table B.41 Material Properties - Isopropyl Alcohol
Property Value
ms (g) 8.1
ρs (g/mL) 0.785
Cs (J/(g*K)) 2.562
MW (g/mol) 60.1
Table B.42
Cell Properties - Isopropyl Alcohol
Property Value
mcell (g) 58.83
Vcell (mL) 92.67
φ 3.381
Table B.43
IPD Properties - Isopropyl Alcohol
Property Value
A (1/s) N/A
EA (J/(mol*K)) N/A
Tonset (°C) N/A
Tmax (°C) N/A
ΔH (J/g) N/A
IPD (W/ml) N/A
Table B.44
Gas Properties - Isopropyl Alcohol
Property Value
nmax (mol) 1.097E-01
dn/dtmax (mol/min) 8.348E-04
nmaxn 8.137E-01
dn/dtmaxn (1/min) 6.194E-03
GGP (1/min) 5.040E-03
Note – This compound was run at atmospheric pressure and did not exhibit a
decomposition reaction. An IPD cannot be calculated. (Carreto-Vasquez et al., 2010).

144
Fig. B.51 Normalized Gas Generation - Isopropyl Alcohol
Fig. B.52 Normalized Gas Generation Rate - Isopropyl Alcohol

145
Fig. B.53 Temperature and Pressure Profiles - Isopropyl Alcohol
Fig. B.54 Temperature and Pressure Rate Profiles - Isopropyl Alcohol

146
B.12 Maleic Anhydride
Table B.45 Material Properties - Maleic Anhydride
Property Value
ms (g) 7.39
ρs (g/mL) 0.936
Cs (J/(g*K)) 1.530
MW (g/mol) 98.06
Table B.46
Cell Properties - Maleic Anhydride
Property Value
mcell (g) 53.24
Vcell (mL) 93.04
φ 4.956
Table B.47
IPD Properties - Maleic Anhydride
Property Value
A (1/s) 2.074E+16
EA (J/(mol*K)) 2.055E+05
Tonset (°C) 220
Tmax (°C) 338
ΔH (J/g) 8.946E+02
IPD (W/ml) 5.319E-02
Table B.48
Gas Properties - Maleic Anhydride
Property Value
nmax (mol) 5.977E-02
dn/dtmax (mol/min) 1.616E-02
nmaxn 7.931E-01
dn/dtmaxn (1/min) 2.144E-01
GGP (1/min) 1.700E-01
Note – This compound’s exotherm exceeded the temperature limit of the APTAC.

147
Fig. B.55 Normalized Gas Generation - Maleic Anhydride
Fig. B.56 Normalized Gas Generation Rate - Maleic Anhydride

148
Fig. B.57 Temperature and Pressure Profiles - Maleic Anhydride
Fig. B.58 Temperature and Pressure Rate Profiles - Maleic Anhydride

149
Fig. B.59 Rate Constant Determination - Maleic Anhydride

150
B.13 Manganese Carbonate
Table B.49 Material Properties - Manganese Carbonate
Property Value
ms (g) 8.39
ρs (g/mL) 3.12
Cs (J/(g*K)) 0.709
MW (g/mol) 114.95
Table B.50
Cell Properties - Manganese Carbonate
Property Value
mcell (g) 56.18
Vcell (mL) 92.34
φ 8.933
Table B.51
IPD Properties - Manganese Carbonate
Property Value
A (1/s) 1.335E-02
EA (J/(mol*K)) 2.769E+04
Tonset (°C) 140
Tmax (°C) 315
ΔH (J/g) 1.108E+03
IPD (W/ml) 7.929E-02
Table B.52
Gas Properties - Manganese Carbonate
Property Value
nmax (mol) 9.259E-03
dn/dtmax (mol/min) 2.108E-05
nmaxn 1.269E-01
dn/dtmaxn (1/min) 2.888E-04
GGP (1/min) 3.664E-05

151
Fig. B.60 Normalized Gas Generation - Manganese Carbonate
Fig. B.61 Normalized Gas Generation Rate - Manganese Carbonate

152
Fig. B.62 Temperature and Pressure Profiles - Manganese Carbonate
Fig. B.63 Temperature and Pressure Rate Profiles - Manganese Carbonate

153
Fig. B.64 Rate Constant Determination - Manganese Carbonate

154
B.14 Methyl Methacrylate
Table B.53 Material Properties - Methyl Methacrylate
Property Value
ms (g) 7.54
ρs (g/mL) 0.936
Cs (J/(g*K)) 1.910
MW (g/mol) 100.12
Table B.54
Cell Properties - Methyl Methacrylate
Property Value
mcell (g) 52.89
Vcell (mL) 92.22
φ 4.085
Table B.55
IPD Properties - Methyl Methacrylate
Property Value
A (1/s) 6.339E+09
EA (J/(mol*K)) 1.030E+05
Tonset (°C) 100
Tmax (°C) 200
ΔH (J/g) 7.802E+02
IPD (W/ml) 2.426E+02
Table B.56
Gas Properties - Methyl Methacrylate
Property Value
nmax (mol) 4.700E-02
dn/dtmax (mol/min) 1.018E-03
nmaxn 6.241E-01
dn/dtmaxn (1/min) 1.352E-02
GGP (1/min) 8.435E-03
Note – This compound exhibited two exotherms. The second of which exceeded the
temperature limit of the APTAC.

155
Fig. B.65 Normalized Gas Generation - Methyl Methacrylate
Fig. B.66 Normalized Gas Generation Rate - Methyl Methacrylate

156
Fig. B.67 Temperature and Pressure Profiles - Methyl Methacrylate
Fig. B.68 Temperature and Pressure Rate Profiles - Methyl Methacrylate

157
Fig. B.69 Rate Constant Determination - Methyl Methacrylate

158
B.15 Nitrobenzene
Table B.57 Material Properties - Nitrobenzene
Property Value
ms (g) 0.76
ρs (g/mL) 1.199
Cs (J/(g*K)) 1.4
MW (g/mol) 123.11
Table B.58
Cell Properties - Nitrobenzene
Property Value
mcell (g) 52.08
Vcell (mL) 97.41
φ 42.12
Table B.59
IPD Properties - Nitrobenzene
Property Value
A (1/s) 1.163E+04
EA (J/(mol*K)) 7.856E+04
Tonset (°C) 190
Tmax (°C) 265
ΔH (J/g) 4.422E+03
IPD (W/ml) 8.838E-01
Table B.60
Gas Properties - Nitrobenzene
Property Value
nmax (mol) 4.039E-03
dn/dtmax (mol/min) 1.196E-05
nmaxn 6.543E-01
dn/dtmaxn (1/min) 1.938E-03
GGP (1/min) 1.268E-03

159
Fig. B.70 Normalized Gas Generation - Nitrobenzene
Fig. B.72 Normalized Gas Generation Rate - Nitrobenzene

160
Fig. B.71 Temperature and Pressure Profiles - Nitrobenzene
Fig. B.73 Temperature and Pressure Rate Profiles - Nitrobenzene

161
Fig. B.74 Rate Constant Determination - Nitrobenzene

162
B.16 Nitroethane
Table B.61 Material Properties - Nitroethane
Property Value
ms (g) 5.46
ρs (g/mL) 1.045
Cs (J/(g*K)) 1.792
MW (g/mol) 75.07
Table B.62
Cell Properties - Nitroethane
Property Value
mcell (g) 52.43
Vcell (mL) 92.36
φ 5.501
Table B.63
IPD Properties - Nitroethane
Property Value
A (1/s) 2.886E+09
EA (J/(mol*K)) 1.258E+05
Tonset (°C) 160
Tmax (°C) 350
ΔH (J/g) 1.873E+03
IPD (W/ml) 1.558E+00
Table B.64
Gas Properties - Nitroethane
Property Value
nmax (mol) 1.729E-02
dn/dtmax (mol/min) 9.433E-04
nmaxn 2.378E-01
dn/dtmaxn (1/min) 1.297E-02
GGP (1/min) 3.084E-03
Note – This compound exhibited a unique series of exotherms.

163
Fig. B.75 Normalized Gas Generation - Nitroethane
Fig. B.76 Normalized Gas Generation Rate - Nitroethane

164
Fig. B.77 Temperature and Pressure Profiles - Nitroethane
Fig. B.78 Temperature and Pressure Rate Profiles - Nitroethane

165
Fig. B.79 Rate Constant Determination - Nitroethane

166
B.17 Picoline
Table B.65 Material Properties - Picoline
Property Value
ms (g) 6.6
ρs (g/mL) 0.943
Cs (J/(g*K)) 1.703
MW (g/mol) 93.13
Table B.66
Cell Properties - Picoline
Property Value
mcell (g) 57.85
Vcell (mL) 90.00
φ 5.323
Table B.67
IPD Properties - Picoline
Property Value
A (1/s) N/A
EA (J/(mol*K)) N/A
Tonset (°C) N/A
Tmax (°C) N/A
ΔH (J/g) N/A
IPD (W/ml) N/A
Table B.68
Gas Properties - Picoline
Property Value
nmax (mol) 4.991E-02
dn/dtmax (mol/min) 3.344E-04
nmaxn 7.043E-01
dn/dtmaxn (1/min) 4.718E-03
GGP (1/min) 3.323E-03
Note – This compound did not exhibit a decomposition reaction so does not include
information to calculate IPD. It was run at atmospheric pressure (Saenz et al., 2009).

167
Fig. B.80 Normalized Gas Generation - Picoline
Fig. B.81 Normalized Gas Generation Rate - Picoline

168
Fig. B.82 Temperature and Pressure Profiles - Picoline
Fig. B.83 Temperature and Pressure Rate Profiles - Picoline

169
B.18 Polyacrylic Acid
Table B.69 Material Properties - Polyacrylic Acid
Property Value
ms (g) 4.48
ρs (g/mL) 1
Cs (J/(g*K)) 2
Subunit MW (g/mol) 72.06
Table B.70
Cell Properties - Polyacrylic Acid
Property Value
mcell (g) 57.48
Vcell (mL) 92.15
φ 6.389
Table B.71
IPD Properties - Polyacrylic Acid
Property Value
A (1/s) N/A
EA (J/(mol*K)) N/A
Tonset (°C) 260
Tmax (°C) N/A
ΔH (J/g) N/A
IPD (W/ml) N/A
Table B.72
Gas Properties - Polyacrylic Acid
Property Value
nmax (mol) 6.451E-02
dn/dtmax (mol/min) 2.536E-04
nmaxn 1.038E+00
dn/dtmaxn (1/min) 4.080E-03
GGP (1/min) 4.233E-03
Note – This compound was run at atmospheric pressure and did not exhibit a
decomposition reaction. An IPD cannot be calculated. (Carreto-Vasquez et al., 2010).

170
Fig. B.84 Normalized Gas Generation - Polyacrylic Acid
Fig. B.85 Normalized Gas Generation Rate - Polyacrylic Acid

171
Fig. B.86 Temperature and Pressure Profiles - Polyacrylic Acid
Fig. B.87 Temperature and Pressure Rate Profiles - Polyacrylic Acid

172
B.19 Polyarylamide
Table B.73 Material Properties - Polyarylamide
Property Value
ms (g) 12.53
ρs (g/mL) 1.1
Cs (J/(g*K)) 2
Subunit MW (g/mol) 121.7
Table B.74
Cell Properties - Polyarylamide
Property Value
mcell (g) 58.63
Vcell (mL) 91.50
φ 2.965
Table B.75
IPD Properties - Polyarylamide
Property Value
A (1/s) N/A
EA (J/(mol*K)) N/A
Tonset (°C) 300
Tmax (°C) N/A
ΔH (J/g) N/A
IPD (W/ml) N/A
Table B.76
Gas Properties - Polyarylamide
Property Value
nmax (mol) 6.045E-02
dn/dtmax (mol/min) 5.830E-04
nmaxn 5.871E-01
dn/dtmaxn (1/min) 5.663E-03
GGP (1/min) 3.325E-03
Note – This compound was run at atmospheric pressure and did not exhibit a
decomposition reaction. An IPD cannot be calculated. (Carreto-Vasquez et al., 2010).

173
Fig. B.88 Normalized Gas Generation - Polyarylamide
Fig. B.89 Normalized Gas Generation Rate - Polyarylamide

174
Fig. B.90 Temperature and Pressure Profiles - Polyarylamide
Fig. B.91 Temperature and Pressure Rate Profiles - Polyarylamide

175
B.20 Polyethylene Glycol
Table B.77 Material Properties - Polyethylene Glycol
Property Value
ms (g) 5.21
ρs (g/mL) 1
Cs (J/(g*K)) 3.322
Subunit MW (g/mol) 45
Table B.78
Cell Properties - Polyethylene Glycol
Property Value
mcell (g) 54.71
Vcell (mL) 92.00
φ 3.655
Table B.79
IPD Properties - Polyethylene Glycol
Property Value
A (1/s) N/A
EA (J/(mol*K)) N/A
Tonset (°C) 290
Tmax (°C) N/A
ΔH (J/g) N/A
IPD (W/ml) N/A
Table B.80
Gas Properties - Polyethylene Glycol
Property Value
nmax (mol) 3.680E-04
dn/dtmax (mol/min) 1.383E-04
nmaxn 3.179E-03
dn/dtmaxn (1/min) 1.194E-03
GGP (1/min) 3.796E-06
Note – This compound did not exhibit a decomposition reaction. An IPD cannot be
calculated.

176
Fig. B.92 Normalized Gas Generation - Polyethylene Glycol
Fig. B.93 Normalized Gas Generation Rate - Polyethylene Glycol
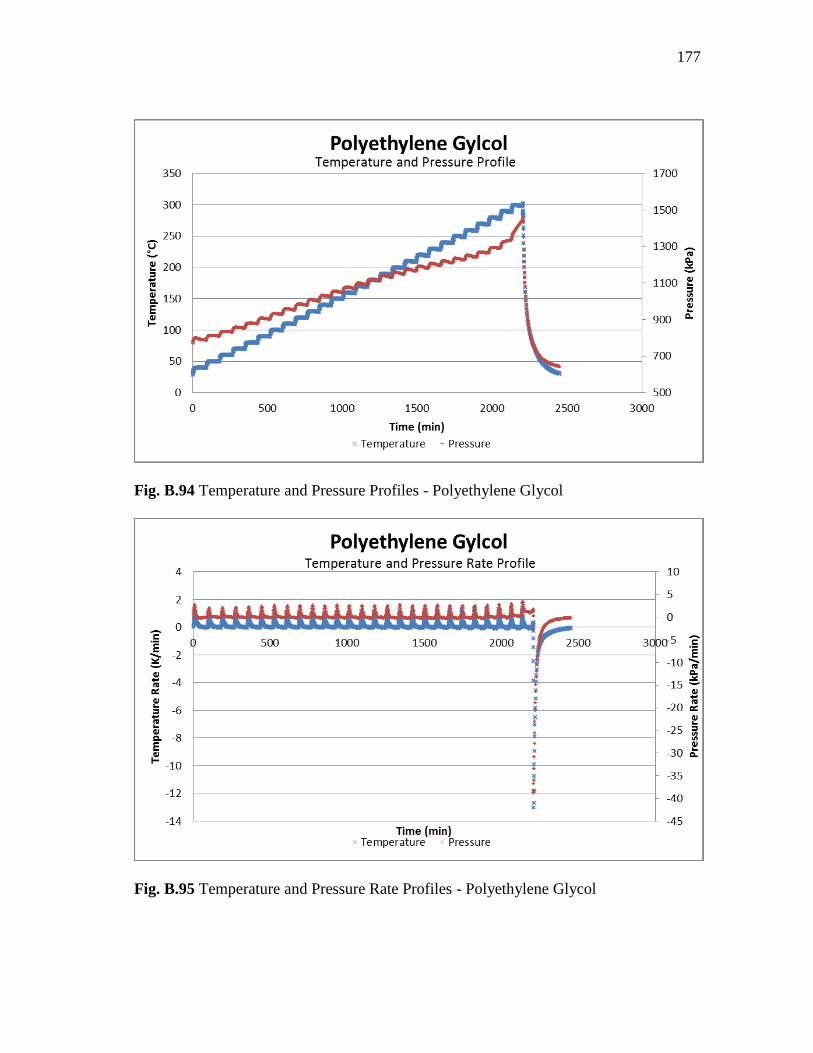
177
Fig. B.94 Temperature and Pressure Profiles - Polyethylene Glycol
Fig. B.95 Temperature and Pressure Rate Profiles - Polyethylene Glycol

178
B.21 Polyvinyl Acetate
Table B.81 Material Properties - Polyvinyl Acetate
Property Value
ms (g) 11.07
ρs (g/mL) 1.19
Cs (J/(g*K)) 2
Subunit MW (g/mol) 86.09
Table B.82
Cell Properties - Polyvinyl Acetate
Property Value
mcell (g) 58.83
Vcell (mL) 91.48
φ 3.232
Table B.83
IPD Properties - Polyvinyl Acetate
Property Value
A (1/s) N/A
EA (J/(mol*K)) N/A
Tonset (°C) 240
Tmax (°C) N/A
ΔH (J/g) N/A
IPD (W/ml) N/A
Table B.84
Gas Properties - Polyvinyl Acetate
Property Value
nmax (mol) 9.833E-02
dn/dtmax (mol/min) 4.922E-04
nmaxn 7.647E-01
dn/dtmaxn (1/min) 3.828E-03
GGP (1/min) 2.927E-03
Note – This compound was run at atmospheric pressure and did not exhibit a
decomposition reaction. An IPD cannot be calculated. (Carreto-Vasquez et al., 2010).

179
Fig. B.96 Normalized Gas Generation - Polyvinyl Acetate
Fig. B.97 Normalized Gas Generation Rate - Polyvinyl Acetate

180
Fig. B.98 Temperature and Pressure Profiles - Polyvinyl Acetate
Fig. B.99 Temperature and Pressure Rate Profiles - Polyvinyl Acetate

181
B.22 Styrene
Table B.85 Material Properties - Styrene
Property Value
ms (g) 5.46
ρs (g/mL) 0.906
Cs (J/(g*K)) 1.800
MW (g/mol) 104.15
Table B.86
Cell Properties - Styrene
Property Value
mcell (g) 51.09
Vcell (mL) 93.47
φ 5.366
Table B.87
IPD Properties - Styrene
Property Value
A (1/s) 1.593E+08
EA (J/(mol*K)) 9.635E+04
Tonset (°C) 120
Tmax (°C) 235
ΔH (J/g) 1.111E+03
IPD (W/ml) 3.847E+01
Table B.88
Gas Properties - Styrene
Property Value
nmax (mol) 6.525E-03
dn/dtmax (mol/min) 5.072E-04
nmaxn 1.245E-01
dn/dtmaxn (1/min) 9.674E-03
GGP (1/min) 1.204E-03

182
Fig. B.100 Normalized Gas Generation - Styrene
Fig. B.101 Normalized Gas Generation Rate - Styrene

183
Fig. B.102 Temperature and Pressure Profiles - Styrene
Fig. B.103 Temperature and Pressure Rate Profiles - Styrene

184
Fig. B.104 Rate Constant Determination - Styrene

185
B.23 Tertbutyl Peroxide 1.3g-avg
Table B.89 Material Properties - Tertbutyl Peroxide 1.3g-avg
Property Value
ms (g) 1.3
ρs (g/mL) 0.796
Cs (J/(g*K)) 1.499
MW (g/mol) 146.23
Table B.90
Cell Properties - Tertbutyl Peroxide 1.3g-avg
Property Value
mcell (g) 51.74
Vcell (mL) 96.90
φ 22.80
Table B.91
IPD Properties - Tertbutyl Peroxide 1.3g-avg
Property Value
A (1/s) N/A
EA (J/(mol*K)) N/A
Tonset (°C) 100
Tmax (°C) N/A
ΔH (J/g) N/A
IPD (W/ml) 8.88E+01
Table B.92
Gas Properties - Tertbutyl Peroxide 1.3g-avg
Property Value
nmax (mol) 2.04E-02
dn/dtmax (mol/min) 2.01E-04
nmaxn 2.20E+00
dn/dtmaxn (1/min) 2.17E-02
GGP (1/min) 4.79E-02
Note – This is an averaged value based on the five 1.3g samples of tertbutyl peroxide.

186
B.24 Vinyl Acetate
Table B.93 Material Properties - Vinyl Acetate
Property Value
ms (g) 6.9
ρs (g/mL) 0.934
Cs (J/(g*K)) 1.708
MW (g/mol) 86.09
Table B.94
Cell Properties - Vinyl Acetate
Property Value
mcell (g) 52.29
Vcell (mL) 93.06
φ 4.727
Table B.95
IPD Properties - Vinyl Acetate
Property Value
A (1/s) 9.147E+18
EA (J/(mol*K)) 1.880E+05
Tonset (°C) 160
Tmax (°C) 195
ΔH (J/g) 2.826E+02
IPD (W/ml) 4.048E+02
Table B.96
Gas Properties - Vinyl Acetate
Property Value
nmax (mol) 4.427E-02
dn/dtmax (mol/min) 6.290E-04
nmaxn 5.523E-01
dn/dtmaxn (1/min) 7.848E-03
GGP (1/min) 4.335E-03
Note – This compound exhibited two exotherms.

187
Fig. B.105 Normalized Gas Generation - Vinyl Acetate
Fig. B.106 Normalized Gas Generation Rate - Vinyl Acetate

188
Fig. B.107 Temperature and Pressure Profiles - Vinyl Acetate
Fig. B.108 Temperature and Pressure Rate Profiles - Vinyl Acetate

189
Fig. B.109 Rate Constant Determination - Vinyl Acetate

190
B.25 Water
Table B.97 Material Properties - Water
Property Value
ms (g) 12.82
ρs (g/mL) 1
Cs (J/(g*K)) 4.184
MW (g/mol) 32
Table B.98
Cell Properties - Water
Property Value
mcell (g) 51.77
Vcell (mL) 96.85
φ 1.811
Table B.99
IPD Properties - Water
Property Value
A (1/s) N/A
EA (J/(mol*K)) N/A
Tonset (°C) N/A
Tmax (°C) N/A
ΔH (J/g) N/A
IPD (W/ml) N/A
Table B.100
Gas Properties - Water
Property Value
nmax (mol) 4.475E-02
dn/dtmax (mol/min) 1.377E-03
nmaxn 1.117E-01
dn/dtmaxn (1/min) 3.437E-03
GGP (1/min) 3.839E-04
Note – This compound did not exhibit a decomposition reaction so does not include
information to calculate IPD.

191
Fig. B.110 Normalized Gas Generation - Water
Fig. B.111 Normalized Gas Generation Rate - Water

192
Fig. B.112 Temperature and Pressure Profiles - Water
Fig. B.113 Temperature and Pressure Rate Profiles - Water

193
VITA
Name: Phillip Raymond Hodge
Address: 11011 Richmond Avenue
Suite 700
Houston, Texas 77042-6702
Email Address: [email protected]
Education: B.S., Chemistry, Rice University, 2007
M.S., Chemical Engineering, Texas A&M University, 2011


![First Revision No. 12-NFPA 704-2014 [ Global Input ] · First Revision No. 12-NFPA 704-2014 [ Global Input ] Insert attached as new Annex G and corresponding Figure G. Supplemental](https://img.dokumen.tips/doc/110x75/5b14600c7f8b9a397c8cc4ee/first-revision-no-12-nfpa-704-2014-global-input-first-revision-no-12-nfpa.jpg)