Embed Size (px)
Citation preview

Journal of Supercritical Fluids 22 (2002) 21–36
Determination of the solubility of extracts from vegetableraw material in pressurized CO2: a pseudo-ternary mixture
formed by cellulosic structure+solute+solvent
Vera M. Rodrigues a, Elisa M.B.D. Sousa b, Alcilene R. Monteiro c,Osvaldo Chiavone-Filho b, Marcia O.M. Marques d, M. Angela A. Meireles a,*
a LASEFI–DEA/FEA–UNICAMP, ntos, Cx. Postal 6121, CEP: 13083-970, Campinas SP, Brazilb DEQ–UFRN, Campus Uni�ersitario s/n-Nucleo Tecnologico/PPGEQ, Lagoa No�a CEP: 59072-970, Natal RN, Brazil
c CCTA–UENF, A�. Alberto Lamego, 2.000, Horto 28.015-620, Campos do Goytacazes RJ, Brazild IAC–Cx. Postal 28, CEP: 13001-970, Campinas SP, Brazil
Received 3 April 2001; received in revised form 1 August 2001; accepted 24 August 2001
Abstract
This paper discusses the application of the dynamic method to measure the solubility in pseudo-ternary systemsformed by vegetable raw materials (cellulosic structure+solute) and CO2. For aromatic, medicinal, and spice plants,the soluble portion of the solid is formed of essential oils, oleoresins, pigments, and various substances from severalother classes of organic compounds. The experimental data were measured in two independent laboratories, usingthree experimental set-ups, and three vegetable species: clove buds, eucalyptus, and ginger. The solubility for thesystem clove buds/CO2 varied from 0.220 to 0.277 kg-extract/kg-CO2 for the isotherm of 288.15 K. The ginger extractsolubility varied from 2.01×10⁻³ to 7.20×10⁻³ kg-extract/kg-CO2 for pressures of 100–300 bar, and temperaturesof 298.15–313.15 K. The eucalyptus solubility for the isobar of 66.7 bar varied from 3.95×10⁻³ to 4.07×10⁻³
kg-extract/kg-CO2. © 2002 Elsevier Science B.V. All rights reserved.
Keywords: Solubility; SFE; Clove buds; Ginger; Eucalyptus
Nomenclature
da apparent density of the bed, kg/m3
axial dispersion coefficientDaY
dr real or true density of bed and particles, kg/m3
H measuring-cell length, m
www.elsevier.com/locate/supflu
* Corresponding author. Tel.: +55-19-3788-4033; fax: +55-19-3788-4027.E-mail address: [email protected] (M.A.A. Meireles).
0896-8446/02/$ - see front matter © 2002 Elsevier Science B.V. All rights reserved.
PII: S 0896 -8446 (01 )00108 -5

V.M. Rodrigues et al. / J. of Supercritical Fluids 22 (2002) 21–3622
interfacial mass transfer rate, kg solute/s.kg cellulosic structureJ(X, Y)mass transfer rate for the CER period for Q*, kg solute/sM*mass transfer rate for the constant extraction rate period, kg solute/sMCER
solvent flow rate suitable for solubility measurement, kg CO2/sQ*time, stduration of the constant extraction rate period, stCER
t* duration of the CER period for Q*, sinterstitial velocity, m/suinterstitial velocity suitable to solubility measurement, m/su*mass ratio of solute in solid phase, kg solute/kg cellulosic structureXsolubility, kg solute/kg solventY*mass ratio of solute in solvent phase, kg solute/kg of solventY
YCER mass ratio of solute in solvent phase at measuring-cell outlet, kg solute/kg solventaxial direction, mZ
Greek symbols� porosity of the bed and particles
Fig. 1. Illustration for: (a) binary system; (b) pseudo-binarysystem; (c) pseudo-ternary system.
1. Introduction
The increasing use of vegetable extracts by thefood, cosmetic, and pharmaceutical industries canmake the SFE of essential oils using supercriticalcarbon dioxide (CO2) a very attractive technologycompared to conventional processes with respectto the product quality. The knowledge of themass transfer mechanisms, the kinetics parametersand the thermodynamics restrictions of the extrac-tion conducted in a bed of vegetable material canclear up the scenario to make the process econom-ically viable. This requires information on thethermodynamic restrictions of the system veg-etable material/CO2. On the other hand, the un-derstanding of the various process variables andhow they can be connected to a theoretical modelto describe the extraction kinetics are also desir-able. The aim of this paper is to discuss andpresent experimental data for the solubility ofsystems such as vegetable material/CO2. Experi-mental data were measured for clove buds/CO2,eucalyptus/CO2, and ginger/CO2.
V.M. Rodrigues et al. / J. of Supercritical Fluids 22 (2002) 21–36 23
1.1. Pseudo-ternary system definition
For SFE from solid substratum, the systemvegetable material+CO2 can be pictured as be-ing formed of three components: solvent, extractor solute, and cellulosic structure. The cellulosicstructure can be considered completely inert tothe solvent (CO2) but it strongly interacts withthe extract or the solute. For odoriferous, medic-inal, and spice plants, the soluble portion of thesolid substratum is formed of essential oils, ole-oresins, pigments, and various substances fromseveral classes of organic compounds. The ex-tract is then a complex mixture of chemical spe-cies such as terpenes, terpenoids, oxygenated andnon-oxygenated phenyl propanoid derivatives,and other compounds such as esters, etc. and sothe solute is formed by a multicomponent mix-ture. Fig. 1 illustrates three situations that maybe present in SFE process: Fig. 1a shows thesituation for a system formed by a pure compo-nent+CO2. If instead of a pure component thesolute is a multicomponent mixture such as theclove volatile oil, then the system can be approx-imated by a pseudo-binary system as in Fig. 1b.On the other hand, because of the presence ofthe solid substratum, the system is composed ofcellulosic structure+solute (multicomponentmixture)+solvent (CO2), so that a very sim-plified picture of the system is to treat it as apseudo-ternary system (Fig. 1c). In general, thesolute in the solid substratum is located insidecells and specialized structures that may or maynot suffer rupture when subjected to a pre-treat-ment (milling) to favor mass transfer of the so-lute to the fluid phase. For the system solidsubstratum+CO2, the cellulosic structure doesnot modify in the presence of the solvent, that is,the cellulosic structure remains inert to the sol-vent during the extraction process, while the so-lute strongly interacts with both the solvent andthe cellulosic structure. However, as will beshown, the solubility is not a very strong func-tion of the raw material origin and this can pos-sibly be overlooked for design purposes.
The present work describes the influence of thecellulosic structure over the solubility of the ex-
tract in the CO2, where the solubility is definedfor a pseudo-ternary system. A good discussionabout the influence of the cellulosic structure onthe solubility for vegetable materials/CO2 systemsis given by Brunner [1]. This author also demon-strated that the solubility of pure caffeine in CO2
(binary system) is about 20 times larger than thesolubility of the caffeine measured for the systemcoffee grains/CO2 (pseudo-ternary system: cellu-losic structure/solute/solvent). Considering allthese facts and the need for information on thesolubility of vegetable extracts in CO2, particu-larly for aromatic, medicinal, and spice plants,the solubilities of the extracts of clove buds (Eu-genia caryophillus), ginger (Zingiber officinaleRoscoe), and eucalyptus (Eucalyptus tereticornis)in pressurized CO2 were measured using the dy-namic method [2]. The data were collected at twoindependent laboratories, using three equipments,the same experimental methodology and two cal-culation procedures.
2. Materials and methods
The procedure to measure solubility by thedynamic method resembles that of an extractionassay. Therefore, the experimental runs wereconducted using SFE units. Three SFE unitswere selected and located at two laboratories: (i)LASEFI–DEA/FEA–UNICAMP (SFE–1 andSFE–3); and (ii) DEQ–UFRN (SFE–2). For ev-ery experimental condition, a series of runs withsolvent flow rates from 0.28×10⁻⁵ to 3.2×10⁻⁵ kg/s was performed. Three plants were se-lected for the study because of their widespreaduse in food, cosmetics, and pharmaceutical in-dustries. In addition, they have different agro-nomical profiles: clove (E. caryophyllus) is alarge tree (up to 15 m) and the extract is ob-tained from its fruit; eucalyptus (E. tereticornisSmith) is a bunch and its extract is gotten fromthe leaves; ginger (Z. officinale Roscoe) is a rhi-zome. Assays with clove buds were performed atLASEFI–DEA/FEA–UNICAMP and DEQ–UFRN. The experiments with ginger were con-ducted at LASEFI and the ones with eucalyptusat DEQ–UFRN.
V.M. Rodrigues et al. / J. of Supercritical Fluids 22 (2002) 21–3624
2.1. Raw material selected
2.1.1. Clo�e budsBrazil is the second worldwide producer of
clove buds. Clove buds or its oil are largely usedin food processing, to impart flavor to cigarettesand cosmetics, and in other pharmaceuticalsproducts [3]. Clove buds are a very importantsource of eugenol, a substance used in pharma-ceutical products. In addition, eugenol is used forthe synthesis of vanillin, eugenyl acetate, ethylvanillin, and many other compounds [4].
2.1.2. Eucalyptus lea�esThe E. tereticornis is easily cultivated in the
Northeast of Brazil. Its leaves contain cineol oreucalyptol, the compound responsible for the as-tringent, balsamic, and anti-influenza activities.Its aroma resembles that of some preparations forbronchitis [5].
2.1.3. Ginger rhizomesGinger (Z. officinale Roscoe) is a plant of the
Zingiberaceae family. It is originated mainly fromtropical Asia and it has hundreds of differentspecies, the genus ‘zingiber’ being the most signifi-cant as regards to cultivation for the Chinesepeople. It is also the most important root in theinternational market [6]. It possesses a soft spicytaste and a pleasant scent. Ginger and its extractsare used in food ingredients to improve theiraroma and taste. It is also used by the pharma-ceutical industry in medicines for colic reduction.Ginger is added to food in its natural form or asextract, essential oil or oleoresin. The essential oil,the volatile part of the rhizomes, is responsible forthe aroma, generally obtained by steam distilla-tion. The oleoresin, constituted of essential oil,resins and other non-volatile components, is gen-erally obtained by extraction with organic solvent.
2.2. Raw material preparation
For the assays conducted at LASEFI–DEA/FEA–UNICAMP (Campinas, Sao Paulo, Brazil),the clove buds were bought at a local store (1997crop), kept in plastic flasks hermetically closed,and stored in a domestic freezer (Brastemp, model
vertical-750l, Brazil) at about 268.15 K. Theamount of clove buds required for one experimen-tal run was milled in a helix mill (Marconi, ModelMA 345, Brazil). The system was kept at 289.15K (PolyScience, model 9510, USA). The particlesize distribution was measured using sieves of theTyler series. Particles of sizes −24/+48 meshwere selected for the assays. For the assays per-formed at DEQ–UFRN (Natal, Rio Grande doNorte, Brazil), clove buds from Bahia (Brazil)were bought locally, and were cleaned, kept inplastic bags and stored in a domestic freezer(Consul, model 280, Brazil). For each assay, thefrozen clove buds were triturated in a domesticfood processor (Arno, model PRO, Brazil) for 15min. The triturated material was separated using asieve shaker (Produtest, no. 3614, Brazil) for 15min. Equal amounts of particles of sizes −20/+35 and −35/+48 mesh were used.
The eucalyptus used was from the ExperimentalStation of the Federal University of Ceara (Hortode Plantas Medicinais, Fortaleza, Ceara, Brazil),and it was kept in plastic bags and stored in adomestic freezer (Consul, model 280, Brazil). Foreach assay, the frozen eucalyptus leaves were trit-urated in a domestic food processor (Arno, modelPRO, Brazil) for 15 min. The triturated materialwas separated using a sieve shaker (Produtest, no.3614, Brazil) for 15 min. Fifty percent of particlesof sizes −28/+35, 25% of particles of sizes −35/+48 and 25% of −20/+28 mesh were used.
Gingers from two different crops were used.The first, denoted by Ginger–1, was from the first1996 crop and purchased at Juquia (Sao Paulo,Brazil). The second, denoted by Ginger–2, washarvested in September of 2000 and was fromAtibaia (Sao Paulo, Brazil). Ginger–1 and Ginger
–2 were stored and pre-treated in similar ways.The material was cleaned, selected, packed inplastic bags (10 or 5 kg) and stored in a domesticfreezer (Metalfrio, Double-action, Brazil) at ap-proximately 268.15 K. Ginger–1 was dried at lowtemperature (30 °C) using the procedure de-scribed by Monteiro et al. [7]. Ginger–2 was driedin the dryer described by Brod et al. [8] at 308.15K (�4 K). Particle size distribution was deter-mined in a sieve shaker (Telastemp, Granutest,Brazil). The particles mean diameter was deter-
V.M. Rodrigues et al. / J. of Supercritical Fluids 22 (2002) 21–36 25
mined by the method of Gomide [9]. For all rawmaterials, the humidity was determined by theJacobs’ method [10].
2.3. Characteristics of the particles and of thefixed-bed
The fixed-bed apparent density (da) was calcu-lated using the mass of solid, packed into theextractor (SFE–2) or into the extractor cell(SFE–1 and SFE–3), and its volume. The real ortrue density of the particles (dr) was determinedusing a helium pycnometer at the Analytical Fa-cilities of the Chemistry Institute—IQ/Unicamp.The porosity of the bed plus the particles wascalculated as:
�=1−da
dr
. (1)
2.4. Experimental procedure
2.4.1. Measuring unit 1 (SFE–1)The measuring unit SFE–1 is located at
LASEFI–DEA/FEA–UNICAMP and was de-scribed by Rodrigues et al. [11]. The unit has anautoclave made of 316 LSS (Berghot, model HB-500, maximum pressure of 200 bar, Germany).The original heating system was substituted by arefrigerating jacket and the internal reservoir by ameasuring-cell. The measuring-cell, made ofTeflon, has a capacity of 0.5×10⁻³ m3 with0.064 m of diameter and 0.13 m of height. Acylindrical tube of Teflon (external diameter of0.018 m, length of 0.144 m and wall thickness of0.003 m) was adapted at the center of the measur-ing-cell. This device was used both as the extrac-tor discharge line and as a thermocouple house(Ni–Cr/Ni–DIN 43710). At the upper end of thetube, a perforated lid with 0.064 m of diameterwas adapted and used as a solvent distributor. Atthe bottom end of the tube, a 316 stainless steelfilter (100 mesh) was placed to retain the fine solidparticles dispersed in the mixture solute/solvent.The solid bed was formed inside the measuring-cell and had a concentric cylindrical shape. Shelland tube heat exchangers were used (316 stainlesssteel and length of 6 m) with nominal diameter of
1/4� and of 1/8�. The system has a surge tank(White Martins Co., model 316 LSS DOF3A500,USA), with a jacket used both to control thesolvent temperature and to eliminate pressurefluctuations at the extractor inlet. A HPLC pump(Thermoseparation Products, Model ConstaMet-ric 3200 P/F, USA) controlled the system pres-sure. The refrigerating bathes (PolyScience, model9510, USA) used either water (extractor and surgetank) or a mixture of water and 90% of ethyleneglycol (pump head) maintained at 263.15 K. Thesystem also included a micrometering valve (Au-toclave Engineering, model 10VRM 2812, USA);a digital flow meter (�0.02 l/min, Sierra Instru-ments Inc., USA); a flow totalizer (�0.02 l,LAO, model G-1, Brazil); a heating tape of 1.3 m(Fisaton, Brazil); a temperature sensor (ColePalmer, model 0601-11, USA) with a controller(Dyna Sense, model 2156-40, USA); Bourbontype manometers (�1 bar, 100 and 250 bar,Record, Brazil); online filters (0.2, 0.6, and 20 �m,Swagelok, model SSF-4F, TF N-986, USA);safety valves (400 bar, Swagelok, model 344-4B,serial E, USA); thermal insulation (Montemor,Brazil). The sample collectors were glass flasks of2.0×10−5 m3.
2.4.1.1. Experimental procedure for SFE–1. Twohundred grams or 180 g of milled clove buds wereused for each experimental run. The refrigeratingbathes were turned on and programmed to keepthe temperature at 263.15 K. The system waspressurized up to the surge tank and the systemallowed to reach constant temperature (3 h). Sam-ples of the extract were collected every 5 min andweighted (�0.0001 g, Sartorious, model A200S,USA). The solvent flow rate was continuouslymonitored. For some runs, a glass column with0.15 m of length and 0.006 m of diameter, con-taining adsorbent material (2×10⁻³ kg, PorapakQ, 80–100 mesh, Waters Associates Inc., USA),was placed at the solvent exit to measure theamount of light compounds eventually drained offwith the solvent.
2.4.2. Measuring unit 2 (SFE–2)The measuring unit SFE–2 is located at DEQ–
UFRN and is similar to the unit described by

V.M. Rodrigues et al. / J. of Supercritical Fluids 22 (2002) 21–3626
Ferreira et al. [12]. The unit has a carbon dioxide(99.5% purity, White Martins Gases Industriais)reservoir and a stainless steel surge tank of 500cm3 to refrigerate the solvent (liquid CO2) to thedesired temperature. The fixed-bed extractor con-sists of a stainless steel cylinder with 0.605 m oflength and 0.0216 m of diameter (Brazil). Thetemperature was measured with a digital ther-mometer (Lutron, TM-905 model K, �0.1 °C).The system pressure was limited to 80 bar andmonitored with pressure gauges (Record, withcapacity for 100�1 kgf/cm2, Brazil). Details ofSFE–2 can be found in Souza et al. [13].
2.4.2.1. Experimental procedure for SFE–2. Themeasuring-cell containing the particles was assem-bled into the SFE–2. The refrigerating system wasturned on and the unit was allowed to reach theoperating temperature and pressure. The valvelocated at the extractor’s outlet was then opened.The zero time of the experiment was considered atthe onset of the first drop of extract. Sampleswere collected every 20 min. The solvent flow ratewas monitored every minute using both the flowtotalizer (LAO, Mod G1, Brazil) and a soap-bub-ble flow meter.
2.4.3. Measuring unit 3 (SFE–3)The measuring unit SFE–3 is also located at
LASEFI–DEA/FEA–UNICAMP and was de-scribed by Franca and Meireles [14]. The unit hasa carbon dioxide (99.9% purity, White MartinsGases Industriais) reservoir and stainless steelsurge tanks refrigerated at 263.15 K (Polyscience,model 9510, USA) to keep CO2 as a liquid. TheCO2 pump was from Thermoseparation Products(model 3200, USA). Inside the fixed-bed extractor(stainless steel, 0.43 m of length and 0.033 m ofdiameter, Brazil) the measuring-cell (stainlesssteel, 0.375 m of length and 0.0283 m of diameter,Brazil) was fitted, totally removable from thesystem. The temperature was measured with Fe–Constantan thermocouples adapted to a register(RobertShaw, model T4WM, UK). The pressurewas monitored with pressure gauges (Terbrasma,model 2541, 0–100 bar, �1 bar, Brazil and
Record, model 1554, 0–500 bar, �0.5 bar,Brazil).
2.4.3.1. Experimental procedure for SFE–3. Eightygrams of dry ginger, containing equal amounts ofparticles of sizes 14, 16 and 24 mesh, were manu-ally packed in the measuring-cell. About 2 g ofthe sample were placed per time, with the aid of afunnel and of a metallic stem of 1/4� of diameter,in a way to avoid the deformation and breakageof the solid material. The measuring-cell was thenadapted to the extractor column. The relief valvesof the entrance and exit of the extractor and thepump valve were opened up. After this, the pumpwas turned on to pressurize the extraction line.The pressurization of the tubing was accom-plished in several steps. First, the system waspressurized until the entrance of the extractioncolumn. When the operational conditions werereached, the inlet valve to the extraction columnwas opened up and the measuring-cell was pres-surized. The valves after the extractor were keptclosed. When the whole system was pressurized atthe chosen conditions of pressure and tempera-ture, the valves downstream the extractor wereopened to begin the extraction. The extract sam-ples were collected in glass flasks every 30 or 15min. Immediately after the collector, a glasscolumn (0.15 m of length and 0.08 m of diame-ter), with treated glass wool (Pyrex, model Filter-ing Fiber, USA) in its extremities and packedunder vacuum with 65 mg of the polymericporous Porapak Q (80–100 mesh, Supelco, lot109, USA), was placed in order to retain the lowmolecular mass substances that could otherwisebe drained with the solvent. After each sampling,the collector flask and the capture column wereweighted and stored in a domestic freezer(Brastemp clean, Model 410, Brazil). Samplesfrom the capture column are denoted by E1-CO2
and that from the collector flasks as E2-CO2.During the experimental run, the collector flaskand the capture column were maintained in anice-bath to avoid loss of the more volatile ole-oresin components. The solvent flow rate wasmeasured and monitored after expansion, for eachsampling, by a soap-bubble flow meter [15],adapted in the exit of the solvent.

V.M. Rodrigues et al. / J. of Supercritical Fluids 22 (2002) 21–36 27
2.5. Chemical composition of the extract
The chemical composition of the clove ex-tracts (SFE–1) was determined using a gas chro-matograph (Shimadzu, model GC-17AF CBM101, Japan) equipped with a capillary columnDB-5 (30 m×0.25 mm×0.25 �m). The carriergas was helium (1.7 ml/min). The temperature ofthe injector was 513.15 K and that of the detec-tor 553.15 K. The temperature programmingwas 308.15 K (5 min), 308.15–528.15, 4 K/min,528.15–553.15, 15 K/min and 553.15 K (10min). Split ratio was 1/30 and the flow rate was2.0 ml/min. The sample injected was 0.4 �l ofextract diluted in ethyl acetate (0.005 g of ex-tract diluted in 1.0 ml ethyl acetate, P. A., chro-matographic grade, EM Science, lot 36079631).The identification of the substances was done byGCMS (Shimadzu, model QP-5000, Japan) usingthe GC conditions and was based on: (i) com-parison of the substance mass spectrum with theGC-MS system data bank (Wiley 139 Library);(ii) comparison of the mass spectra with thedata in literature [16]; and (iii) retention index[17]. The quantitative analysis of the extract em-ployed the external standard method [18]. Thequantification was done using a standard solu-tion for each substance identified in the extract:Eugenol (P. A., Sigma, Lot: 17H0239), �-caryophyllene (P. A., Sigma, Lot: 38H2503), �-humulene (P. A., Sigma, Lot: 97H2505). Theeugenyl acetate was obtained by acetylation ofthe eugenol using the method described byMatos [19]. The clove extracts from SFE–2 wereanalyzed using a gas chromatograph (Varian,Model Star 3400 CX, USA) equipped with acapillary column DB-5 (30 m×0.32 mm×0.25�m). The carrier gas was nitrogen (1.4 ml/min).The temperature of the injector was 523.15 Kand that of the detector 593.15 K. The tempera-ture programming was 308.15–453.15 K, 4 K/min, and 453.15–471.15 K, 2 K/min. Theidentification of the substances was done byGCMS (HP–5890 series II and 5911A) using theGC conditions and was based on: (i) comparisonof the substance mass spectra with the GC-MSsystem data bank (Wiley 139 Library); (ii) com-
parison of the mass spectra with the data inliterature [16]; and (iii) retention index [17].
The ginger extracts were analyzed using aGCMS system (Shimadzu, model QP-5000,Japan) equipped with a fused silica capillarycolumn DB-1 (25 m×0.25 mm×0.25 �m) (Gin-ger–1) and DB-5 (30 m×0.25 mm×0.25 �m)(Ginger–2). The electron impact technique (70eV) was used. The carrier gas was helium (1.7ml/min) and 1 �l of sample was injected. Thetemperature was held at 323.15 K for 5 min andthen raised to 553.15 K at 5 K/min. The detec-tor temperature was 503.15 K and that for theinjector was 513.15 K. The identification of thechemical constituents was based on: (i) compari-son of the substance mass spectra with the GC-MS system data bank (Wiley 139 Library); (ii)comparison of the mass spectra with the data inliterature [16]; and (iii) retention indexes [17].
The chemical composition of the eucalyptusextract was determined using the same equip-ment and identification methodology previouslydescribed for the clove extract (SFE–1). Thecarrier gas was helium (1.0 ml/min). The temper-atures of the injector and of the detector were423 and 303 K, respectively. The temperatureprogramming was 333–513 K, 3 K/min.
2.6. Calculation procedures
Using the experimental data, the overall ex-traction curves (OEC) were fitted to a splineusing two straight lines. The first line was iden-tified with the constant extraction rate period(CER). From the spline, the extraction rate forthe CER period (MCER) was computed, as wellas the time corresponding to the interception ofthe two lines (tCER). The spline fit at LASEFIwas done using the procedures PROC REG andPROC NLIN of SAS 6.12 [20]. For dataobtained at DEQ–UFRN, the spline fitting wasdone using multiple-regression analysis(STATISTCA 5.0). MS Excel 97 was used todetermine the interception of the two lines. Themass ratio of solute in the supercritical phase atthe measuring-cell outlet (YCER) was obtaineddividing MCER by the mean solvent flow rate(QCO2
) for the CER period.
V.M. Rodrigues et al. / J. of Supercritical Fluids 22 (2002) 21–3628
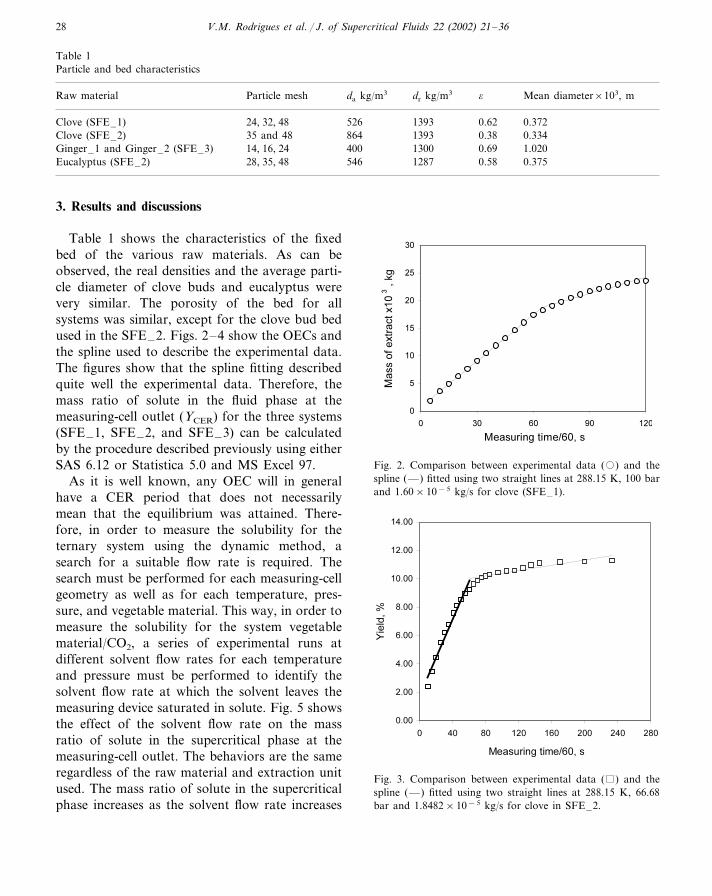
Table 1Particle and bed characteristics
da kg/m3 dr kg/m3 �Particle mesh Mean diameter×103, mRaw material
24, 32, 48Clove (SFE–1) 526 1393 0.62 0.372864 139335 and 48 0.38Clove (SFE–2) 0.334
14, 16, 24Ginger–1 and Ginger–2 (SFE–3) 400 1300 0.69 1.020546 1287 0.58Eucalyptus (SFE–2) 0.37528, 35, 48
3. Results and discussions
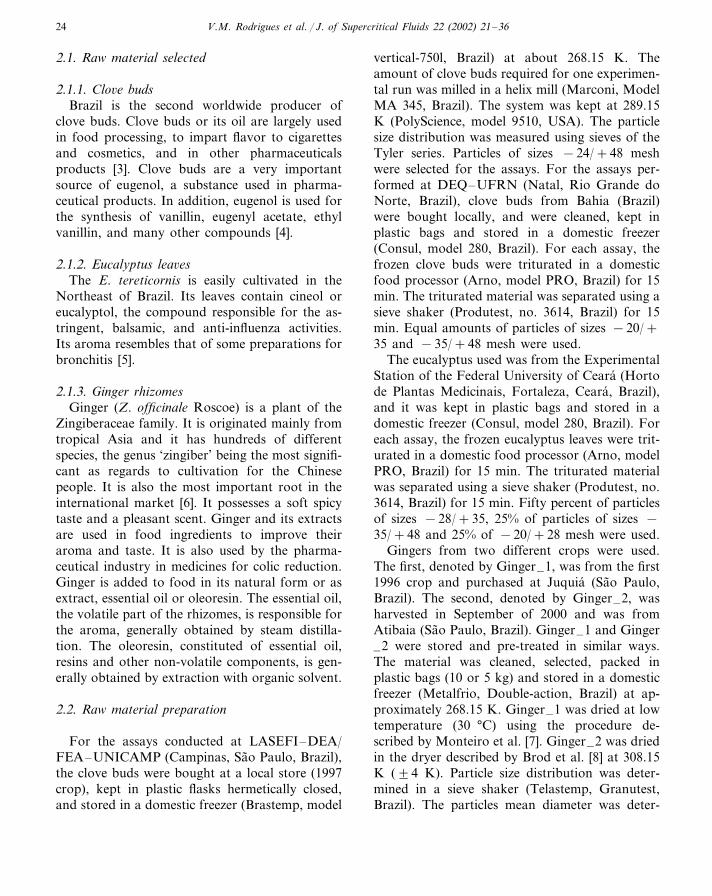
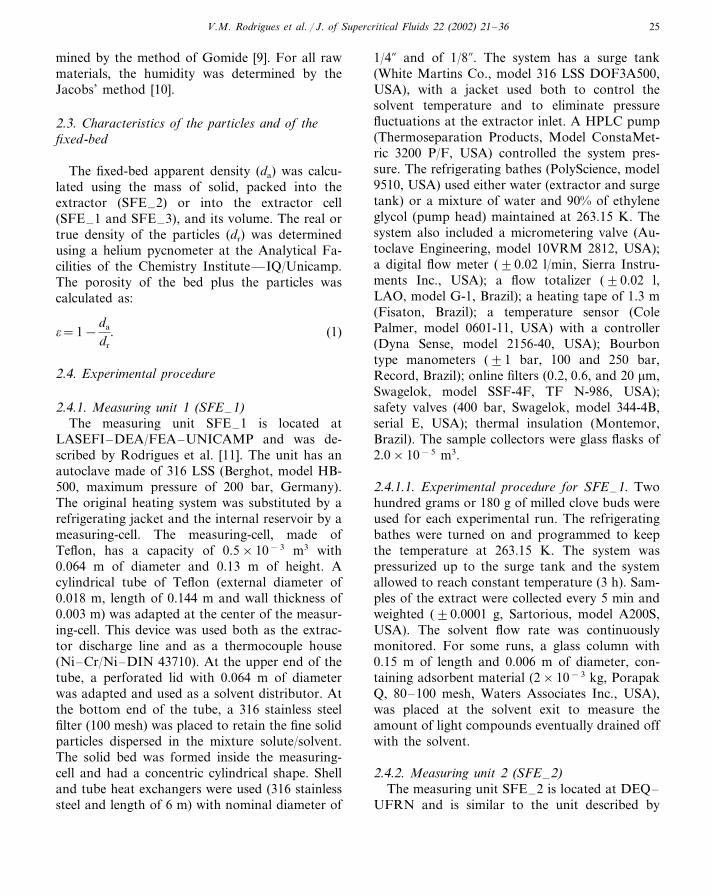
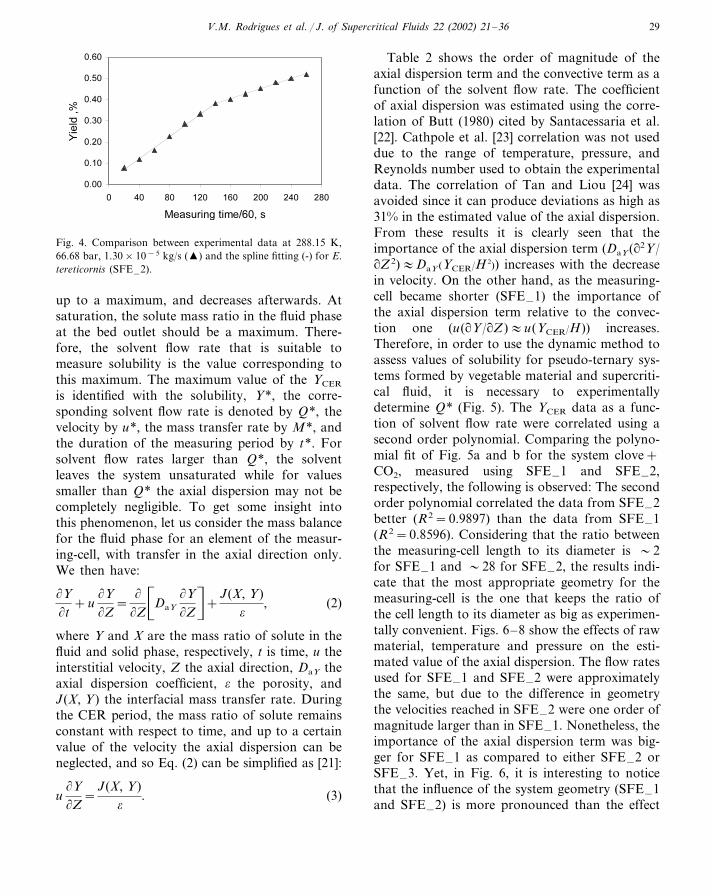
Table 1 shows the characteristics of the fixedbed of the various raw materials. As can beobserved, the real densities and the average parti-cle diameter of clove buds and eucalyptus werevery similar. The porosity of the bed for allsystems was similar, except for the clove bud bedused in the SFE–2. Figs. 2–4 show the OECs andthe spline used to describe the experimental data.The figures show that the spline fitting describedquite well the experimental data. Therefore, themass ratio of solute in the fluid phase at themeasuring-cell outlet (YCER) for the three systems(SFE–1, SFE–2, and SFE–3) can be calculatedby the procedure described previously using eitherSAS 6.12 or Statistica 5.0 and MS Excel 97.
As it is well known, any OEC will in generalhave a CER period that does not necessarilymean that the equilibrium was attained. There-fore, in order to measure the solubility for theternary system using the dynamic method, asearch for a suitable flow rate is required. Thesearch must be performed for each measuring-cellgeometry as well as for each temperature, pres-sure, and vegetable material. This way, in order tomeasure the solubility for the system vegetablematerial/CO2, a series of experimental runs atdifferent solvent flow rates for each temperatureand pressure must be performed to identify thesolvent flow rate at which the solvent leaves themeasuring device saturated in solute. Fig. 5 showsthe effect of the solvent flow rate on the massratio of solute in the supercritical phase at themeasuring-cell outlet. The behaviors are the sameregardless of the raw material and extraction unitused. The mass ratio of solute in the supercriticalphase increases as the solvent flow rate increases
Fig. 2. Comparison between experimental data (�) and thespline (— ) fitted using two straight lines at 288.15 K, 100 barand 1.60×10⁻⁵ kg/s for clove (SFE–1).
Fig. 3. Comparison between experimental data (�) and thespline (— ) fitted using two straight lines at 288.15 K, 66.68bar and 1.8482×10⁻⁵ kg/s for clove in SFE–2.
V.M. Rodrigues et al. / J. of Supercritical Fluids 22 (2002) 21–36 29
Fig. 4. Comparison between experimental data at 288.15 K,66.68 bar, 1.30×10⁻⁵ kg/s (�) and the spline fitting (-) for E.tereticornis (SFE–2).
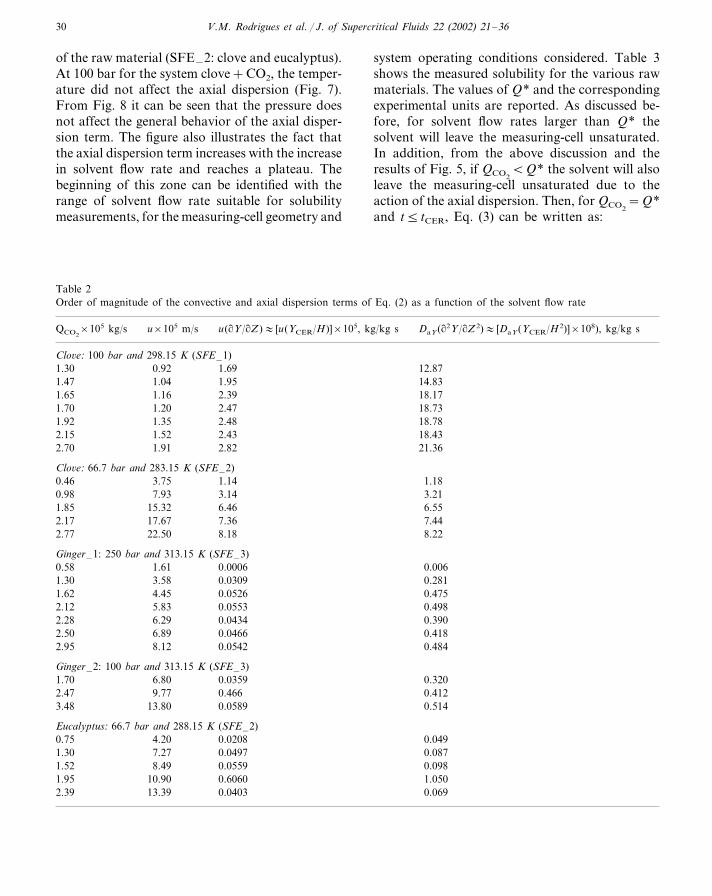
Table 2 shows the order of magnitude of theaxial dispersion term and the convective term as afunction of the solvent flow rate. The coefficientof axial dispersion was estimated using the corre-lation of Butt (1980) cited by Santacessaria et al.[22]. Cathpole et al. [23] correlation was not useddue to the range of temperature, pressure, andReynolds number used to obtain the experimentaldata. The correlation of Tan and Liou [24] wasavoided since it can produce deviations as high as31% in the estimated value of the axial dispersion.From these results it is clearly seen that theimportance of the axial dispersion term (DaY(�2Y/�Z2)�DaY (YCER/H 2)) increases with the decreasein velocity. On the other hand, as the measuring-cell became shorter (SFE–1) the importance ofthe axial dispersion term relative to the convec-tion one (u(�Y/�Z)�u(YCER/H)) increases.Therefore, in order to use the dynamic method toassess values of solubility for pseudo-ternary sys-tems formed by vegetable material and supercriti-cal fluid, it is necessary to experimentallydetermine Q* (Fig. 5). The YCER data as a func-tion of solvent flow rate were correlated using asecond order polynomial. Comparing the polyno-mial fit of Fig. 5a and b for the system clove+CO2, measured using SFE–1 and SFE–2,respectively, the following is observed: The secondorder polynomial correlated the data from SFE–2better (R2=0.9897) than the data from SFE–1(R2=0.8596). Considering that the ratio betweenthe measuring-cell length to its diameter is �2for SFE–1 and �28 for SFE–2, the results indi-cate that the most appropriate geometry for themeasuring-cell is the one that keeps the ratio ofthe cell length to its diameter as big as experimen-tally convenient. Figs. 6–8 show the effects of rawmaterial, temperature and pressure on the esti-mated value of the axial dispersion. The flow ratesused for SFE–1 and SFE–2 were approximatelythe same, but due to the difference in geometrythe velocities reached in SFE–2 were one order ofmagnitude larger than in SFE–1. Nonetheless, theimportance of the axial dispersion term was big-ger for SFE–1 as compared to either SFE–2 orSFE–3. Yet, in Fig. 6, it is interesting to noticethat the influence of the system geometry (SFE–1and SFE–2) is more pronounced than the effect
up to a maximum, and decreases afterwards. Atsaturation, the solute mass ratio in the fluid phaseat the bed outlet should be a maximum. There-fore, the solvent flow rate that is suitable tomeasure solubility is the value corresponding tothis maximum. The maximum value of the YCER
is identified with the solubility, Y*, the corre-sponding solvent flow rate is denoted by Q*, thevelocity by u*, the mass transfer rate by M*, andthe duration of the measuring period by t*. Forsolvent flow rates larger than Q*, the solventleaves the system unsaturated while for valuessmaller than Q* the axial dispersion may not becompletely negligible. To get some insight intothis phenomenon, let us consider the mass balancefor the fluid phase for an element of the measur-ing-cell, with transfer in the axial direction only.We then have:
�Y�t
+u�Y�Z
=�
�Z�
DaY
�Y�Zn
+J(X, Y)
�, (2)
where Y and X are the mass ratio of solute in thefluid and solid phase, respectively, t is time, u theinterstitial velocity, Z the axial direction, DaY theaxial dispersion coefficient, � the porosity, andJ(X, Y) the interfacial mass transfer rate. Duringthe CER period, the mass ratio of solute remainsconstant with respect to time, and up to a certainvalue of the velocity the axial dispersion can beneglected, and so Eq. (2) can be simplified as [21]:
u�Y�Z
=J(X, Y)
�. (3)
V.M. Rodrigues et al. / J. of Supercritical Fluids 22 (2002) 21–3630
of the raw material (SFE–2: clove and eucalyptus).At 100 bar for the system clove+CO2, the temper-ature did not affect the axial dispersion (Fig. 7).From Fig. 8 it can be seen that the pressure doesnot affect the general behavior of the axial disper-sion term. The figure also illustrates the fact thatthe axial dispersion term increases with the increasein solvent flow rate and reaches a plateau. Thebeginning of this zone can be identified with therange of solvent flow rate suitable for solubilitymeasurements, for the measuring-cell geometry and
system operating conditions considered. Table 3shows the measured solubility for the various rawmaterials. The values of Q* and the correspondingexperimental units are reported. As discussed be-fore, for solvent flow rates larger than Q* thesolvent will leave the measuring-cell unsaturated.In addition, from the above discussion and theresults of Fig. 5, if QCO2
�Q* the solvent will alsoleave the measuring-cell unsaturated due to theaction of the axial dispersion. Then, for QCO2
=Q*and t� tCER, Eq. (3) can be written as:
Table 2Order of magnitude of the convective and axial dispersion terms of Eq. (2) as a function of the solvent flow rate
u(�Y/�Z)� [u(YCER/H)]×105, kg/kg su×105 m/s DaY(�2Y/�Z2)� [DaY(YCER/H2)]×108), kg/kg sQCO2×105 kg/s
Clo�e: 100 bar and 298.15 K (SFE–1)0.92 1.69 12.871.30
14.831.47 1.951.0418.171.65 2.391.1618.732.471.70 1.2018.781.351.92 2.48
1.522.15 2.43 18.431.91 21.362.70 2.82
Clo�e: 66.7 bar and 283.15 K (SFE–2)1.180.46 1.143.75
7.930.98 3.14 3.2115.321.85 6.46 6.5517.672.17 7.36 7.4422.50 8.222.77 8.18
Ginger–1: 250 bar and 313.15 K (SFE–3)0.58 1.61 0.0006 0.006
3.581.30 0.0309 0.2810.4751.62 0.05264.45
5.832.12 0.0553 0.4986.29 0.3902.28 0.0434
2.50 6.89 0.4180.04660.4842.95 8.12 0.0542
Ginger–2: 100 bar and 313.15 K (SFE–3)6.80 0.3200.03591.70
0.4120.4669.772.473.48 13.80 0.0589 0.514
Eucalyptus: 66.7 bar and 288.15 K (SFE–2)0.75 4.20 0.0490.0208
7.27 0.04971.30 0.0870.0988.491.52 0.0559
10.90 0.60601.95 1.0500.0690.040313.392.39

V.M. Rodrigues et al. / J. of Supercritical Fluids 22 (2002) 21–36 31
Fig. 5. Effect of solvent flow rate on the mass ratio of solute in the supercritical phase at the measuring-cell outlet. The line thatrepresents the tendency lines for the experimental data are second order polynomial. R2 is the correlation ratio.
characterize the pseudo-ternary system. Table 4shows the phytochemical profile of the clove ex-tract obtained in SFE–1. The major compoundswere eugenol, �-caryophyllene, �-humulene andeugenyl acetate, regardless of the experimentalcondition. A similar behavior was observed forthe clove extract obtained in SFE–2 (Table 5).
u*�Y�Z
=M*
NCO2
, (4)
where NCO2is the mass of solvent used up to time
t*. Integration of Eq. (4) from the entrance to theoutlet of the measuring-cell gives:
Y*(H)=M*
NCO2u*
H. (5)
Eq. (5) clearly shows that in order to apply thedynamic method to measure solubility for eachgeometry of the measuring-cell, either the valueQ* or u* must be determined. Otherwise, re-ported values of the solubility for systems cellu-losic structure+solute+solvent can be smallerthan the true value due to either very low (axialdispersion not negligible) or very large flow rates.
There is still a last question to discuss: if thecomposition of the extract changes appreciablyduring the CER period (the measuring period)then Y* would be of very low significance for thedesign, except for the cases of fractional extrac-tion, such as the SFE of caffeine [1] andcarotenoids [14]. Therefore, the knowledge of theextract composition is required to completely
Fig. 6. Influence of raw material on the estimated value of DaY
as a function of the interstitial velocity.

V.M. Rodrigues et al. / J. of Supercritical Fluids 22 (2002) 21–3632
Fig. 7. Influence of temperature on the estimated value of DaY
at 100 bar as a function of the interstitial velocity, data fromSFE–1.
Fig. 8. Influence of the pressure on the axial dispersion termfor the system clove buds /CO2 (SFE–1) at 388.15 K.
Table 3Solubility measured by the dynamic method for pseudo-ternary system
T K P bar Experimental systemY*×103 kg/kg Q*×105 kg/s
Clo�e258 1.84 SFE–266.7283.15
66.0 220 SFE–11.74288.1566.7 234 SFE–21.85288.15
288.15 70.0 230 1.51 SFE–123872.0 1.65288.15 SFE–1
SFE–180.0 244 1.60288.15SFE–11.64277288.15 100.0SFE–1100.0 267 1.65298.15SFE–1100.0 230 1.54308.15
Ginger150 5.15293.15 1.57 SFE–3200 4.14 SFE–31.63293.15
293.15 250 5.38 1.64 SFE–31.752.92 SFE–3100303.15a
150 5.78 SFE–31.62303.15SFE–31.635.21303.15 200
303.15 250 5.90 1.68 SFE–3303.15a 300 6.57 1.70 SFE–3
1.721.99 SFE–3100313.15a
150 6.41 1.60 SFE–3313.15200 6.73 1.61 SFE–3313.15
SFE–3250 7.20 1.65313.15SFE–3313.15a 1.72300 5.97
Eucalyptus66.7 SFE–22.03 1.47283.15
SFE–21.643.25298.15 66.766.7 4.07 1.56 SFE–2293.1566.7 3.95 1.52 SFE–2288.15
SFE–278.5 4.94 1.48288.15
a Data for Ginger–2.

V.M. Rodrigues et al. / J. of Supercritical Fluids 22 (2002) 21–36 33
Table 4Relative proportion for the compounds identified in the clove bud extract (SFE–1) at 100 bar 298.15 K and Q*=1.65×10⁻⁵ kg/s
Eugenyl acetate %�-caryophyllene % Humulene %Eugenol %Measuring time/60 s
Compounds16.0123.2458.3810 2.3716.3520 2.0859.93 21.64
30 2.0117.8620.2659.8717.7119.55 2.0060.744016.67 1.8950 62.28 19.16
60 63.63 17.28 1.8417.2517.77 1.6570 64.19 16.36
80 1.4717.9013.9866.6513.3612.96 1.3769.3190
120 15.61 1.4410.9272.03
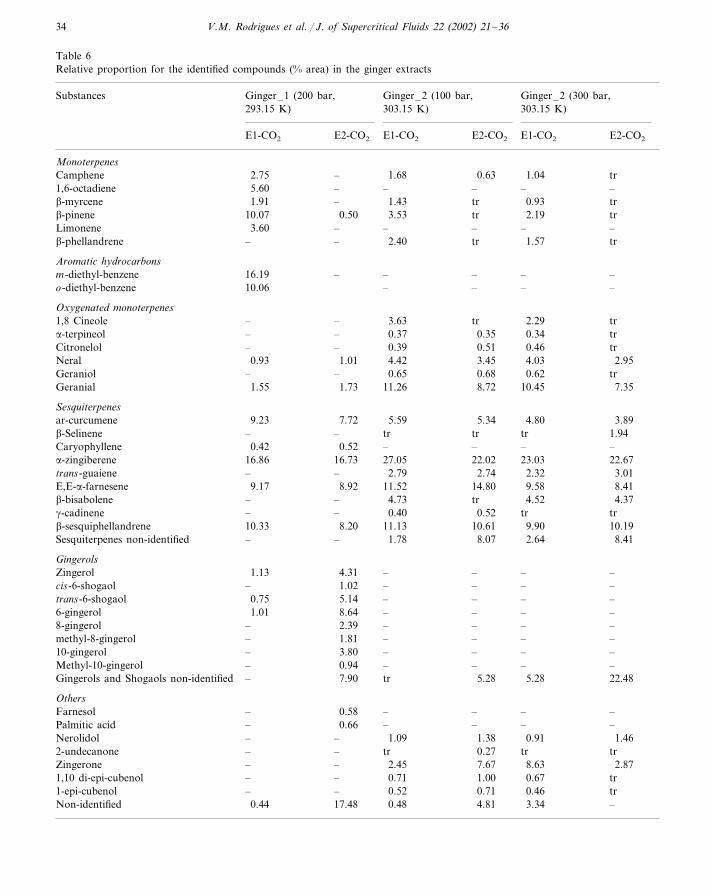
Figs. 2 and 3 indicate that the CER period ends atabout 50 min and so Tables 4 and 5 show that thecomposition of clove extracts remained approxi-mately constant for measuring times smaller than50 min. Therefore, although the origin of the rawmaterial is important, for design purposes it canbe overlooked. The quantitative analysis of theextract showed that the eugenol is present inlarger amounts (larger mass) for all conditions.From this, one may suggest that the solubility forthe pseudo-ternary system is governed by thesolubility of the eugenol in CO2. Table 6 showsthe composition of the ginger extracts. Samplesfrom the collector flask as well as from the cap-ture column were analyzed and are identified asE1-CO2 and E2-CO2, respectively. The data showthat Ginger–2 produced a richer extract as com-pared to Ginger–1 but the behavior of the solu-bility for both systems was similar (Table 3).
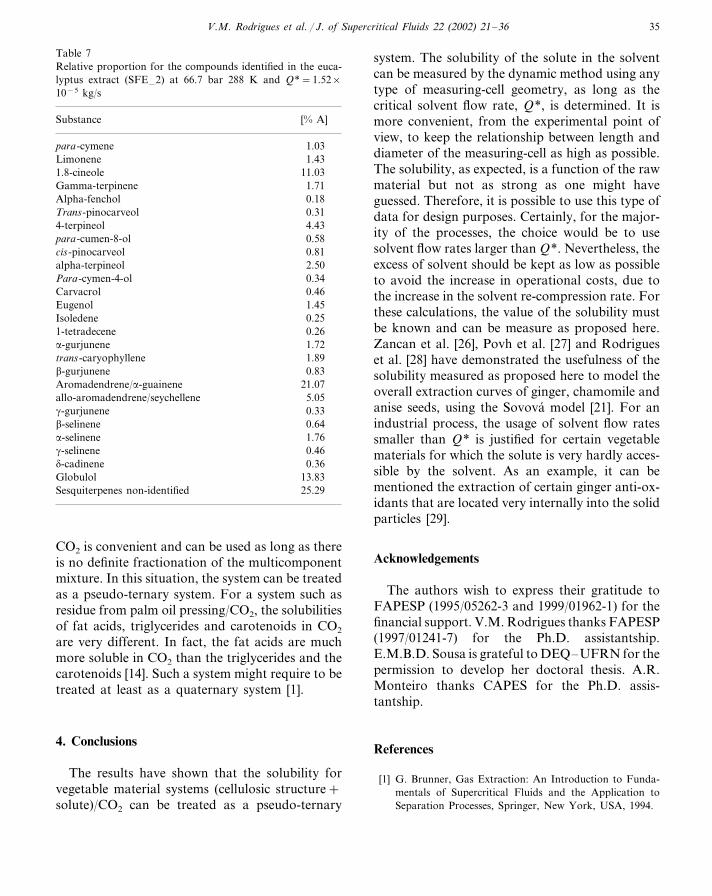
Monteiro [25] showed that the composition of theginger extracts remained approximately constantduring the CER period and so the compositiongiven in Table 6 corresponds to the ginger extractat any given processing time. Table 7 presents thecomposition of the eucalyptus extract (total). Thesubstances present on larger amounts were aro-madendrene, globulol and 1,8 cineol. About 25%of the sesquiterpenes were not identified for E.tereticornis, a plant easily grown in the BrazilianNortheast region, for which very few informationis available in the literature to help to elucidate itscomposition.
A careful analysis of the data on Tables 4–7show that care must be taken when using a globalproperty to describe the behavior of a multicom-ponent mixture. Nevertheless, the use of a globalproperty like Y* to describe the thermodynamicrestraints for systems such as vegetable material/
Table 5Relative proportion for the compounds identified in the clove bud extract (SFE–2) at 66.67 bar 283 K and Q*=1.47×10⁻⁵ kg/s
Eugenyl acetate % Humulene %Measuring time/60 s �-caryophyllene %Eugenol %
Compounds25.5260.2710 2.5311.68
2.6213.4424.3715 59.5763.59 20.34 13.69 2.3745
13.7864.28 19.6360 2.3185 66.90 16.96 13.57 1.78
65.54 17.10105 15.24 2.10010.266.1183.63155
80.18 8.25165 11.58 091.25332 2.61 6.10 0
V.M. Rodrigues et al. / J. of Supercritical Fluids 22 (2002) 21–3634
Table 6Relative proportion for the identified compounds (% area) in the ginger extracts
Ginger–2 (100 bar, Ginger–2 (300 bar,Substances Ginger–1 (200 bar,303.15 K)293.15 K) 303.15 K)
E1-CO2 E2-CO2 E1-CO2 E2-CO2E2-CO2E1-CO2
Monoterpenes2.75 – 1.68 0.63 1.04 trCamphene
–1,6-octadiene –5.60 – ––1.43 tr 0.93– tr�-myrcene 1.91
0.5010.07 3.53 tr 2.19 tr�-pinene– – – –Limonene 3.60 –
2.40 tr 1.57 tr––�-phellandrene
Aromatic hydrocarbons16.19 – – – – –m-diethyl-benzene10.06 – – – –o-diethyl-benzene
Oxygenated monoterpenes3.631,8 Cineole tr– 2.29 tr–
– – 0.37 0.35 0.34 tr�-terpineol0.39Citronelol 0.51– 0.46 tr–4.42 3.45 4.031.01 2.950.93Neral
–– 0.65 0.68 0.62 trGeraniol1.731.55 11.26 8.72 10.45 7.35Geranial
Sesquiterpenes5.59ar-curcumene 5.349.23 4.80 3.897.72
– – tr tr tr 1.94�-Selinene0.42 0.52 – – – –Caryophyllene
27.05 22.02 23.0316.73 22.67�-zingiberene 16.862.79trans-guaiene 2.74– 2.32 3.01–
11.52 14.80 9.588.92 8.41E,E-�-farnesene 9.17–– 4.73 tr 4.52 4.37�-bisabolene
0.40 0.52 tr tr�-cadinene – –11.13 10.61 9.908.20 10.1910.33�-sesquiphellandrene
Sesquiterpenes non-identified 1.78– 8.07 2.64 8.41–
Gingerols–Zingerol –1.13 – –4.31– – –1.02 –cis-6-shogaol –
5.140.75 – – – –trans-6-shogaol– – –6-gingerol –1.01 8.64– – –2.39 ––8-gingerol
1.81– – – – –methyl-8-gingerol– –10-gingerol –– –3.80– – –0.94 ––Methyl-10-gingerol
Gingerols and Shogaols non-identified tr– 5.28 5.28 22.487.90
Others–Farnesol –– – –0.58– – –0.66 ––Palmitic acid
–– 1.09 1.38 0.91 1.46Nerolidol2-undecanone tr– 0.27 tr tr–
2.45 7.67 8.63– 2.87Zingerone ––– 0.71 1.00 0.67 tr1,10 di-epi-cubenol
0.52 0.711-epi-cubenol 0.46– tr–0.48 4.81 3.34 –Non-identified 17.480.44
V.M. Rodrigues et al. / J. of Supercritical Fluids 22 (2002) 21–36 35
Table 7Relative proportion for the compounds identified in the euca-lyptus extract (SFE–2) at 66.7 bar 288 K and Q*=1.52×10⁻⁵ kg/s
Substance [% A]
1.03para-cymene1.43Limonene
1.8-cineole 11.031.71Gamma-terpinene0.18Alpha-fenchol0.31Trans-pinocarveol4.434-terpineol0.58para-cumen-8-ol0.81cis-pinocarveol
alpha-terpineol 2.500.34Para-cymen-4-ol0.46Carvacrol1.45Eugenol0.25Isoledene
1-tetradecene 0.261.72�-gurjunene
trans-caryophyllene 1.890.83�-gurjunene
21.07Aromadendrene/�-guainene5.05allo-aromadendrene/seychellene0.33�-gurjunene
�-selinene 0.641.76�-selinene0.46�-selinene0.36�-cadinene
13.83Globulol25.29Sesquiterpenes non-identified
system. The solubility of the solute in the solventcan be measured by the dynamic method using anytype of measuring-cell geometry, as long as thecritical solvent flow rate, Q*, is determined. It ismore convenient, from the experimental point ofview, to keep the relationship between length anddiameter of the measuring-cell as high as possible.The solubility, as expected, is a function of the rawmaterial but not as strong as one might haveguessed. Therefore, it is possible to use this type ofdata for design purposes. Certainly, for the major-ity of the processes, the choice would be to usesolvent flow rates larger than Q*. Nevertheless, theexcess of solvent should be kept as low as possibleto avoid the increase in operational costs, due tothe increase in the solvent re-compression rate. Forthese calculations, the value of the solubility mustbe known and can be measure as proposed here.Zancan et al. [26], Povh et al. [27] and Rodrigueset al. [28] have demonstrated the usefulness of thesolubility measured as proposed here to model theoverall extraction curves of ginger, chamomile andanise seeds, using the Sovova model [21]. For anindustrial process, the usage of solvent flow ratessmaller than Q* is justified for certain vegetablematerials for which the solute is very hardly acces-sible by the solvent. As an example, it can bementioned the extraction of certain ginger anti-ox-idants that are located very internally into the solidparticles [29].
Acknowledgements
The authors wish to express their gratitude toFAPESP (1995/05262-3 and 1999/01962-1) for thefinancial support. V.M. Rodrigues thanks FAPESP(1997/01241-7) for the Ph.D. assistantship.E.M.B.D. Sousa is grateful to DEQ–UFRN for thepermission to develop her doctoral thesis. A.R.Monteiro thanks CAPES for the Ph.D. assis-tantship.
References
[1] G. Brunner, Gas Extraction: An Introduction to Funda-mentals of Supercritical Fluids and the Application toSeparation Processes, Springer, New York, USA, 1994.
CO2 is convenient and can be used as long as thereis no definite fractionation of the multicomponentmixture. In this situation, the system can be treatedas a pseudo-ternary system. For a system such asresidue from palm oil pressing/CO2, the solubilitiesof fat acids, triglycerides and carotenoids in CO2
are very different. In fact, the fat acids are muchmore soluble in CO2 than the triglycerides and thecarotenoids [14]. Such a system might require to betreated at least as a quaternary system [1].
4. Conclusions
The results have shown that the solubility forvegetable material systems (cellulosic structure+solute)/CO2 can be treated as a pseudo-ternary
V.M. Rodrigues et al. / J. of Supercritical Fluids 22 (2002) 21–3636
[2] M.A. McHugh, V.J. Krukonis, Supercritical Fluid Ex-traction: Principles and Practice, Butterworth-Heine-mann, Newton, USA, 1994.
[3] G. Vernin, E. Verinin, J. Metzger, L. Pujol, C. Parkanyi,GC/MS analysis of clove essential oils, in: GeorgeCharalambous (Ed.), Spices, Herbs and Edible Fungi,Elsevier Science, Amsterdam, Holland, 1994, p. 483.
[4] A.A. Craveiro, D.C. Queiroz, Oleos essenciais e quımicafina, Quımica Nova 16 (1993) 224.
[5] F.J.A. Matos, Farmacias Vivas, Edicoes da UniversidadeFederal do Ceara, Fortaleza, Brazil, 1998.
[6] J.P. Bartley, P. Foley, Supercritical fluid extraction ofAustralian-grown ginger (Zingiber officinale), Journal ofthe Science of Food and Agriculture 66 (1994) 365.
[7] A.R. Monteiro, M.A.A. Meireles, M.O.M. Marques,Ginger (Zingiber officinale) essential oil and oleoresinextraction with pressurized CO2: an evaluation of pre-treatment and process variables in oil composition, in: M.Perrut (ed.), Proceedings of the 5th Meeting on Supercrit-ical Fluids: Natural Products and Materials, Nice,France, 2, 1998, p. 515.
[8] F.D. Brod, R. Oliveira, K.J. Park, Estudo de um secadorconvectivo de fluxo perpendicular e paralelo, Proceedingsof the 29th Congresso Brasileiro de Engenharia Agrı-cola—CONBEA 2000, Fortaleza, CE, 2000, CD Rom.
[9] R. Gomide, in: Cenpro (Ed.), Manual de OperacoesUnitarias, Sao Paulo, Brazil.
[10] M.B. Jacobs, The Chemical Analysis of Food and Prod-ucts, Robert Krieger Publishing Co., New York, USA,1973.
[11] V.M. Rodrigues, M.A.A. Meireles, M.O.M. Marques,Determination of the solubility of clove essential oil inCO2: a standardization of the dynamic method, Proceed-ings of the 5th International Symposium on SupercriticalFluids, Westin Atlanta, Georgia, USA, 2000, CD-Rom.
[12] S.R.S. Ferreira, M.A.A. Meireles, F.A. Cabral, Extrac-tion of essential oil of black pepper with liquid carbondioxide, Journal of Food Engineering 20 (1993) 121.
[13] E.M.B.D. Sousa, O. Chiavone-Filho, M.T. Moreno,H.N.M Oliveira, M.A.A. Meireles, Experimental resultsfor the extraction of essential oil from the species LippiaSidoides in pressurized carbon dioxide, Proceedings of the2nd International Meeting on High Pressure ChemicalEngineering, TUHH, Hamburg, Germany, 2001, CD-Rom.
[14] L.F. Franca, M.A.A. Meireles, Modeling the extractionof carotene and lipids from pressed palm oil (Elaesguineensis) fibers using supercritical CO2, Journal of Su-percritical Fluids 18 (2000) 35.
[15] A.R. Monteiro, M.A.A. Meireles, M.O.M. Marques, A.J.Petenate, Extraction of the soluble material from theshells of the bacuri fruit (Platonia insignis Mart) withpressurized CO2 and other solvents, Journal of Supercrit-ical Fluids 11 (1997) 91.
[16] F.W. McLaferty, D.B. Stauffer, The Wiley/NBS Registry
of Mass Spectral Data, vols. 1–2, John Wiley and Sons,New York, USA, 1989.
[17] R.P. Adams, Identification of Essential Oil Componentsby Gas Chromatography/Mass Spectroscopy, AlluredPublishing Corporation, Illinois, USA, 1995.
[18] C.H. Collins, G.L. Braga, P.S. Bonato, Introducao aMetodos Cromatograficos, Editora da Unicamp, Camp-inas, Brazil, 1995.
[19] F.J.A. Matos, Introducao a Fitoquımica Experimental,Editora da Universidade Federal do Ceara, Fortaleza,CE, Brazil, 1997.
[20] R.J. Freund, R.C. Littell, SAS System for Regression—SAS Series in Statistical Applications, SAS Institute Inc.,NC, USA, 1995.
[21] H. Sovova, Rate of the vegetable oil extraction withsupercritical CO2–I. Modeling of extraction curves,Chemical Engineering Science 49 (1994) 409.
[22] E. Santacesaria, M. Morbidelli, A. Servida, G. Storti, S.Carra, Separation of xylenes on Y zeolites. 2. Break-through curves and their interpretation, Ind. Eng. Chem.Proc esso Des. Dev. 21 (1982) 446.
[23] O.J. Cathpole, R. Berning, M.B. King, Measurement andcorrelation of Packed-Bed axial dispersion coefficients insupercritical carbon dioxide, Ind. Eng. Chem. Res. 35(1996) 824.
[24] C.-S. Tan, D.-C. Liou, Axial dispersion of supercriticalcarbon dioxide in packed beds, Ind. Eng. Res. 28 (1989)1246.
[25] A.R. Monteiro, Extracao do Oleo Essencial/Oleoresina deGengibre (Zingiber officinale Roscoe) com CO2 Super-crıtico: uma avaliacao do pre-tratamento e das variaveisde processo, Doctoral thesis, FEA—Universidade Estad-ual de Campinas (Unicamp), Campinas, Sao Paulo,Brazil, 1999.
[26] K.C. Zancan, M.O.M. Marques, M.A.A. Meireles, A.J.Petenate, Extraction of ginger (Zingiber officinale Roscoe)oleoresin with CO2 and Co-solvents: a study of the an-tioxidant action of the extracts, Proceedings of the 2ndInternational Meeting on High Pressure Chemical Engi-neering, TUHH, Hamburg, Germany, 2001, CD-Rom.
[27] N.P. Povh, M.A.A. Meireles, M.O.M. Marques, Super-critical CO2 extraction of essential oil and oleoresin fromchamomile (Matricaria recutita [L.] Rauschert), Proceed-ings of the 2nd International Meeting on High PressureChemical Engineering, TUHH, Hamburg, Germany,2001, CD-Rom.
[28] V.M. Rodrigues, M.O.M. Marques, M.A.A. Meireles,Supercritical extraction of essential oil from anise seed(Pimpinella anisum, L) using CO2: Kinetics and equi-librium data, Proceedings of the 2nd International Meet-ing on High Pressure Chemical Engineering, TUHH,Hamburg, Germany, 2001, CD-Rom.
[29] V.S. Govidarajan, CRC Critical Reviews in Food Scienceand Nutrition, vol. 17, CRC Press Inc., Florida, 1982,p. 1.
.