Embed Size (px)
Citation preview
Journal of Economics and Sustainable Development www.iiste.org
ISSN 2222-1700 (Paper) ISSN 2222-2855 (Online)
Vol.5, No.17, 2014
161
Determination Of The Significance Level Of Environmental And Economic Effects Of The Road Failure Of Onitsha-Enugu
Expressway Southeastern Nigeria On The Road Users.
ONUOHA, D. C.; NNODU, V. C. & UWADIEGWU, B. O
ENVIRONMENTAL MANAGEMENT DEPARTMENT, ENVRONMENTAL FACULTY, NNAMDI AZIKIWE UNIVERSITY, P.M.B. 5025, AWKA, NIGERIA.
ABSTRACT
Considering the implications of the problem of road failure to man and the failure of Onitsha-Enugu Expressway
which has been lingering for many years now, this work was borne with the aim of evaluating the stand of the
road users on the Economic, Health and Environmental effects of the road failure of Onitsha-Enugu Expressway
on them. To this effect, population of the road users was determined by volumetric analysis and their opinions
were harnessed using questionnaire survey method. The data obtained was analyzed using Student-T test in
which the available options were grouped into 2, namely agree and disagree. The test was done separately for
economic, health and environmental effects respectively. It was found that there exist differences in the
percentage of agreement and disagreement for each effect with the percentage of respondents in agreement being
greater in all. The statistical analysis confirmed that there is significant difference. The work therefore concluded
that the failure of Onitsha-Enugu Expressway has significantly negative economic, health and environmental
effects on the road users. The work thus recommended an immediate intervention of the government to hasten
the contractors and all concerned to repair this failed road in order to minimize these negative effects.
1.0 Introduction
1.1 Background to the Study
A road pavement is supposed to be a continuous stretch of asphalt lay for a smooth ride or drive. Visible cracks,
potholes, bulges and depressions may punctuate such smooth ride. The punctuation in smooth ride is generally
regarded as road failure. According to the Federal Ministry of Works and Housing (FMW&H 1992), failed roads
are characterized by potholes, polishing / pavement surface wash, block and longitudinal cracks, drainage
collapse, depressions / sinking of roadway, over flooding of the carriageway, gullies and trenches, rutting and
raveling all of which are evident along the Onitsha -Enugu expressway under study confirming it’s failure.
Cedarholm, Reid and Salo (1981); and Hagans, Weaver and Madej (1986). in their study of the Cumulative
effects of logging road sediment were of the opinion that surface erosion from roads can produce chronic sources
of fine sediment which can diminish salmon and steelhead spawning success. According to them, roads
constructed next to streams are chronic contributors of fine sediment, particularly if they are used in winter
months, thus serious environmental effects like siltation may be encouraged. Lecocq and Shalizi (2009) also
supported that environmental effects of road failures are real. Air pollution by dust particulates is one of the
issues raised.
The FMWH (1992); Paul and Radnor (1976); and Oglesby and Garry (1978) disclosed the expenditure for
repairs and maintenance of roads in Nigeria 1986, the United States of America for 1975 and 1978 fiscal years
respectively, reporting that the cost constitute a significant percentage of the respective year’s budget for
brought to you by COREView metadata, citation and similar papers at core.ac.uk
provided by International Institute for Science, Technology and Education (IISTE): E-Journals

Journal of Economics and Sustainable Development www.iiste.org
ISSN 2222-1700 (Paper) ISSN 2222-2855 (Online)
Vol.5, No.17, 2014
162
highways and road construction in the respective countries.Considering the available figures, they maintained
that the problems of road maintenance is better seen than exaggerated thus road failures has economic effects.
Moreover, infrastructure services raise the productivity of other factors of production (Kessides, 1993). A few
authors have explicitly modeled the nonlinearity of infrastructure’s impact on output, growth, or production
costs. As can be seen in the works of Ajayi (1995); Fernald (1999); and Röller and Waverman (2001). Acording
to Romp and de Haan, (2005) and Hurlin (2006); Infrastructure services are mostly provided through networks, a
fact that implies a nonlinear relation with output. roads, rail, and water/sanitation are also networked services, so
the impact of new investments on growth, output, or firm costs will depend on the overall state and extent of the
network. Aigbedion (2007) and Ibrahim (2011), suggested that if the problem of road failure is minimized, the
heavy revenue spent in the repair as was proven in their data analyses can be channeled into some other projects
to better the economy. The economic effects of current investment trends in surface transportation
infrastructure in America, shows that in 2010 alone, deficiencies in America’s roads, bridges, and transit
systems cost American households and businesses more than $129 billion, including approximately $97 billion
in vehicle operating costs, $32 billion in delays in travel time, $1.2 billion in safety costs, and $590 million in
environmental costs. (http://www.smartgrowthamerica.org/2011/07/28/new-study-reveals-the-economic-impact-
of-americas-failing-transportation-infrastrucuture/). Andrew (2004); (Hutton and Haller 2004); Fay, Danny,
Quentin and Tito (2005); Aworemi (2009); and Calderón and Servén (2010) were all of the opinion that all the
effects of road failure boils down to man as his health, time, movement, comfort and resources are at stake.
According to the recent study of Onuoha and Onwuka (2014), the present condition of most of the roads in the
Precambrian basement complex of south western Nigeria and the sedimentary terrain of the southeast and the
entire Niger-Delta region has stimulated the interest of various stakeholders in the usage and maintenance of our
road ways. Several thousands of lives and properties worth several million dollars are lost as a result of frequent
motor accidents, caused by failed highway pavements in Nigeria A typical example of road whose failure bugs
the mind of regular users is Enugu-Onitsha Express Road. Almost every section of the road has failed, resulting
to the following:
• Loss of lives and properties, human injuries etc. through accidents.
• Retardation of the rate of economic growth and development in affected areas.
• Environmental pollution and degradation.
• Impedance of human movement and the flow of economic activities.
• Encourages armed robbery along affected areas.
Also rehabilitating these roadways has become a financial burden on the Federal, State, and Local Governments.
In the light of the foregoing therefore, it becomes a necessity to estimate the level of these effects of road failure
on the road users particularly now that the impacts are multiplying and marshal out modalities to mitigate these
problems.

Journal of Economics and Sustainable Development www.iiste.org
ISSN 2222-1700 (Paper) ISSN 2222-2855 (Online)
Vol.5, No.17, 2014
163
1.2 Aim and Objectives
This work is aimed at evaluating the Environmental, Economic, and Health effects of the road failure of Onitsha-
Enugu Expressway on the road users.
To achieve this aim, the following objectives will be pursued:
1. to sample the road users and gather their opinions on the environmental, economic and health effects of
the road failure on them,
2. to analyze the opinion of the road users on the issues at hand so as to determine whether or not the road
failure affects their environment, economy and health significantly and
3. to suggest some solutions for the mitigation of road failure and the associated effects.
1.3 Research Hypothesis
1. H0: The failure of Onitsha-Enugu Expressway does not affect the road users in significantly.
1.4 Description of the Study Area
The Onitsha-Enugu Expressway under study is situated within longitude 6o45lE to 7o30lE and latitude 6o00lN to
6o30lN. For clarity of the location, see Fig.1 (the Map of Nigeria showing the study area).
Fig. 1: Map of Nigeria Showing the Study Area. (Source: Modified web map http://www.ngex.com/nigeria/places/states/enugu.htm).
Study Area

Journal of Economics and Sustainable Development www.iiste.org
ISSN 2222-1700 (Paper) ISSN 2222-2855 (Online)
Vol.5, No.17, 2014
164
1.5 Research Methodology
The study adopted a survey design which employed the use of a well structured questionnaire to gather
information on the impacts of the road failure on the road users. This in turn was collated into data which was
analyzed using some statistical tools. The questionnaire was structured into three sections, (Sections A, B and
C). Section A was geared towards ascertaining information on personal data which provides the background
information to determine whether the respondents can offer reliable information necessary for the study. It
comprises questions on age, sex, educational attainment, nationality and occupation. Section B was hinged on
how long the respondent has been using the road and through which means. Section C is the main target of the
questionnaire survey treating issues on the impact of the road failure on health of the road users and economy of
the area.
To determine the sample size for the questionnaire distributed, the population of the road users must be
ascertained, and to this effect, a target population of users passing through the failure points was sought. To
determine the number of users passing through at least a point of failure on the road, a volumetric analysis of the
vehicles and other automobiles using the road was conducted. After a field observation, it was noticed that some
variations exists which include:
• Variation in volume of traffic at the 3 major cities cut across by the road (Enugu, Awka and Onitsha)
• Variation in the volume of traffic at different times of the day (like in the morning hours, afternoon and
evening hours) having the peak periods at mornings and evenings for Mondays to Fridays and
afternoon and evenings on Saturdays.
• Variation in volume of traffic across the week days.
• At nights especially from 10:30pm till 4.30am the traffic volume tends to zero.
In order to accommodate these variations the volumetric analysis was done in form of automobile count for 3
months in the three major cities cut across by the roadway at Omagba Geust Hall near Borromew Round about in
Onitsha, At ABS bus-stop near Aroma junction in Awka and at Ekochin Bus-stop near Ninth Mile Flyover in
Enugu. Each month lasted for 7 days running through the 7days of the week from Monday to Sunday at the
different cities selected, 7 days in each city that is 21 days in all.
Due to the difficulty in the counting of the first 2 days, and to ensure accuracy, the video camera method was
adopted. Here a video camera was mounted at a stationary point focusing the roadway and after like two hours,
based on the capacity of the camera, it will be withdrawn and the counting done in a more relaxed state at home.
This way, every automobile that passed the point of focus within the coverage time was covered not minding its
speed. Also two hours was taken in the morning, afternoon and evening respectively for the counting to
accommodate the volume variations within the different hours of the day. After the whole analysis, and
calculations the result is as below:
� Population passing through at least one point of failure for the whole 21 days = 2,268, 840 persons

Journal of Economics and Sustainable Development www.iiste.org
ISSN 2222-1700 (Paper) ISSN 2222-2855 (Online)
Vol.5, No.17, 2014
165
� Population passing through at least a failure point on the road per day = 108, 048 persons for 24 hrs.
� Population passing through at least a failure point on the roadway per hour = 4, 502
According to Nwanna (1981) If the population is a few hundreds, a 40% sample will do, if many hundreds, a
20% sample will do, if a few thousand, a 10% sample will do, for several thousands, 5% sample, if up to
hundred thousand or more, 0.5% or 0.25% can do, it can be fewer considering the circumstances surrounding the
research and the nature of the population (homogeneous or heterogeneous).
Thus considering the size of the population, a 0.25% sample was adopted. The 0.25% of the total population
passing through at least a point of failure on the roadway per day was calculated (0.25% of 108, 048) to be
270.12. Thus 270 questionnaires were distributed to people to source for information on the subject matter at
locations where the proper respondents could be found considering the fact that they cannot fill it while the
vehicle are moving. For the purpose of increasing the reliability of the respondents and authenticity of data, due
to the inability of the researcher to reach out to the road users or access them while the vehicle is moving, the
opinion pool was conducted at the Enugu-Awka motor parks at Onitsha, Enugu-Onitsha motor parks at Awka,
Awka-Onitsha motor parks at Enugu and the Nnamdi Azikiwe University motor park in Awka, the purpose
being to capture the actual road users for respondents.
• Method of Data Analysis: the data collected through the questionnaire responses were collated and
analyzed using relevant statistical tools.
• Method of Data Presentation: the collated data was presented in a tables and pie charts also the result of
the analyses were presented in tables for easy comprehension.
2.0 Results and Discussion
2.1 Presentation, Analyses and Discussion of Questionnaire Data
Before the questionnaire was adopted as an authentic and reliable tool for data generation, a reliability test was
done as follows:
Reliability Test and Item Analysis Using Likert Scale Analysis by Coding
Table 1: Case Processing Summary
N %
Cases Valid 270 100.0
Excluded 0 .0
Total 270 100.0
Source: Author’s Field Work (2012).
Table 1shows the number of respondents used for the field survey which is 270 persons/respondents. None of the
respondents was excluded in the analysis.
Table 2: Reliability Statistics Table

Journal of Economics and Sustainable Development www.iiste.org
ISSN 2222-1700 (Paper) ISSN 2222-2855 (Online)
Vol.5, No.17, 2014
166
Cronbach's
Alpha
Cronbach's Alpha
Based on
Standardized Items N of Items
.993 .993 30
Table 2 shows the reliability of the research tool which could be interpreted thus, a value less than 0.6 implies
weak tool and value more than 0.6 is an indication of strong and reliable research tool. In this research, the value
of Cronbach’s Alpha is 0.993 which implies the tool is reliable and can be used for research purpose. The last
column of table 4.4 shows the number of questions used in the field survey tool, questionnaire.
Table 3: Item Statistics
Mean Std. Deviation N Decision
Q6 2.8519 .50305 270
Q7 4.7815 1.34980 270
Q8 3.5630 1.36666 270
Q9 2.2667 .62417 270
Q10 3.2667 1.06446 270
Q11a 2.4556 1.25394 270 Agree
Q11b 2.6593 1.38050 270 Agree
Q11c 2.6000 1.32013 270 Agree
Q11d 2.2741 1.41121 270 Agree
Q11e 2.3593 1.34986 270 Agree
Q11f 2.5407 1.37294 270 Agree
Q11g 2.3000 1.27996 270 Agree
Q12a 2.2370 1.30886 270 Agree
Q12b 2.4741 1.42380 270 Agree
Q13a 2.4667 1.41579 270 Agree
Q13b 2.2741 1.26096 270 Agree
Q13c 2.4963 1.28690 270 Agree
Q14a 2.2333 1.17644 270 Agree
Q14b 3.0889 1.25231 270 Agree
Q14c 2.4852 1.42917 270 Agree
Q15a 2.2111 1.32037 270 Agree
Q15b 2.3259 1.18748 270 Agree
Q16a 1.9444 1.25275 270 Agree
Q16b 1.5963 .91456 270 Agree
Q16c 1.8259 1.26259 270 Agree
Q16d 1.9667 1.19276 270 Agree
Q17a 2.5963 1.47972 270 Agree
Q17b 3.1370 1.25832 270 Disagree
Q17c 3.7889 1.21479 270 Disagree
Q17d 3.2556 1.57509 270 Disagree
Source: Generated from Statistical Analysis of Authors Fieldwork Data.

Journal of Economics and Sustainable Development www.iiste.org
ISSN 2222-1700 (Paper) ISSN 2222-2855 (Online)
Vol.5, No.17, 2014
167
Table 3, shows the mean response of each question in the questionnaire. Based on the coding values used, the
last column shows the decision for each question to be either agree or disagree. The decision is disagree if the
mean response is less than mean of the coding value and agree if the mean response is greater than mean of
coding values.
Table 4: Summary of Item Statistics
Mean Minimum Maximum Range
Maximum /
Minimum Variance N of Items
Item Means
(Grand Mean)
2.611 1.596 4.781 3.185 2.995 .415 30
Item Variances 1.610 .253 2.481 2.228 9.804 .222 30
Source: Generated from Statistical Analysis of Authors Fieldwork Data. Table 5: Alternative Cronbach’s Alpha if Item Deleted
Scale Mean if Item Deleted
Scale Variance if Item Deleted
Corrected Item-Total Correlation
Cronbach's Alpha if Item Deleted
Q6 75.4704 1180.406 .396 .991
Q7 73.5407 1120.911 .792 .991
Q8 74.7593 1111.589 .888 .992
Q9 76.0556 1157.042 .870 .991
Q10 75.0556 1138.737 .758 .992
Q11a 75.8667 1111.462 .973 .992
Q11b 75.6630 1107.258 .927 .992
Q11c 75.7222 1107.391 .970 .992
Q11d 76.0481 1103.533 .947 .992
Q11e 75.9630 1105.456 .970 .992
Q11f 75.7815 1104.127 .968 .992
Q11g 76.0222 1111.382 .953 .992
Q12a 76.0852 1109.149 .958 .992
Q12b 75.8481 1100.813 .969 .992
Q13a 75.8556 1101.299 .969 .992
Q13b 76.0481 1111.444 .967 .992
Q13c 75.8259 1109.074 .976 .992
Q14a 76.0889 1117.397 .961 .992
Q14b 75.2333 1112.291 .964 .992
Q14c 75.8370 1100.129 .972 .992
Q15a 76.1111 1110.389 .934 .992
Q15b 75.9963 1116.361 .965 .992
Q16a 76.3778 1119.864 .870 .992
Q16b 76.7259 1142.609 .823 .991
Q16c 76.4963 1119.091 .872 .992
Q16d 76.3556 1119.048 .926 .992
Q17a 75.7259 1097.181 .969 .992
Q17b 75.1852 1119.616 .869 .992
Q17c 74.5333 1129.135 .781 .991
Q17d 75.0667 1096.226 .917 .992
Source: Generated from Statistical Analysis of Authors Fieldwork Data.

Journal of Economics and Sustainable Development www.iiste.org
ISSN 2222-1700 (Paper) ISSN 2222-2855 (Online)
Vol.5, No.17, 2014
168
Table 5 shows the value of Cronbach’s Alpha if one of the items is deleted. In the table, none of the items has
value greater than the computed Alpha value if deleted which implies all questions are significant in the research
and the research tool is reliable for the research purpose.
2.2 Presentation of Questionnaire Data.
Table 6: Occupation of The Respondents
Occupation Total Number
Civil Servants 56
Commercial Driver 52
Academicians 23
Students 101
Businessmen 26
Others 12
Source: Generated from Authors Fieldwork Data.
Figure 2: Pie Chart Showing Occupation of the Respondents in Percentages
In as much as we work very hard to design a questionnaire with questions that will help tackle the issue of the
research, there is need to also have a sound quality and good quantity of respondents who will enhance the drive
for authentic data towards accuracy. Figure 2 is a Pie Chart showing the occupation of the respondents as
percentages of the total population of the respondents as recorded in Table 6. 37% of the respondents were
students, 21% civil servants, 19% commercial drivers,110% businessmen, 9% academicians and 4% has their
occupation not included in the list of occupations presented. The implication of this is that majority of the
respondents will read the questions easily and understand it better considering that about 60% of the respondents
are students, civil servants and academicians many of which have their own vehicles. Having a reasonable
percentage of commercial drivers also adds to the reliability and authenticity of the data generated from the
questionnaire this agrees with the reliability test done earlier.

Journal of Economics and Sustainable Development www.iiste.org
ISSN 2222-1700 (Paper) ISSN 2222-2855 (Online)
Vol.5, No.17, 2014
169
Table 7: Educational Attainment of Respondents
Level of Education Number Respondents
Primary 18
Secondary 72
Tertiary 175
None 5
SOURCE : Author’s Fieldwork (2012)
Figure 3: Pie Chart Showing The Educational Attainment of The Respondents in Percentages.
The level of education of the respondents is one of the key factors in determining the rationality of answers they
will be able to give. Figure 3, is a percentage presentation of the information contained in Table 7. 65% of the
respondents passed through the university, while 27% of the respondents passed through secondary school. Only
about 6% were just primary school leavers while 2% of the respondents could not indicate there educational
status. The implication of this is that the data generated from the questionnaire survey will be highly reliable
considering the educational status of the respondents involved. That is the respondents will be able to read and
understand the questions contained in the questionnaire and provide very rational answers which will be
dependable for drawing conclusions and taking decisions on the subject matter this also agrees with the
reliability test result earlier presented.
Table 8: Age of Respondents
Age Percentage Response
18-24years 96
25-45years 84
46-64years 62
65years & Above 23
Source : Author’s Fieldwork (2012)

Journal of Economics and Sustainable Development www.iiste.org
ISSN 2222-1700 (Paper) ISSN 2222-2855 (Online)
Vol.5, No.17, 2014
170
Figure 4: Pie Chart Showing the Age of Respondents in Percentages
Table 8 contain the age distribution of the respondents within certain specified age brackets. These age brackets
of the respondents were arranged according to their percentages of the total population in Figure 4. 36% of the
respondents fell within the age bracket of 18-24years, 32% fell into the age bracket of 25-45years, 23% are
between 46-64years and only 9% were above 65years. Considering the earlier discussions about the educational
status of the respondents, it is clear that many of the respondents are young graduates with about 68% been in the
most active stage of their lives and over 80% falling into the age bracket of the Nigerian labor force (18-
64years). The respondents by their ages are ripe / matured enough to reason the causes and effects (economic,
health and environmental) of the road failure as contained in the questionnaire.
Table 9: Frequency of Road Usage by the Respondents
How Often Number Of Respondents
Daily 86
2-4 Times A Day 121
Once A Week 23
Inconsistently 10
Periodically 18
None 12
Source : Author’s Fieldwork (2012)
Journal of Economics and Sustainable Development www.iiste.org
ISSN 2222-1700 (Paper) ISSN 2222-2855 (Online)
Vol.5, No.17, 2014
171
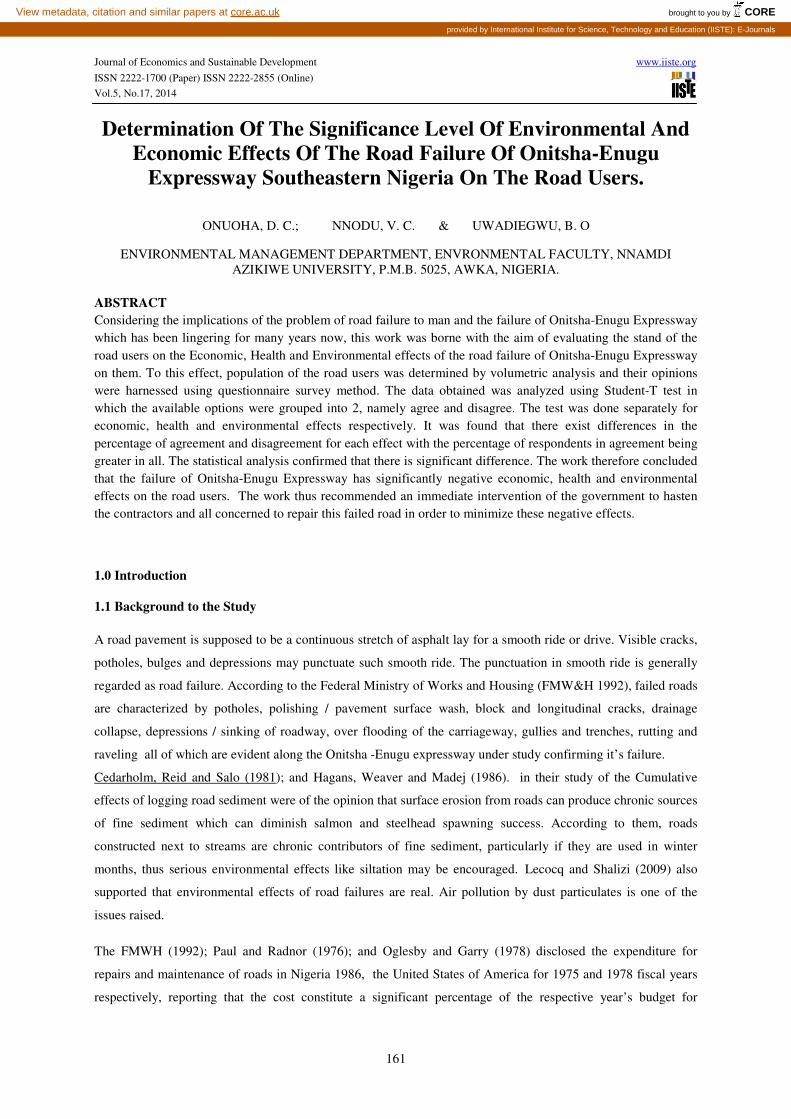
Figure 5: Pie Chart Showing Frequencies of the Road Usage by the Respondents in Percentages.
The frequencies of road usage as recorded in Table 9 and presented in percentages in Figure 5, showed that 32%
of the respondents use the road daily, 45% use the road 2-4 times a week, 8% use the road once a week, 7% use
the road periodically, 4% use the road inconsistently while 4% did not indicate their degree of usage of the road.
Seeing that over 80% use the road at least once a week, with about 50% of this fraction using it daily, it implies
that the respondents must have enough knowledge of the road, its problems and the effects of the road failure,
thus can make reasonable contributions. This is in accordance with the result of the reliability test and the
description of figures 4.2 and 4.3.
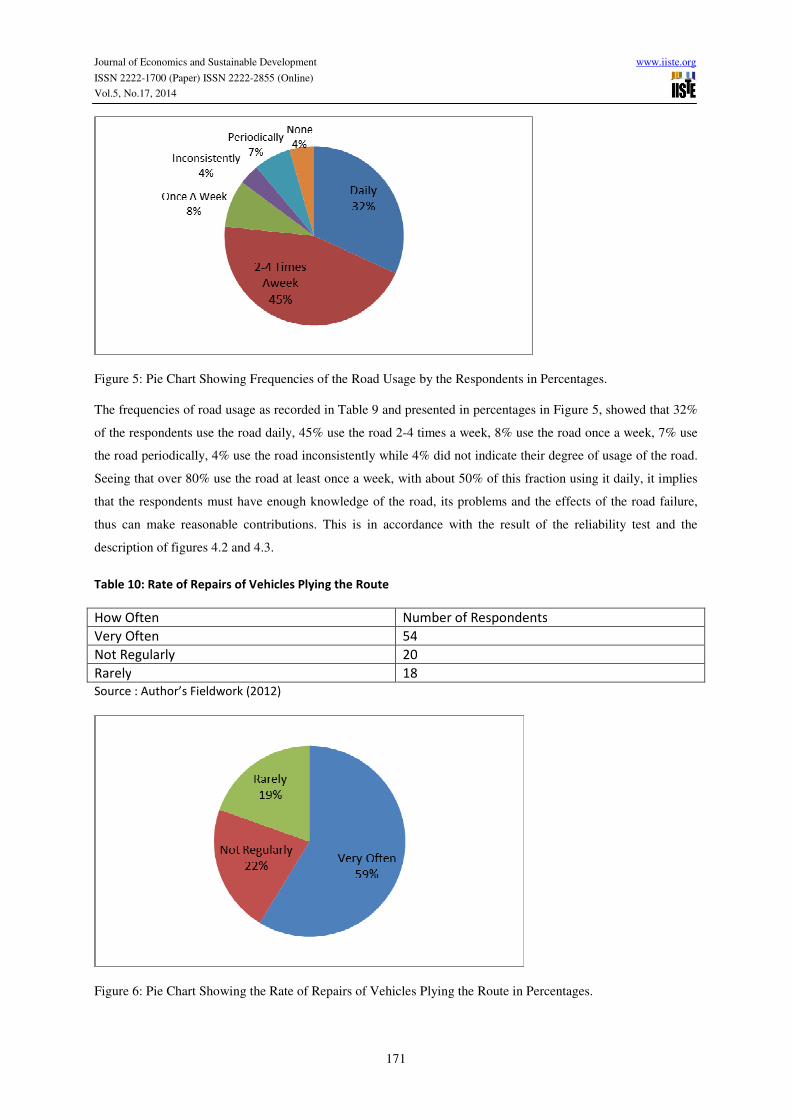
Table 10: Rate of Repairs of Vehicles Plying the Route
How Often Number of Respondents
Very Often 54
Not Regularly 20
Rarely 18
Source : Author’s Fieldwork (2012)
Figure 6: Pie Chart Showing the Rate of Repairs of Vehicles Plying the Route in Percentages.

Journal of Economics and Sustainable Development www.iiste.org
ISSN 2222-1700 (Paper) ISSN 2222-2855 (Online)
Vol.5, No.17, 2014
172
Table 10 shows the rate of vehicle repairs by vehicle owners. It should be noted that this question is optional thus
out of a total number of 270 questionnaires received only 92 respondents reacted to this question and they to be
the only vehicle owners or drivers using the road among the respondents. Figure 6 expressed the content of Table
10 In percentages from which it can be clearly seen that 59% of the drivers and vehicle owners who are
respondents said that they repair their vehicles very often, 22% repairs their vehicles not regularly while only
19% said they rarely repair their vehicles what this implies is that most vehicles plying the route undergo regular
repairs which goes to say that the bad nature of the road is negatively affecting the efficiency and serviceability
of the vehicles using the road. Even the few persons that said they rarely repair their vehicles may likely be using
the road rarely. This supports the responses given to questions 12a and 12b in the questionnaire as can be seen in
Table 11 were most of the respondents agreed that the bad state of the road negatively affects the life span and
efficiency of vehicles.
Table 11: Percentage Distribution of Number of Respondents with respect to their opinions for questions 11a to 17d
Issues Raised SD D N SA A
11a Bad nature of the soil is a factor of the road failure 18 7% 45 17% 58 21% 70 26% 79 29%
11b Poor construction materials is a factor of the road failure 14 5% 86 32% 62 23% 10 4% 98 36%
11c Stress from heavy vehicles is a factor of the road failure 21 8% 58 21% 64 24% 46 17% 81 30%
11d Old age of the road pavement is a factor of the road failure. 36 13% 28 10% 15 6% 86 32% 105 39%
11e Incompetence of the contractors is a factor of the road failure. 22 8% 53 20% 20 7% 80 30% 95 35%
11f Failure on the side of the government is a factor of the road failure.
29 11% 58 21% 18 7% 90 33% 75 28%
11g Inadequate maintenance is a factor of the road failure. 18 7% 53 20% 6 2% 108 40% 85 31%
12a The road failure affects the life span of the vehicles 22 8% 40 15% 18 7% 112 41% 78 29%
12b The road failure affects the efficiency of the vehicles 28 10% 56 21% 31 11% 56 21% 99 35%
13a The road failure affects cost of commodities negatively 40 15% 32 12% 26 10% 88 33% 84 31
13b The road failure affects the quality of perishable goods 18 7% 41 15% 30 11% 89 33% 92 34%
13c The road failure causes massive destruction of goods. 22 8% 50 19% 41 15% 76 28% 81 30%
14a The bad nature of the road aggravates certain body illness 19 7% 19 7% 54 20% 92 34% 86 32%
14b The bad nature of the road causes miscarriages 51 19% 40 15% 92 34% 56 21% 31 11%
14c The bad nature of the road retards the movement of safety vehicles
41 15% 29 11% 39 14% 72 27% 89 33%
15a The bad nature of the road increases dust particles in the air
especially during
dry seasons.
25 9% 39 15% 2 1% 106 39% 98 36%
15b The bad nature of the road contaminates the air and increase
the carbon dioxide content of the atmosphere due to burning
of more fuel.
19 7% 24 9% 62 23% 86 32% 79 29%
16a The bad nature of the road increases the rate of accidents. 25 9% 18 7% 0 0 101 37% 126 47%
16b The bad nature of the road increases the loss of lives and properties
6 2% 14 5% 2 1% 91 34% 157 58%
16c The bad nature of the road encourages robbery at bad spots 23 9% 13 5% 18 7% 56 21% 160 59%
16d The bad nature of the road reduces travel comfort for road users.
17 6% 13 5% 46 17% 62 23% 132 49%
17a The government is to be blamed for the road failure. 40 15% 49 18% 36 13% 52 19% 93 35%
17b The contractors are to be blamed for the road failure. 18 7% 129 48% 46 17% 26 9% 51 19%
17c The road users are to be blamed for the road failure. 69 26 150 55% 8 3% 11 4% 32 12%
17d Everybody is to be blamed for the road failure. 81 30% 72 27% 14 5% 41 15% 62 23%
Source: Generated from Authors Fieldwork Data.
Table 11 represents the percentage response from the respondents on the questions contained in the section C of
the questionnaire. SD stands for Strongly Disagreed, D for Disagreed, N for No Idea, SA for Strongly Agreed

Journal of Economics and Sustainable Development www.iiste.org
ISSN 2222-1700 (Paper) ISSN 2222-2855 (Online)
Vol.5, No.17, 2014
173
and A for Agreed. It should be noted that the percentage recorded for N (No Idea) is the sum of the respondents
that did not indicate any answer for the question and those that selected N and the fractional percentages were
rounded up to the nearest whole number. The different issues raised in the questionnaire were tested individually
with befitting statistical tools using the questions that pertains them to generate data. The issues of interest
includes; Economic Effects, Environmental Effects, Health Effects and Causes of the road failure.
2.3 Statistical Analyses:
2.4 2.3.1 Test of Economic Effect
In this section, questions 13a to 13c were used and appropriate statistical tool was used to test for the
significance of economic effect of road failure on the road users. The statistical tool: Student-T test in which the
available options were grouped into 2, namely agree and disagree. T-test was used as the number of questions
used was less than 30 which are 3 questions, as we are to test the responses of respondents on the available
questions not the number of respondents.
Table 12: Grouping of responses of respondents on economic questions
Question Agree Disagree
13a The road failure affects cost of commodities
negatively
172 72
13b The road failure affects the quality of perishable
goods
181 59
13c The road failure causes massive destruction of
goods.
157 72
DisagreeAgree
225
200
175
150
125
100
75
50
Nu
mb
er
of
resp
on
de
nts
Figure 7: Individual Plot of Agree and Disagree
Hypothesis
H0: there exists no significant difference in between the groups of interest
H1: there exists significant difference in between the groups of interest
Level of Significance: 5% (0.05)

Journal of Economics and Sustainable Development www.iiste.org
ISSN 2222-1700 (Paper) ISSN 2222-2855 (Online)
Vol.5, No.17, 2014
174
Decision Rule: Accept the null hypothesis if the p-value of the test is greater than 0.05, otherwise, reject.
Two-sample T for Agree vs Disagree
N Mean StDev SE Mean Agree 3 200.67 9.29 5.4 Disagree 3 69.33 9.29 5.4
Difference = mu (Agree) - mu (Disagree)
Estimate for difference: 131.33
95% CI for difference: (110.27, 152.40)
T-Test of difference = 0 (vs not =): T-Value = 17.31 P-Value = 0.000 DF = 4
Both use Pooled St Dev = 9.2916
Conclusion: the p-value of the test is less than 0.05 which implies that there exists enough evidence to reject the
null hypothesis and conclude that there exist significant difference between the group that agree that road failure
has economic effect on road users and those that do not. Literarily, this implies most of the respondents agreed
that road failure has negative economic effect on the users.
2.3.2 Test of Health effects
Table 13: Grouping of responses of respondents on health questions
Question Agree Disagree
14a The bad nature of the road aggravates certain body
illness
178 38
14b The bad nature of the road causes miscarriages 87 91
14c The bad nature of the road retards the movement of
safety vehicles
161 70
16a The bad nature of the road increases the rate of
accidents.
227 43
DisagreeAgree
250
200
150
100
50
Nu
be
r o
f re
sp
on
de
nts
Figure 8: Individual Plot of Agree and Disagree
Hypothesis
H0: there exists no significant difference in between the groups of interest
H1: there exists significant difference in between the groups of interest
Level of Significance: 5% (0.05)
Decision Rule: Accept the null hypothesis if the p-value of the test is greater than 0.05, otherwise, reject.

Journal of Economics and Sustainable Development www.iiste.org
ISSN 2222-1700 (Paper) ISSN 2222-2855 (Online)
Vol.5, No.17, 2014
175
Two-sample T for Agree vs Disagree N Mean StDev SEMean Agree 4 163.3 58.0 29 Disagree 4 60.5 24.7 12 Difference = mu (Agree) - mu (Disagree)
Estimate for difference: 102.8
95% CI for difference: (25.6, 179.9)
T-Test of difference = 0 (vs not =): T-Value = 3.26 P-Value = 0.017 DF = 6
Both use Pooled StDev = 44.5977
Conclusion: the p-value of the test is less than 0.05 (p-value = 0.017) which implies the existence of enough
evidence to reject the null hypothesis and conclude that there exist significant difference between the group that
agree that road failure has negative health effect on road users and those that do not. Literarily, this implies most
of the respondents agreed that road failure has negative health effect on the users.
2.3.3 Test of Environmental effect
Table 14: Grouping of responses of respondents on environmental questions
Question Agree Disagree
15a The bad nature of the road increases dust
particles in the air especially during dry
seasons.
204 64
15b The bad nature of the road contaminates the
air and increase the carbon dioxide content of
the atmosphere due to burning of more fuel.
165 43
16b The bad nature of the road increases the loss of
lives and properties
248 20
DisagreeAgree
250
200
150
100
50
0
Nu
mb
er
of
resp
on
de
nts
Figure 9: Individual Plot of Agree and Disagree

Journal of Economics and Sustainable Development www.iiste.org
ISSN 2222-1700 (Paper) ISSN 2222-2855 (Online)
Vol.5, No.17, 2014
176
Hypothesis
H0: there exists no significant difference in between the groups of interest
H1: there exists significant difference in between the groups of interest
Level of Significance: 5% (0.05)
Decision Rule: Accept the null hypothesis if the p-value of the test is greater than 0.05, otherwise, reject.
Two-sample T for Agree vs Disagree
N Mean StDev SE Mean Agree 3 205.7 41.5 24 Disagree 3 45.7 17.2 9.9
Difference = mu (Agree) - mu (Disagree)
Estimate for difference: 160.0
95% CI for difference: (88.0, 232.0)
T-Test of difference = 0 (vs not =): T-Value = 6.17 P-Value = 0.004 DF = 4
Both use Pooled StDev = 31.7700
Conclusion: the p-value of the test is less than 0.05 (p-value = 0.004) which implies the existence of enough
evidence to reject the null hypothesis and conclude that there exist significant difference between the group that
agree that road failure has negative environmental effects and those that do not. Literarily, this implies most of
the respondents agreed that road failure has negative environmental effects.
3.0 Conclusion and Recommendations
3.1 Conclusion
From the above result of analyses and findings, it becomes very clear that the failure of Onitsha-Enugu
Expressway has negative environmental, economic and health effects on the road users.
3.2 Recommendations
Sequel to the findings and conclusion of this research so far, it becomes very necessary to fight the problem of
road failure without any waste of time so as to mitigate its negative impacts on the road users. To this end, this
section recommends some practicable modalities to enhance the serviceability of our roads as stated below:
(A) Planning and Design Stage: The following are important before and during the planning and design of
any highway pavement:
1. Proper screening and selection of contractors before signing of contracts to avoid awarding contracts to
unqualified contractors.
2. Proper study of the area to be cut across by the pavement route ascertaining the geological,
geomorphological, hydrological, geotechnical properties of the area and making sure that they are
accommodated in the planning and designing of the pavement.
3. Design of new roads must be based on exhaustive study of anticipated number of vehicles that would
use that road on a daily basis. This is because the more the number of vehicles, the bigger the thickness of
asphalt used. Sometimes, due to poor preliminary investigation and projection, roadway designers underestimate
the anticipated number of vehicles that will use a roadway leading to poor design. When more vehicles than
anticipated start using the road after construction, pavement failure results because the asphalt thickness is not
strong enough to carry the excess vehicle load.
4. Inclusion of contractors warrantee and a follow up to that so the contractors will seat up and do quality
jobs to avoid paying extra for repairs after construction.

Journal of Economics and Sustainable Development www.iiste.org
ISSN 2222-1700 (Paper) ISSN 2222-2855 (Online)
Vol.5, No.17, 2014
177
(B) Construction Stage:
1. Efficiency in construction practices like Soil Compaction, Consolidation, Cross Hauling, Soil
Modification and Stabilization should be ensured where and when necessary to reduce soil mobility,
settlement and shrinkage factors.
2. Ensuring total execution of plan and design. Plans which have overstayed without being executed,
should be reviewed before implementation (construction proper) to accommodate present problems of
the area in question.
3. Use of good quality construction materials, adequate manpower, equipment supply and expertise and
the inclusion of adequate drainage facilities to ensure pavement stability especially in areas with
troublesome geology.
(C) Post Construction Evaluation and Monitoring:
1. Quality Determination: The application of field investigation methods like the use of Trial Hole, Use of
Deflectograph Result, Laboratory testing of materials, field observation and many other ways of ascertaining the
status of the failed pavement may go a long way to aid the planning of maintenance measures and condemn
shoddy jobs on time.
2. Effective Maintenance Programme: There should be routine or preventive maintenance, periodic
maintenance, and disaster maintenance or major repairs of our roads. In view of the efforts of the Federal Road
Maintenance Agency (FERMA) to rehabilitate failed segments of the highways across the country, it is
imperative that adequate consideration is given to the causes of the failures so as to ensure that sufficient
safeguards are incorporated in their subsequent rehabilitation.
3. Establishment of an Active Maintenance Crew. We should establish road maintenance crews trained to
recognize, evaluate and patch cracks once they appear. They should be patrolling major roads about two times a
week and potholes or cracks detected during such patrols should promptly be patched. This arrangement may
sound expensive, until one considers what is been spent annually to reconstruct roads after they have been
allowed to deteriorate badly and the negative effects of such situations.
(D) Role of the Governmental:
1. Pronouncement of severe punishment for dishonest inspectors and contractors caught in bribery and
other corrupt acts for others to learn their lesson.
2. Awards by Government to outstanding contractors who distinguished themselves by quality Jobs.
3. We need to establish a construction ethics committee staffed by men and women of integrity who
would have the authority to hear complaints against contractors and against government workers also.
4. Government to establish an anti-corruption team made up of men and women of integrity who will not
request the contractors to "grease their palms" in order to become lenient in enforcing specification.
5. Establishment of contractors accountability program where genuine complaints are lodged against
contractors for non-performance, poor performance, dereliction or repudiation, it is recorded against the
said contractors. For continuous record of such offences, the contractor is barred from bidding future
contracts for a period of time thus weeding out non performers and creating a contractor pool of proven
performers.
6. Establishment of a well-equipped library and a design office by the Federal Highways Department is
recommended.
7. Establishment of Highways data bank of unit rates for works in road projects, based on the rates of
competent contractors could greatly assist Government in its assessment and final choice.

Journal of Economics and Sustainable Development www.iiste.org
ISSN 2222-1700 (Paper) ISSN 2222-2855 (Online)
Vol.5, No.17, 2014
178
8. Government should make the payment of there contractors very effective supervising the process to
avoid fund diversions and late payments resulting in the delay of the work as in the case of the Onitsha-
Enugu Expressway.
Putting all these into practice the problem of road failure and the associated negative effects will be minimized.
REFERENCES
Aigbedion, I. (2007): “Geophysical Investigation of Road Failure Using Electromagnetic Profiles along Opoji,
Uwenlenbo and Illeh in Ekpoma –Nigeria”. Middle-East Journal of Scientific Research 2 (3-4): pp.111-115.
Ajayi, G.A. (1995): “Cost-Benefit Analysis of Captive Power Generation by Manufacturing Industries in
Nigeria”. Unpublished PhD thesis, Department of Economics, University of Ibadan, Ibadan.
Andrew, D. (2004). “The World’s Worst Traffic Jams” Time magazine. Retrieved on 10/06/2009.
Aworemi, J. R. (2009): “A Study of the Causes, Effects and Ameliorative Measures of Road Traffic Congestion
in Lagos Metropolis”. European Journal of Social Sciences – Volume 11, Number 1, p.119.
Calderon, C. and Servén, L. (2010): “Infrastructure in Latin America”. Handbook of Latin American Economies.
(http://www.krisweb.com/watershd/roads.htm).
Cedarholm, C.J. Reid, L. M. and Salo, E. O. (1981): “Cumulative effects of logging road sediment on salmonid
populations of the Clearwater River, Jefferson County, Washington”. in Proceedings of Conference on Salmon
Spawning Gravel: A Renewable Resource in the Pacific Northwest? Wash. State University, Water Research
Center, Pullman, WA. Report 19. pp 38-74
Fay, M. Danny, L. Quentin, W. and Tito, Y. (2005): “Achieving Child-Health-Related Millennium Development
Goals: The Role of Infrastructure”. World Development Vol.33, No.8, pp1267-84.
Federal Ministry of Works and Housing (FMWH), (1992): Highway Road Maintenance Manual, part II
Fernald, J. (1999): “Roads to Prosperity? Assessing the Link between Public Capital and Productivity.”
American Economic Review 89 (3): 619–38.
Hagans, D.K. Weaver, W.E. and Madej, M.A. (1986):” Long term on-site and off-site effects of logging and
erosion in the Redwood Creek basin, Northern California”. In: Papers presented at the American Geophysical
Union meeting on cumulative effects (1985 December); National Council on Air and Streams, Tech.Bull. No.
490, pp.38-66.
http://www.ngex.com/nigeria/places/states/enugu.htm
http://www.smartgrowthamerica.org/2011/07/28/new-study-reveals-the-economic-impact-of-americas-failing-
transportation-infrastrucuture/
Hurlin, C. (2006): “Network Effects of the Productivity of Infrastructure in Developing Countries.” World Bank
Policy Research Working Paper 3808. The World Bank, Washington, DC.
Hutton, G. and Haller, L. (2004): “Evaluation of the Costs and Benefits of Water and Sanitation Improvements at
the Global Level.” WHO, Geneva.
Ibrahim, K. (2011): “Nigerian Roads Need N70 Billion for Repairs Annually”. Daily Times. Article,| May 30,
2011 - 10:23am . http://dailytimes.com.ng/article/nigerian-roads-need-n70-billion-repairs-annually.
Kessides, C. (1993): ”The Contributions of Infrastructure to Economic Development: A Review of Experience
and Policy Implications”. World Bank Discussion Papers No. 213. The World Bank.
Lecocq, F. and Shalizi, Z. (2009): “Climate Change and the Economics of Targeted Mitigation in Sectors with
Long-Lived Capital Stock.” World Bank Policy Research Working Paper 5063. The World Bank, Washington,
DC.
Nwanna, O. C. (1981): Introduction to Educational Research. Ibadan, Heinemann Educational Books (Nig) Ltd.
Oglesby, C. H. and Garry, H. R. (1978):. Highway Engineering, fourth edition, John Willey and sons, New
York, p. 691.
Onuoha, D. C. and Onwuka, S. U. (2014): “The Place of Soil Geotechnical Characteristics in Road Failure, a
Study of the Onitsha-Enugu Expressway, Southeastern Nigeria” Journal of Civil and Environmental Research.
IISTE, USA. Vol. 6, No. 1, pp 55-67.
Paul, H. N. and Radnor, J. P. (1976): Highway Engineering, John Willey and Sons, New York.
Roller, L. and Waverman, L. (2001): “Telecommunications Infrastructure and Economic Development: A
Simultaneous Approach.” American Economic Review 91 (4): pp.09–23.
Romp, W. and De Haan, J. (2005): “Public Capital and Economic Growth: A Critical Survey.” EIB Papers
2/2005. European Investment Bank, Luxemburg.