Embed Size (px)
Citation preview
3517Sensors and Materials, Vol. 31, No. 11 (2019) 3517–3526MYU Tokyo
S & M 2027
*Corresponding author: e-mail: [email protected]://doi.org/10.18494/SAM.2019.2500
ISSN 0914-4935 © MYU K.K.https://myukk.org/
Determination of the Refractive Index of MolybdenumUsing a Spectrophotometric Method
Donyau Chiang,1 Po-Kai Chiu,1* Yu-Chen Hsieh,1
Wen-Tse Hsiao,1 and Shih-Feng Tseng2
1Taiwan Instrument Research Institute, National Applied Research Laboratories,No. 20, R&D Rd., VI, Hsinchu Science Park, Hsinchu 30076, Taiwan, R.O.C.
2Department of Mechanical Engineering, National Taipei University of Technology,No. 1, Sec. 3, Zhong-Xiao (Chung-Hsiao) E. Rd., Da’an Dist., Taipei City 106, Taiwan, R.O.C.
(Received April 15, 2019; accepted September 4, 2019)
Keywords: refractiveindex,extinctioncoefficient,spectrophotometry,molybdenum,simulation
The refractive indexes of thin films are determined by spectrophotometric measurement in the ultraviolet-to-near-infrared spectral range on a high-absorption metal, molybdenum, as an example. In our theoretical derivative, the refractive indexes of a substrate with and without low absorption are calculated first and then that of the combined film stack is calculated. Both solutions are obtained by the Newton–Raphson iteration method. The calculated refraction index is 1.64–2.88 and the extinction coefficient is 2.76–4.52, which are within the measured ranges for the Mo film. Both indexes increase monotonically with the wavelength in the visible and near-infrared ranges.
1. Introduction
A spectrophotometer is a popular instrument in the laboratory for measuring the transmittance (T) and reflectance (R) of films or film stacks deposited on substrates. Therefore, a spectrophotometer can be considered as a sensor for detecting changes in the R and T of film materials owing to the microstructural or compositional changes. The refractive index can reflect the material microstructure, and three common methods are frequently applied to obtain it. However, unlike ellipsometry,(1,2) which measures parameters to determine the refractive index at a single wavelength, and the enveloped method,(3,4) which measures the variation in T oscillation with the wavelength of a thick low-absorption dielectric film deposited on a transparent substrate to determine optical properties, a spectrophotometer evaluates the R and T of films with moderate absorption covering wide wavelength ranges. Despite improving the ellipsometry method to accurately examine metal thin films, the price of the instrument for this method is almost twice that of a spectrophotometer. It has been proposed that refractive indexes, also called optical constants, of films deposited on a transparent substrate be calculated by measuring total R and T.(5–8) The refractive index of a material film comprises two parts, namely, the real part, which is the refractive index, and the imaginary part, which is the extinction coefficient.
3518 Sensors and Materials, Vol. 31, No. 11 (2019)
Molybdenum is an important metallic element used in a variety of applications owing to its high thermal and electrical conductivities, low thermal expansion coefficient, resistance to attack by molten metals, high stability and strength at high temperatures, and compatibility with most glass compositions.(9) Mo-based sensors, which consist of compounds such as Mo disulfide or Mo selenide, are reported to be used as gas detectors to detect triethylamine(10) and NH3
(11) concentrations, and as gauges(12) and humidity,(13) and temperature(14) sensors. These sensors were produced by first depositing a very thin metal Mo layer with a thickness of 10 nm order on a dielectric substrate, then reacting the Mo layer with gaseous sulfur or selenium, and finally depositing electrical contact pads to form a sensor device. It is necessary to use a noncontact method to examine the quality and thickness of the deposited thin Mo film. The sulfurization of Mo is applied to produce MoS2 films. The measurement of the refraction index can be applied to estimating variations in sulfurization degree and film quality. The variation in T with the wavelength was previously reported to demonstrate the optical properties of deposited films.(15,16) However, T is not an intrinsic property of materials and depends significantly on the film thickness and measured wavelength. A true material characteristic of a film is the refractive index (optical constant), which is uniquely related to the chemical composition and microstructure. We developed a numerical approach to obtain the refractive indexes of a substrate and a film deposited on a substrate with low absorption using the measured R and T in certain wavelength ranges. The film thickness can be estimated within the error of 5% of its true thickness. R and T are measured using a widely available and affordable spectrophotometer. 2. Theoretical Derivation
An incoherent incident beam is irradiated normally onto a rectangular block substrate with two uniform, double-side-polished, smooth, and parallel planes, and the intensities of the incident, reflected, and transmitted beams are recorded, as shown in Fig. 1. We adopt the nomenclature in Ref. 17. The Fresnel reflection and transmission coefficients rij and tij are defined as
� �
� ��
� �2, 1i j i
ij ij ij ij ij iji j i j
n n nr g ih t g ihn n n n
−= = + = = + +
+ +, (1)
where � in and �jn are the refractive indexes of the two neighboring substances across the boundary in their complex form. The refractive index of medium i is expressed as follows in complex form, in which ni is the real part of the refractive index and ki is the extinction coefficient:
�i i in n ik= − . (2)
The theoretical calculations of the R and T of a moderately transparent substance under

Sensors and Materials, Vol. 31, No. 11 (2019) 3519
normal incidence are formulated below. Here, we do not consider the diffraction condition, which is a constructive intensity when in phase or a destructive intensity when out of phase, because an incoherent light source is applied. No R or T oscillation as a function of wavelength will be observed because a substrate with a thickness larger than the measured wavelength is used and an incoherent light source is applied.
1RRD
= , 1
0
2, s sk dTTD
πα
λ= = (3)
( ) ( )( )2 2 4 2 21 01 01 01 011 1 2R g h e g hα− = + + − +
(4)
( )22 2 2 21 01 01 01 01(1 ) 1T g h g h e α− = − + + +
(5)
4 2 2 201 011 ( )D e g hα−= − + (6)
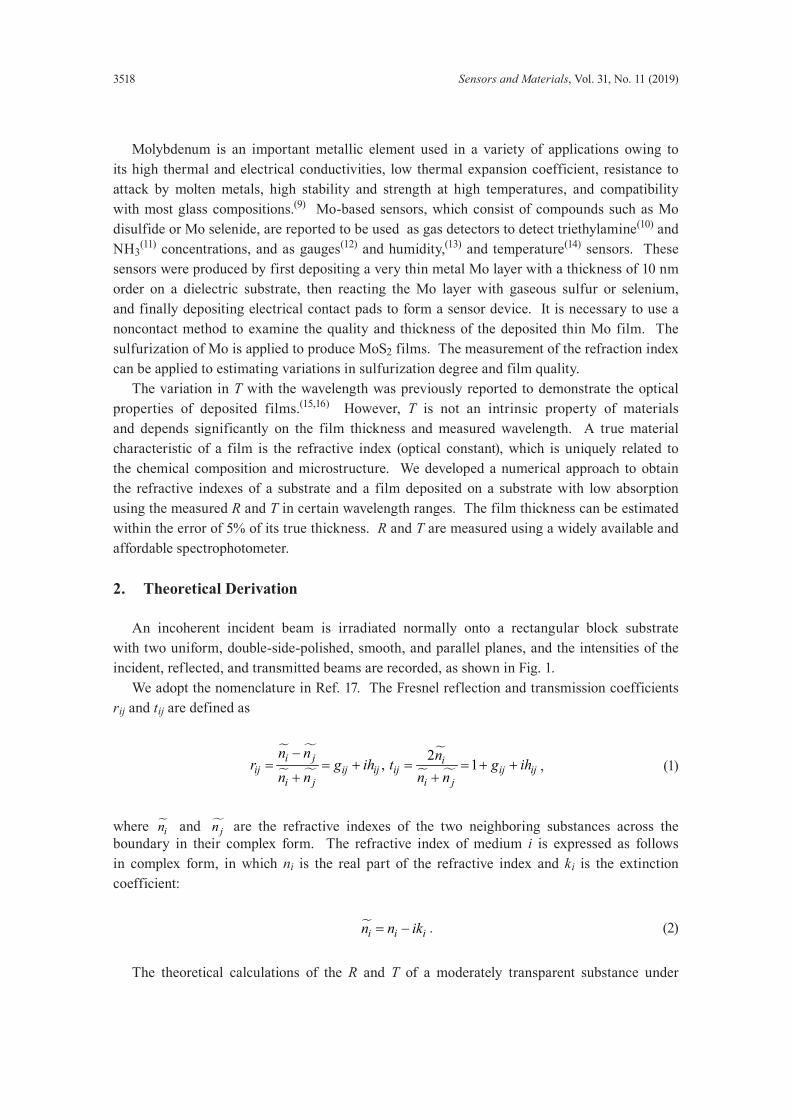
Here, ks is the extinction coefficient of the substrate, ds is the thickness of the substrate, and λ0 is the measured wavelength. The subscripts 0 and 1 attached to the g and h represent media 0 and 1, respectively. When a uniform and homogeneous film is deposited on a transparent substrate, on the basis of the requirements for the developed theory, a schematic diagram of the measurement configuration is shown in Fig. 2 and the equations for the R and T of the film stack irradiated with a normal incident beam are derived below. The minimum T of the film stack must be at least 3% to obtain reliable simulation results. This restriction limits the thickness of films with high absorption that can be characterized. Because the average values of the measured R and T from either the film or the film stack are obtained with a finite monitoring spot size of ca. 10 mm, the developed method can neither distinguish the optical property of each film from that of the film stack nor detect the local chemical composition or thickness difference
Fig.1. (Color online) Geometric configuration of the transparent substrate irradiated with a normal incidentbeam.
3520 Sensors and Materials, Vol. 31, No. 11 (2019)
in the film. The measured R and T from the film stack are effective or equivalent values and the simulated optical constants obtained from the film stack are effective optical constants. If the optical constant and properties of a single film are desired, a single uniform film must be deposited on a substrate and the simulation must be performed again. The thickness of the film in Fig. 2 is exaggerated to clearly show the film.
4 22 2 2 2 2 2
1 0 0 3 0 0 31 s si is s s s s sR r r r e t t r eδ δ− − = +
−
(7)
22 2
1 3 0si
s sT t t e δ−= (8)
22 20 31 si
s sD r r e δ−= − (9)
( ) ( ) ( ) ( )
( )( ) ( ) ( )
2 22 2 2 20 02
0 2 22 2 2 20 0
cos 2 sin 2
cos 2 sin 2
f f
f f
f f fs fs f fs
f f fs fs f f
g h e g h e A Br
e g h g h e C D
α α
α α
γ γ
γ γ
−
−
+ + + + +=
+ + + + + (10)
( ) ( ) ( ) ( )
( )( ) ( ) ( )
2 22 2 2 20 02
0 2 22 2 2 20 0
sin 2 sin 2
cos 2 sin 2
f f
f f
fs fs f f f fs
f f fs fs f f
g h e g h e A Br
e g h g h e C D
α α
α α
γ γ
γ γ
−
−
+ + + + −=
+ + + + + (11)
( (
( )( ) ( ) ( )
2 2 2 20 02
0 2 22 2 2 20 0
1 ) 1 )
cos 2 sin 2f f
f f fs fss
f f fs fs f f
g h g ht
e g h g h e C Dα α γ γ−
+ + + + =+ + + + +
(12)
Fig. 2. (Color online) Schematic diagram showing how to evaluate R and T forafilmstack,inwhichafilmwithrefractive index nf and thickness df deposited on a transparent substrate is irradiated with a normal incident beam.

Sensors and Materials, Vol. 31, No. 11 (2019) 3521
( (
( )( ) ( ) ( )
2 2 2 20 02
0 2 22 2 2 20 0
1 ) 1 )
cos 2 sin 2f f
f f fs fss
f f fs fs f f
g h g ht
e g h g h e C Dα α γ γ−
− + − + =+ + + + +
(13)
Here, A = 2(g0fgfs + h0fhfs), B = 2(g0fhfs −gfsh0f), C = 2(g0fgfs −h0fhfs), D = 2(g0fhfs + gfsh0f),
( )2 ss s s
d n ikπδ
λ= − ,
2 f f
fn dπ
γλ
= and the subscripts 0, f, s, and 3 denote medium 0 (air), the
deposited film, the supported substrate, and medium 3, respectively. The two-dimensional Newton–Raphson method is used to solve the R and T of the film stack simultaneously. For two functions with two unknowns, R = R(nf, kf) and T = T(nf, kf), the method provides the following iteration formulas for nf and kf:
1i i
R TT Rk kn n R T R T
n k k n
+
∂ ∂× − ×∂ ∂= +
∂ ∂ ∂ ∂× − ×
∂ ∂ ∂ ∂
, (14)
1n n
T RR Tn nk k R T R T
n k k n
+
∂ ∂× − ×∂ ∂= +
∂ ∂ ∂ ∂× − ×
∂ ∂ ∂ ∂
. (15)
Several iterations with the initial seed values, which are selected on the basis of experience and experimental conditions, are executed and the solutions are obtained.
3. Experiments
We performed the experiments to measure R and T from both the glass substrate and the deposited film on the glass substrate in order to calculate their respective optical constants. Glass pieces, B270, with the dimensions of 25.4 × 25.4 × 1 mm3 were used as substrates. The surfaces of the substrates were cleaned by washing in detergent, rinsing in flowing water, and drying with a nitrogen blower. A molybdenum film with a thickness of around 35 nm was deposited on each glass substrate by DC sputtering. A spectrophotometer (Perkin Elmer Lambda 900) was used to monitor R and T in the wavelength range from 300 to 1200 nm. The instrument was warmed up 30 min before measurement.
4. Results and Discussion
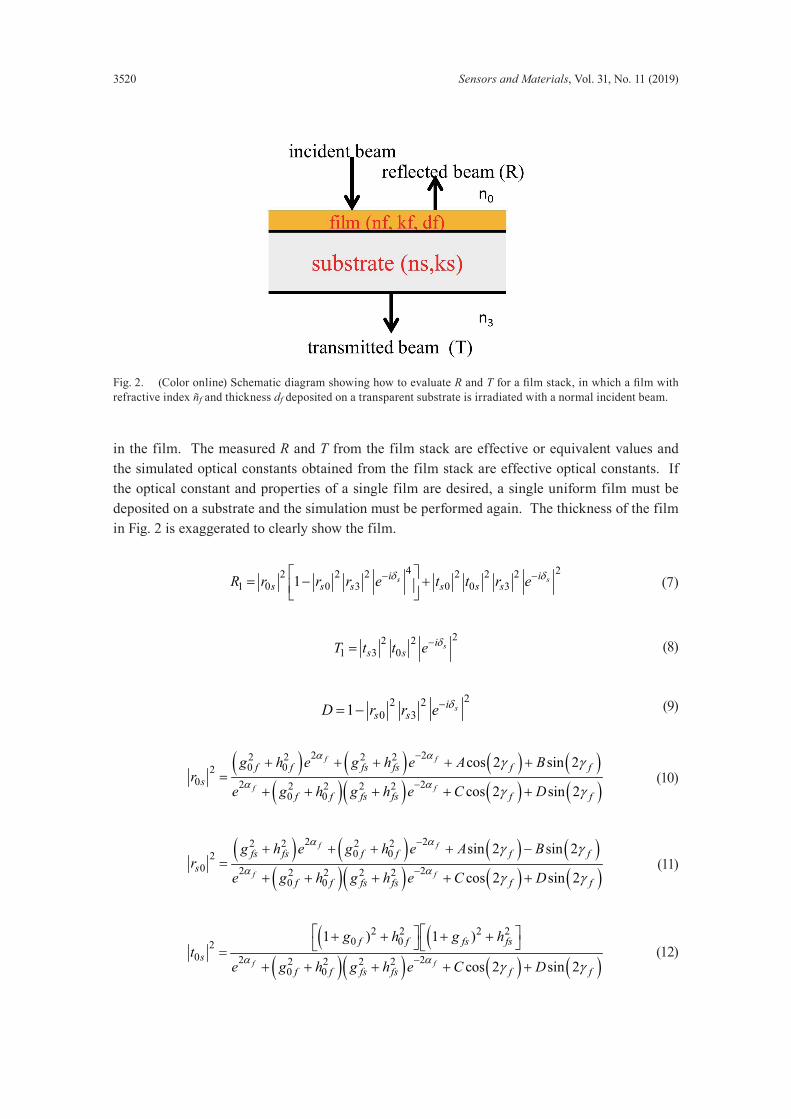
4.1 R and T measurements of glass substrate as functions of wavelength
Figure 3 shows the measured R in blue circles and the measured T in black open squares as functions of wavelength. T increases abruptly from 43.57 to more than 90% in the wavelength
3522 Sensors and Materials, Vol. 31, No. 11 (2019)
range from 300 to 400 nm and then slowly increases from 90 to 92% in the wavelength range from 400 to 1200 nm. R increases from around 6 to 9.5% in the wavelength range from 300 to 350 nm, and then subsequently decreases to 7.7% at a wavelength of 1200 nm.
4.2 Calculated refractive indexes of glass substrate
The optical constants of the B270 glass substrate were calculated by the Newton–Raphson method using the measured R and T shown in Fig. 3. As shown in Fig. 4(a), the refractive index decreases gradually and monotonically from 1.59 to 1.50 within the wavelength range from 300 to 1200 nm. This decrease in refractive index with increasing wavelength is consistent with a previous report(18) and the values are in good agreement with the reported values in the visible region. The variation in the extinction coefficient with wavelength is exhibited in Fig. 4(b). B270 glass shows significant absorption at wavelengths less than 330 nm. At wavelengths longer than 330 nm, the extinction coefficient of the glass substrate is negligible.
4.3 R and T measurements of Mo film as functions of wavelength
Figure 5 exhibits the measured R and T of the Mo film deposited on the B270 glass substrate as functions of wavelength. R decreases from 56.3 to 55.1% with increasing wavelength from 300 to 350 nm, then to 57.8% at 515 nm and to 50.9% at 950 nm. It then increases again to 55.4% at 1200 nm. T increases steeply from 0 to 4% in the wavelength range from 300 to 375 nm, then gradually to 10.5% at 985 nm, and then decreases slowly to 9.5% at 1200 nm.
4.4 Calculated refractive index of Mo film
The calculated refractive index, denoted as open black squares, and the extinction coefficient, denoted as open blue squares, of the Mo film as functions of wavelength are illustrated in Fig. 6. The refractive index decreases from 2.88 to 1.64 when the wavelength increases from 300 to 370 nm, then increases gradually to 2.73 at 1000 nm, and decreases slightly to 2.67 at 1200 nm.
Fig. 3. (Color online) Measured R and T of glass substrate in the wavelength range from 300 to 1200 nm.

Sensors and Materials, Vol. 31, No. 11 (2019) 3523
The extinction coefficient decreases slightly from 3.31 to 2.77 in the wavelength range from 300 to 365 nm and then increases monotonically to 4.52 at 1200 nm. The simulated thickness of the Mo film is obtained by matching the calculated value and the experimental data and is estimated to be 33 nm, which is close to the experimental layer thickness of 35 nm. Previously reported refractive indices are exhibited in blue in Fig. 6 for comparison.(19,20) The black symbols represent the refractive index and the blue symbols represent the extinction coefficient. Werner and Glantschnig(19) showed that in the visible range, the refractive index was less than 1, but the extinction coefficient was large with a steep slope as a function of wavelength, but a different behavior was observed by Ordal et al.(20) and Kirillova et al.(21) The data obtained in these two studies were in reasonable agreement. The discrepancy between our results and those of other researchers was significant and might be due to the different methods of preparing the Mo sample and detailed microstructural differences. Our extinction coefficient was close to that obtained by Ordal et al., but our refractive index was smaller than theirs. It is considered that the thin surface oxide layers on the Mo film in our sample may be the main cause of the difference in the refractive index.
Fig.4. (Coloronline)Variations in (a) refractive indexand (b)extinctioncoefficientof theglasssubstratewithapplied wavelength.
(a) (b)
Fig. 5. (Color online) Measured R and TofMofilmon glass substrate as function of wavelength.
Fig. 6. (Color online) Var iat ion of ref ract ive index and extinction coefficient of Mo film with wavelength.
3524 Sensors and Materials, Vol. 31, No. 11 (2019)
5. Conclusions
We derived two mathematical relationships for the refractive index in terms of R and T for a substrate and a deposited film on the substrate. The Newton–Raphson method was applied to simultaneously solve the two unknown parameters, i.e., the refraction index and extinction coefficient, using the estimated film optical thickness. The method we developed is potentially a powerful tool for examining the quality and thickness of metal films, which are important components of sensor devices. The practical execution was manipulated in detail using a B270 glass substrate and a metal Mo layer deposited on a glass substrate as examples. The refractive index of B270 increases gradually from 1.50 to 1.60 as the wavelength decreases from 1200 to 300 nm. The extinction coefficient of B270 is negligible when the wavelength is larger than 330 nm and increases markedly when the wavelength decreases to less than 330 nm. The data are in good agreement with manufacturer's data in the visible range. The calculated refractive index of Mo is slightly lower than a previously reported value in the visible range but higher than that in the near-infrared range. However, the extinction coefficient is in reasonably good agreement with the previously reported value. The discrepancy in the refractive index of the Mo film resulted from the thin oxide layer generated on the Mo surface.
Acknowledgments
This research was supported by the Taiwan Ministry of Science and Technology under contract nos. MOST 107-2622-E-492-011-CC3, MOST 106-2622-E-492-019-CC3, and MOST 108-2622-E-492-005-CC3.
References
1 F. L. McCrackin, E. Passaglia, R. R. Stromberg, and H. L. Steinberg: J. Res. Natl. Bur. Stand.-A Phys. Chem. 67A (1963) 363.
2 T. N. Hunter, G. J. Jameson, and E. J. Wanless: Aust. J. Chem. 60 (2007) 651. https://doi.org/10.1071/CH07133 3 S. Gürakar, T. Serin, and N. Serin: Appl. Surf. Sci. 352 (2015) 16. https://doi.org/10.1016/j.apsusc.2015.03.057 4 C. Gümüs, O. M. Ozkendir, H. Kavak, and Y. Ufuktepe: J. Optoelectron. Adv. Mater. 8 (2006) 299. 5 D. V. Tsu: J. Vac. Sci. Technol. A 17 (1999) 1854. https://doi.org/ 10.1116/1.581904 6 C. L. Nagendra and G. K. M. Thutupalli: Vacuum 31 (1981) 141. https://doi.org/10.1016/0042-207X(81)90004-X 7 D. Chiang, D. P. Tsai, C. H. Chu, and H. P. Chiang: Proc. SPIE 7505 (2009) 750518. https://doi.
org/10.1117/12.839471 8 R. Swanepoel: J. Phys. E: Sci. Instrum. 16 (1983) 1214. https://doi.org/ 10.1088/0022-3735/16/12/023 9 J. A. Shields: Applications of Molybdenum Metal and Its Alloys (International Molybdenum Association,
London, 2013) 2nd ed. 10 F. K. Perkins, A. L. Friedman, E. Cobas, P. M. Campbell, G. G. Jernigan, and B. T. Jonker: Nano Lett. 13 (2013)
668. https://doi.org/10.1021/nl3043079 11 K. Lee, R. Gatensby, N. McEvoy, T. Hallam, and G. S. Duesberg: Adv. Mater. 25 (2013) 6699. https://doi.
org/10.1002/adma.201303230 12 M. Zhu, J. Li, N. Inomata, M. Toda, and T. Ono: Appl. Phys. Express 12 (2019) 015003. https://doi.
org/10.7567/1882-0786/aaf5c4 13 T. Ouyang, L. Lin, K. Xia, M. Jiang, Y. Lang, H. Guan, J. Yu, D. Li, G. Chen, W. Zhu, Y. Zhong, J. Tang, J. Dong, H.
Lu, Y. Luo, J. Zhang, and Z. Chen: Opt. Express 25 (2017) 9823. https://doi.org/10.1364/OE.25.009823 14 S. Sridhar, S. Sebastian, and S. Asokan: Appl. Opt. 58 (2019) 535. https://doi.org/10.1364/AO.58.000535 15 W.-T. Hsiao, S.-F. Tseng, C.-K. Chung, D. Chiang, K.-C. Huang, K.-M. Lin, L.-Y. Li, and M.-F. Chen: Opt.
Laser Technol. 68 (2015) 41. https://doi.org/10.1016/j.optlastec.2014.11.009
Sensors and Materials, Vol. 31, No. 11 (2019) 3525
16 C.-K. Chung, S.-F. Tseng, W.-T. Hsiao, D. Chiang, and W.-C. Lin: J. Laser Micro/Nanoeng. 11 (2016) 395. https://doi.org/10.2961/jlmn.2016.03.0020
17 O. S. Heavens: Optical Properties of Thin Solid Films (Dover Publications, New York, 1965) 1st ed., Chap. 4. 18 RefractiveIndex.INFO: https://refractiveindex.info/?shelf=glass&book=SCHOTT-multipurpose&page=B270
(accessed July 2019). 19 W. S. M. Wer ner and K. Glantschnig: J. Phys. Chem. Ref. Data 38 (2009) 1013. ht tps://doi.
org/10.1063/1.3243762 20 M. A. Ordal, R. J. Bell, R. W. Alexander, L. A. Newquist, and M. R. Querry: Appl. Opt. 27 (1988) 1203.
https://doi.org/10.1364/AO.27.001203 21 M. M. Kirillova, L. V. Nomerovannaya, and M. M. Noskov: Sov. Phy. JETP 33 (1971) 1210.
About the Authors
Donyau Chiang received his B.S. degree from National Cheng-Kung University, Taiwan, in 1981 and his M.S. and Ph.D. degrees from the University of Rochester, New York, US in 1988 and 1993, respectively. From 1993 to 2009, he served in Industrial Technology Research Institute and CMC Magnetics Co., Taiwan, as the section director and research VP, respectively. In 2009, he joined Taiwan Instrument Research Institute (TIRI) of National Applied Research Laboratories (NARL) as a research fellow. His research interests are in optical recording, laser machining, and thin-film applications. ([email protected])
Po-Kai Chiu received his Ph.D. degree in materials science from National Taiwan University. He is now a research fellow of Taiwan Instrument Research Institute (TIRI) of National Applied Research Laboratories (NARL). His major research interests are in optical thin films, advanced thin-filmtechnology, and atomic-scale microstructures. ([email protected])
Yu-Chen Hsieh received his M.S. degree in energy engineering from National Central University in 2017. He joined Taiwan Instrument Research Institute (TIRI) of National Applied Research Laboratories (NARL) in 2018, where he is now a research assistant. His research interests include perovskite solar cells, laser micro/nanomachining, laser–matter interactions, and man–machine interface design. ([email protected])
Wen-Tse Hsiao received his Ph.D. degree in mechatronics engineering from National Changhua University of Education in 2009. He joined Taiwan Instrument Research Institute (TIRI) of National Applied Research Laboratories (NARL) in 2009, where he is now a research fellow. His research interests include laser machining system design, laser micro/nanomachining, laser–matter interactions, laser interferometer measurement, precision motion control, and IoT sensor devices and applications.

3526 Sensors and Materials, Vol. 31, No. 11 (2019)
Shih-Feng Tseng received his Ph.D. degree in mechanical engineering from National Chiao Tung University, Taiwan, in 2011. He is currently an assistant professor at the Department of Mechanical Engineering, National Taipei University of Technology, Taiwan. His research interests are smart sensors, laser processing, and optomechatronic system integration. ([email protected])


![REFRACTIVE INDICES DETERMINATION OF A NEW … · extraordinary refractive index, ... [1-3], the hollow prism technique [4,5] ... Refractive indices determination of a new nematic](https://img.dokumen.tips/doc/110x75/5ac1302a7f8b9a433f8c8ea2/refractive-indices-determination-of-a-new-refractive-index-1-3-the-hollow.jpg)


![List of COURSES [Full-time B.E. (ECE)] · 8. Determination of refractive index of the given prism using minimum deviation method. 9. Determination of emissivity of the surface of](https://img.dokumen.tips/doc/110x75/5e31e6120ac42067863e40c4/list-of-courses-full-time-be-ece-8-determination-of-refractive-index-of-the.jpg)


![Coulometric determination of chromium, molybdenum, and ... In practice [1], the gravimetric determination of Mo0 4 ... fine powder of a certain ferroalloy is mixed in a nickel crucible](https://img.dokumen.tips/doc/110x75/5ae9a4777f8b9aee0791163b/coulometric-determination-of-chromium-molybdenum-and-practice-1-the-gravimetric.jpg)


