Embed Size (px)
Citation preview

136
A relation between the density and refractive index of silicate glasses, with application to the determination
of imitation gem-stones.
By F. A. BANNISTER, M.A.
Assistant-Keeper in the Mineral Department of the British Museum of Natural History.
[Read March 19, 1929.]
T has long been possible to identify readily many minerals by means of density and refractive index determinations, and the
chemical composition also can often be approximately deduced. Tilley 1 has shown that it is practicable to determine any natural glass by this method and be succeeded in separating the natural glasses into groups characterized by certain limits of specific refrac- tivity. As far as the author is aware, no such systematic method has been described for distinguishing the artificial glasses one from the other, and it is these glasses that we are concerned with in attempting to determine the approximate composition of an imitation gem-stone without the aid of chemical analysis.
The glasses employed in the manufacture of imitation gem-stones may be divided up into the following classes :
(1) Bottle and window-glass; constituents, CaO, Na20 or K~O, SiO~, F%Oa, Ti02, &c.
(2) Strass or lead glass; constituents, PbO, Na20 or K~O, SiO 2. Glasses of these two kinds date back to very early times. More
recent materials are : (3) Opal glasses; constituents same as (1), but also CaF~, SnO~,
or phosphates. (4) Borosilicate glasses ; constituents, B~Oa, Na~O or K.~O, SiO 2. (5) Lead glass in which the monovalent base Na20 or KzO is
replaced by thallium oxide. (6) Barium glasses designed primarily for optical work have been
utilized for the cheaper types of cut-glass table ware. It is only
1 C. E. Tilley, Min. Mag., 1922, vol. 19, p. 275.
F. A. BANNISTER ON SILICATE GLASSES 1 3 7
slightly inferior in brilliancy to the lead cut-glass ware. Cheap imitation gems of barium glass are perhaps also to be found on the market.
(7) Glasses similar in composition to gem-stones but non-crystal- line, a notable example being an emerald glass. This class is to be carefully distinguished from the artificial gem-stone, which is not only similar in composition but is also crystalline.
The distinction between classes (1) and (2) is no difficult matter. The possible variations in composition within each class, however, show one important difference. The percentage of colouring material needed in lead glass imitations is very small. Density and refractive index determinations can tell us the approximate percentage of PbO, but nothing about the colouring constituent ; this we may be able to judge from the colour. Class (1) differs materially in this respect. The amounts of F%03, TiO2, &e., used in colouring window-glass imitations are sufficient to af[ect materially the density and refractive index. Some method of distinguishing these types is therefore necessary. In addition, the method should be capable of distinguish- ing the more recent imitations described under classes (3), (4), (5), (6), and (7).
We intend to base our method on determinations of density and refractive index just as Tilley did in his work on the natural glasses. This is because these are physical properties generally capable of rapid and accurate measurement. I t must be remembered, however, that the optical dispersion of a glass is sensitive to small changes in chemical composition, and indeed for optical work this property is of paramount importance. There may be cases where, in order to distinguish one glass from another with certainty, dispersion measure- ments must be used. An example of this is the distinction between a potassium lead glass and thallium lead glasses containing not more than 10 % T120 (see below). In general, however, this more lengthy determination can be dispensed with. By plotting the density of natural glasses against their specific refractivity Tilley was able to group these glasses according to their chemical composition. I t was soon found during the course of the present work that with the arti- ficial glasses only partial success awaits such procedure. When, for instance, a series of various optical glasses is plotted in this way it is possible to distinguish only the lead glasses from the calcium glasses. The barium glasses, however, are confused with the lead glasses, it is difficult to separate the borosilicates, and no definite separation B L

1 3 8 F. A. BANNISTER ON
within the calcium group owing to the presence of other oxides is apparent. This indicated, therefore, that some other method would be necessary in dealing with imitation gem-stones. Limiting the determinations to density and refractive index, is it possible to discover a relation involving these two variables which indicates the composition of any silicate glass more clearly than does the specific refractivity ? I t is obviously important to study families of simple glasses to discover any fundamental relation.
Prior to the Great War this country imported nearly all its optical glass from Germany. The fascinating story of how patient research founded yet another home industry, and how England was able to produce the large quantities of optical glass needed in warfare is to be found among the papers of the Journal of the Society of Glass Technology. C.J. Peddle i gives a most interesting summary of this work, and indeed it is his systematic researches in various glass families that supplied the material for the present paper. I t should be mentioned that the United States of America was confronted with a similar, though less urgent problem, and F. E. Wright 2 is responsible for pioneer work on optical glass in that country. Naturally Peddle's and Wright's work have much in common, but the latter's preference for graphical representation of results, as opposed to tabulated data, renders his experimental values less accessible.
We will proceed at once, then, to a brief description of Peddle's work. He examined the physical and chemical propertie~ of the simple glasses 100Si02.zNa20 , x varying from 20 to 100 molecules, a This was also done for two potassium silicate glasses and two sodium potassium silicate glasses. He then proceeded to examine glasses of the type 100SiO~.40M20.xNO and 100SiO,,.20M20.xNO where M is sodium or potassium, N is calcium, barium, or lead, and x varies from 5 to 40 molecules) Data were also obtained in each case for the glasses 100Si02.20Na~O.20K20.xNO and 100Si02.10Na20. 10K20.xNO. Peddle gives values of the density, refractive index, dispersion, &c., for each glass sample made up, but it must be remembered that the composition of the glass differs, probably only slightly, from the ' batch ' composition. Data on analysed glasses are very scarce, and it is evident that Peddle's work suffers in this
1 C. J . Peddle, Journ . Soe. Glass Tech., 1920, vol. 4, p. 225. F. E. Wright , Journ . Amer . Ceramic Soc., 1920, vol. 3, p. 783.
3 C. J . Peddle, Journ . Soc. Glass Tech., 1920, vol. 4, pp. 20, 46, 59. 4 Ibid. , p. 299, and 1921, vol. 5, p. 201.

DENSITY AND REFRACTIVE INDEX OF SILICATE GLASSES 139
respect and necessarily so, owing to the urgency of the problems he attacked.
The present work has for its object the speedy identification of any silicate glass by determining the density, correct to 0.005 gm. per c.c., and the refractive index correct to 0.0005. I t is also hoped to obtain some idea as to its composition by this procedure. In referring to Peddle's work, then, on simple glass families we are primarily inter- ested in his density and refractive index determinations. For each glass family he gives six determinations ; in each case I have plotted the refractive index against the density correct to the limits specified above. Any one glass family thus plotted gives a straight line and each family gives a line whose slope is different from all the others. In all, twenty lines were plotted from Peddle's data; three Lypical lines are shown in fig. 1. The requisite data for plotting all the lines are given in Table I, which also includes Larsen's data for the albite-anorthite glasses and cnstatite-wollastonite glasses. 1 The three lines plotted in fig. 1 converge approximately to the same point, and the same result is true if all the lines be plotted together on the same graph. I t might thus appear that if we were given the density and refractive index of an unknown glass we could arrive at its approxi- mate composition by judging to which of the lines it fell nearest. This is the case for glasses whose density exceeds 3.00, but for values less than this it is difficult to distinguish one line from another owing to this property of convergence. Supposing now we find the co- ordinates, N, D, of this point of convergence for all the glass lines. Then if n and d be the refractive index and density of any one glass given in Table I, (n-N)/(d-D) will give the slope of the line on which the given glass lies. By the slope of any glass line as plotted in fig. 1 is meant the increase in refractive index per unit increase in density. Thus (n-N)/(d-D) should be "constant for any one family. I t must be emphasized that the convergence to one point of all these lines is only approximate. Thus the ratio (n-N)/(d-D) is only approximately constant and only approximately equal to the slope of the appropriate line, particularly for values of n and d approach- ing closely to N and D. We now proceed to find N and D as accu- rately as possible. For the three lines plotted in fig. 1, N and D can be read off directly, but for a large number of lines approximately convergent such a procedure is more difficult. I t is simpler to plot each line separately and measure directly both its slope and the
1 E. S. Larsen, Amer. Journ. Sci., 1909, aer. 4, vol. 28, p. 263.
L2

140 F . A . BANNISTER ON
TABLE I. (Data from C. J . Peddle and E. S. Larsen.)
Calcium glasses. 100Si02.40Na~O. 100Si0~.20Na20. 100SiO2.40K~0. 100Si0~.20K20.
xCaO. xCa0. xCaO. xCaO. x. n. d. n. d. n. d. n. d.
5 1.5110 2.503 1.4970 2.412 1.5125 2-488 1.5011 2.420 10 1-5189 2-533 1.5088 2.458 1.5179 2.513 1-5081 2.450 15 1.5259 2.559 1.5192 2-499 1.5229 2.535 1-5151 2.478 20 1.5327 2.584 1.5279 2-537 1.5277 2.555 1.5223 2.505 30 1-5442 2.629 1.5435 2.603 1.5379 2.594 1-5355 2.555 40 1.5540 2.667 1-5573 2.659 1.5475 2.630 1.5491 2.601
Lead glasses.
100Si02.40Na~0. 100Si02.20Na20. 100Si02.40K20. 100Si02.20K20. xPbO. xPbO. xPbO. xPb0.
5 1.5299 2.710 1.5186 2.628 1-5290 2.681 1-5201 2.616 10 1.5558 2-912 1.5448 2.911 1-5510 2-868 1.5480 2.849 15 1-5761 3.112 1.5691 3.152 1.5710 3.043 1.5707 3.089 20 1-5927 3.282 1.5930 3.368 1.5910 3.175 1.5941 3.290 30 1-6219 3-543 1-6272 3.690 1.6230 3-474 1.6284 3.640 40 1.6472 3-756 1-6571 3-940 1.6508 3.728 1.6596 3.942
Barium glasses. 100SiO,.40Na~O. 100SiO~.2ONa~O. 100Si02.40K20. 100Si02.20K20.
xBaO. xBa0. xBa0. xBa0.
5 1.5155 2.604 1.5037 2.557 1-5195 2.619 1-5080 2.565 10 1.5280 2.738 1.5202 2.708 1-5285 2.718 1-5203 2.681 15 1.5404 2.864 1-5357 2.853 1.5381 2.803 1.5317 2.798 20 1.5510 2-966 1.5483 2.987 1.5479 2.904 1-5437 2.922 30 1.5679 3-134 1.5698 3.203 1.5644 3.079 1.5652 3.143 40 1.5775 3.248 1.5895 3.407 1.5755 3.205 1.5838 3.308
100Si02.xNa~0. X. ~b. d . X.
20 1.4851 2.353 70 30 1.4952 2.413 80 40 1-5015 2.457 90 50 1-5056 2.495 100 60 1.5090 2-521 - -
Albite-Anorthite glasses. Composi- tion. n. d.
Ab 1.4890 2.382 Ab2An I 1.5166 2-483 AblAn 1 1.5307 2.533 AblAn 2 1.5452 2.591 AblAn a 1.5600 2.648 An 1.5755 2.700
Sodium and potassiumglasses.
n. d. 1.5118 2-535 1.5139 2.544 1.5155 2.555 1.5168 2.560
100Si0~.xK20. X. n. d.
20 1.4937 2.388
40 1.5073 2.465
Enstatite- Wollastonite glasses. MgSi0 a.
%. n. d.
0 1.6280 2.904 5 1.6262 2.899
14.74 1-6223 2.891 26 1.6174 2.881 36 1.6122 2.872 40
MgSiO 3. % n. d.
46.36 1.6073 2.854 60 1.6007 2.834 70 1.5960 2.821 90 1.5851 2.780 95 1.5822 2.777
1.6105 2.859 100 1.5801 2.758
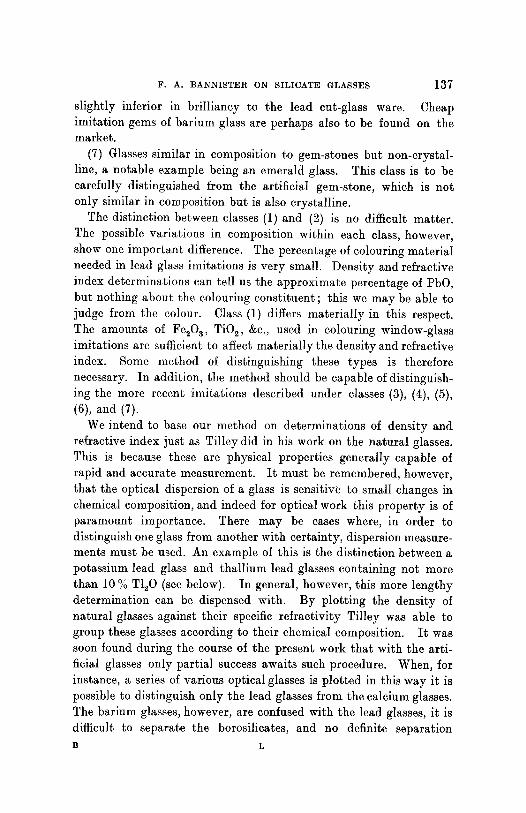
DENSITY AND REFRACTIVE INDEX OF SILICATE GLASSES 1 4 1
intercept of the line with the n axis. Table II shows the measured values of the slope a and the intercept b for each line. The general equation to any line as plotted in fig. 1 can then be expressed by
1 . 8 5
1 . 8 0 .
iiii[r 1.45~.
i I O O S ~ ~
=~02"40Na20"xSaO lOOSiO z �9 ~0//~
00'
�9 Silica g l a s s D e n s i t y d I I ! �9 0 2 . S 3 . 0 3 . S
FIG. 1. Graph plotting refractive index n and density d of glass famiHse. n = ad+ b. If this line passes through the point of convergence whose co-ordinates we have assumed to be N, D, then
N = a D + b . (1)
This relation is true for each pair of a and b values listed in Table I I providing the appropriate line passes through the point of conver- gence. Thus
b N a = - ~ + ~ , (2)
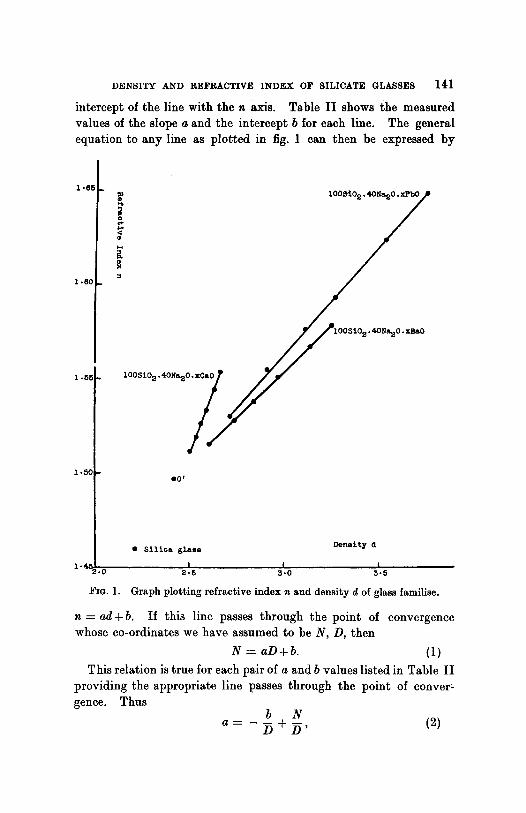
142 P.A. B A N N I S T E R O N
tha t is, p lo t t ing a against b should give a s t raight line whose slope (da/db) is equal to -1/D and whose intercept on the a axis is equal to N/D. Fig. 2 shows such a graph for all a and b values, from which i t is clear to what degree of accuracy the a and b values for each family conform to equation (1). Fur ther , i t is now possible from the slope of the line in fig. 2 and its intercept with the a axis to measure
0.300 ~ l t e-wollastonite glasses
I t e - a n o r t h t % e g l a s s e s
O'~OC ~ ~ a glass
~ Lead
O. 10( ' " Barium ~ Intercept on n axis = b I |
0-8 1 "0 ] "2
FIG. 2. Graph plotting dn/dd and intercept on n axis for glass families.
direct ly the values of N and D ; we obtain N = 1.497 ; D ---- 2.43. This point O" so deduced has been marked in fig. 1.
Table I I contains all the di rect ly determined values of a and b ; in addit ion, values of b calculated from the now known values of N and D and equation (1) have also been given. The straight line relations tha t have thus been obtained are not surprising if we regard glasses as solid solutions and 1.497 and 2.43 as the values of refractive index and densi ty for the ' p a r e n t subs tances ' of all these glasses. Now we know tha t Peddle gradual ly added equal molecular propor- tions of CaO, PbO, or BaO to a group consisting of either 100SiO2. 40M~O or 100Si02,20M20 , where M is Na or K. ]f we tabula te the n and d values of these four ' parent subs tances ' as below and average them i t is obvious we have an explanat ion of the values 1.497 and 2.43 obtained from graph 2. The agreement is as exact as we can expect.

DENSITY AND REFRACTIVE INDEX OF SILICATE GLASSES
Glass composition. Refractive index, n. Density, d.
100 SiO2.20Na~O 1.4851 2.353 100 SiO~.40Na20 1.5015 2.457 I00 SiO~.20K20 1.4937 2.388 100 Si02.40KuO 1.5073 2.465
Average 1-497 2.42
143
TABLE II. (Data for plotting in fig. 2.)
Slope of line Intercept Calculated intercept Glass family, a = dn/dd, b. b 1 = N-aD.
100SiO~.20-100Na~O 0.150 1.132 1.135 100SiO~.20~0K~O 0.i76 1.073 1-071 100Si02.20Na20.xCaO 0.243 0-911 0.910 100SiO~.40Na~O.xCaO 0.2"64 0.851 0.858 100SiO~.20K~OzCaO 0.261 0.869 0-866 100Si02.40K~O.xCaO 0.252 0.885 0.887 100SiO~.40Na~O.xPbO 0.109 1.236 1.235 100SiO~.20Na~O.xPbO 0.105 1.239 1-244 100SiO~.40K~O.xPbO 0.119 1-210 1.211 100SiO~.20K~O.xPbO 0-104 1.250 1.247 100SiO~.40Na~O.xBaO 0.094 1.270 1.271 100SiO~.20Na20.xBaO 0.099 1.254 1-257 100SiO~.40K~O.xBaO 0.098 1.263 1-262 100SiO~.20K~0.xBaO 0.100 1-252 1-254 Albite-anorthite 0.269 0.848 0.846 Enstatite-wollastonite 0.309 0.730 0.746
H a v i n g found N and D as accura te ly as possible, (n - N)/(d - D) can
now be ca lcu la ted for any glass and p lo t t ed agains t n or d. F o r any
one fami ly of glasses such a procedure should, of course, resul t in a
hor izonta l s t ra igh t l ine whose o rd ina te is equa l to the a va lue for the
f ami ly as g iven in Tab le I I . There is a s imple graphica l m e t h o d of
p lo t t ing ( n - N ) / ( d - D) agains t n or d which wil l now be described.
Choosing the fo rmer a l t e rna t ive we p lo t va lues of n as abscissae and
va lues of ( n - N ) / ( d - D ) as ordinates. We now wan t to find how n
var ies wi th ( n - N ) / ( d - D) for va r ious fixed va lues of d, say 2.5, 2.6,
2.7, &c.
Now ( n - N ) / ( d - D ) = a ; .'. n = ( d - D ) a + N .
Subs t i tu t ing the va lues for N, D, and d we get a series of
equa t ions : n = (2.5 - 2 . 4 3 ) a + 1.497,
n -- (2.6 - 2 . 43 )a+ 1.497,
n = ( 2 . 7 - 2 . 4 3 ) a + 1.497, &c.,
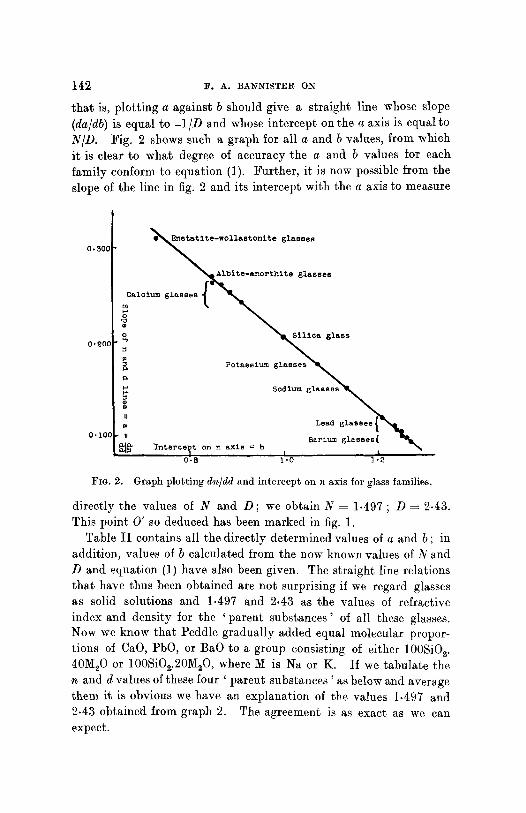
1 4 4 F . A . BANNISTER ON
each of which represents a straight line passing through the point 1.497 on the n axis. Choosing a convenient value, say 0.4, for a, we get n = 1.525, 1.565, 1.605, &c. Thus we merely have to subdivide the horizontal line a = 0.4 and join each point to the point n = 1.497 on the n axis. We then have a system of lines radiating from one point each corresponding to a given density. Fig. 3 illustrates such a system ; any glass whose refractive index and density are known can now be readily plotted and its a value read off directly. Peddle's data have been plotted in this way in fig. 3. For any one family, the glasses whose values of n and d approach 1.497 and 2.43 no longer lie on a horizontal line, but lie on a curve. The reason for this is not far to seek. From the expression ( n - 1.497)/(d- 2.43), as both numerator and denominator become smaller, any small irregular variation of n or d or any small error in the values of the fixed con- stants 1.497 and 2.43 will greatly affect the value of a. Finally, when n ---- 1.497 and d ---- 2-43, a is indeterminate, i. e. a glass corre- sponding to these values when plotted in the graph can lie anywhere on the vertical line n ---- 1.497.
Before proceeding to the application of this method of plotting for determining imitation gem-stones, a brief explanation will be given of the significance of the slope of any n and d line as plotted in fig. 1. Peddle and Larsen both found that the refractive indices and the specific volumes are approximately additive for glasses. I t can thence be shown very simply that the relation between the refractive indices and densities of a series of glasses should be sensibly linear, and, moreover, the slope of any line is obviously equal to the difference of the refractive indices of the end- components divided by the difference of the densities of the end- components. As an example let us consider the calcium glasses studied by Peddle. The refractive index and density of one end- component we know to be approximately 1.497 and 2.43. The values for calcium silicate glass from Larsen's work are 1.628 and 2.904. If we assume this as the other end-member for the calcium glasses we shall be ignoring the sodium or potassium oxides present. How- ever (1 .628- 1.497)/(2.904- 2.42) = 0.27. This calculated value is remarkably close to the range of values given in Table I I for calcium, namely 0.243 - 0-264.
We have found that the plotting of (n- N)/(d- D) against n is a very suitable one for simple glasses studied by Peddle. I t is natural to a t tempt an application of this method for determining more com-

D E N S I T Y A N D R E F R A C T I V E I N D E X OF S I L I C A T E G L A S S E S 1 4 5
plex glasses. Since imitation gem-stones are made from various glasses whose 'parent substance' is SiO~ rather than 100SiO~. 20-40M~O we will plot (n - 1.460)/(d- 2-21) against n, where 1-460 and 2.21 are the refractive index and density of silica glass. There is
0 . 4 0 0 2 . 4 S 2 . S 2 . 8 2 - 7 2 . 8 ~.g S-O
9,~0(
0 . 2 0 (
O. lOC
0-00~ 1 . 4
K ! !
1 . 5 1 . 8 1 .7
FIG. 3. Graph plotting (~- 1.497)/(d-2.43) and n for glass families.
an additional reason for adopting these lower values for N and D. quite a large number of imitation gem-stones have refractive indices in the neighbourhood of 1-497. From fig. 3 it is obvious that such glasses are not well separated. I t would be better to have the indeterminate region farther to the left. This has been achieved by changing N and D to the values for silica glass. This method possesses an advantage in that it separates the glasses into groups more satisfactorily than plotting the specific refractivity as was done

146 F . A . BANNISTER ON SILICATE GLASSES
by Tilley. Incidentally such a method need involve no calculation ; the plotting can be done graphically in the way described above.
Before plotting any unknown glass the simple glass families were marked out so that definite areas could be assigned to the calcium, barium, and lead glasses. Naturally, plotting the modified expression ( n - 1.46)/(d - 2.21) against n does not lead to a system of horizontal straight lines as in fig. 3, but it is possible to mark out the above- mentioned areas, and the lead and barium lines are only slightly inclined to the horizontal.
The borosilicate glasses present a different type of problem from most glasses. English and Turner i have studied a series of sodium borosilicate glasses and they find that neither the specific volumes nor the specific refractivities can be considered as additive. If the density of each glass be plotted against the refractive index not only are the curves obtained far from linear but they possess a point of inflexion. If we plot ( n - 1 .46)/(d- 2.21) against n for these glasses, however, on the same graph as we have marked out areas for the silicate glasses (fig. 4), then a definite area is obtained for the boro- silicates, although, of course, there is no approach to horizontal alinement.
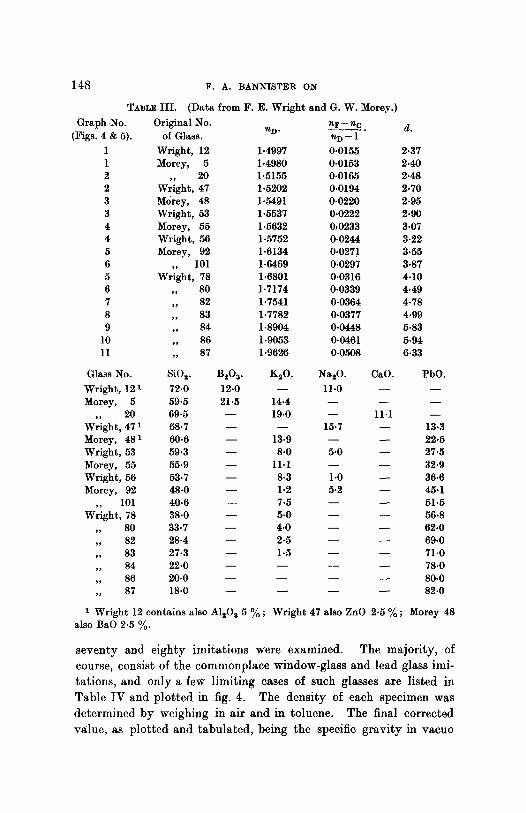
Having now obtained as it were a general key to glass composition for some of the more important glass constituents we proceed to test its use and accuracy upon glasses of known composition. For this purpose we make use of the data on optical glasses listed by G. W. Morey 2 and F. E. Wright, 8 which are reproduced in Table I I I and plotted in fig. 4. To keep this graph as clear as possible only the limits of each group have been marked. There would be no object in showing a whole range, for instance of lead glasses, all close to each other. With the exception of glasses containing both barium and lead the separation of the different types is well marked. I t may be noted that the natural glasses plotted in this way separate out just as well as in the Tilley plot.
We are now in the position to .use fig. 4 for the determination of imitation gem-stones. The particular imitations examined com- prised about twenty-five typical specimens very kindly lent to me by the late Mr. B. J. Tully and a varied collection in the Mineral Depart- ment of the British Museum (Natural History); in all between
1 S. English and W. E. S. Turner , Journ . Soc. Glass Tech., 1923, vol. 7, p. 155. G. W. Morey, In t e rna t iona l Critical Tables, 1927, vol. 2, p. 102.
a :F. E. Wright , Journ . Amer . Ceramic Sot., 1920, vol. 3, p. 783.

~ ~o:
I~-~,,o.|
. . _ r . 3 . ~
i
o
o
I
-g
I
-d
Values of ~ -" 2-~11"460
o o
|
148 F . A . BANNISTER ON
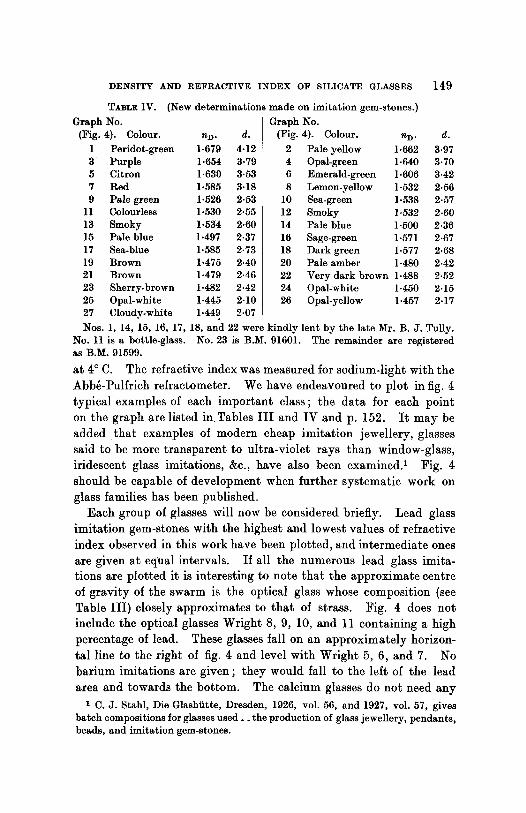
TABLE I I I . (Data from F. E. Wr igh t and G. W. Morey.)
Graph No. Original No. n F - nc (Figs. 4 & 5). of Glass. riD" n D - 1 "
1 Wright , 12 1-4997 0.0155 1 Morey, 5 1.4980 0-0153 2 20 1.5155 0.0165 2 Wright , 47 1'5202 0.0194 3 Morey, 48 1.5491 0.0220 3 Wright , 53 1-5537 0.0222 4 Morey, 55 1:5632 0,0233 4 Wright , 56 1-5752 0.0244 5 Morey, 92 1.6134 0.027! 6 101 1.6469 0-0297 5 Wright , 78 1.6801 0 .0316 6 ,, 80 1.7174 0.0339 7 ,, 82 1-7541 0.0364 8 ,, 83 1.7782 0.0377 9 ,, 84 1.8904 0.0448
10 ,, 86 i .9053 0-0461 11 ,, 87 1.9626 0.0508
Glass No. SiO 2. B~O s. K~O. Na~O. CaO.
Wright , 121 72.0 12.0 - - 11-0 Morey, 5 59.5 21.5 14.4 - - - -
20 69.5 - - 19.0 - - 11.1 Wright , 471 68.7 - - - - 15.7 - - Morey, 481 60.6 - - 13.9 - - - - Wright , 53 59.3 - - 8.0 5.0 - - Morey, 55 55.9 - - 11.1 - - - - Wright , 56 53.7 - - 8.3 1.0 - - Morey, 92 48-0 1-2 5-2 - -
101 40.6 - - 7.5 - - - - Wright , 78 38.0 - - 5.0 - - - -
,, 80 33.7 - - 4.0 - - - - ,, 82 28-4 - - 2-5 - - ,, 83 27-3 - - 1"5 - - --- ,, 84 22-0 . . . . ,, 86 20.0 . . . . ,, 87 18.0 . . . .
d~
2-37 2.40 2.48 2.70 2-95 2.90 3.07 3.22 3.55 3.87 4.10 4.49 4-78 4.99 5.83 5.94 6.33
PbO.
13-3 22.5 27.5 32.9 36.6 45.1 51-5 56.8 62-0 69.0 71.0 78.0 80-0 82-0
1 Wr igh t 12 conta ins also A120 a 5 % ; Wr igh t 47 also ZnO 2.5 ~/o ; Morey 48 also BaO 2.5 %.
s e v e n t y a n d e i g h t y i m i t a t i o n s w e r e e x a m i n e d . T h e m a j o r i t y , of
c o u r s e , c o n s i s t of t h e c o m m o n p l a c e w i n d o w - g l a s s a n d l e a d g l a s s i m i -
t a t i o n s , a n d o n l y a f e w l i m i t i n g c a s e s of s u c h g l a s s e s a r e l i s t e d i n
T a b l e I V a n d p l o t t e d i n fig. 4. T h e d e n s i t y of e a c h s p e c i m e n w a s
d e t e r m i n e d b y w e i g h i n g in a i r a n d in t o l u e n e . T h e f i n a l c o r r e c t e d
v a l u e , as p l o t t e d a n d t a b u l a t e d , b e i n g t h e spec i f i c g r a v i t y i n v a e u o
DENSITY AND REFRACTIVE INDEX OF SILICATE GLASSES 149
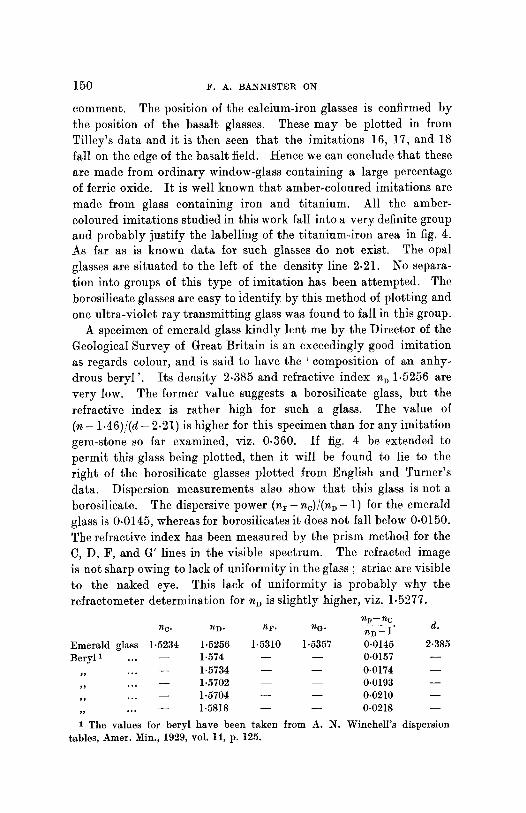
TABLE IV. Graph No.
(Fig. 4). Colour. n v. d. 1 Peridot-green 1 .679 4-12 3 Purple 1-654 3-79 5 Citron 1.630 3.53 7 Red 1.585 3.18 9 Pale green 1-526 2.53
11 Colourless 1-530 2.55 13 Smoky 1.534 2.60 15 Pale blue 1.497 2.37 17 Sea-blue 1.585 2.73 19 Brown 1.475 2.40 21 Brown 1.479 2.46 23 Sherry-brown 1 .482 2.42 25 Opal-white 1-445 2-10 27 Cloudy-white 1.449 2.07
(New determinations made on imitation gem-stones.) Graph No.
(Fig. 4). Colour. n D. d. 2 Pale yellow 1.662 3.97 4 Opal-green 1.640 3.70 6 Emerald-green 1-606 3.42 8 Lemon-yellow 1-532 2.56
10 Sea-green 1.538 2-57 12 Smoky 1.532 2.60 14 Pale blue 1.500 2.36 16 Sage-green 1.571 2.67 18 Dark green 1.577 2.68 20 Pale amber 1.480 2.42 22 Very dark brown 1.488 2.52 24 Opal-white 1-450 2.15 26 Opal-yellow 1.457 2.17
Nos. 1, 14, 15, 16, 17, 18, and 22 were kindly lent by the late Mr. B. J. Tully. No. 11 is a bottle-glass. No. 23 is B.M. 91601. The remainder are registered as B.M. 91599.
at 4 ~ C. The refractive index was measured for sodium-light with the Abb6-Pulfrich refractometer. We have endeavoured to plot in fig. 4 typical examples of each important class; the data for each point on the graph are listed i n T a b l e s I I I and IV and p. 152. I t may be added that examples of modern cheap imita t ion jewellery, glasses
said to be more t ransparent to ultra-violet rays than window-glass, iridescent glass imitations, &c., have also been examined. 1 Fig. 4: should be capable of development when further systematic work on glass families has been published.
Each group of glasses will now be considered briefly. Lead glass imitat ion gem-stones with the highest and lowest values of refractive index observed in this work have been plotted, and intermediate ones are given at equal intervals. If all the numerous lead glass imita- tions are plotted it is interesting to note tha t the approximate centre of gravity of the swarm is the optical glass whose composition (see Table I I I ) closely approximates to tha t of strass. Fig. 4 does not include the optical glasses Wright 8, 9, 10, and 11 containing a high percentage of lead. These glasses fall on an approximately horizon-
tal line to the right of fig. 4 and level with Wright 5, 6, and 7. No bar ium imitations are given; they would fall to the left of the lead area and towards the bottom. The calcium glasses do not need any
1 C. J. Stahl, Die Glashtitte, Dresden, 1926, vol. 56, and 1927, vol. 57, gives batch compositions for glasses used. _ the production of glass jewellery, pendants, beads, and imitation gem-stones.
1 5 0 F . A . B A N N I S T E R O N
comment. The position of the calcium-iron glasses is confirmed by the position of the basalt glasses. These may be plotted in from Tilley's data and it is then seen that the imitations 16, 17, and 18 fall on the edge of the basalt field. Hence we can conclude that these are made from ordinary window-glass containing a large percentage of ferric oxide. I t is well known that amber-coloured imitations are made from glass containing iron and titanium. All the amber- coloured imitations studied in this work fall into a very definite group and probably justify the labelling of the titanium-iron area in fig. 4. As far as is known data for such glasses do not exist. The opal glasses are situated to the left of the density line 2.21. No separa- tion into groups of this type of imitation has been attempted. The borosilicate glasses are easy to identify by this method of plotting and one ultra-violet ray transmitting glass was found to fall in this group.
A specimen of emerald glass kindly lent me by the Director of the Geological Survey of Great Britain is an exceedingly good imitation as regards colour, and is said to have the ' composition of an anhy- drous beryl ' I ts density 2.385 and refractive index nD 1.5256 are very low. The former value suggests a borosilicate glass, but the refractive index is rather high for such a glass. The value of (n - 1.46)/(d - 2.21) is higher for this specimen than for any imitation gem-stone so far examined, viz. 0.360. If fig. 4 be extended to permit this glass being plotted, then it will be found to lie to the right of the borosilicate glasses plotted from English and Turner's data. Dispersion measurements also show that this glass is not a borosilicate. The dispersive power (n s - nc)/(nD- 1) for the emerald glass is 0.0145, whereas for borosilicates it does not fall below 0.0150. The refractive index has been measured by the prism method for the C, D, F, and G' lines in the visible spectrum. The refracted image is not sharp owing to lack of uniformity in the glass ; striae are visible to the naked eye. This lack of uniformity is probably why the refractometer determination for nD is slightly higher, viz. 1.5277.
n F - - ~C n C. r iD. n F . r iG. n D -- I" d .
E m e r a l d g l a s s 1 . 5 2 3 4 1 . 5 2 5 6 1 . 5 3 1 0 1 . 5 3 5 7 0 . 0 1 4 5 2 - 3 8 5
B e r y l 1 . . . - - 1 . 5 7 4 - - - - 0 . 0 1 5 7 - -
- - 1 . 5 7 3 4 - - - - 0 . 0 1 7 4 - -
- - 1 . 5 7 0 2 - - - - 0 . 0 1 9 3 - - ~ . . .
- - 1 . 5 7 0 4 - - - - 0 . 0 2 1 0 - - ~ . . .
- - 1 . 5 8 1 8 - - - - 0 . 0 2 1 8 - -
1 T h e v a l u e s f o r b e r y l h a v e b e e n t a k e n f r o m A . N . W i n c h e l i ' s d i s p e r s i o n
t a b l e s , A m e r . M i n . , 1 9 2 9 , v o l . 1 4 , p . 1 2 5 .

DENSITY AND REFRACTIVE INDEX OF SILICATE GLASSES 151
The distinction between this emerald glass and the other types of imitations is obviously well marked whether we plot it on fig. 4 or measure its dispersive power and plot it on fig. 5. I t is interesting, however, to speculate on its actuaI composition. Greville Williams, 1 over fifty years ago, fused emeralds with the oxyhydrogen blowpipe and found that their density decreases from 2.70 to 2.40. He also succeeded in preparing beryl glasses by fusing together a mixture of the same composition as beryl. He successfully coloured these glasses by the addition of chromic oxide (green), cobalt oxide (blue), and didymium oxide (pink). He gave 2.42 as the density of his arti- ficial glass. I t is quite probable, then, that the emerald glass we are studying actually has the ' composition of an anhydrous beryl '. Its colour, of course, is due to the presence of a small amount of chromic oxide. A series of beryllillm glasses has recently been studied by Lai and Silvermann. ~ They vary in density and refractive index from 2.4168 to 2.4885 and 1.5081 to 1.5265 respectively. When plotted on fig. 4 they fall between the borosilicates and the calcium glasses ; (n - 1.460)/(d- 2.21) varies from 0.220 to 0.250.
Data on thallium glass are very scanty. I t was therefore decided to make up some samples of known composition in order to discover whether lead glass imitations containing thallium could be dis- tinguished from the ordinary lead glass counterfeits. The four glasses were made up to have the molecular formulae 100SiO~.20K~O. 20Tl~O.20PbO, 100Si02.10K~O.10Tl~O. 10PbO, 100Si02.35K~0. 5T120.10PbO , and 100SiO~.40TI~O.40PbO, but owing to the volatilit X of thallous oxide the analyses show that the actual composition departs widely from these formulae. In addition to measuring the refractive index and density of these glasses, it was thought advisable to measure the dispersion, and the refractive index was measured for the C, D, and F lines. 1~o. 1 glass is pale blue-green and easily fusible, nos. 2 and 3 are more difficult to fuse and are colourless. No. 3 has shown traces of decomposition since manufacture, probably owing to the high potassium oxide content. These three glasses are all somewhat streaky internally and gave diffuse refracted images. I have not been able to measure their refractive indices to a higher degree of accuracy than the third place of decimals. The fourth glass made up contains no potassium oxide and is easily fusible.
G. Williams, Proe. Roy. Soc. London, 1873, vol. 21, p. 409. C. F. Lai and A. Silvermann, Journ. Amer. Ceramic Soe., 1928, vol. 11,
p. 535.
A n a l y s e s . No . Si02" P b 0 . TI~0.
1. 27 .17 23 .98 36 .36 2. 38 .45 18.81 29 .38 3. 36 .99 18.06 7.46 4. 20 .83 24 .82 55 .01
152 F.A. BANNISTER ON SILICATE GLASSES
This glass, by powdering aP~er the first fusion and fusing again, has been rendered reasonably free of striae but is full of minute bubbles. I t is violet-brown in colour; such a colour suggests reduction of the lead oxide during fusion, but since the thallium was added as the nitrate after the lead oxide and silica had been melted together, it is difficult to see how reduction could have taken place. The percentage of thallium in this glass is very high, and the bubbles are possibly due to thallous oxide vapour escaping during fusion.
Nos. 2 and 3 glasses are strongly fluorescent in the ultra-violet rays giving a bright primrose:yellow colour, exactly similar to the colour given by thallous carbonate. No. 1 glass is not as strongly fluorescent and gives a darker yellow colour, whilst no. 4 does not appear to react to the rays at all. Many thallium compounds were tried but none with the exception of the carbonate gave the yellow fluorescence. Most gave a dull violet-brown colour, only perceptible when the intensity of the rays was at its maximum. I t is well known tha t a uranium glass containing much lead oxide does not fluoresce. I t is possible then that nos. 2 and 3 exhibit fluorescence more than 1 and 4 because they have the lowest lead oxide con- tent. At all events we have yet another method of distinguishing thallium glass imitations of low thallium content from lead glass imitations. All four glasses can be easily scratched with a steel knife and were readily ground and polished to prisms of small angle. Much more accurate measurements were possible on no. 4.
Tha l l ium grasses.
Refractive Indices. nF-- nc. Density. K~O. C. D. F. n D - 1 d.
12.07 1.736 1.744 1.766 0.0443 4.42 12.63 1.650 1.657 1.673 0.0342 3.75 37.49 1.581 1.586 1.599 0.0307 3.12
- - 1.9276 1.9431 1.9808 0.0564 6.03 For no. 4 glass hA' = 1.9126 and n G, = 2.0197.
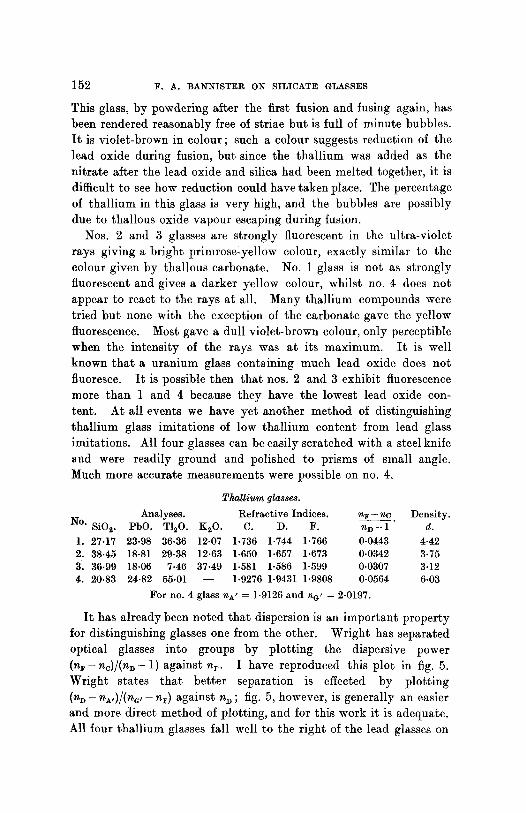
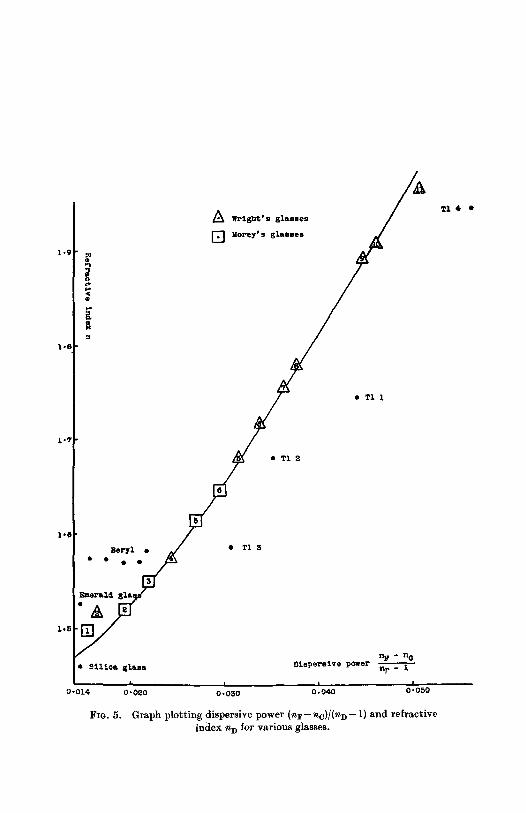
I t has already been noted that dispersion is an important property for distinguishing glasses one from the other. Wright has separated optical glasses into groups by plotting the dispersive power (nF - n c ) / ( n n - 1) against n r. I have reproduced this plot in fig. 5. Wright states tha t better separation is effected by plotting ( n D - n A , ) / ( n ~, - n~) against % ; fig. 5, however, is generally an easier and more direct method of plotting, and for this work it is adequate. All four thallium glasses fall well to the right of the lead glasses on
1 . 9
1 - 6
1-7
1"6
1 . 5
0-014
W r i S t ' s l~lasees T I 4 �9
[ ] .o~'ey's glasses ^ ~
A / / �9 T1 1
/ �9 T1 2
Beryl �9 ~ �9 T1 3
n F - uQ S~.lioa glass ~lep~reive powel" n p - I
01"020 0~030 01040 0'-050 FIG. 5. G r a p h p l o t t i n g d i s p e r s i v e p o w e r (nF--nc)/(nr)- 1) a n d r e [ r a c t i v e
i n d e x n D for v a r i o u s g lasses .

154 F . A . BANNISTER ON SILICATE GLASSES
such a graph. In fig. 4, no. 3 tha l l ium glass is very near to the lead area, so tha t dispersion measurements are in this case a necessary confirmation of the dist inct ion between the two types. Dispersion measurements in general are advised for border-l ine cases.
The above analyses of the tha l l ium glasses have made possible the evaluat ion of the dens i ty factor of T120 in glass, and also have led to more correct values for the specific rcfract ivi t ies of the con- st i tuents. W. L. Bail l ie 's 1 value for the densi ty factor of PbO has been assumed, and t ha t of Peddle for Si02. The specific refractivit ies of SiO 2 and PbO given by Larsen are assumed to be correct, ~ since lead glasses of low alkal i content agree well ; bu t his value for K~O has been increased slightly, and tha t for TI~0 to a considerable extent.
SiO~. PbO. T120. K20. Density factor . . . . . . 2.20 10.3 9.6 3.00 Specific refractivity ... 0.207 0-137 0.150 0.202 Molecular refractivity... 12-42 30-55 63.6 19-00
In conclusion I should like to thank the Keeper of Minerals, Dr. L. J. Spencer, both for suggesting this interest ing problem and for most valuable assistance in presenting the results obtained. To Mr. A. F. Hal l imond of the Museum of Pract ical Geology I am also indebted for help and advice. Mr. M. H. Hey of the Mineral Depar tment k ind ly made up and analysed the four thal l ium glasses.
1 W. L. Baillie, Journ. Soc. Chem. Ind., 1921, vol. 40, p. 141.. 2 E S. Larsen, The microscopic determination of nonopaque minerals, 1921,
p. 31.