Embed Size (px)
Citation preview
CLINICAL SCIENCE
Determination of Clinically Relevant Cutoffs for HIV-1Phenotypic Resistance Estimates Through a Combined
Analysis of Clinical Trial and Cohort Data
Bart Winters, MSc,* Julio Montaner, MD,† P. Richard Harrigan, PhD,† Brian Gazzard, MD,‡
Anton Pozniak, MD,‡ Michael D. Miller, PhD,§ Sean Emery, PhD,k Frank van Leth, MD,¶
Patrick Robinson, MD,# John D. Baxter, MD,** Marie Perez-Elias, MD,†† Delivette Castor, MPH,‡‡
Scott Hammer, MD,§§ Alex Rinehart, PhD,kk Hans Vermeiren, PhD,*
Elke Van Craenenbroeck, PhD,* and Lee Bacheler, PhD¶¶
Background: Clinically relevant cutoffs are needed for the inter-
pretation of HIV-1 phenotypic resistance estimates as predicted by
‘‘virtual’’ phenotype HIV resistance analysis.
Methods: Using a clinical data set containing 2596 treatment
change episodes in 2217 patients in 8 clinical trials and 2 population-
based cohorts, drug-specific linear regression models were developed
to describe the relation between baseline characteristics (resistance,
viral load, and treatment history), new treatment regimen selected,
and 8-week virologic outcome.
Results: These models were used to derive clinical cutoffs (CCOs)
for 6 nucleoside/nucleotide reverse transcriptase inhibitors (zidovu-
dine, lamivudine, stavudine, didanosine, abacavir, and tenofovir),
3 unboosted protease inhibitors (PIs; indinavir, amprenavir, and
nelfinavir), and 4 ritonavir-boosted PIs (indinavir/ritonavir, ampre-
navir/ritonavir, saquinavir/ritonavir, lopinavir/ritonavir). The CCOs
were defined as the phenotypic resistance levels (fold change [FC])
associated with a 20% and 80% loss of predicted wild-type drug
effect and depended on the drug-specific dynamic range of the assay.
Conclusions: The proposed CCOs were better correlated with
virologic response than were biological cutoffs and provide a relevant
tool for estimating the resistance to antiretroviral drug combinations
used in clinical practice. They can be applied to diverse patient
populations and are based on a consistent methodologic approach to
interpreting phenotypic drug resistance.
Key Words: biological cutoffs, clinical cutoffs, drug resistance,
genotype, predicted phenotype
(J Acquir Immune Defic Syndr 2008;48:26–34)
Phenotypic resistance testing of HIV-1 strains can providean accurate, quantitative assessment of alterations in
drug susceptibility in comparison to a standardized referencestrain.1,2 To use these quantitative test results optimally,especially in clinical practice, interpretation of the results isrequired. Initially, the designation of HIV resistance statusused in phenotypic assay systems was based on technical assayperformance. Typically, 2.5-, 4-, or 10-fold changes (FCs) indrug susceptibility were arbitrarily used to define drugresistance to specific antiretroviral drugs (ARVs). The findingthat there are large differences in the distribution of pheno-typic drug susceptibility to ARVs among HIV variants fromtreatment-naive individuals3,4 led to the redefining of thesetechnical cutoffs according to the natural variation of pheno-typic susceptibility. Although these biologic cutoffs (BCOs)were an improvement over the arbitrary technical cutoffs, therewas still no direct association between these values and clinicaloutcome. Efforts to address this have been undertaken forsome ARVs. For example, it has been reported that a 1.4-FCin the median inhibitory concentration (IC50; Antivirogramassay [AVG]; Virco, Mechelen, Belgium) was associated witha small reduction in virologic response to tenofovir (TDF) inARV-experienced patients, whereas a 3.8-FC was associatedwith a strongly reduced response or no response at all.5 Inother studies of patients failing HIV protease inhibitor (PI)–based therapy, clinically relevant phenotypic cutoffs associatedwith poorer virologic and clinical outcomes have beenestimated at 4- to 8-fold for indinavir (IDV) and ritonavir(RTV) and at 2.5- to 8-fold for saquinavir (SQV) using an ‘‘in-house’’ recombinant virus PI susceptibility assay.6 Clinicalbreakpoints for abacavir (ABC) have also been reported forHIV phenotype determined with the Monogram Biosci-ences (South San Francisco, CA) PhenoSense (PS) assay(4.4- and 6.3-fold) or the AVG (3.2- and 7.5-fold).7 The need
Received for publication July 27, 2007; accepted February 13, 2008.From *Virco BVBA, Mechelen, Belgium; †British Columbia Centre for
Excellence in HIV/AIDS, Vancouver, British Columbia, Canada;‡Chelsea and Westminster Healthcare National Health Services Trust,London, United Kingdom; §Gilead Sciences, Foster City, CA; kNationalCentre in HIV Epidemiology and Clinical Research (NCHECR),University of New South Wales, Sydney, Australia; {InternationalAntiviral Therapy Evaluation Center (IATEC), Amsterdam, The Nether-lands; #Boehringer Ingelheim, Ridgefield CT; **Cooper UniversityHospital/University of Medicine and Dentistry of New Jersey–RobertWood Johnson Medical School, Camden, NJ; ††Ramon y Cajal Hospital,Madrid, Spain, ‡‡New York Academy of Medicine, New York, NY;§§Columbia University, New York, NY; kkTibotec Therapeutics, Durham,NC; and {{VircoLab, Inc., Durham, NC.
Correspondence to: Bart Winters, MSc, Virco BVBA, Gen. De Wittelaan L11B 4, 2800 Mechelen, Belgium (e-mail: [email protected]).
Copyright � 2008 by Lippincott Williams & Wilkins
26 J Acquir Immune Defic Syndr � Volume 48, Number 1, May 1, 2008
Copyright © 2008 Lippincott Williams & Wilkins. Unauthorized reproduction of this article is prohibited.
for clinically evaluated analyses for the interpretation ofgenotypic drug resistance tests has been highlighted ina position paper.8
In this study, we present a novel approach for derivingclinically relevant cutoffs of estimated HIV-1 phenotypicresistance information for HIV nucleoside/nucleotide reversetranscriptase inhibitors (NRTIs) and PIs. To create thepredictions, we used virco TYPE HIV-1 v. 4.0.00 (vT), aresistance analysis system that predicts phenotypic FC frommutational sequences. This approach treats all drugs consis-tently and is applicable to diverse treatment combinationsand patient populations. We have evaluated the model onindependent test data whenever possible and assessedthe performance of clinical cutoffs (CCOs) compared withBCOs for predicting virologic response of drug-resistant HIVvariants.
METHODS
Clinical Data SourcesClinical data from 2 clinical cohorts (British Columbia
Center for Excellence in HIV/AIDS, Vancouver, BritishColumbia, Canada; Chelsea and Westminster HealthcareNational Health Service Trust, London, United Kingdom)and 8 controlled clinical studies [2NN trial,9 CREST,10,11
Gilead GS-99 to 907(14), VIRA3001,12 GART,13 RESA14
2026, CERT,15 and a trial of modified directly observedtherapy New York Academy of Medicine (NYAM)16] wereused to construct a clinical database in Oracle.
Treatment regimens included in the analysis had to meetthe following inclusion criteria: a partial or complete regimenchange (defined as a discontinuation or a dose change of 1 ormore drugs in the regimen or the addition of a drug that wasnot present in the regimen) must have occurred after aresistance test, baseline sequence and viral load data within 3months of starting a new regimen had to be available, the newregimen had to be stable for at least 4 weeks, no experimentalARV treatments were allowed in the background regimen, andviral load data 8 weeks after beginning a new regimen had tobe available. Viral load data at week 8 was selected as the viralload closest to day 54 of the treatment within a windowranging from 25 to 84 days. Separate data sets were created foreach drug; each treatment regimen contributed to data sets foreach of the drugs in the regimen. Ritonavir-boosted (r) andnonboosted PIs were modeled separately. Only enteric-coatedtablets were selected for the didanosine (ddI) data set. The dataset for SQV/r only contained the hard-gel formulation at dailydoses of at least 2000 mg.
Part of the clinical data set was set aside for validationpurposes. This validation data set consisted of 1888 additionaltreatment episodes derived from clinical cohorts and fromseveral clinical trials not used for clinical cutoff (CCO)development received after July 2005. Notice that patientsfrom these studies with a regimen containing a drug for which,200 records were available in the development set wereassigned to the development data set rather than to thevalidation set to increase the robustness of the CCO estimates.
Development of Statistical Modelsof Virologic Response
Predicted phenotypic drug susceptibility was quantifiedusing the vT analysis system, which predicts phenotypic drugresistance from HIV genotype using linear regression models.17
Parametric linear regression models18 for censored data(which are also used for time-to-event modeling using theLIFEREG procedure in SAS v8.2 [SAS Institute, Cary, NC] asdescribed by Hughes19) were developed to model the change inplasma viral load from baseline to week 8 on the new treatmentregimen using the following model:
DLogðVLÞ ¼ b0 þ b1LogðVLBaselineÞ þ b2ðFCBaselineÞp
þ b3cPSSTotal þ b4PSSNRTI þ b5PSSPI
þ b6NRTI Naiveþ b7PI Naiveþ b8Naive
The model included terms for the intercept, baselineviral load (VLBaseline), baseline FC of the drug underinvestigation (FCBaseline), baseline phenotypic sensitivity scoreof the entire background regimen (cPSSTotal [number of activedrugs taken in addition to the drug under investigation]20,21),drug class–specific phenotypic sensitivity scores (PSSNRTI
and PSSPI), and terms for treatment history (treatment naive[Naive] and naive to NRTIs [NRTI_Naive] for NRTI modelsor PIs [PI_Naive] for PI models). A nonnucleoside reversetranscriptase inhibitor (NNRTI)–specific activity score was notincluded to avoid overparametrization, because the sum ofthe drug class–specific activity scores corresponds with thecPSSTotal. FC was transformed using a power transformation.Powers (p) ranging from 23 to 1 were evaluated in steps of0.1. The power resulting in the model with the lowest standarddeviation (SD) of the error term was used in the final model.
All the cutoffs were optimized simultaneously, andthe CCO estimates for one drug had an effect on the CCOestimates for the other drugs. Initially, the cPSSTotal wascalculated using the vT BCO,21 and a drug was consideredactive if the predicted FC was less than or equal to the BCO.When the first version of the CCO was available, the CCOestimates were used to calculated the cPSSTotal. Drugs wereconsidered to be fully active if the predicted FC was less thanor equal to the lower CCO, and they were considered to beinactive if the predicted FC was greater than the upper CCO. Ifthe predicted FC was between the CCO estimates, the activitywas determined using linear interpolation, as describedelsewhere.20,21 Analyses were iterated with subsequent CCOestimates until CCO estimates remained stable. A standardARV dose was assumed if this information was missing. RTVdoses up to 800 mg/d were considered ‘‘boosting’’ doses,whereas doses $800 mg/d were considered fully active.Additional parameters (number of active NRTIs or PIs taken inthe background and treatment history parameters) wereselected by backward elimination at a 5% significance level.
Statistical models for the NNRTIs were not pursued forNNRTI CCO determination, because the utility of NNRTICCOs remains questionable at this time.
Definition of Clinical CutoffsUsing the treatment response models, the impact of
baseline viral resistance to individual drugs on overall regimen
q 2008 Lippincott Williams & Wilkins 27
J Acquir Immune Defic Syndr � Volume 48, Number 1, May 1, 2008 Clinical Cutoffs and Predicted Phenotypic Resistance
Copyright © 2008 Lippincott Williams & Wilkins. Unauthorized reproduction of this article is prohibited.
response (defined as the change in viral load 8 weeks afterinitiating the new regimen) was assessed. The difference inpredicted response between a wild-type susceptible virus strainand a fully resistant strain (defined as percentile 97.5 of thevT linear model–predicted FC values among .200,000genotypes of clinical isolates) was taken as a measure of theeffect of a single drug. Phenotypic resistance levels (FC)associated with 20% and 80% losses of this single drug effectwere determined and defined as lower (CCO1) and upper(CCO2) CCOs. The variability of the proposed CCOs wasassessed by bootstrapping based on 1000 repeats, and 95%confidence intervals were determined.
Model Performance and Validationof Clinical Cutoffs
A global performance comparison between the newlydefined vT CCOs and previously used BCOs was made bytesting the association of the cPSS of the entire regimen andresponse using 3 metrics. Area under the receiver-operatorcharacteristic curve (as a measure for diagnostic accuracy) andodds ratios per unit increase in cPSS unit were used to expressthe association between cPSS and response rate. The Pearsoncorrelation coefficient was used to assess the correlationbetween the cPSS and viral load drop. This analysis wasconducted on the data set used for CCO development and onthe ‘‘unseen’’ validation data set.
To illustrate the relevance of resistance classes as deter-mined by CCOs and compare them with resistance classesdefined by BCOs, the response rate and the median viral loaddrop per resistance class and per drug were determined. A‘‘responder’’ at week 8 was defined as achieving a drop of atleast 1 log compared with baseline at week 8 or an undetec-table viral load at week 8. A responder at week 24 was definedas an individual with a drop of 1 log compared with baseline atweek 24 or an undetectable viral load at week 24. Dropoutswere considered as nonresponders in the week 24 analysis.
RESULTS
Description of the Analysis Data SetThe development data set contained 2596 treatment
change episodes in 2217 patients (Table 1). Most of thepatients were male (82%) and treatment experienced (88%).The median baseline CD4 cell count and viral load variedaround 200 cells/mL and 4.5 log10 copies/mL, respectively(Table 2). Most of the regimens consisted of at least 3 drugs(ranging from 93% in the ddI population to 100% in the TDFpopulation), and most patients took 1 or 2 active drugs inaddition to the drug for which CCOs were being defined (from47% in the boosted SQV population to 78% in the unboostedIDV population). Patients taking PIs tended to be moretreatment experienced, as shown in Table 2. There also seemedto be a difference within the NRTIs with the ABC, TDF,and ddI populations containing more treatment-experiencedindividuals. Baseline characteristics of individual drug datasets are shown in Table 2. The development data set included738 different drug combinations. The most common combi-nations included an NNRTI with 2 NRTIs (EFV + zidovudine[AZT] + lamivudine [3TC] [n = 115], EFV + stavudine [d4T] +
3TC [n = 127], NVP + d4T + 3TC [n = 166], and NVP +AZT + 3TC [n = 84]).
Approximately two thirds of the treatment regimen dataoriginated from the clinical cohort data sets, and the remainingrecords came from clinical trials.
The same limit of detection was not used in all studies;nevertheless, the proportion of regimens with censored 8-weekviral load values in each data set was moderate (ranging from18% [IDV/r] to 33% [amprenavir (APV)] of the values).
Predicted Virologic Response to NRTIs and PIsand Determination of Clinical Cutoffs
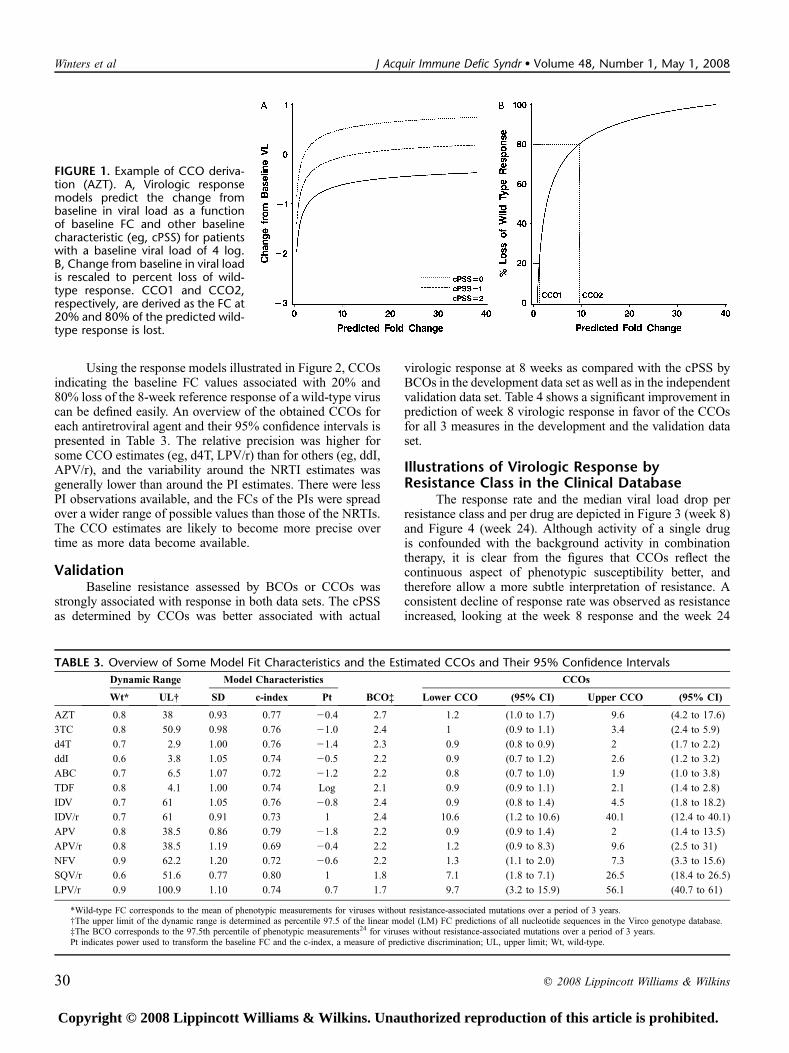
Figure 1A illustrates the predicted 8-week change inviral load from baseline for AZT-containing treatmentregimens as a function of baseline AZT FC for 3 differentcombinations of baseline characteristics as an example. Thelinear regression model predicts the greatest virologic re-sponse for patients whose virus is fully susceptible to AZT; theoverall response to the new AZT-containing treatment regimendecreases as baseline resistance to AZT increases. Overallpredicted regimen response also varies with other factors usedin the model (eg, cPSS, baseline viral load) in addition to thebaseline AZT FC; the response is reduced in patients whoseregimen included fewer active drugs in combination with AZT(background cPSS = 1 or 0) or higher baseline viral load. Nosignificant interaction effects were detected between baselineFC and other factors in the model with the current amountof available clinical data. Some model properties correlatingpredicted and observed viral load change (SD of the errorterm; power used to transform the baseline FC; and the c-index, a widely applicable measure of predictive discrimina-tion22) are presented in Table 3. We defined a wild-type or
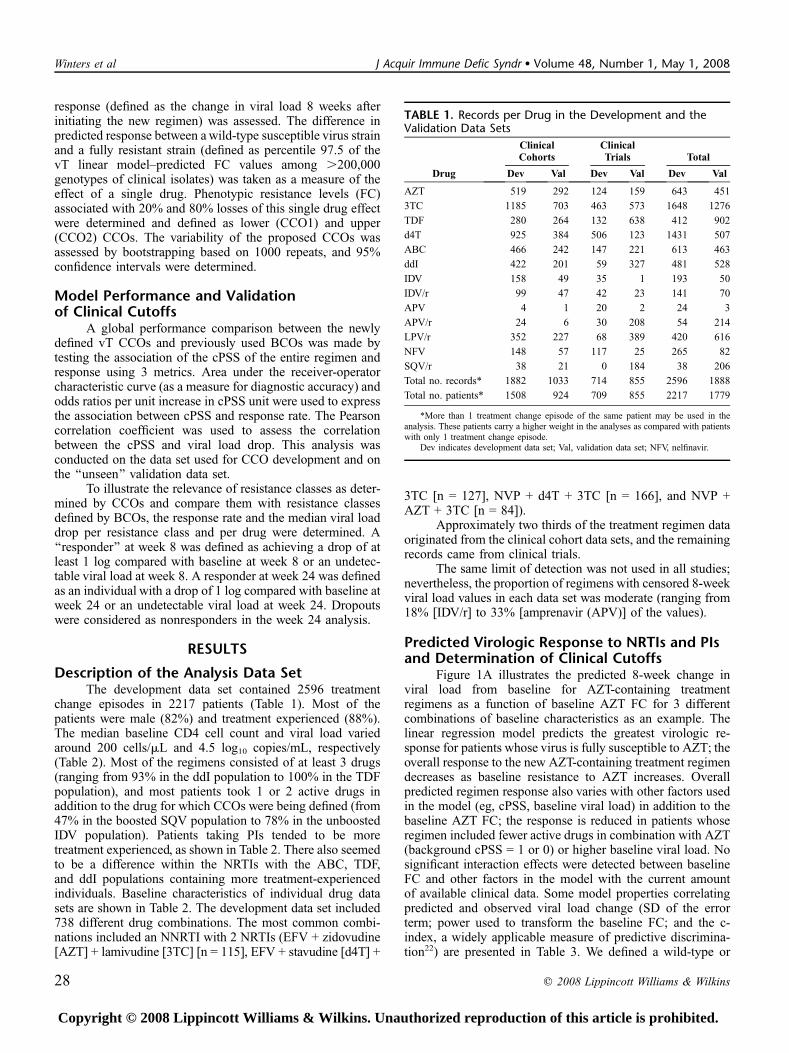
TABLE 1. Records per Drug in the Development and theValidation Data Sets
Drug
ClinicalCohorts
ClinicalTrials Total
Dev Val Dev Val Dev Val
AZT 519 292 124 159 643 451
3TC 1185 703 463 573 1648 1276
TDF 280 264 132 638 412 902
d4T 925 384 506 123 1431 507
ABC 466 242 147 221 613 463
ddI 422 201 59 327 481 528
IDV 158 49 35 1 193 50
IDV/r 99 47 42 23 141 70
APV 4 1 20 2 24 3
APV/r 24 6 30 208 54 214
LPV/r 352 227 68 389 420 616
NFV 148 57 117 25 265 82
SQV/r 38 21 0 184 38 206
Total no. records* 1882 1033 714 855 2596 1888
Total no. patients* 1508 924 709 855 2217 1779
*More than 1 treatment change episode of the same patient may be used in theanalysis. These patients carry a higher weight in the analyses as compared with patientswith only 1 treatment change episode.
Dev indicates development data set; Val, validation data set; NFV, nelfinavir.
28 q 2008 Lippincott Williams & Wilkins
Winters et al J Acquir Immune Defic Syndr � Volume 48, Number 1, May 1, 2008
Copyright © 2008 Lippincott Williams & Wilkins. Unauthorized reproduction of this article is prohibited.
reference response to AZT as the difference between theoverall regimen response predicted for a wild-type fully AZT-susceptible virus and the diminished regimen responsepredicted for a strain fully resistant to AZT for patients withidentical baseline characteristics. The shape of the responsecurve is determined by the transformation of the baseline FC,which is optimized on a drug-by-drug basis. These powertransformations are presented by drug in Table 3. In Figure 1B,the predicted response was expressed as a percentage of thereference response rather than as an absolute value. Impor-tantly, by comparing the response of a patient’s virus with theresponse of wild-type virus in a patient with identical baselinecharacteristics, we can normalize the responses of all patients.Although the absolute magnitude of the viral load responsevaries among patients with different baseline characteristics,the predicted percentage of a reference response is inde-pendent of these baseline characteristics.
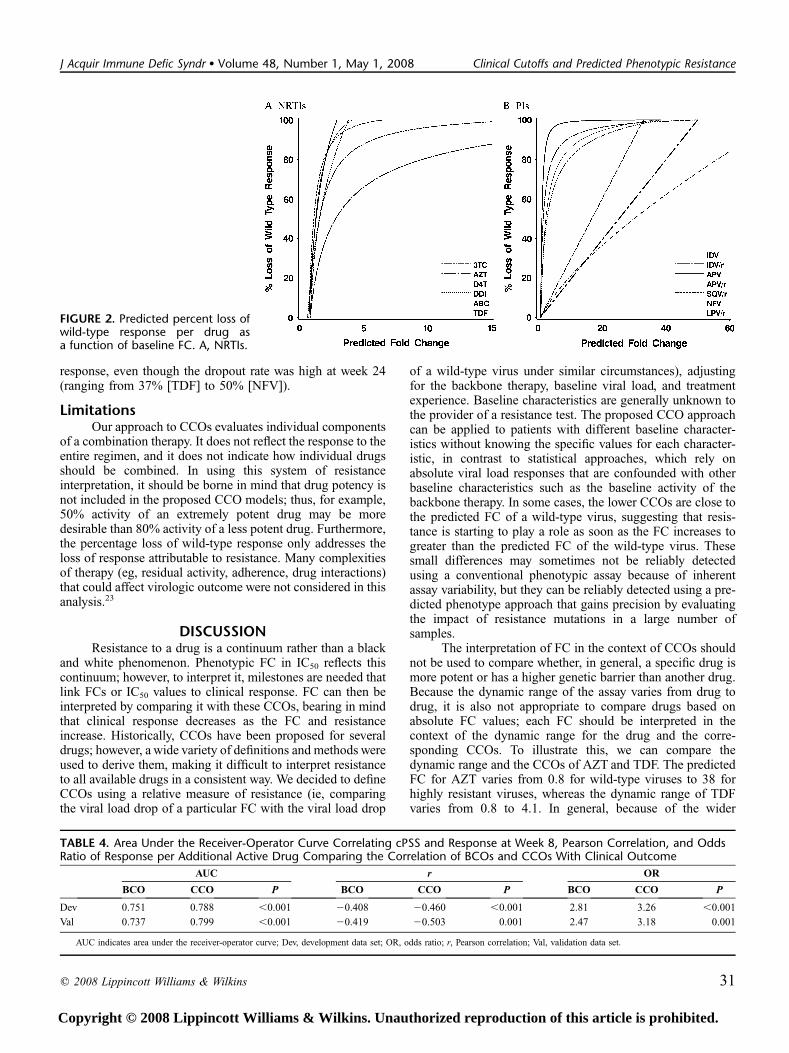
The predicted loss of virologic response as a function ofbaseline resistance is shown for NRTIs (Fig. 2A) and PIs (see
Fig. 2B). ARV activity of all NRTIs except AZT was rapidlylost as susceptibility decreased. For all NRTIs except AZT,the models predicted .80% loss of response within a 2-foldincrease in IC50 greater than the FC associated with a 20% lossof response. AZT, conversely, exhibited a much more gradualloss of ARV activity in response to decreasing susceptibilityand was predicted to retain approximately half of its activityeven after a 3-FC in IC50. For the PI class, all unboosted PIsrapidly lost ARV activity with increasing resistance levels,whereas PI/r exhibited more sustained activity despiteincreasing resistance. Lopinavir (LPV)/r, IDV/r, SQV/r, andAPV/r were predicted to retain approximately half of theirARV activity after a 30-fold, 25-fold, 17-fold, and 3-fold in-crease in IC50, respectively. Note that the predicted loss ofresponse at an identical FC differs from drug to drug. Fur-thermore, the graphs show substantial differences in dynamicrange within and between drug classes, with a wider dynamicrange for AZT, 3TC, and the PIs as compared with the otherNRTIs.
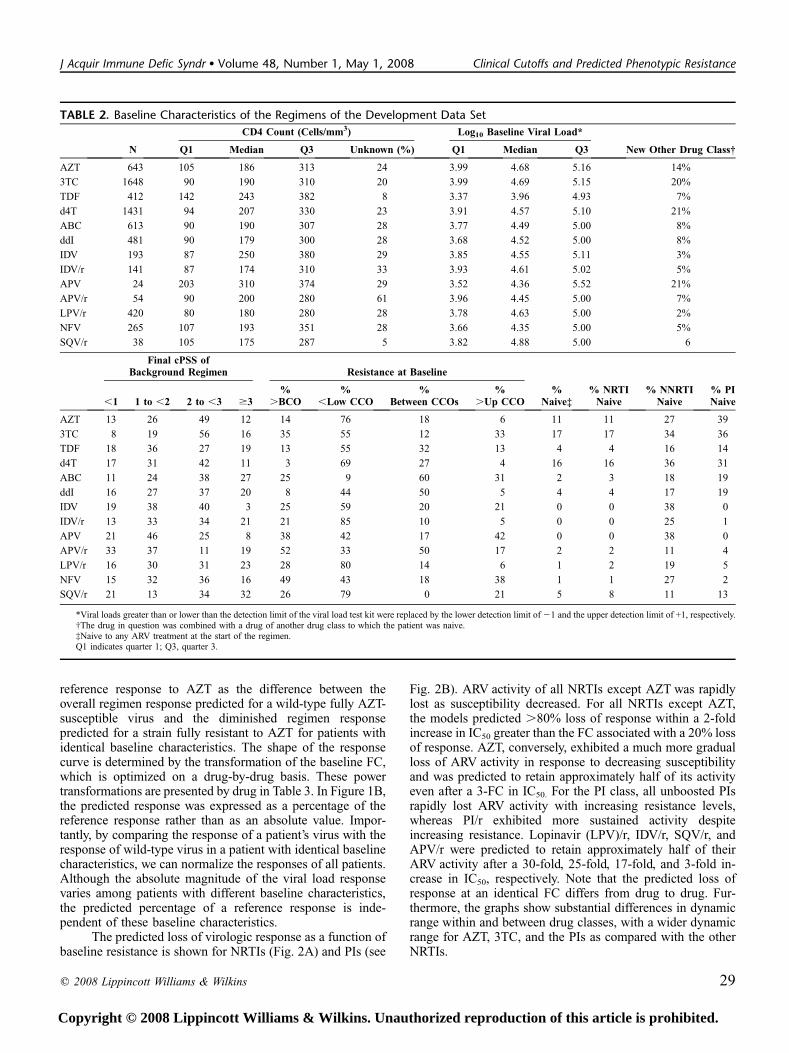
TABLE 2. Baseline Characteristics of the Regimens of the Development Data Set
N
CD4 Count (Cells/mm3) Log10 Baseline Viral Load*
Q1 Median Q3 Unknown (%) Q1 Median Q3 New Other Drug Class†
AZT 643 105 186 313 24 3.99 4.68 5.16 14%
3TC 1648 90 190 310 20 3.99 4.69 5.15 20%
TDF 412 142 243 382 8 3.37 3.96 4.93 7%
d4T 1431 94 207 330 23 3.91 4.57 5.10 21%
ABC 613 90 190 307 28 3.77 4.49 5.00 8%
ddI 481 90 179 300 28 3.68 4.52 5.00 8%
IDV 193 87 250 380 29 3.85 4.55 5.11 3%
IDV/r 141 87 174 310 33 3.93 4.61 5.02 5%
APV 24 203 310 374 29 3.52 4.36 5.52 21%
APV/r 54 90 200 280 61 3.96 4.45 5.00 7%
LPV/r 420 80 180 280 28 3.78 4.63 5.00 2%
NFV 265 107 193 351 28 3.66 4.35 5.00 5%
SQV/r 38 105 175 287 5 3.82 4.88 5.00 6
Final cPSS ofBackground Regimen Resistance at Baseline
% NRTINaive
% NNRTINaive
% PINaive,1 1 to ,2 2 to ,3 $3
%.BCO
%,Low CCO
%Between CCOs
%.Up CCO
%Naive‡
AZT 13 26 49 12 14 76 18 6 11 11 27 39
3TC 8 19 56 16 35 55 12 33 17 17 34 36
TDF 18 36 27 19 13 55 32 13 4 4 16 14
d4T 17 31 42 11 3 69 27 4 16 16 36 31
ABC 11 24 38 27 25 9 60 31 2 3 18 19
ddI 16 27 37 20 8 44 50 5 4 4 17 19
IDV 19 38 40 3 25 59 20 21 0 0 38 0
IDV/r 13 33 34 21 21 85 10 5 0 0 25 1
APV 21 46 25 8 38 42 17 42 0 0 38 0
APV/r 33 37 11 19 52 33 50 17 2 2 11 4
LPV/r 16 30 31 23 28 80 14 6 1 2 19 5
NFV 15 32 36 16 49 43 18 38 1 1 27 2
SQV/r 21 13 34 32 26 79 0 21 5 8 11 13
*Viral loads greater than or lower than the detection limit of the viral load test kit were replaced by the lower detection limit of 21 and the upper detection limit of +1, respectively.†The drug in question was combined with a drug of another drug class to which the patient was naive.‡Naive to any ARV treatment at the start of the regimen.Q1 indicates quarter 1; Q3, quarter 3.
q 2008 Lippincott Williams & Wilkins 29
J Acquir Immune Defic Syndr � Volume 48, Number 1, May 1, 2008 Clinical Cutoffs and Predicted Phenotypic Resistance
Copyright © 2008 Lippincott Williams & Wilkins. Unauthorized reproduction of this article is prohibited.
Using the response models illustrated in Figure 2, CCOsindicating the baseline FC values associated with 20% and80% loss of the 8-week reference response of a wild-type viruscan be defined easily. An overview of the obtained CCOs foreach antiretroviral agent and their 95% confidence intervals ispresented in Table 3. The relative precision was higher forsome CCO estimates (eg, d4T, LPV/r) than for others (eg, ddI,APV/r), and the variability around the NRTI estimates wasgenerally lower than around the PI estimates. There were lessPI observations available, and the FCs of the PIs were spreadover a wider range of possible values than those of the NRTIs.The CCO estimates are likely to become more precise overtime as more data become available.
ValidationBaseline resistance assessed by BCOs or CCOs was
strongly associated with response in both data sets. The cPSSas determined by CCOs was better associated with actual
virologic response at 8 weeks as compared with the cPSS byBCOs in the development data set as well as in the independentvalidation data set. Table 4 shows a significant improvement inprediction of week 8 virologic response in favor of the CCOsfor all 3 measures in the development and the validation dataset.
Illustrations of Virologic Response byResistance Class in the Clinical Database
The response rate and the median viral load drop perresistance class and per drug are depicted in Figure 3 (week 8)and Figure 4 (week 24). Although activity of a single drugis confounded with the background activity in combinationtherapy, it is clear from the figures that CCOs reflect thecontinuous aspect of phenotypic susceptibility better, andtherefore allow a more subtle interpretation of resistance. Aconsistent decline of response rate was observed as resistanceincreased, looking at the week 8 response and the week 24
TABLE 3. Overview of Some Model Fit Characteristics and the Estimated CCOs and Their 95% Confidence Intervals
Dynamic Range Model Characteristics CCOs
Wt* UL† SD c-index Pt BCO‡ Lower CCO (95% CI) Upper CCO (95% CI)
AZT 0.8 38 0.93 0.77 20.4 2.7 1.2 (1.0 to 1.7) 9.6 (4.2 to 17.6)
3TC 0.8 50.9 0.98 0.76 21.0 2.4 1 (0.9 to 1.1) 3.4 (2.4 to 5.9)
d4T 0.7 2.9 1.00 0.76 21.4 2.3 0.9 (0.8 to 0.9) 2 (1.7 to 2.2)
ddI 0.6 3.8 1.05 0.74 20.5 2.2 0.9 (0.7 to 1.2) 2.6 (1.2 to 3.2)
ABC 0.7 6.5 1.07 0.72 21.2 2.2 0.8 (0.7 to 1.0) 1.9 (1.0 to 3.8)
TDF 0.8 4.1 1.00 0.74 Log 2.1 0.9 (0.9 to 1.1) 2.1 (1.4 to 2.8)
IDV 0.7 61 1.05 0.76 20.8 2.4 0.9 (0.8 to 1.4) 4.5 (1.8 to 18.2)
IDV/r 0.7 61 0.91 0.73 1 2.4 10.6 (1.2 to 10.6) 40.1 (12.4 to 40.1)
APV 0.8 38.5 0.86 0.79 21.8 2.2 0.9 (0.9 to 1.4) 2 (1.4 to 13.5)
APV/r 0.8 38.5 1.19 0.69 20.4 2.2 1.2 (0.9 to 8.3) 9.6 (2.5 to 31)
NFV 0.9 62.2 1.20 0.72 20.6 2.2 1.3 (1.1 to 2.0) 7.3 (3.3 to 15.6)
SQV/r 0.6 51.6 0.77 0.80 1 1.8 7.1 (1.8 to 7.1) 26.5 (18.4 to 26.5)
LPV/r 0.9 100.9 1.10 0.74 0.7 1.7 9.7 (3.2 to 15.9) 56.1 (40.7 to 61)
*Wild-type FC corresponds to the mean of phenotypic measurements for viruses without resistance-associated mutations over a period of 3 years.†The upper limit of the dynamic range is determined as percentile 97.5 of the linear model (LM) FC predictions of all nucleotide sequences in the Virco genotype database.‡The BCO corresponds to the 97.5th percentile of phenotypic measurements24 for viruses without resistance-associated mutations over a period of 3 years.Pt indicates power used to transform the baseline FC and the c-index, a measure of predictive discrimination; UL, upper limit; Wt, wild-type.
FIGURE 1. Example of CCO deriva-tion (AZT). A, Virologic responsemodels predict the change frombaseline in viral load as a functionof baseline FC and other baselinecharacteristic (eg, cPSS) for patientswith a baseline viral load of 4 log.B, Change from baseline in viral loadis rescaled to percent loss of wild-type response. CCO1 and CCO2,respectively, are derived as the FC at20% and 80% of the predicted wild-type response is lost.
30 q 2008 Lippincott Williams & Wilkins
Winters et al J Acquir Immune Defic Syndr � Volume 48, Number 1, May 1, 2008
Copyright © 2008 Lippincott Williams & Wilkins. Unauthorized reproduction of this article is prohibited.
response, even though the dropout rate was high at week 24(ranging from 37% [TDF] to 50% [NFV]).
LimitationsOur approach to CCOs evaluates individual components
of a combination therapy. It does not reflect the response to theentire regimen, and it does not indicate how individual drugsshould be combined. In using this system of resistanceinterpretation, it should be borne in mind that drug potency isnot included in the proposed CCO models; thus, for example,50% activity of an extremely potent drug may be moredesirable than 80% activity of a less potent drug. Furthermore,the percentage loss of wild-type response only addresses theloss of response attributable to resistance. Many complexitiesof therapy (eg, residual activity, adherence, drug interactions)that could affect virologic outcome were not considered in thisanalysis.23
DISCUSSIONResistance to a drug is a continuum rather than a black
and white phenomenon. Phenotypic FC in IC50 reflects thiscontinuum; however, to interpret it, milestones are needed thatlink FCs or IC50 values to clinical response. FC can then beinterpreted by comparing it with these CCOs, bearing in mindthat clinical response decreases as the FC and resistanceincrease. Historically, CCOs have been proposed for severaldrugs; however, a wide variety of definitions and methods wereused to derive them, making it difficult to interpret resistanceto all available drugs in a consistent way. We decided to defineCCOs using a relative measure of resistance (ie, comparingthe viral load drop of a particular FC with the viral load drop
of a wild-type virus under similar circumstances), adjustingfor the backbone therapy, baseline viral load, and treatmentexperience. Baseline characteristics are generally unknown tothe provider of a resistance test. The proposed CCO approachcan be applied to patients with different baseline character-istics without knowing the specific values for each character-istic, in contrast to statistical approaches, which rely onabsolute viral load responses that are confounded with otherbaseline characteristics such as the baseline activity of thebackbone therapy. In some cases, the lower CCOs are close tothe predicted FC of a wild-type virus, suggesting that resis-tance is starting to play a role as soon as the FC increases togreater than the predicted FC of the wild-type virus. Thesesmall differences may sometimes not be reliably detectedusing a conventional phenotypic assay because of inherentassay variability, but they can be reliably detected using a pre-dicted phenotype approach that gains precision by evaluatingthe impact of resistance mutations in a large number ofsamples.
The interpretation of FC in the context of CCOs shouldnot be used to compare whether, in general, a specific drug ismore potent or has a higher genetic barrier than another drug.Because the dynamic range of the assay varies from drug todrug, it is also not appropriate to compare drugs based onabsolute FC values; each FC should be interpreted in thecontext of the dynamic range for the drug and the corre-sponding CCOs. To illustrate this, we can compare thedynamic range and the CCOs of AZT and TDF. The predictedFC for AZT varies from 0.8 for wild-type viruses to 38 forhighly resistant viruses, whereas the dynamic range of TDFvaries from 0.8 to 4.1. In general, because of the wider
FIGURE 2. Predicted percent loss ofwild-type response per drug asa function of baseline FC. A, NRTIs.
TABLE 4. Area Under the Receiver-Operator Curve Correlating cPSS and Response at Week 8, Pearson Correlation, and OddsRatio of Response per Additional Active Drug Comparing the Correlation of BCOs and CCOs With Clinical Outcome
AUC r OR
BCO CCO P BCO CCO P BCO CCO P
Dev 0.751 0.788 ,0.001 20.408 20.460 ,0.001 2.81 3.26 ,0.001
Val 0.737 0.799 ,0.001 20.419 20.503 0.001 2.47 3.18 0.001
AUC indicates area under the receiver-operator curve; Dev, development data set; OR, odds ratio; r, Pearson correlation; Val, validation data set.
q 2008 Lippincott Williams & Wilkins 31
J Acquir Immune Defic Syndr � Volume 48, Number 1, May 1, 2008 Clinical Cutoffs and Predicted Phenotypic Resistance
Copyright © 2008 Lippincott Williams & Wilkins. Unauthorized reproduction of this article is prohibited.
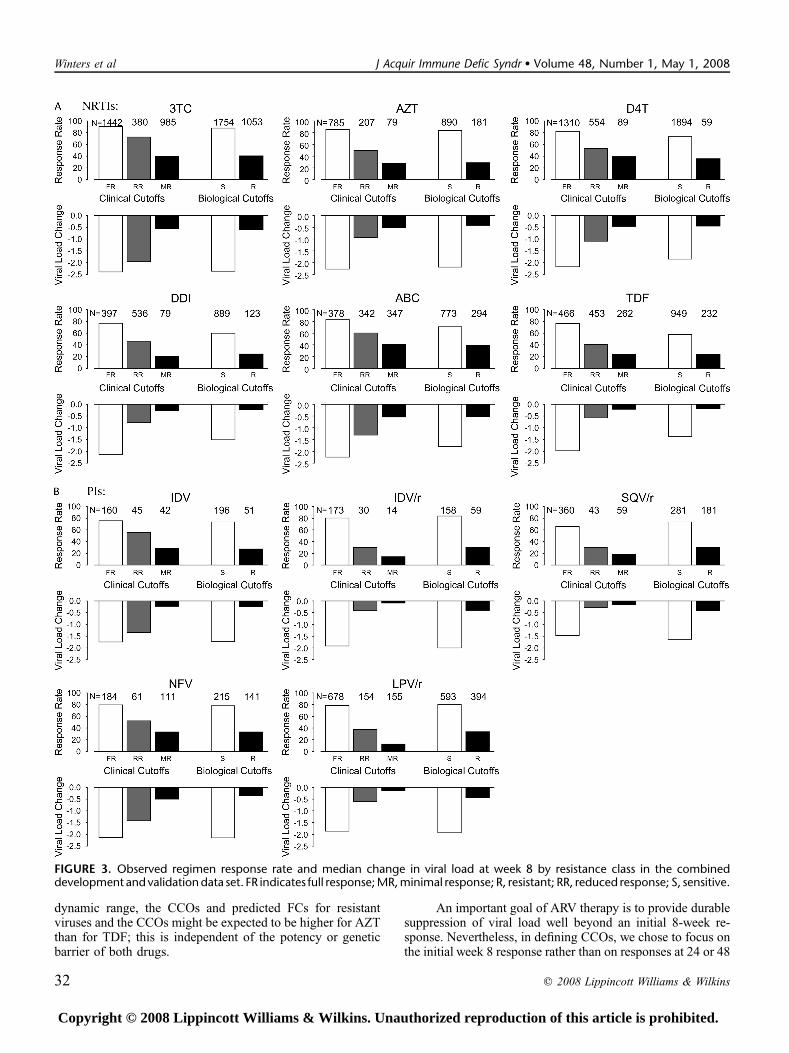
dynamic range, the CCOs and predicted FCs for resistantviruses and the CCOs might be expected to be higher for AZTthan for TDF; this is independent of the potency or geneticbarrier of both drugs.
An important goal of ARV therapy is to provide durablesuppression of viral load well beyond an initial 8-week re-sponse. Nevertheless, in defining CCOs, we chose to focus onthe initial week 8 response rather than on responses at 24 or 48
FIGURE 3. Observed regimen response rate and median change in viral load at week 8 by resistance class in the combineddevelopment and validation data set. FR indicates full response; MR, minimal response; R, resistant; RR, reduced response; S, sensitive.
32 q 2008 Lippincott Williams & Wilkins
Winters et al J Acquir Immune Defic Syndr � Volume 48, Number 1, May 1, 2008
Copyright © 2008 Lippincott Williams & Wilkins. Unauthorized reproduction of this article is prohibited.
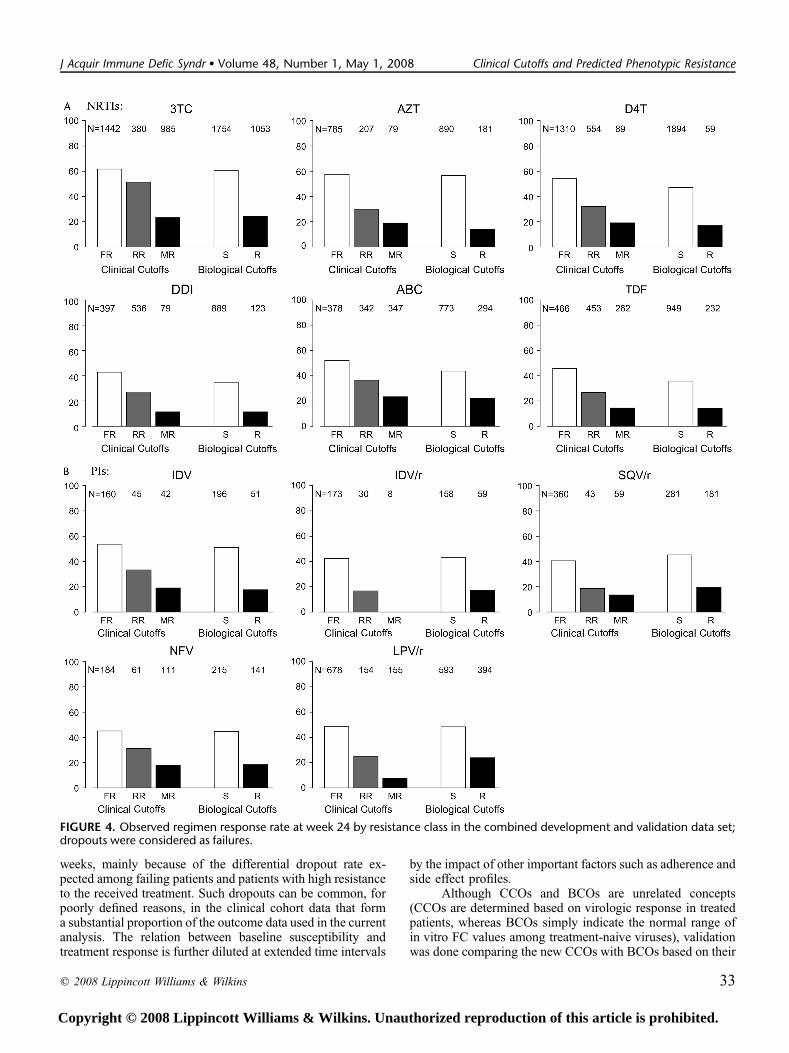
weeks, mainly because of the differential dropout rate ex-pected among failing patients and patients with high resistanceto the received treatment. Such dropouts can be common, forpoorly defined reasons, in the clinical cohort data that forma substantial proportion of the outcome data used in the currentanalysis. The relation between baseline susceptibility andtreatment response is further diluted at extended time intervals
by the impact of other important factors such as adherence andside effect profiles.
Although CCOs and BCOs are unrelated concepts(CCOs are determined based on virologic response in treatedpatients, whereas BCOs simply indicate the normal range ofin vitro FC values among treatment-naive viruses), validationwas done comparing the new CCOs with BCOs based on their
FIGURE 4. Observed regimen response rate at week 24 by resistance class in the combined development and validation data set;dropouts were considered as failures.
q 2008 Lippincott Williams & Wilkins 33
J Acquir Immune Defic Syndr � Volume 48, Number 1, May 1, 2008 Clinical Cutoffs and Predicted Phenotypic Resistance
Copyright © 2008 Lippincott Williams & Wilkins. Unauthorized reproduction of this article is prohibited.
correlation with virologic outcome. It was demonstrated thatan interpretation using CCOs is better correlated with clinicaloutcome than an interpretation using BCOs. CCOs give theinterpreter of the resistance test a better idea of the responsecontinuum, and this enables the selection of drugs that retaina substantial degree of activity, making the CCOs an importanttool, especially in those patients with limited treatment options.
CCOs were not derived for all available drugs. Theclinical database did not contain enough observations for someolder drugs that are rarely used today, such as zalcitabine (ddC)and RTV. In the case of some newer drugs (atanavir [ATV]/r,fosamprenavir [FPV]/r, tipranavir [TPV]/r, and darunavir[DRV/r]), derivation of the CCOs has depended more heavilyon outcome data from phase 2 and phase 3 trials, incollaboration with the various pharmaceutic sponsors de-veloping these drugs. Use of data from these select patientpopulations presents additional issues requiring specificattention and discussion of the drawbacks and possiblesolutions, which are to be addressed in future articles.
These proposed CCOs should be refined and validatedon an ongoing basis, not only by gathering more clinical datato ensure broad applicability but to take new therapeutic strat-egies into account. Finally, an in-depth analysis of the treat-ment effect over time should give better insight into thedurability of the regimen selected based on a resistance testat baseline. The CCO values determined here should not beextrapolated to other phenotypic tests, because each assay hasits specific properties that may affect the CCO values.
In summary, the CCOs presented here were determinedin a uniform way using a heterogeneous patient populationtaking a wide range of ARV regimens. As such, we believethey are broadly applicable for use in clinical practice. Theyare likely to increase the value of genotypic HIV drug resis-tance testing using the vT approach. The CCOs described herehave been implemented in the vT resistance analysis.
ACKNOWLEDGMENTSThe authors thank the Virco Clinical Cutoff Project
Team, including Alen Philippe, Tuohy Martin, VanpachtenbekeMarc, and Villacian Jorge, for many helpful discussions andgathering the clinical data sets used to develop the CCOs.They also thank Brian Wasikowski and Matthew McGregorfor remapping the clinical data sets. They thank the DiagnosticLaboratory Operations team at Virco, under the supervision ofPaula McKenna, Gaetan Muyldermans, and Theresa Pattery,for the genotypic and phenotypic testing.
REFERENCES1. Hertogs K, de Bethune MP, Miller V, et al. A rapid method for
simultaneous detection of phenotypic resistance to inhibitors of proteaseand reverse transcriptase in recombinant human immunodeficiency virustype 1 isolates from patients treated with antiretroviral drugs. AntimicrobAgents Chemother. 1998;42:269–276.
2. Petropoulos CJ, Parkin NT, Limoli KL, et al. A novel phenotypic drugsusceptibility assay for human immunodeficiency virus type 1. AntimicrobAgents Chemother. 2000;44:920–928.
3. Harrigan PR, Montaner JS, Wegner SA, et al. World-wide variation inHIV-1 phenotypic susceptibility in untreated individuals: biologicallyrelevant values for resistance testing. AIDS. 2001;15:1671–1677.
4. Parkin NT, Hellmann NS, Whitcomb JM, et al. Natural variation of drugsusceptibility in wild-type human immunodeficiency virus type 1.Antimicrob Agents Chemother. 2004;48:437–443.
5. Miller MD, Margot N, Lu B, et al. Genotypic and phenotypic predictors ofthe magnitude of response to tenofovir disoproxil fumarate treatment inantiretroviral-experienced patients. J Infect Dis. 2004;189:837–846.
6. Servais J, Plesseria JM, Lambert C, et al. Longitudinal use of phenotypicresistance testing to HIV-1 protease inhibitors in patients developingHAART failure. J Med Virol. 2002;67:312–319.
7. Lanier ER, Ait-Khaled M, Scott J, et al. Antiviral efficacy of abacavir inantiretroviral therapy-experienced adults harbouring HIV-1 with specificpatterns of resistance to nucleoside reverse transcriptase inhibitors. AntivirTher. 2004;9:37–45.
8. Brun-Vezinet F, Costagliola D, Khaled MA, et al. Clinically validatedgenotype analysis: guiding principles and statistical concerns. AntivirTher. 2004;9:465–478.
9. van Leth F, Phanuphak P, Ruxrungtham K, et al. Comparison of first-lineantiretroviral therapy with regimens including nevirapine, efavirenz, orboth drugs, plus stavudine and lamivudine: a randomised open-label trial,the 2NN Study. Lancet. 2004;363:1253–1263.
10. Hales G, Birch C, Crowe S, et al. A randomised trial comparing genotypicand virtual phenotypic interpretation of HIV drug resistance: the CRESTstudy. PLoS Clin Trials. 2006;1:e18.
11. Winston A, Hales G, Amin J, et al. The normalized inhibitory quotient ofboosted protease inhibitors is predictive of viral load response in treatment-experienced HIV-1-infected individuals. AIDS. 2005;19:1393–1399.
12. Cohen CJ, Hunt S, Sension M, et al. A randomized trial assessing theimpact of phenotypic resistance testing on antiretroviral therapy. AIDS.2002;16:579–588.
13. Baxter JD, Mayers DL, Wentworth DN, et al. A randomized study ofantiretroviral management based on plasma genotypic antiretroviralresistance testing in patients failing therapy. CPCRA 046 Study Team forthe Terry Beirn Community Programs for Clinical Research on AIDS.AIDS. 2000;14:F83–F93.
14. Melnick D, Rosenthal J, Cameron M, et al. Impact of phenotypicantiretroviral drug resistance testing on the response to salvageantiretroviral therapy (ART) in heavily experienced patients. Presentedat the 7th Conference on Retroviruses and Opportunistic Infections[abstract 786], San Francisco, 2000.
15. Wegner SA, Wallace MR, Aronson NE, et al. Long-term efficacy ofroutine access to antiretroviral-resistance testing in HIV type 1-infectedpatients: results of the clinical efficacy of resistance testing trial. ClinInfect Dis. 2004;38:723–730.
16. Castor DV, Berkman A, Wu Y, et al. Genotypic sensitivity score predictsHIV viral suppression among treatment experienced patients withadvanced HIV disease receiving modified DOI. Int Conf AIDS. 2004;15:WePeB5751.
17. Vermeiren H, Van Craenenbroeck E, Alen P, et al. Prediction of HIV-1drug susceptibility phenotype from the viral genotype using linearregression modeling. J Virol Methods. 2007;145:47–55.
18. Neter J, Wasserman W, Kutner MH. Applied Linear Statistical Models:Regression, Analysis of Variance, and Experimental Designs. 3rd ed.Homewood, IL: Irwin; 1990.
19. Hughes MD. Analysis and design issues for studies using censoredbiomarker measurements with an example of viral load measurements inHIV clinical trials. Stat Med. 2000;19:3171–3191.
20. Katzenstein DA, Bosch RJ, Hellmann N, et al. Phenotypic susceptibilityand virological outcome in nucleoside-experienced patients receivingthree or four antiretroviral drugs. AIDS. 2003;17:821–830.
21. Swanstrom R, Bosch RJ, Katzenstein D, et al. Weighted phenotypicsusceptibility scores are predictive of the HIV-1 RNA response in proteaseinhibitor-experienced HIV-1-infected subjects. J Infect Dis. 2004;190:886–893.
22. Harrell FE Jr, Lee KL, Mark DB. Multivariable prognostic models:issues in developing models, evaluating assumptions and adequacy,and measuring and reducing errors. Stat Med. 1996;15:361–387.
23. Castagna A, Danise A, Menzo S, et al. Lamivudine monotherapy in HIV-1-infected patients harbouring a lamivudine-resistant virus: a randomizedpilot study (E-184V study). AIDS. 2006;20:795–803.
24. Verlinden Y, Vermeiren H, Lecocq P, et al. Assessment of theAntivirogram� performance over time including a revised definition ofbiological test cut-off values. Antivir Ther. 2005;10:S51.
34 q 2008 Lippincott Williams & Wilkins
Winters et al J Acquir Immune Defic Syndr � Volume 48, Number 1, May 1, 2008
Copyright © 2008 Lippincott Williams & Wilkins. Unauthorized reproduction of this article is prohibited.