Embed Size (px)
Citation preview

Time Allocation across the Lifespan 1
Received August 4, 2004; accepted October 8, 2004; final version received December 23, 2004.
Address all correspondence to Michael Gurven, Department of Anthropology, University of Cali-fornia, Santa Barbara, Santa Barbara, CA 93106. Email: [email protected], [email protected]
Human Nature, Spring 2006, Vol. 17, No. 1, pp. 1–49. 1045-6767/98/$6.00 = .15
Determinants of Time Allocationacross the Lifespan
A Theoretical Model and an Application to theMachiguenga and Piro of Peru
Michael GurvenUniversity of California, Santa Barbara
Hillard KaplanUniversity of New Mexico
This paper lays the groundwork for a theory of time allocation across the life course,based on the idea that strength and skill vary as a function of age, and that returnrates for different activities vary as a function of the combination of strength andskills involved in performing those tasks. We apply the model to traditional humansubsistence patterns. The model predicts that young children engage most heavily inlow-strength/low-skill activities, middle-aged adults in high-strength/high-skill ac-tivities, and older adults in low-strength/high-skill activities. Tests amongMachiguenga and Piro forager-horticulturalists of southeastern Peru show that malesand females focus on low-strength/low-skill tasks early in life (domestic tasks andseveral forms of fishing), switch to higher-strength/higher-skill activities in theirtwenties and thirties (hunting, fishing, and gardening for males; fishing and garden-ing for females), and shift focus to high-skill activities late in life (manufacture/repair, food processing).
KEY WORDS: Behavioral ecology; Family; Hunter-gatherers; Life history theory;Time allocation
The allocation of time to alternative activities is a topic that has interested scholars in many different disciplines, such as anthropology, economics, sociology,
psychology, and biology. The reason for this interest is that time allocation deci-sions are fundamental components of life strategies: time is used to accomplish
001-Gurven/Kaplan 2/27/06, 4:54 PM1

2 Human Nature / Spring 2006
goals, and alternative time profiles may be associated with very different outcomesamong both human and nonhuman organisms. Time spent foraging for food resultsin energy capture but often incurs high risks of mortality owing to predation andaccidents. Time spent caring for infants may increase their chances of survival butmay also decrease energy available for promoting their growth (Hurtado et al. 1985,1992).
The critical feature of time allocation decisions is that they involve trade-offs inwhich the benefits generated (e.g., food energy, infant safety) are balanced by bothdirect costs (e.g., energy expended, risk of predation) and opportunity costs (Hames1992). Opportunity costs derive from the fact that time is a limited resource, and asa result, time spent in one activity reduces time available for other activities. Thusthe total effects of time allocation decisions not only depend on the costs and ben-efits of time invested in single activities, but also on the forgone benefits of timespent in other activities. Since time allocation decisions may have direct impacts onan organism’s fitness, natural selection is likely to act on the psychological andphysiological mechanisms underlying time allocation decisions, especially regard-ing activities geared towards obtaining food resources, finding mates, provisioningoffspring, forming and maintaining alliances, and defending against predators(Hames 1992).
A second critical domain of an organism’s life strategy that involves time is thetiming of life events. The field of life history theory in biology was developed toexplain the timing of life events, with a particular focus on age-schedules of fertil-ity and mortality (Charnov 1993; Roff 1992; Stearns 1992). Components of anorganism’s life history include gestation length prior to birth, the growth rates ofdifferent organs before birth, the length and rate of growth after birth, risks of mor-tality at each age prior to and after birth, age of first reproduction, reproductive rateand litter size, energy and time invested in each offspring, the timing and effortallocated to intra-sexual competitive behavior, rates of senescence for different or-gan systems, and increases in mortality rates with age during the adult period.
Compared with their closest primate relatives, humans display some very dis-tinctive life history characteristics (Blurton Jones and Marlowe 2002; Bock andSellen 2002; Kaplan 1997; Kaplan et al. 2000; Tooby and DeVore 1987). Theirbrains grow much faster, and for a much longer period of time after birth. Follow-ing infancy, they grow relatively slowly until their adolescent growth spurt, andthey grow for a longer period of time. Age of first reproduction is delayed and theexpected adult lifespan is significantly extended. Food is transferred not only fromparents to offspring, but often across three generations, with grandparents provid-ing food and other services for grandoffspring. In recent years, several new theoriesof human life history evolution have been presented in order to explain some or allof these life history characteristics. Two of those theories, sometimes referred to asthe Grandmother Hypothesis (e.g., Hawkes et al. 1998) and the Embodied CapitalTheory (e.g., Kaplan 1997) of life history evolution, are a central focus of thispaper because they generate a series of competing empirical predictions, particu-
001-Gurven/Kaplan 2/27/06, 4:54 PM2

Time Allocation across the Lifespan 3
larly with respect to relative importance of body size vs. learned skills in time allo-cation and life history decisions.
This paper has two goals. The first is to examine the relationship between timeallocation decisions and life history strategies and, in so doing, contribute to a grow-ing body of theory on time allocation and work effort across the life course. Thesecond is to apply that framework to explain time spent in alternative activities byindividuals living in traditional, small-scale societies and to evaluate empiricallythe alternative predictions of the life history theories mentioned above, with analy-sis of data from two native South American populations, the Machiguenga and Piroof southeastern Peru.
The paper begins with a brief review of existing cross-cultural research on timeallocation. This is followed by a discussion of the grandmother hypothesis andembodied capital theory. This discussion includes a detailed treatment of Bock’sextensions of embodied capital theory, since the formal theory we present and theempirical analyses build directly upon those insights. The theory section then out-lines the essential elements of Becker’s theory of time allocation (e.g., Becker 1991:chapters 1 and 2), upon which our model builds. It then develops the necessarymodifications of his theory for generating a life history approach to time allocationin traditional subsistence societies.
The second part of the paper presents the empirical application of the model. Itbegins with a brief introduction to the Machiguenga and Piro study populations,and a description of the methodology employed for data collection and analysis.The empirical results follow. Some questions addressed are: (a) Do the strength andskill requirements for different tasks determine which age and sex classes performthem most often? (b) At what ages do return rates and time allocated to given activi-ties peak? (c) What factors influence rates of ascent to the peak and rates of declinefrom the peak? (d) What is the relationship between changes in time investment inactivities and rates of return from engaging in those activities? The paper concludeswith a discussion of the results and their implications for the evaluation of the twoalternative life history theories.
TIME ALLOCATION RESEARCH
There is a great deal of descriptive anthropological data on time allocation in differ-ent cultures, especially for specific age and/or sex classes of individuals (e.g., Draper1975; Hames 1989, 1992; Johnson 1975; Munroe et al. 1983; see also the HRAFTime Allocation series). There have also been several attempts to explain time allo-cation decisions within or among cultures. Many of these studies focus on environ-mental or ecological change and its impacts on time allocation (e.g., Hames 1979;Hurtado and Hill 1990; Kelly 1983; Kumar and Hotchkiss 1988; Tiefanthaler 1997).For example, several studies focus on the impacts of technology on production,such as shotguns for improving hunting efficiency (Hames 1979; Kelly 1983) andsteel tools on horticultural efficiency (Hurtado and Hill 1990; Salisbury 1962).
001-Gurven/Kaplan 2/27/06, 4:55 PM3
4 Human Nature / Spring 2006
With respect to individual variation within cultures, there has been debate amonganthropologists regarding the impacts of efficiency on time allocation (Hames 1992;Hawkes et al. 1985; Smith 1987; Winterhalder 1983). According to one view, some-times referred to as resource maximization, increases in productivity in some activ-ity (mediated either by improvements in technology or by individual differences inability) should be associated with increased time allocated to that activity. Accord-ing to the view of time minimization, increased efficiency should reduce time allo-cation to that activity in favor of other activities. From economic theory, it is clearthat time minimization and resource maximization are not opposing strategies, sinceany problem can easily be transformed from profit maximization to cost minimiza-tion and vice versa. The critical issue depends on the shape of the gains curves ofthe focal activity and of other forgone activities, which cannot be determined fromtheoretical first principles (Smith 1987) and depend on both substitution and in-come effects. When trade exists or when social groups, such as households or bands,share the proceeds of work, the theory of comparative advantage predicts special-ization, with individuals specializing in the activity at which they are most efficient(Becker 1991: chapter 2). On the other hand, if the values of the commodities pro-duced by activities exhibit diminishing returns, specialization is limited by the ex-tent of the market (Becker 1991). For example, when shotguns increase huntingreturn rates for the whole group and meat is not traded, more meat may be con-sumed but less time may be allocated to hunting in favor of other activities.
Time allocation among children has also received considerable attention. Earlywork by Cain (1977) and Nag and colleagues (1977) showed that, among peasantfarmers, children over the age of 10 often work long hours. Those results were usedto argue that children in traditional, pre–demographic transition societies were neteconomic assets to parents (Cain 1981), and as a result, high fertility was an eco-nomically rational response of parents (Caldwell 1982). A series of recent studies,however, casts considerable doubt on this theory (Kaplan 1994; Kramer 2002). Al-though resources flow in both directions between generations, net flows are fromparents to offspring and from grandparents to grandoffspring (Kaplan 1994), aswould be expected by evolutionary models of parental investment (Turke 1991). Infact, in a large review of research conducted in a broad range of societies, Lee(1996) finds no evidence that the net flow of resources is from children to parents.1
Although, on average, children are not net economic assets to parents, there doesappear to be considerable cross-cultural variation in their contributions to subsis-tence work. Draper’s (1975) original analysis of children’s time allocation among!Kung (Ju/’hoansi) foragers in Botswana showed very low levels of productive workbefore age 15. Data on calories produced vs. calories consumed among Ache forag-ers and Machiguenga and Piro forager-horticulturalists in South America yieldedsimilar findings (Kaplan 1994). Those results contrast sharply with the findingsfrom research with peasant farmers, cited above. However, even among and withinforaging societies, there is considerable variation in children’s work effort. For ex-
001-Gurven/Kaplan 2/27/06, 4:55 PM4

Time Allocation across the Lifespan 5
ample, Hadza children in Tanzania, especially in certain seasons, produce a greatdeal more than !Kung children in bush camps do (Blurton Jones et al. 1994).
Three factors, taken together, appear to explain a significant proportion of thisvariation. One factor is the risks associated with foraging for young individuals(Blurton Jones et al. 1994; Janson and Van Schaik 1993). The dangers associatedwith children’s work effort vary socioecologically. For example, resources tendedto be located at considerable distance from camps among the !Kung, and parentsactively discouraged children from traveling outside of camp for fear that they wouldget lost and be attacked by animals. Among the Hadza, food resources were oftenlocated very close to camp, especially during fruit seasons when children wereespecially productive (Blurton Jones et al. 1994; Janson and Van Schaik 1993).
A second factor concerns the relative productivity of children’s labor. Subsis-tence labor in farming societies, for example, includes many chores, such as har-vesting, grain processing, and domestic animal care, that can be accomplished bychildren (Bock 2002a; Kramer 2002), whereas among foraging societies childrenare relatively less productive per time spent working in the acquisition of mostfoods. Seasonal variation in productivity within foraging societies also appears tobe explained by relative productivity. When fruits, which are relatively easy forchildren to forage, are in season, children among both the Ache and Hadza acquiremany more calories than when extracted foods, such as roots and palm fiber, are theprincipal plant food staples (Blurton Jones et al. 1994; Kaplan 1997).
A third factor concerns trade-offs between current and future productivity (Bock2002a, 2002b; Kaplan 1996; Kaplan and Robson 2002; Kaplan et al. 2000). Forexample, child labor laws exist in modern societies to ensure that children attendschool.2 School attendance increases future income, but it entails opportunity costsin terms of forgone income. Even in transitional and traditional societies, such trade-offs exist. Bock (2002b) shows that school attendance in transitional villages inBotswana, where children still engage in traditional subsistence labor, depends onfamilial labor needs, the availability of substitute laborers, and familial wealth.Moreover, children in traditional subsistence societies often engage in play (playhunting, play food processing, etc.) instead of actual, productive work. Presumablysuch play is safer and imparts more skills that will increase productivity in thefuture than would time spent in directly productive tasks (Bock 2002b; Caro 1988;Fagen 1981).
WO ALTERNATIVE MODELS OF THE HUMAN LIFE COURSE
While there is general agreement that socioecological variation explains much ofthis cross-cultural variation in children’s work, there is also considerable debateabout the underlying causes of age profiles of both work effort and productivityacross the lifespan. This debate grows out of alternative theoretical models of theevolution of the human life course, and particularly about the length of the child-
001-Gurven/Kaplan 2/27/06, 4:55 PM5

6 Human Nature / Spring 2006
hood period. In fact, a recent issue of this journal (2002, Vol. 13, No. 2) was dedi-cated to presenting those alternative models and to evaluating the existing evidencethat bears on the debate.
The Grandmother Hypothesis
According to the grandmother hypothesis, based on a mammalian model of lifehistory evolution developed by Charnov (1993), body size is the primary determin-ing factor in age profiles of productivity (Bird and Bliege Bird 2002; Bliege Birdand Bird 2002; Blurton Jones and Marlowe 2002; Hawkes 2003). The productivityof children is low in many small-scale subsistence societies because the exploita-tion of most resources consumed by foragers is strength-intensive, and human growthis particularly slow. The length of the juvenile period is determined by a trade-offbetween physical growth, which increases future productivity and hence reproduc-tive rates, and the probability of reaching adulthood when reproduction begins(Charnov 1993). Exogenous variation in mortality rates determines the nature ofthis trade-off. When mortality rates are low, additional time spent growing has asmall impact on the probability of reaching adulthood, and vice versa when mortal-ity rates are high. Therefore, all else being constant, the length of the juvenile pe-riod varies negatively with mortality rates during the late stage of juvenile growth(i.e., the stage after infancy and weaning when mortality rates are particularly high).
The human juvenile period is exceptionally long (18–20 years) because humanmortality rates are exceptionally low, even after controlling for overall body size.Proponents of the grandmother hypothesis also argue that in addition to extrinsicfactors that reduce human mortality rates, natural selection has acted to reducehuman mortality rates in response to the payoffs to grandmaternal investment(Blurton Jones and Marlowe 2002; Hawkes and Bliege Bird 2002; Hawkes et al.1998). Since extractive foraging is strength-intensive, and as a result, children arenot very productive, grandmothers can greatly assist their daughters in raising theiroffspring through their gathering activities. This increased ability to help generatedselection for older women’s ability to work hard, increased longevity, and furtherreductions in mortality rates, which, in turn, selected for an elongation of the juve-nile growth period.
Embodied Capital Theory
An alternative view emphasizes the brain, and the skill—and knowledge-inten-siveness of the human foraging niche. One specific proposal, which is further de-veloped in this paper, is the embodied capital theory of life history evolution (Bock2002a, 2002b; Kaplan and Robson 2002; Kaplan et al. 2000, 2003; Robson andKaplan 2003). According to this theoretical framework, organisms utilize time andenergy to invest in the production of alternative forms of somatic or embodiedcapital. In a physical sense, embodied capital is organized somatic tissue—muscles,
001-Gurven/Kaplan 2/27/06, 4:55 PM6

Time Allocation across the Lifespan 7
digestive organs, brains, etc. In a functional sense, embodied capital includes strength,speed, immune function, skill, knowledge, and other abilities. Since such stockstend to depreciate with time, allocations to maintenance can also be seen as invest-ments in embodied capital.
Investments in embodied capital, which impact future productivity and futuresurvival, trade off against allocations to current reproduction. The theory is that thedistinctive characteristics of human life histories are the result of selection for ex-treme investments in neural capital and the abilities to learn and process informa-tion that the neural capital supports. The shift among our hominid ancestors to alearning-intensive foraging strategy and a diet composed mainly of high-quality,difficult-to-acquire foods generates selection for an extension of the lifespan, in-creased brain size, and a longer developmental period. The theory argues that (a)high levels of knowledge, skill, coordination, and strength are required to exploitthe suite of high-quality, difficult-to-acquire resources humans consume; (b) theattainment of those abilities requires time and a significant commitment to devel-opment; (c) this extended learning phase during which productivity is low is com-pensated for by higher productivity during the adult period, with an intergenerationalflow of food from old to young; and (d) since productivity increases with age, thetime investment in skill acquisition and knowledge leads to selection for loweredmortality rates and greater longevity because the returns on the investments in de-velopment occur at older ages.3 Thus the proposal is that the long human lifespanco-evolved with the lengthening of the juvenile period, increased brain capacitiesfor information processing and storage, and intergenerational resource flows—allin response to, and as supports of, the dietary shift.
Extensions of Embodied Capital Theory to Time Allocation
In a series of papers, Bock (2002a, 2002b, 2004a, 2004b) along with Johnson(Bock and Johnson 2004; Johnson and Bock 2004) extended embodied capital theoryin two important ways, upon which the present analysis builds. First, those papersapply embodied capital theory to time allocation over the life course, with a spe-cific focus on childhood. Bock (1995, 2002a, 2002b) hypothesized that time allo-cation to activities should reflect differential skill and strength as a function of age,and labor substitution among family members. Given that both body size and expe-rience-based skills and knowledge change with age, families will be composed ofindividuals with different levels of growth—and experience-based capital. Sincedifferent tasks in household production require differing degrees of strength andskill, an efficient division of labor in families will allocate tasks so that less skilledand smaller individuals will perform tasks requiring the least skill and strength, andvice versa. He also hypothesized that, in addition to the efficient pattern of laborsubstitution across family members, children will engage in tasks that provide learn-ing experiences, first through play and later through learning by doing. Such timeallocation to learning is an investment in future production. These hypotheses were
001-Gurven/Kaplan 2/27/06, 4:55 PM7
8 Human Nature / Spring 2006
largely supported in his analysis of time allocation in a rural subsistence village inBotswana (Bock 2002a, 2002b; see also Bock and Johnson 2004 and Johnson andBock 2004 for comparative application of this approach to intervillage variationand to learning in baboons).
A second extension was to model the interplay of growth and experience (Bock2004b). He proposes a “punctuated development” model to account for both therate at which return rates for different activities change with age and changing pat-terns of time allocation with age. When bodies are small, they will be inefficient atperforming most tasks, so most skill acquisition will occur through play, which ismuch safer. However, as bodies become larger, there will be some immediate re-turns from actually performing the task, so skills can be most efficiently learnedthrough performance. It is at this point that time allocation to the task will increasedramatically and return rates will correspondingly climb rapidly as experience withthe task increases. This pattern will give rise to a punctuated pattern of develop-ment in which rates of return show periods of steep increase.
We build on both these insights in the formal model and in the empirical applica-tion. Our model extends this reasoning to time allocation across three generationsof family members, including older people whose strength, but not knowledge, hasdeclined with age. We also differ in one respect. We suggest that the punctuateddevelopment model is most applicable for activities requiring lesser amounts ofskill, and that highly skilled activities will exhibit a much longer period of increas-ing efficiency.
Alternative Implications of the Grandmother and Embodied Capital Theories
The two theories differ in two major ways. The first difference concerns thefactors that affect differences in productivity by age. The grandmother hypothesisassumes that the principal factor that differentiates adults and children is their rela-tive body size and the strength advantages that a larger body confers. In contrast,the embodied capital theory proposes that learning is key to the differences in pro-ductivity by age. In fact, it proposes that slow physical growth rates in humansresult from selection for energy conservation; children’s bodies do not grow to adultsize until their brains have learned enough to safely and efficiently harvest the dif-ficult-to-acquire resources that humans exploit. This is not to say that strength isirrelevant to productivity, but rather that it must be combined with knowledge inorder to be useful in the acquisition of many resources (Bock 2002a, 2002b).
The second difference concerns the relative roles of males and females in theenergetics of reproduction, and in the life history adaptation. According to the grand-mother hypothesis, it is primarily women who are involved in the care and provi-sioning of their biological offspring. Selection for lengthening the human lifespanoccurred because strong grandmothers could help their daughters raise offspring,who are dependent for some time. Although it is not explicitly stated, the modelseems to imply a shift from a combination of childcare and strength-intensive pro-
001-Gurven/Kaplan 2/27/06, 4:55 PM8
Time Allocation across the Lifespan 9
duction among reproductive-age women to a greater emphasis on production amongpostreproductive women. In that model, men hunt to display their quality as mates,but not to provision their own offspring. Any provisioning done by men is viewed asunnecessary for supporting the important human life history shifts discussed above.The model is therefore silent about life course changes in men’s time allocation andon the length of the adult lifespan among men. The embodied capital theory pro-poses that both men and women invest in skill-intensive activities that complementone another, with women investing in extractive foraging and childrearing skills,and men investing in hunting and activities that involve strength and knowledge.Selection on the lifespan favored increased longevity.
These differences between the two theories generate alternative predictions abouttime allocation over the life course. The next section develops the theoretical andempirical models that will be used to test those predictions.
THEORY
A Lifecourse Perspective on Time Allocation
Following Becker (1991), an optimality approach to time allocation begins withthe working assumption that individuals allocate their time so as to maximize util-ity (in the case of economic models) or fitness (in the case of biological models). Inboth economic and biological models, it is generally assumed that the gains fromsome or all activities have a nonlinear correlation with amount of time allocated tothem, such that at some point additional increments of time yield diminishing re-turns. As the payoffs from one activity diminish, allocation of time to some otheractivity is more profitable. The fundamental prediction is that at the optimal mix oftime spent at each activity, the marginal returns from time allocated to all activitieswill be equal. That is, the gains from an additional small increment of time spent ateach activity will be the same for all activities. If, given some time allocation strat-egy, there is an activity, j, that yields higher marginal gains than some other activity,k, then a net improvement could be derived from increasing time spent at j anddecreasing time spent in activity k. From an economic perspective, it is assumedthat rational individuals will continue this process until no further changes willyield a net increase in utility. At this optimum, marginal gains in utility, U, from allactivities (j) are equal:
∂U / ∂tj = ∂U / ∂tj…∂U / ∂tz [1]
The reasoning from evolutionary biology is somewhat more complicated. Whereaseconomic models assume rationality solely on the basis of its heuristic value, evo-lutionary models posit that natural selection has acted on time allocation decisionsthrough the underlying mechanisms that generate those decisions. Whatever thespecific nature of those mechanisms (e.g., foraging stimulated by hunger in re-sponse to some physiological state), variation in the specific design of those mecha-
001-Gurven/Kaplan 2/27/06, 4:55 PM9

10 Human Nature / Spring 2006
nisms is subject to selection. Those design features associated with the highest fit-ness become prevalent over time. This reasoning leads to the similar predictionthat, at the optimum, the marginal gains in fitness, W, from all activities are equal:
∂W / ∂tj = ∂W / ∂tj…∂W / ∂tz [2]
A life course perspective on time allocation adds a new dimension to the optimalityanalysis. Activities may be characterized in terms of both their immediate costs andbenefits and their impacts on future payoffs. It is often the case that current andfuture payoffs trade off against one another. Some activities, especially those in-volving learning-by-doing, skill development, and formal education, provide littleor no immediate benefits but increase rates of return to activities in the future.Other activities, especially those associated with danger, may provide immediatereturns but also entail a risk of mortality or morbidity that compromises futurepayoffs.
Becker (1991) provides a life course model of time allocation that explicitlyanalyzes some of those trade-offs. In this model, the optimal time allocation pro-gram maximizes utility over the life course through the consumption of commodi-ties. Lifetime utility is composed of a time series of consumption bundles ofcommodities. Commodities, such as children, health, and prestige, are produced bycombining goods with time. For example, wages may be used to purchase food,which, in turn, is combined with cooking and eating time to produce nutritionalstatus and culinary pleasure. Thus, we have U = U(Z11,…Z1n,…Zm1,…Zmn), whereZij is the consumption of the ith commodity at the jth age, and n is the length of life,which is treated as a given. At each age, time and goods are allocated to producingthe optimal mix of commodities to maximize utility.
At the same time, however, some time and goods may be allocated to invest-ments in human capital. Human capital is a set of attributes, such as skill, knowl-edge, and health status, that affect the return rates associated with activities. Becker’smodel, particularly tailored to modern economies, distinguishes two effects of hu-man capital, one that impacts wage rates and another that impacts household pro-duction (i.e., cooking, care of children, and other things done at home). Time spentin school, for example, provides no immediate material benefits, entails opportu-nity costs in terms of lost time in employed work, and may involve direct costs,such as tuition and fees. However, time allocated to schooling increases future wagerates and may also increase future returns to household production, especially withrespect to childrearing. Thus, three types of time may be distinguished: wage-re-lated employment, tw; household production, th; and human capital investments, tq.
The fundamental trade-off is between present and future productivity. Invest-ments in human capital increase future wages and the efficiency of time in thefuture but decrease current production. At the optimum, the marginal cost of anadditional unit of human capital investment must be equal to its future benefits.This means that the change in capital produced by an investment of time or energymultiplied by the effect of that capital on future production, summed over the life
001-Gurven/Kaplan 2/27/06, 4:55 PM10

Time Allocation across the Lifespan 11
course (discounted by the interest rate), must equal the present costs of investments.Again, if the costs were lower than the benefits, it would pay to invest more, andvice versa if the costs were greater than the benefits. One major qualitative conclu-sion of Becker’s model is that, other things being equal, investments in human capi-tal should be greatest early in life and decrease with age. This is because the returnsfrom those investments accrue over time. For example, investments in educationincrease wage rates over all remaining years of paid employment. An additionalyear of schooling at age 18 will produce greater payoffs than one at age 60, justbefore retirement.
Several modifications to this model are necessary for an adequate analysis oftime allocation in traditional subsistence societies. First, wage labor is largely irrel-evant, and therefore it is necessary to disaggregate household production into alter-native activities. Second, it is necessary to replace wage rates with return rates(work accomplished per unit of time investment) for each activity and to determinehow those return rates change with age as a function of investments in human capi-tal. Third, in order to evaluate the two alternative theories of life history evolution,it is necessary to model the relative impacts of strength and learned skills (whatBock [2002a] calls growth-based and experience-based capital) on return rates andhow changes in strength and skill over the life course should affect time allocation.Fourth, it is necessary to take into account the resource flows across three genera-tions, and labor substitution among individuals of different ages, sexes, and repro-ductive states.
Our approach is first to model how strength and learned skills are likely to changeover the life course. The next step is to present a model of the relative impacts ofstrength and skill on return rates for different activities. The third step is to modeltime allocation over the life course as a function of changes in return rates and otherage-related factors, such as the value of learning, presence of infants, and inter-individual labor substitution across ages. Each of these steps generates empiricaltests that are examined with data on return rates and time allocation among theMachiguenga and Piro.
Strength and Skill as a Function of Age
For the purposes of this analysis, we do not model the action of natural selectionon growth and learning; rather we assume that age-profiles of physical growth andknowledge are given exogenously. Denote si(x) as “strength” (which includes mus-cular strength, endurance, agility, and cardiovascular fitness) and ki(x) as “knowl-edge” (which includes the general and specific skills and knowledge necessary tocomplete each task) of individual i at age x. Even though we define these as unitaryfunctions, each represents a multidimensional growth process. In general, we ex-pect si(x) to increase exponentially until about age 20–25, then decrease at an in-creasing rate for men and women (see Figure 1). Similarly, ki(x) should also increaseexponentially to a given age specific to each task, then increase at a decreasing rate
001-Gurven/Kaplan 2/27/06, 4:56 PM11

12 Human Nature / Spring 2006
until death (Figure 1). There might be a decline at advanced ages owing to skill lossthat is dependent on strength (e.g., dexterity). The functional form used to generatethese curves is
(age) = A1 × ageib1 × eb2 age [3]
and
ki(age) = A2 × ageib3 × eb4 age [4]
We estimate the function relating strength to age as
si(age) = age1.87e–.06 × age [5]
This function corresponds closely to the empirical relationship estimated by Walkeret al. (2002) for Ache men, although they used a somewhat different function. Lessis known about how knowledge and skill increase with age, but previous research(Kaplan et al. 2000; Walker et al. 2002) suggests that it increases more slowly thanstrength. Both strength and skill can be expected to increase or decrease based onthe kinds of activities individuals engage in, and thus are not just extrinsic functionsof age, even though we model them this way. Moreover, we expect skills to increasefor a longer period of time owing to “on-the-job” learning, and only to decreaseslowly at advanced ages. We estimate the knowledge function as
ki(age) = age1.5e–.026 × age [6]
This function is qualitatively similar to wage functions for highly educated work-ers. Figure 1 illustrates the two functions.
Figure 1. Strength (s) and skills (c), by age (a) over the lifespan. Strength and skillsare represented here as standardized to a hypothetical maximal adult level. See text forparameterization of both curves.
001-Gurven/Kaplan 2/27/06, 4:56 PM12
Time Allocation across the Lifespan 13
Return Rates as a Function of Age
The next step is to model the effects of si(x) and ki(x) on return rates for differentactivities as a function of age. The key idea here is that the relative impacts ofstrength and knowledge on rates of return will vary from activity to activity. Definethe rate of return for activity j by individual i as some function of strength andskills: Rij(age) = Fj[si(age), ki(age)]. The function Fj maps age-specific strengthand knowledge to the rate of return for activity j and is assumed to vary from activ-ity to activity. For example, some activities, such as cooking manioc, require littlestrength and skill, whereas others, such as felling large trees for a garden, requirehigh levels of both. Therefore, in the case of cooking, even though a 22-year-oldman possesses greater strength than a 12-year-old girl, both possess enough strengthto realize similar return rates, yet their respective return rates for tree felling wouldbe quite different.
One simple function commonly used by economists to model the effects of twoinputs in a production process is the Cobb-Douglas function (Nerlove 1965). Sincethe impacts of strength and knowledge may vary across activities, we write:
Rij(age) = si(age)αj × ki(age)βj [7]
By substituting equations 3 and 4 into equation 7, the following reduced form isobtained:
Rij(age) = A(ageimienjagei) [8]
where A = A1αA2
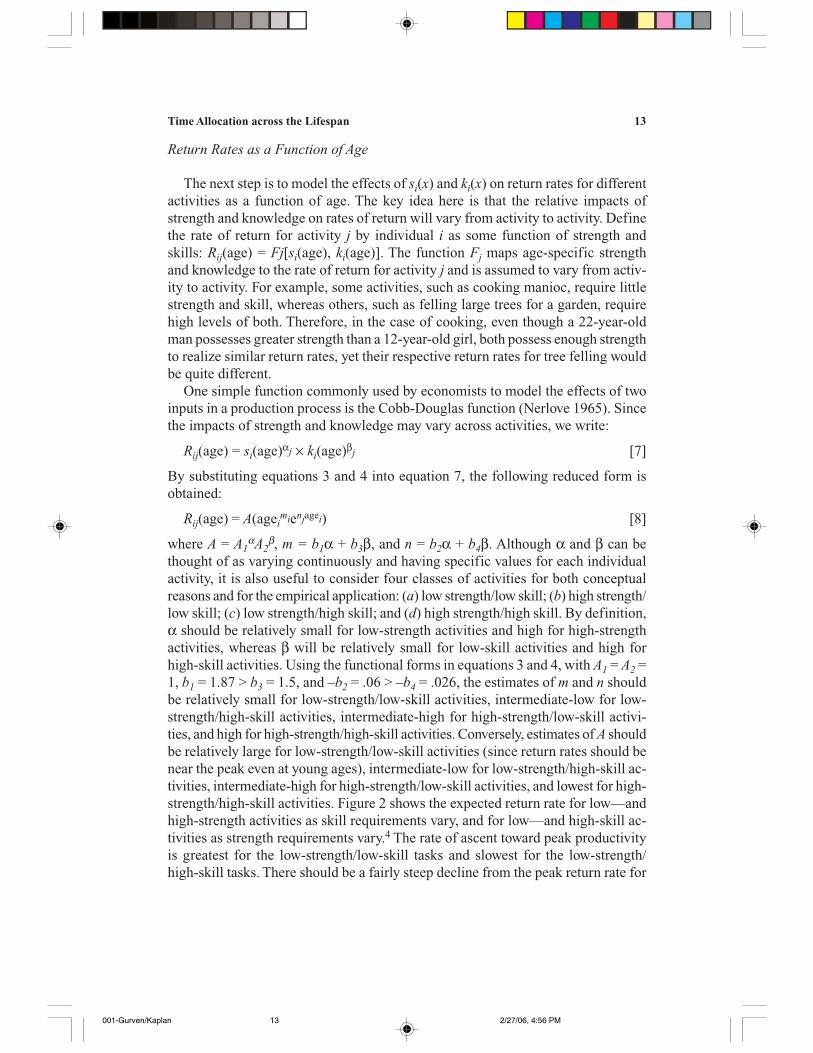
β, m = b1α + b3β, and n = b2α + b4β. Although α and β can bethought of as varying continuously and having specific values for each individualactivity, it is also useful to consider four classes of activities for both conceptualreasons and for the empirical application: (a) low strength/low skill; (b) high strength/low skill; (c) low strength/high skill; and (d) high strength/high skill. By definition,α should be relatively small for low-strength activities and high for high-strengthactivities, whereas β will be relatively small for low-skill activities and high forhigh-skill activities. Using the functional forms in equations 3 and 4, with A1 = A2 =1, b1 = 1.87 > b3 = 1.5, and –b2 = .06 > –b4 = .026, the estimates of m and n shouldbe relatively small for low-strength/low-skill activities, intermediate-low for low-strength/high-skill activities, intermediate-high for high-strength/low-skill activi-ties, and high for high-strength/high-skill activities. Conversely, estimates of A shouldbe relatively large for low-strength/low-skill activities (since return rates should benear the peak even at young ages), intermediate-low for low-strength/high-skill ac-tivities, intermediate-high for high-strength/low-skill activities, and lowest for high-strength/high-skill activities. Figure 2 shows the expected return rate for low—andhigh-strength activities as skill requirements vary, and for low—and high-skill ac-tivities as strength requirements vary.4 The rate of ascent toward peak productivityis greatest for the low-strength/low-skill tasks and slowest for the low-strength/high-skill tasks. There should be a fairly steep decline from the peak return rate for
001-Gurven/Kaplan 2/27/06, 4:56 PM13

14 Human Nature / Spring 2006
Figure 2. Caloric return rates as a function of strength and skill, f[s(a), c(a)]. Boldlines refer to low-strength activities, thin lines to high-strength activities. Solid linesrefer to low skill activities, and dashed lines to high-skill activities. Curves are shown asstandardized to a maximal adult level. See text for paramaterization of curves.
high-strength tasks, whereas return rates for low-strength tasks should either as-ymptote or decline slightly, regardless of skill. Peak productivity should be later forthe low-strength/high-skill than for high-strength/low-skill tasks, if skill increasesmore slowly than strength. Otherwise, the position of the peaks should be the oppo-site.
Time Allocation
In many, if not most, traditional nonmarket societies, food and other importantcommodities are produced and shared through the combined efforts of members ofmore than one nuclear family. Frequently, these nuclear families are linked throughbonds of kinship. Among the Machiguenga and Piro, residential clusters are gener-ally composed of an older couple (grandparents), their adult married children withsons—and daughters-in-law, and grandchildren (with some deviations owing todemographic variation). Most food in these residential clusters is eaten in commu-nal meals. To simplify matters, we can model each three-generational “super-household” as a “dynasty” whose goal is to maximize lineage fitness. This initial
001-Gurven/Kaplan 2/27/06, 4:56 PM14

Time Allocation across the Lifespan 15
approximation ignores sexual reproduction and conflicts of interest between familymembers, but it facilitates the generation of some qualitative predictions. As above,we can define fitness (thought of as the growth rate of the lineage), as
W = w(Z1,1, Z1,2, Z1,T,…Zn,T) [9]
where Zk,t is the amount of the kth commodity produced at time t, where T is somedistant terminal date. Some of the important commodities in traditional societiesare cooked meat, garden products, child safety, gains in knowledge and skill, socialinfluence, and mate attraction. Each commodity, Zi, is produced through the combi-nation of component activities by each household member. For example, the pro-duction of garden products, such as manioc, involves forest clearing, burning,planting, weeding, harvesting, processing, and cooking. Thus the amount of kth
commodity produced, Zk, will be a function of both the time that each householdmember allocates to each component activity and each individual’s correspondingefficiency (return rate) at those activities,
Zj = zj(t1,1R1,1,…tmnRmn) [10]
with tij being the time allocated by individual i to the jth activity and Rij being thecorresponding return rate for each of the m members of the household over all npossible activities, and where activities are mutually exclusive and each individualallocates all available time. Thus, inserting equation 10 into equation 9, the dy-namic household maximization problem is to maximize the rate of descendant pro-duction by the optimal allocation of activities by each household member at eachpoint in time:
MaxW = w[Z11(t111R111…tnm1Rnm1), Z1,2(t112R112…tnm2Rnm2),Z1,T(t11TR11T…tnmTRnmT), Zn,T(t11TR11T…tnmTRnmT)] [11]
such that
t tjjt
n
==
∑1
for all individuals. To complete the problem, it would be neces-
sary to add demographic structure to the family dynasty by converting W into theproportional rate at which new individuals are produced and specifying a mortalityfunction, with appropriate time discounting.
Even without fully analyzing this model, it is possible to generate some qualita-tive expectations. First, consider the one-period case with no concern for the future.In this situation, individuals should allocate time to tasks so as to maximize totaloutput, w. The critical decisions will be the amount of each commodity to produceand the amount of time each individual should contribute to the component activi-ties in its production. In general, since age-specific return rates are critical to pro-duction, we should find a rough correspondence between age profiles of timeallocation and age profiles of return rates. However, efficiency also implies thatindividuals should specialize in tasks for which they have a comparative advantage;the rates of substitution among time inputs of different household members with
001-Gurven/Kaplan 2/27/06, 4:57 PM15

16 Human Nature / Spring 2006
varying return rates should be the most significant determinant of differential timeallocation. Children can substitute most effectively for adults in low-skill, low-strength tasks because for these tasks the ratio of their return rates is closest tounity. Labor substitution among adults of different ages should reflect the relativecontributions of strength and skill to tasks, with younger adults allocating moretime to strength-intensive tasks and older adults allocating more time to skills-in-tensive tasks. Since return rates for all activities may eventually decrease with ad-vancing age and senescence, we should expect older adults to spend most of theirtime in activities for which return rates decline more slowly. For example, if returnrates for both hunting and agriculture decline with age, we would expect youngermen to hunt more and older men to do more agriculture, if the physical rigors ofhunting lead to more rapid declines with age. This may be true even if younger menachieve higher returns from agriculture than from hunting. In general, therefore, weshould expect time allocation to change with age in much the same way that returnrates change with age, with deviations resulting from rates of substitution amongfamily members.
Infant care is an additional factor that should influence age profiles of time allo-cation (van den Berghe 1979). Infants require both frequent nursing and protection.Home is also a much safer environment for young babies than the forest. Moreover,infant care and breast-feeding do not strictly conform to the assumption of mutualexclusivity of activities. They can be combined easily with some activities, such asfood processing and cooking, but not others, such as fishing or intensive gardenlabor (Hurtado et al. 1985). Since it is the mothers of babies who have milk to offer,older women cannot substitute for younger women in long bouts of childcare. Thus,older women may substitute for younger women in tasks that are incompatible withchildcare and are performed away from home, whereas younger women may sub-stitute for older women in home-bound activities. Such considerations should alsogenerate deviations from a correspondence of age profiles of time allocation andreturn rates.
Next, consider the multi-period model. Two important new problems are intro-duced. The first problem concerns the impacts of time allocation on return ratesduring one time period to activities in subsequent time periods owing to the effectsof learning and practice. Skills-intensive activities that yield high return rates byproficient workers most likely require a “learning period” in which immediate re-turns are low. Thus, the decision to allocate time to an activity at age a can bemotivated not by immediate return rates, but by those expected at age a + k, dis-counted by the probability of reaching that age. For example, Machiguenga andPiro boys spend significant time hunting tiny lizards with bow and arrow. Althoughthose lizards add little to household meat consumption, boys learn how to sneak upon animals without spooking them and improve their marksmanship, both of whichpresumably serve to increase return rates for hunting larger animals in the future.We should expect deviations in time allocation from single-period efficiency to-ward activities that provide learning opportunities for skills-intensive tasks (see
001-Gurven/Kaplan 2/27/06, 4:57 PM16

Time Allocation across the Lifespan 17
Bock 1995, 2002a, 2002b, for a similar argument and supporting data from villag-ers in rural Botswana).
In general, the costs of learning are lowest and the benefits are greatest at youngages owing to lower opportunity costs (since children are not very efficient at pro-duction) and to the additional years over which those returns will be realized (Becker1991). Nevertheless, it may also be the case that returns to learning change non-monotonically with age (see Bock and Johnson 2004 for a related discussion). Forexample, young children may learn little from treks into the forest in search ofgame, prior to having gained certain kinds of knowledge about prey behavior. Ado-lescents might learn more from such experiences. The general prediction is thatindividuals should engage in activities that provide opportunities to learn in such amanner that the marginal cost to current production is equal to the time-discountedexpected future increases in production over the life course (cf. Becker 1991).
The second problem concerns the physiological costs and risks associated withgiven activities. Young children are probably at greatest risk of injury and evenpredation when engaging in productivity activities away from home. Most parentsadmonish children to stay close to home, presumably because they would risk in-jury or death. The physiological costs of intensive exertion and exposure to tropicalheat are likely greater for old people than for young adults. Again, such consider-ations should produce deviations from single-period efficiency, given differentialcosts of work for future survival and productivity.
To summarize, the expected time allocated to a productive task (j) by an indi-vidual (i) can be modeled as a function of Rij, and a suite of other factors (Y): Tij =g(Rij, Y). The other factors can be grouped into three categories. The first groupconsists of variables relevant to household composition, such as the ratio of thenumber of consumers to producers (or dependency ratio), residential cluster (whichcaptures effects of local food sharing and garden labor exchange), and the age-specific return rates of other household members (a proxy for availability of substi-tutable labor). A second is a set of age-related factors, such as nursing status, benefitsto learning, and the risks and costs associated with work. The third includes factorsassociated with local ecology, such as the nature of production, rates of return tolearning, and environmental hazards.
The grandmother hypothesis and the embodied capital models make differentpredictions about age profiles of time allocation, particularly with respect to theimpacts of learning on both return rates and activity budgets. The grandmotherhypothesis predicts that strength should be the major determinant of return ratesand time allocation over the life course, particularly among women. The embodiedcapital model includes both strength and skill as arguments in the production func-tion. This implies that age profiles of strength and skill will have differential im-pacts on return rates for different activities and that opportunities for learning willaffect time allocation. In addition, the two theories, as they have previously beenformulated, make different predictions about male time allocation and the role ofmeat acquisition. The grandmother hypothesis predicts that male behavior will be
001-Gurven/Kaplan 2/27/06, 4:57 PM17

18 Human Nature / Spring 2006
motivated by mating effort, whereas the embodied capital model predicts that maletime allocation will be largely motivated by parental effort, with a division of laboramong men and women that maximizes their joint fitness. The grandmother hy-pothesis views meat acquisition as display, whereas the embodied capital modelviews meat acquisition as a nutritional input that complements gathered and gardenfoods, in the service of supporting reproduction and children’s growth and develop-ment. Testing these expectations motivates the empirical analysis to follow.
1STUDY POPULATIONS
Both study villages are inhabited by native South Americans (Kaplan 1994). At thetime of data collection the Yomiwato community consisted of 105 Machiguengaand was located in southeastern Peru on a small river in an area protected by thePeruvian government as a national park. Because of park policy, no economic de-velopment is allowed and its native inhabitants participate in a highly traditionaleconomy with almost no access to money or wage labor. Their subsistence patternduring the study was based on swidden horticulture, bow-and-arrow hunting, fish-ing, and gathering (see Johnson 2003 for a thorough ethnography). The data werecollected by K. Kopischke and Hillard Kaplan from September 1988 to May 1989.
The second community, Diamante, consisted of about 200 individuals of mixed,but mostly Piro, ancestry in southeastern Peru at the base of the Andes. The Piroeconomy was less traditional than that of the Machiguenga, having been exposed tothe national economy for several generations. They practiced a mixed economy ofhorticulture (primarily manioc and plantains), shotgun hunting, fishing, gathering,and some wage labor. About 7–10% of total food consumed was purchased (aboutequal to the amount sold). The behavioral data were collected by M. Alvard and T.Phillips, under Kaplan’s supervision, from August 1988 to June 1989. The samemethods were employed in both study communities (see Alvard 1993 and Gow2001 for background on the Piro).
METHODS
Data Collection
Production. The Machiguenga and Piro were both sampled using the same re-search design. Each community was subdivided into extended family residentialclusters, which were physically separated from each other by a several minute walk.Clusters were equally sampled throughout the day in three four-hour sampling frames(morning, midday, afternoon). Focal follows on individuals were also conducted toestimate production outside the community. For the within-community sampling,identity of acquirers was recorded, along with weights of all foods acquired. Identi-fying the acquirer for garden production was difficult because most of the forestclearing, planting, and weeding tasks were performed by a single man, with some
001-Gurven/Kaplan 2/27/06, 4:57 PM18

Time Allocation across the Lifespan 19
assistance from other men and the man’s wife. However, harvesting for immediateconsumption occurred every few days. Therefore, 50% of the garden calories ac-quired were assigned to the harvester and 50% to the person who performed mostother garden tasks (i.e. burning, clearing, weeding, planting). This procedure wasbased on our finding that on average, 53% of time allocation to garden labor wasspent harvesting.5
Large game acquisition and barbasco (poison) fishing were also sampled differentlysince both activities are relatively rare events and random sampling within house-holds would yield large sampling error. Therefore, large game and barbasco fishingacquisition data were recorded for most individuals on all days in both communities.
In total, the Machiguenga sample represents 1,296 sample days of data on 87individuals, and the Piro sample, 1,307 sample days on 139 individuals.
Time Allocation. The behavior of each individual within each household clusterwas recorded every half hour within each four-hour sample block. Behaviors wereeither observed directly or recorded based on reports of others while individualswere away from camp. These reports were later verified by questioning the indi-viduals upon their return. When individuals were observed performing more thanone activity simultaneously, the activities were given equal weight such that theirsum was equivalent to one observation. The mean number of observations per indi-vidual was 88 for the Machiguenga, 141 for the Piro.
Data Analysis
The recorded behaviors were organized into specific activity codes, which werethen aggregated into several sets of more general activity categories. These generalcategories are foraging, gardening, schooling, childcare, food processing, employ-ment, other work, and non-work. To calculate the average number of minutes perday individual i spends in activity x, we multiply the proportion of all observationsfor individual i spent in activity x by 12 hours/day and 60 minutes/hour. The totalobservations for this paper do not include time spent away from camp on overnightforaging trips or in wage labor. For each individual, we calculate the average num-ber of minutes spent in all relevant activities.
We also construct four macro-categories defined in terms of strength and skill:low strength/low skill, low strength/high skill, high strength/low skill, and highstrength/high skill. Table 1 lists the specific activities placed into these macro-cat-egories. Activities were chosen that easily fit into our simplistic, binary partitioningof strength and skill.
Nonlinear Estimation
All curve fitting of return rate and time allocation data across the lifespan wasdone using nonlinear least squares estimation. We tested four different nonlinear
001-Gurven/Kaplan 2/27/06, 4:57 PM19

20 Human Nature / Spring 2006
Tabl
e 1.
Cla
ssif
icat
ion
of A
ctiv
itie
s in
to S
tren
gth
and
Ski
ll C
ateg
orie
s
Low
str
engt
h an
d sk
ill
Low
str
engt
h, h
igh
skil
lH
igh
stre
ngth
, low
ski
llH
igh
stre
ngth
and
ski
ll
Hou
seho
ld c
hore
s (H
CH
)H
ouse
hold
cho
res
(HC
H)
Com
mun
ity
chor
es (
CC
H)
clea
ning
insi
de h
ouse
(G
CL
)cl
eari
ng o
utsi
de h
ouse
(G
CR
)ge
t wat
er (
GW
T)
Food
pro
cess
ing
(FC
P)
Food
pro
cess
ing
(FC
P)
Food
pro
cess
ing
(FC
P)
Food
pro
cess
ing
(FC
P)
chew
ing
(FC
H)
butc
her/
pluc
k (F
CH
)po
undi
ng (
FP
O)
mas
hing
(F
MA
)sh
elli
ng (
FS
H)
cutt
ing
(FC
T)
carr
y re
sour
ce (
GC
B)
get f
irew
ood
(GF
W)
stra
inin
g (F
ST
)dr
ying
(F
DR
)se
rvin
g (F
SV
)pe
elin
g (F
PL
)G
arde
n ac
tivit
ies
(GA
C)
Gar
den
activ
itie
s (G
AC
)G
arde
n ac
tivit
ies
(GA
C)
wee
ding
(L
GW
D)
plan
ting
(L
GP
L)
clea
ring
(L
GC
R)
burn
ing
(LG
BR
)ha
rves
ting
(R
VG
)
Fish
ing
(FIS
)Fi
shin
g (F
IS)
hook
, lin
e (R
FK
)bo
w f
ishi
ng (
RF
B)
barb
asco
(R
FP
)ne
t fis
hing
(R
FN
)
dig
barb
asco
(L
DG
P)
Col
lect
ing
(CO
L)
Hun
ting
(H
UN
)M
anuf
actu
ring
fora
ging
equ
ipm
ent (
MF
E)
fish
ing
item
s (M
FS
)ca
noes
, pad
dles
(M
OT
)
hous
ehol
d it
ems
(MH
O)
Rep
air
Rep
air
knif
etr
ansp
ort v
ehic
les
(RT
R)
Rep
air/
man
ufac
ture
clo
thin
gR
epai
r/m
anuf
actu
re to
ols
001-Gurven/Kaplan 2/27/06, 4:57 PM20

Time Allocation across the Lifespan 21
functions and chose the best fit to the data. The tested functions met several criteria.First, we only chose functions that exhibit close-to-linear behavior. This means thatthe estimators come close to being unbiased, normally distributed, with minimumvariance, even with small sample sizes (Ratkowsky 1990). Second, all functions arecapable of having peaks and inflection points for both the ascent and descent por-tions of the curves. Third, they are all functions of the single variable, age. Regres-sions were performed using the PROC NLIN in SAS, which employs theGauss-Newton algorithm for estimating regression coefficients.
The nonlinear model that was used in this analysis was
Yi = A × ageibec × age Model 1
where Yi is either the average minutes per day individual i spends in activity j ornumber of calories produced per day or per hour, and agei is the age of individual i.6
Note that this model is structurally identical to the one derived using the Cobb-Douglas production function. The fact that this independent approach led to thesame nonlinear model gives us additional confidence that our model provides themost efficient curvilinear fits to our data.
RESULTS
Table 2 reports the average minutes per day spent in various productive and nonpro-ductive activities for male and female Machiguenga and Piro. The greatest differ-ences between groups appear to be in hunting and schooling. In the analyses tofollow, group differences are controlled with a dummy variable, but for the pur-poses of illustrating the age profiles, the illustrations do not disaggregate the databy village. Although standard goodness-of-fit measures are not straightforward fornonlinear models (Ratkowsky 1990), we report in Tables 3 and 4 the R2 and p-values associated with the F-test for each of the nonlinear regression analyses re-ported below.
Rate of Productivity in Primary Subsistence Activities
Table 3 presents the results of the nonlinear estimation procedure for males andfemales. It shows the parameter estimates and significance levels for the intercept(A), and for the rise and decrease in return rates and time as they are jointly deter-mined by m and n. The final column of the table displays the ages at which returnrates or time peaks during the life course. The first and second parts of Table 3,respectively, examine return rates and time for the four main subsistence activities:hunting, collecting, fishing, and gardening. The third part examines activities groupedin terms of skill and strength requirements: low strength/low skill (0,0); low strength/high skill (0,1); high strength/low skill (1,0); and high strength/high skill (1,1). Thefourth part treats other uses of time, (for which return rates are more difficult, if not
001-Gurven/Kaplan 2/27/06, 4:57 PM21

22 Human Nature / Spring 2006
Table 2. Time Allocation (average minutes/day) to Various Activities by Sex and Group
MALES FEMALES
Machiguenga Piro Total Machiguenga Piro TotalActivity (n = 42) (n = 75) (n = 117) (n = 45) (n = 64) (n = 109)
Hunting 48.8 19.6 30.1 0.4 4.2 2.6
s.e. (8.9) (3.7) (4.2) (0.1) (1.3) (0.8)
Collecting 18.8 12.7 14.9 24.9 11.9 17.2
s.e. (3.1) (2.1) (1.8) (3.7) (2.5) (2.2)
Fishing 22.4 43.2 35.8 12.0 14.6 13.5
s.e. (3.7) (6.2) (4.3) (2.1) (2.9) (1.9)
Gardening 16.4 25.6 22.3 15.8 27.0 22.4
s.e. (3.8) (4.1) (3.0) (3.0) (4.7) (3.1)
Food Processing 11.1 10.4 10.7 54.7 41.0 46.8
s.e. (1.7) (2.7) (1.8) (6.8) (5.8) (4.5)
Child Care 6.7 2.8 4.2 38.3 38.8 38.6
s.e. (2.0) (1.1) (1.0) (8.2) (6.7) (5.2)
School 33.3 68.0 55.6 17.0 51.8 37.2
s.e. (6.6) (12.3) (8.3) (4.2) (10.8) (6.7)
Other Work 46.0 165.6 122.7 81.7 253.6 181.3
s.e. (6.4) (21.6) (15.0) (10.4) (27.1) (18.3)
Leisure 388.8 408.6 401.6 347.4 386.0 370.1
s.e. (16.0) (11.7) (9.7) (14.5) (14.5) (10.5)
impossible, to calculate). Figures 3 to 14 display the predicted values from thisprocedure, as a function of age and sex.
Figures 3a and 3b display return rates of the three foraging activities for men andwomen, respectively; Figure 3c displays the much-higher return rates for agricul-ture separately. The return rates are estimated by dividing daily caloric productionfor each activity by hours per day spent at each activity using the predicted valuesderived from the parameter estimates displayed in Tables 3 and 4. In order to stan-dardize rates across activities, return rates at each age were also divided by thehighest predicted return rate for that activity, so the age with the highest return ratehas a score of one and all others are scored as a proportion of that return rate. Thoseresults are displayed in Figures 4a and 4b for males and females, respectively.
Men achieve their peak return rates earliest for collecting (age 28), followed byfishing (age 40) and then by hunting (age 45) (see Table 3 and Figures 3a and 4a).Collecting requires relatively low strength and skill, fishing is not strength-inten-sive but is moderately skill-intensive, and hunting is both strength—and skill-in-tensive. The peaks in fishing and hunting return rates occur much later than the ageof peak strength, which in most samples occurs in the early to mid twenties (Walker
001-Gurven/Kaplan 2/27/06, 4:57 PM22

Time Allocation across the Lifespan 23
Table 3. Regression Diagnostics and Parameter Estimates for Nonlinear Model of Time andCaloric Return Rates, Shown for (a) Males and (b) Females. The three variables m, n and A areestimated parameters from the nonlinear equation Y = A × agemen × age, where Y is either returnrates (daily caloric productivity divided by daily time expenditure in minutes) or time (averageminutes per day).
Diagnostics A m nAge at
A. Males R2 p estimate p estimate p estimate p Peak
RETURN RATES
Huntingg 0.22 *** 4.80E–05 6.837 * –0.197 * 45
Collecting 0.15 *** 0.036 4.313 * –0.151 † 28
Fishing 0.32 *** 0.002 4.747 ** –0.110 * 40
Gardening 0.71 *** 0.026 4.231 *** –0.076 ** 68+
TIME
Hunting 0.33 *** 0.049 3.157 ** –0.116 ** 27
Collecting 0.14 *** 3.161 0.821 * –0.027 30
Fishing 0.33 *** 2.533 1.057 ** –0.017 62
Gardening 0.51 *** 0.013 2.901 ** –0.059 * 49
low (str), low (skill) 0.09 *** 34.169 *** 0.090 0.005 68+
low, high 0.45 *** 0.464 1.616 *** –0.028 ** 57
high, low 0.08 *** 0.407 0.794 –0.020 39
high, high 0.65 *** 0.372 † 2.392 *** –0.065 *** 37
food processing 0.11 *** 0.004 3.576 * –0.118 * 30
child care 0.14 *** 1.52E–26 28.133 –1.147 25
manufacture/repair 0.22 *** 1.352 0.752 0.004 68+
Table Continued
et al. 2002). The very high return rates for gathering represent the effects of self-selection, in that men only gather rarely, when returns are expected to be particu-larly high (e.g., the fruiting of wild-growing avocado trees or the harvesting oflarge larvae patches from previously felled palms). The early peak in collectingreturn rates is probably due to both its relatively unskilled nature and the fact thathigh returns are achieved far from the settlement, in combination with hunting.Hunting and fishing tend to occur during the wet and dry seasons, respectively;during the former, fish are difficult to catch and animals are fat, and during thelatter, fish are easier to find and many animals are considered hardly worth theeffort because they are parasitized and skinny because of the lack of fruit.
Young and middle-aged women show a significant peak in collecting productiv-ity (Figures 3b, 4b). Women achieve very low returns from hunting, probably ow-ing to their lack of practice (only a few actively hunt, and they do so rarely). Fishing
001-Gurven/Kaplan 2/27/06, 4:58 PM23

24 Human Nature / Spring 2006
Table 3. Continued
Diagnostics A m nAge at
A. Females R2 p estimate p estimate p estimate p Peak
RETURN RATES
Hunting 0.06 ** 5.79E–22 21.758 –0.747 29
Collecting 0.25 *** 0.006 4.530 * –0.132 * 30
Fishing 0.21 *** 1.730 1.357 –0.017 38
Gardening 0.55 *** 4.270 2.504 *** –0.059 ** 39
TIME
Hunting 0.03 ** 1.206 0.578 –0.018 32
Collecting 0.24 *** 3.354 0.622 † –0.003 57+
Fishing 0.25 *** 2.979 0.561 0.004 57+
Gardening 0.27 *** 1.236 1.243 * –0.026 48
low (str), low (skill)g 0.34 *** 14.929 † 0.695 ** –0.014 50
low, high 0.59 *** 1.838 1.414 *** –0.025 * 57
high, low 0.14 *** 1.022 0.807 † –0.023 35
high, high 0.22 *** 14.883 * 0.404 * 2.30E–05 60+
food processing 0.50 *** 3.011 1.209 *** –0.003 45
child care 0.18 *** 0.001 5.639 ** –0.247 23
manufacture/repair 0.30 *** 0.004 3.528 * –0.083 * 43
*** p < 0.0001, ** p < 0.01, * p < 0.05, † p < 0.10g significant difference (at 0.05) between Machiguenga and PiroNote: Parameter estimates for return rates are derived from regressions of daily caloric productivity and timeby first fitting these models to daily caloric production for each activity and time. The predicted values ofcaloric productivity per day were divided by predicted values of hours spent per day to derive predicted returnrates, which were then fit to the model.
returns are lower than for men, and those returns remain relatively steady throughadulthood with only a slight decrease at older ages.
The data on agricultural return rates ostensibly show that men are increasinglyproductive with age (Table 3 shows a peak at the oldest age). This is likely to be anartifact of the less direct method used for assessing agricultural productivity as wellas sample bias. Recall that 50% of each calorie harvested was assigned to the har-vester and 50% to the man who cleared and weeded the field. Older men’s fieldstended to be larger, but much of their clearance time was not recorded because itoccurred during the early dry season when river travel to Yomiwato was impossible.Moreover, it is also possible that older men received more help from younger kins-men in field clearance, since much of the surplus went directly to their children andgrandchildren. Data on rates of tree felling and garden clearance would be particu-
001-Gurven/Kaplan 2/27/06, 4:58 PM24

Time Allocation across the Lifespan 25
Figure 3. Caloric return rates by age and sex for four primary subsistence activities:(a) and (b) show caloric return rates by age for males and females, respectively, forhunting, fishing, and collecting activities. (c) shows the caloric return rates by age forgardening for both males and females.
001-Gurven/Kaplan 2/27/06, 4:58 PM25

26 Human Nature / Spring 2006
Figure 3. (c) shows the caloric return rates by age for gardening for both males andfemales.
larly helpful in clarifying this age pattern. Return rates for women show that har-vesting productivity peaks about age 39 and only drops off slowly. The estimates ofwomen’s return rates do not suffer from the same problems of bias as men’s, be-cause almost all of their garden labor is harvesting.
Time Allocation to Primary Subsistence Activities
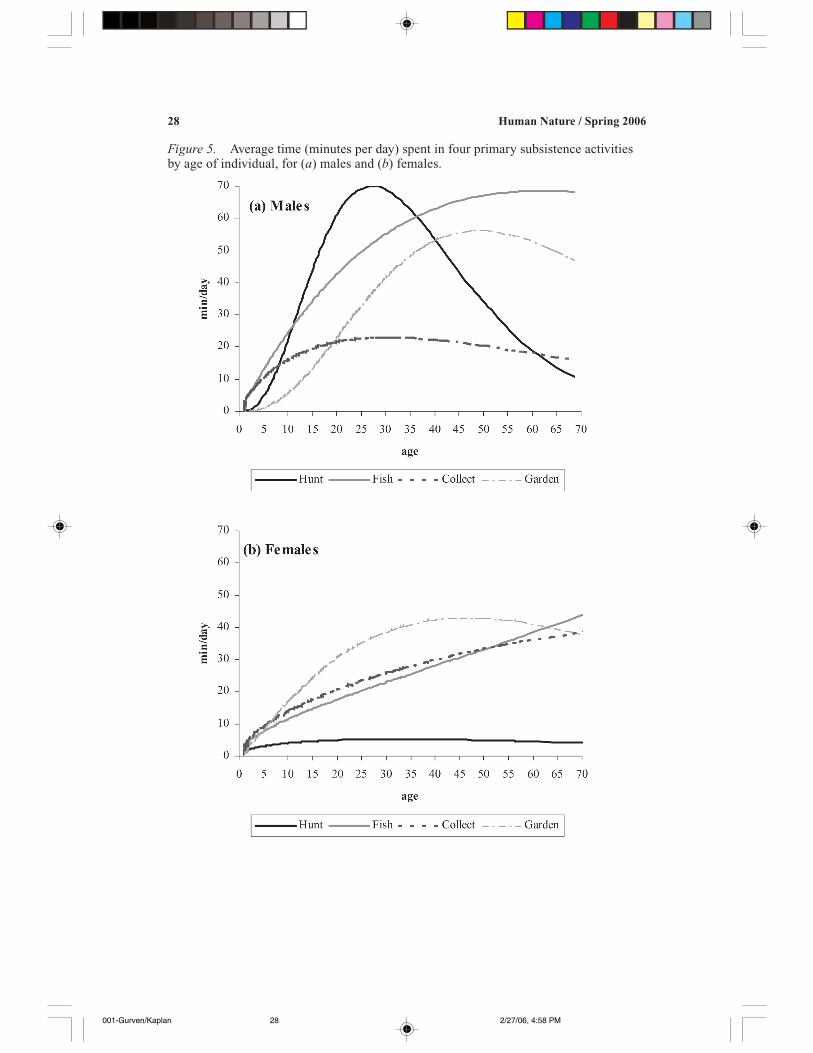
Time allocation to primary subsistence activities is shown in Figures 5a and 5bfor males and females, respectively. As mentioned previously, men’s time alloca-tion to collecting is rather insignificant and remains relatively steady throughoutadulthood. Hunting shows a sharp rise in late adolescence, peaking at age 27, andthen dropping off rather rapidly, with 50-year-olds hunting less than half the time of25-year-olds. These decreases probably reflect the strength—and endurance—in-tensive nature of hunting. Fishing, in contrast, increases monotonically throughoutthe life course, consistent with the fact that it requires relatively high skill levels butis less difficult to sustain. Garden work peaks at about age 49 and then drops off(this decrease in time allocation to gardening while amount harvested from gardenremains steady or increases is the cause of the monotonically increasing return rate,of which we are suspicious). The women’s data show that hunting is relatively rarethroughout adulthood, whereas fishing and collecting rise through adulthood. Aswith men, agricultural effort peaks in the late forties, and then drops off slowly.
Figures 6 and 7 examine return rates and time allocation jointly for selected
001-Gurven/Kaplan 2/27/06, 4:58 PM26

Time Allocation across the Lifespan 27
Figure 4. Standardized caloric return rates by age for four primary subsistenceactivities for (a) males and (b) females.
001-Gurven/Kaplan 2/27/06, 4:58 PM27
28 Human Nature / Spring 2006
Figure 5. Average time (minutes per day) spent in four primary subsistence activitiesby age of individual, for (a) males and (b) females.
001-Gurven/Kaplan 2/27/06, 4:58 PM28

Time Allocation across the Lifespan 29
activities, for men and women, respectively. Figure 4a showed that for men, timeallocation to hunting peaks well before return rates. This seems to be indicative ofthe long learning period involved in hunting, and the costs of high endurance laterin life. Children’s time allocation to fishing also seems to reflect investment inlearning, with time increasing faster than return rates (Figure 6b). However, unlikehunting, fishing return rates peak at age 40, while time allocation continues to in-crease until the early sixties. Thus, men shift their time allocation away from themore endurance-intensive hunting to fishing as they age. In contrast, Figure 7 showsthat women’s return rates increase much more quickly toward their peak than doestheir time allocation, which increases throughout adulthood and middle age. This isindicative of factors other than return rates in determining women’s time allocation,as will become clear below. Figure 7d shows that women’s agricultural return ratesand time allocation profiles have very similar shapes, but again time remains highwhile return rates begin to decrease in old age.
Figure 8 shows time allocation to other important forms of work for men andwomen: food processing, manufacture and repair of technology, childcare, and otherwork. Other work includes such activities as cleaning, washing clothes, buildinghouses, getting water, and community labor. As is evident in Figure 8a, men spendvery little time in childcare and food processing. Time in childcare peaks at aboutage 25, with a mean of about 10 minutes per day, and is mostly restricted to theperiod from late teens to age 30. Food processing time peaks around age 30 at justover 20 minutes per day. Manufacture and repair of tools is highly skilled but notstrength-intensive. It is therefore not surprising that time spent in those activitiesincreases through life, peaking for men at 40 minutes per day in their sixties. Women,in contrast, spend a great deal more time in childcare and processing food. Forexample, 15-year-old girls spend about 60 minutes caring for children (about sixtimes as much as men at their peak), even before they have reproduced. Time spentin childcare peaks in the mid twenties at about 100 minutes per day. The age patternis highly peaked. Women spend as much as 90 minutes per day processing food.One of the major processing activities is preparing manioc beer, which constitutesup to 30% of the calories ingested! Women also spend a great deal of time in manu-facture and repair, especially hand-spinning cotton and weaving clothes. These ac-tivities peak in the mid forties.
Strength and Skill: Time Allocation by Activity Requirements
We now take a more general empirical approach to examining the relationshipbetween strength and skills requirements of activities and time allocation behavior.Figure 9 gives the nonlinear fit of time males and females spent engaging in activi-ties within each of the four skills and strength categories given in Table 1.
Time spent in low-strength/low-skill activities increases throughout the lifespanfor both males and females, although there is little difference between child andadult levels. Figure 10 gives the standardized time allocation curves for males and
001-Gurven/Kaplan 2/27/06, 4:58 PM29

30 Human Nature / Spring 2006
Figure 6. Male caloric return rates and time allocation for (a) hunting, (b) fishing, (c)collecting, and (d) gardening. Solid lines are return rates and broken lines are timeallocation.
females. By age 10, males and females have reached roughly half of their adultbody weight. Body weight is a good proxy for physical strength and is a moreconservative proxy than body height. For low-skill activities, males have reachedroughly 50–60% and females 60% of the adult maximum. Thus, time spent in these
001-Gurven/Kaplan 2/27/06, 4:59 PM30

Time Allocation across the Lifespan 31
activities scales with body size. Conversely, for high-skill activities, a 10-year-oldmale has reached only 25% and a female 20–40% of the adult maximum. At age 20,when physical growth has mostly finished for males and has already finished forfemales, men’s time allocation to high skill activities is still only 50–60% of themaximum, and women’s is only 40–50%. However, a 20-year-old man’s and woman’stime allocation to low-skill activities is 60–80% and 70–90% of the maximum,
001-Gurven/Kaplan 2/27/06, 4:59 PM31
32 Human Nature / Spring 2006
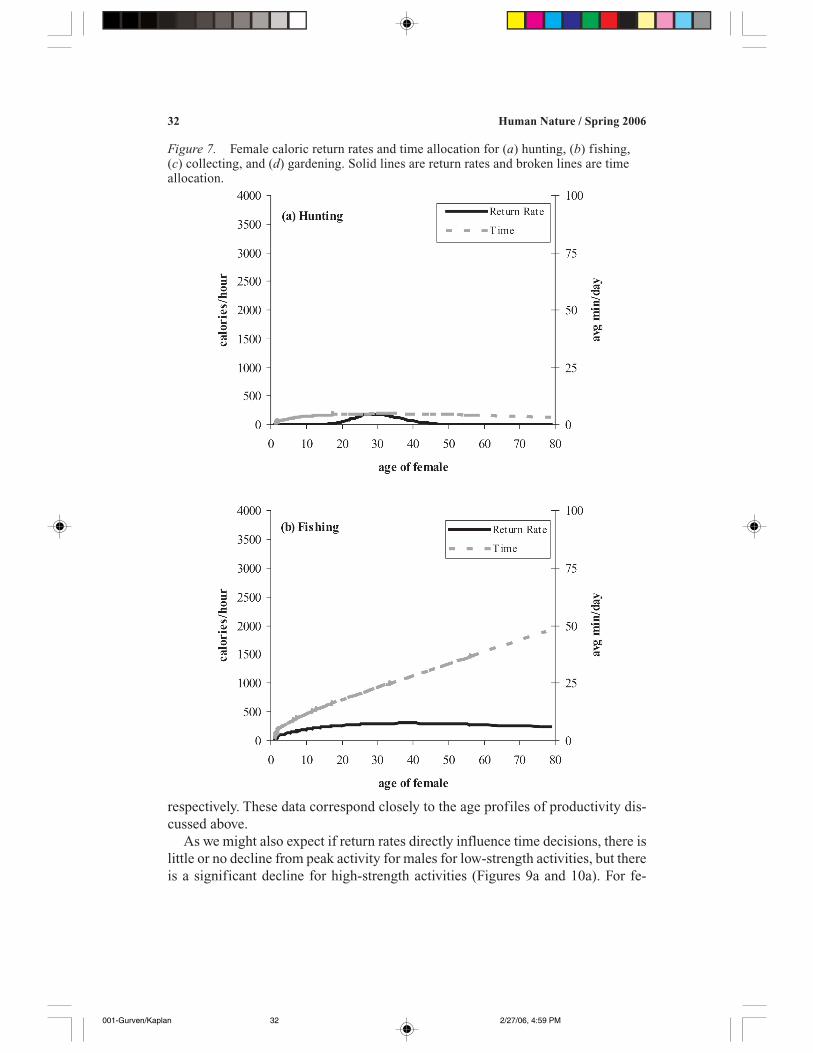
respectively. These data correspond closely to the age profiles of productivity dis-cussed above.
As we might also expect if return rates directly influence time decisions, there islittle or no decline from peak activity for males for low-strength activities, but thereis a significant decline for high-strength activities (Figures 9a and 10a). For fe-
Figure 7. Female caloric return rates and time allocation for (a) hunting, (b) fishing,(c) collecting, and (d) gardening. Solid lines are return rates and broken lines are timeallocation.
001-Gurven/Kaplan 2/27/06, 4:59 PM32

Time Allocation across the Lifespan 33
males, there is also no decline for low-strength activities, and we also find a declinefor high-strength/low-skill activities. However, for high-strength/high-skill activi-ties, women’s time allocation increases over the lifespan. This difference betweenmen and women could be because high-strength activities for men such as huntingmay be more physically demanding and subject to more rapid deterioration thanhigh-strength activities for women, such as mashing food (see Table 3). Thus, asstrength declines, men appear to shift time allocation to high-skill activities with
001-Gurven/Kaplan 2/27/06, 4:59 PM33

34 Human Nature / Spring 2006
Figure 8. Time spent in food processing, manufacturing and repair of household itemsand technology, childcare, and other work activities, such as house construction,cleaning house, washing and sewing clothes, and community labor, for (a) males and (b)females.
001-Gurven/Kaplan 2/27/06, 4:59 PM34

Time Allocation across the Lifespan 35
Figure 9. Time spent in four macro-categories of activities for (a) males and (b)females based on strength and skills requirements. 0,0 refers to low-strength/low-skillactivities; 1,0 to high-strength/low-skill activities; 0,1 to low-strength/high-skill activi-ties; and 1,1 to high-strength/high-skill activities. Activities in each macro-category aregiven in Table 1. Arrows indicate ages at which males and females have reached 50%and 100% adult body size.
001-Gurven/Kaplan 2/27/06, 4:59 PM35

36 Human Nature / Spring 2006
low strength requirements (e.g., manufacture and repairing tools; see Figure 8a),while women do the same but can also more easily maintain high levels of high-strength activities.
Total Production: Calories and Time
Figure 11 shows the cumulative daily energy production for men and women.First, returns from hunting are plotted, fishing returns are then added, followed bycollecting, and then gardening. Figure 11a shows that for men, most hunted calo-ries are obtained during their thirties. Men obtain somewhat fewer calories fromfishing, and production remains relatively steady until age 60. Collecting does notcontribute many calories to the diet, and most of them are acquired by youngermen, probably during hunting expeditions. Men’s gardens produce the bulk of thecalories they provide, especially as they age. Caloric production from all sourcespeaks in the men’s late forties. Figure 12 normalizes the data by dividing age-spe-cific production from each source by total production at that age. This shows therelative contribution of calories from different sources by men’s age. From aboutages 18 to 40, meat from hunting and fishing constitutes just under 30% of the diet,and it drops below 20% by age 50.
Figure 11b shows the cumulative daily caloric production for women. Caloriesfrom hunting are negligible, and calories from fishing are not much greater, in-creasing with age to about 10% of production late in life (Figure 12b). Collectingprovides more calories, particularly in middle adulthood. By far the bulk of caloriesprovided by women is derived from harvesting manioc and plantains from the gar-den. Total production by women peaks in the forties, but it is only about 4,900calories per day, compared with men’s peak at about 12,000 calories per day.
Figure 13 displays time allocation cumulatively for men and women. Men peakin work effort in their mid thirties, working about five hours per day (a 35 hr workweek), whereas women work about an hour a day longer (a 42 hr work week).Men’s allocation of time to work declines at a faster rate than women’s, largelyowing to the drop in high-endurance activities. In general, men begin their adultlives with a focus on hunting and then shift their effort to less demanding activities,such as fishing, gardening, and tool manufacture. Tool manufacture becomes anincreasingly important aspect of men’s contributions as they age.
DISCUSSION AND CONCLUSIONS
The age—and sex—profiles of return rates and time allocation among theMachiguenga and Piro reflect a life history in which both physical strength andskill are important to economic production and where individuals of different agesand sexes make very different contributions to household production and reproduc-tion. Young children engage in very little work. In fact, as shown in Figure 11, theyproduce a very small percentage of the calories they consume before age 10. This
001-Gurven/Kaplan 2/27/06, 4:59 PM36

Time Allocation across the Lifespan 37
Figure 10. Standardized version of Figure 9, where times are normalized to maximaladult levels. Vertical lines indicate ages at which males and females have reached 50%and 100% adult body size.
001-Gurven/Kaplan 2/27/06, 4:59 PM37
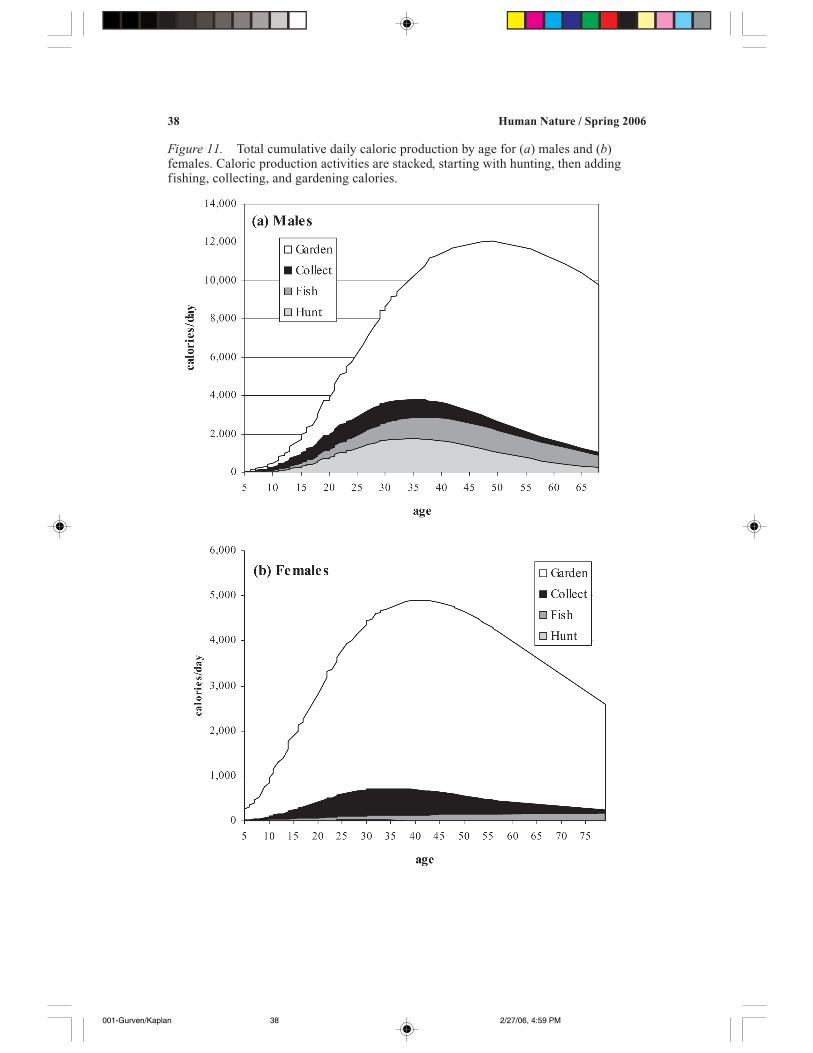
38 Human Nature / Spring 2006
Figure 11. Total cumulative daily caloric production by age for (a) males and (b)females. Caloric production activities are stacked, starting with hunting, then addingfishing, collecting, and gardening calories.
001-Gurven/Kaplan 2/27/06, 4:59 PM38
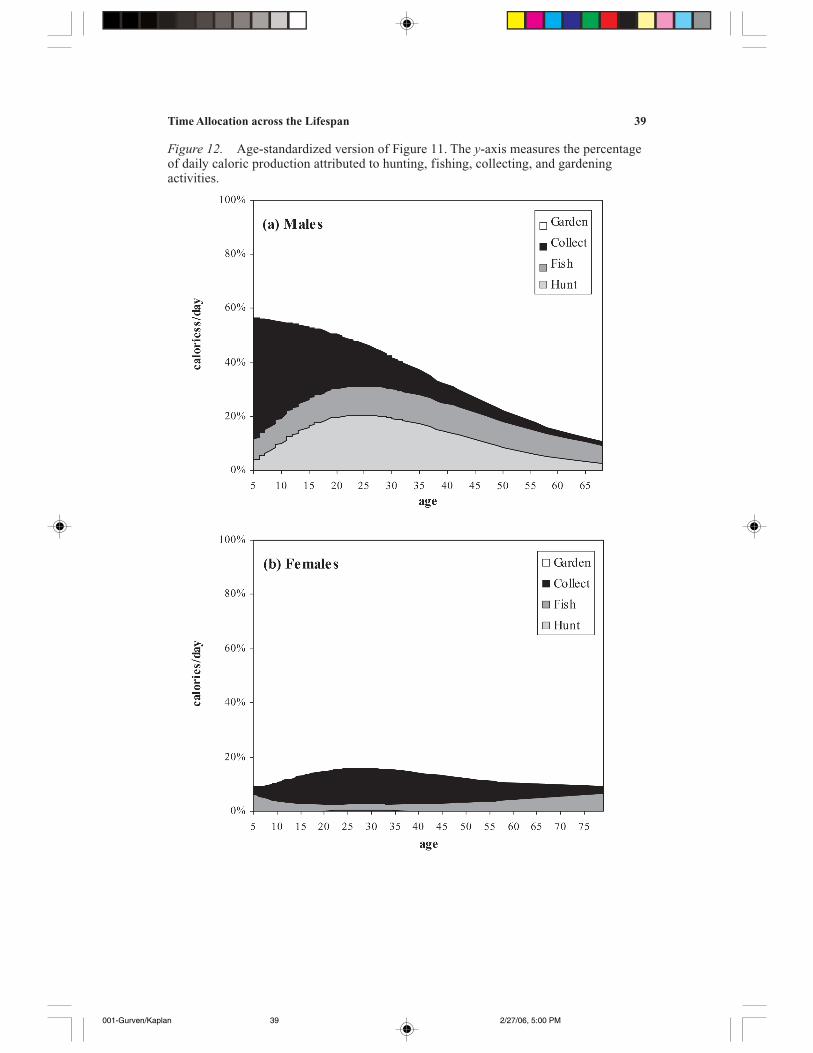
Time Allocation across the Lifespan 39
Figure 12. Age-standardized version of Figure 11. The y-axis measures the percentageof daily caloric production attributed to hunting, fishing, collecting, and gardeningactivities.
001-Gurven/Kaplan 2/27/06, 5:00 PM39

40 Human Nature / Spring 2006
Figure 13. Total cumulative daily time allocation for work activities by age for (a)males and (b) females. Time spent in activities are cumulative, starting with hunting,then adding fishing, collecting, gardening, food processing, manufacturing and repair,childcare, and other work activities. The average work day is 5 hrs for men and 6 hrs forwomen at their peak.
001-Gurven/Kaplan 2/27/06, 5:00 PM40
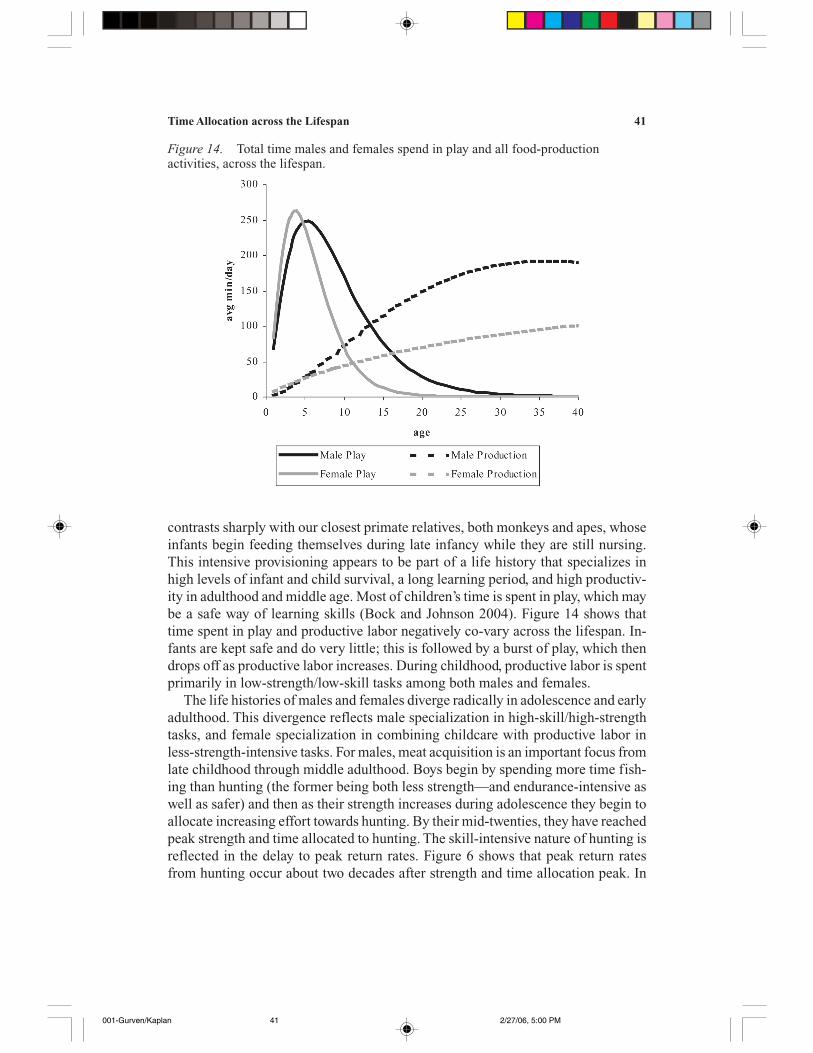
Time Allocation across the Lifespan 41
Figure 14. Total time males and females spend in play and all food-productionactivities, across the lifespan.
contrasts sharply with our closest primate relatives, both monkeys and apes, whoseinfants begin feeding themselves during late infancy while they are still nursing.This intensive provisioning appears to be part of a life history that specializes inhigh levels of infant and child survival, a long learning period, and high productiv-ity in adulthood and middle age. Most of children’s time is spent in play, which maybe a safe way of learning skills (Bock and Johnson 2004). Figure 14 shows thattime spent in play and productive labor negatively co-vary across the lifespan. In-fants are kept safe and do very little; this is followed by a burst of play, which thendrops off as productive labor increases. During childhood, productive labor is spentprimarily in low-strength/low-skill tasks among both males and females.
The life histories of males and females diverge radically in adolescence and earlyadulthood. This divergence reflects male specialization in high-skill/high-strengthtasks, and female specialization in combining childcare with productive labor inless-strength-intensive tasks. For males, meat acquisition is an important focus fromlate childhood through middle adulthood. Boys begin by spending more time fish-ing than hunting (the former being both less strength—and endurance-intensive aswell as safer) and then as their strength increases during adolescence they begin toallocate increasing effort towards hunting. By their mid-twenties, they have reachedpeak strength and time allocated to hunting. The skill-intensive nature of hunting isreflected in the delay to peak return rates. Figure 6 shows that peak return ratesfrom hunting occur about two decades after strength and time allocation peak. In
001-Gurven/Kaplan 2/27/06, 5:00 PM41

42 Human Nature / Spring 2006
fact, by the time men reach peak returns from hunting, they have already begun toshift much of their time allocation toward less strength—and endurance-intensivetasks, but still skills-based tasks such as agriculture and tool manufacture and re-pair. Greater investment in agriculture may reflect both the increased caloric de-mands of their growing families and the cumulative effects of several decades ofhunting on their bodies.
The life history of females after childhood shows two distinct phases. The firstphase appears to be focused on providing care to infants and children. Even beforethey begin to reproduce, girls spend an increasing proportion of their work effort inchildcare (about 20% at age 15). This may reflect a learning phase before they areresponsible for their own baby (Kramer 2002). Early adulthood is largely focusedon childcare, and on tasks that are compatible with staying at home in a safe envi-ronment and on-demand breast-feeding, such as food processing and other house-hold work. As women age, they spend an increasing proportion of their time in foodproduction and manufacture. Given that time spent in childcare peaks in the earlytwenties, it would appear that as the number of a woman’s dependent children in-creases, she compensates by increasing food-related work effort at the expense ofchildcare (Figures 7 and 8). It is also interesting that women spend an increasingproportion of time fishing and collecting as they age, even into old age; those ac-tivities require leaving home and compete most with childcare.
How do the alternative models of life history and time allocation through the lifecourse fare in light of these data? The results are largely consistent with the embod-ied capital approach to time allocation over the life course, as developed by Bock(2002a, 2004b) and formalized here. The results show that time allocation over thelife course reflects labor substitution among members of extended families. It isshaped by the effects of both skill and strength on performance in specific tasks,and by opportunities for learning. In this sense, the patterns of labor substitutionamong the Machiguenga and Piro are similar to those found by Bock forHamBukushu villagers in Botswana (2002a, 2004b) and by Kramer among Mayain Mexico (Kramer 2002). However, Machiguenga and Piro children require moreyears to become effective producers than do Mayan children, presumably becauseMayan peasant farmers have more low-skill tasks in food production than the for-ager-horticulturalists in Peru (see Kramer and Boone 2002 and Lee, Kramer, andKaplan 2002 for supporting analyses).
The results also suggest a refinement of Bock’s (2004b) concept of punctuateddevelopment. In his view, development may proceed in a steplike fashion for manytasks that involve both strength and skill. This is because it will not pay to investtime in learning some tasks until the body is strong enough to perform them effec-tively. Thus, it may appear that it takes a long time to learn the task, when in fact thedevelopmental process is characterized by a long growth process, followed by aspurt in learning. This may be true for some tasks, such as fishing with baskets,which require moderate levels of strength and skill. However, we expect that lengthof learning period and the rate at which return rates increase will depend on the
001-Gurven/Kaplan 2/27/06, 5:00 PM42

Time Allocation across the Lifespan 43
degree to which cumulative learning affects task performance. Rates of return onlabor peak at increasingly older ages, as the skill: intensiveness ratio of the activityincreases; collecting return rates peak first, followed by fishing and then hunting.Moreover, peak return rates for fishing and hunting occur long after strength peaks.In addition, time allocation to these activities increases faster than do return rates,also indicating an investment phase through which rates increase as a result of learn-ing-by-doing. The learning period can be quite long, with steady increases in returnrates for a decade or two following peak strength acquisition and a period of heavytime investment in the activity. Tool manufacture, especially of highly technicalitems such as bows, arrows, and boats, may require many decades to learn well. Asstrength and endurance begin to wane, both men and women, but especially men,allocate more time to more-skill—but less-strength-intensive activities.
Although these results do not support the strength-only view favored by propo-nents of the grandmother hypothesis, two features of the results are consistent withthe grandmother hypothesis. First, strength does appear to play a role in the pattern-ing of activities, in terms of both return rates and time allocation, as they changewith age. There is an increase in rates as children grow and a decrease as men andwomen age. Second, and most important, older women do work hard and providesurplus calories for younger women. For example, a 60-year-old woman producesmore calories, about 4,000 per day, than a 25-year-old, who may have two offspringto support (Figure 11). Moreover, when childcare is excluded, a 60-year-old womenworks more overall than a 25-year-old woman.
However, the evidence suggests a slightly different explanation for why assis-tance from older women is important. Proponents of the grandmother hypothesispropose that the strength-intensive nature of human food gathering disadvantagesyoung and increases the benefits of assistance from older women. The data pre-sented here suggest that younger women are compromised in their food productionby intensive childcare. Young babies are easiest to care for at a home base, and as aresult, Machiguenga women increase their proximity to children and the amount oftime they are in tactile contact with them when they are in the forest or other unsafeplaces (Kopischke 2001). This trade-off between food production and childcaremay render the extra food provided by older women especially important.
The data on men are most problematic for the grandmother hypothesis and aremost supportive of a cooperative division of labor by age and sex. First, men pro-duce the bulk of the food, both agricultural and foraged. At their peak production,men produce about 12,000 calories per day, about 75% in garden foods with theremainder coming primarly from hunting and fishing. Women’s peak production iscloser to 5,000 calories per day, mostly in the form of garden products. Given thatwomen do the bulk of food processing, men’s caloric production from gardens isprobably only a little higher than women’s when all work is taken into account. Notonly do older women play an important role in the energetics of reproduction byyounger individuals, but so too do older men, perhaps even a greater role.
The data on men’s meat acquisition are much more consistent with a macro-
001-Gurven/Kaplan 2/27/06, 5:00 PM43

44 Human Nature / Spring 2006
nutrient-balanced paternal provisioning strategy than with mating displays. Men donot hunt exclusively, but rather distribute their time among farming, fishing, andhunting. Farming produces many more calories per hour than do hunting or fishing(peak return rates for gardening exceed 10,000 calories per hour, whereas peakreturns from hunting and fishing are between 1,000 and 2,000 calories per hour).As a result, the majority of men’s surplus production comes from gardens. Informalinterviews with Machiguenga men suggested that they supplemented garden foodswith meat for nutritional reasons. A common comment was that children eatingonly manioc and plantains would not grow; they need to eat meat. They also re-ported that they varied their work effort seasonally, emphasizing hunting during thewet, fruiting season when animals are fat, and emphasizing fishing during the dryseason when animals are parasitized and fish are more concentrated. Most fishacquired are small, weighing a kilogram or less, and as such are almost alwaysconsumed within residential clusters.
Data from other South American horticulturalists suggest that a diet composedof 70–80% garden products and 20–25% meat is very common. Hames (1989)argues that dietary protein is more efficiently produced through hunting and fish-ing than through horticulture for most Amazonian groups. He gives the proportionof total calories coming from gardening among the Achuar and the Yanomamo tobe about 78% and those from hunting to be 16%, while hunting and fishing supply78% of the dietary protein in the diet, and gardening supplies only 18%. Among theMachiguenga and the Piro, gardening, hunting, and fishing account for 70%, 9%,and 7% of the total acquired calories, respectively, with collecting providing theremainder. The proportions of hunted vs. fished meat tend to vary significantlyamong Amazonian forager-horticulturalists, but the proportion of total calories de-rived from meat, in one form or another, tends to vary less (Hames 1989), againsuggesting nutrient complementarity. Taken together, these data suggest that meninvest in children and grandchildren through food-related work effort, consistentwith their age, the nutrient needs of their families, and seasonally varying rates ofreturn from different activities.
It is not surprising therefore that Machiguenga and Piro tend to reside inextended family clusters comprising three generations of biologically related indi-viduals. Those clusters eat most of their food in communal meals, and there isrelatively little sharing among clusters. Large game animals and beer made frommanioc are the most important foods that are shared among clusters. Yet, thissharing appears to be voluntary for the most part. In informal interviews, severalMachiguenga men reported that sharing was completely voluntary and they couldgive to whomever they chose. Given this sharing pattern and the age-related changesin subsistence work and childcare exhibited by both men and women, it appearsthat a model in which lineage fitness is maximized by an age—and sex-relateddivision of labor may be a reasonable approximation. However, any collaborativeunit will be subject to some levels of free-riding, and as we have already mentioned,optimal time budgets for parents might not be optimal for children, and vice versa.
001-Gurven/Kaplan 2/27/06, 5:00 PM44

Time Allocation across the Lifespan 45
Future studies that examine time budgets, productivity, and distribution patternsof older males and females and of children in many populations will be necessaryto illuminate key mechanisms responsible for the human pattern of long lifespans,long juvenile dependency, the sexual division of labor, age-graded specialization,and collaborative dynamics within and between households.
Michael Gurven is an assistant professor of anthropology at the University of California–Santa Bar-bara. He received his Ph.D. from the University of New Mexico in 2000. He has conducted fieldworkin Paraguay and Bolivia with Ache and Tsimane forager-horticulturalists. His research interests in-clude intragroup cooperation and problems of collective action, and the application of life historytheory to explaining human longevity, cognitive development, delayed maturation, and sociality. Since2002, Gurven and Kaplan have co-directed the Tsimane Health and Life History Initiative, a five-yearproject to develop theory and test implications of different models of human life history evolution.
Hillard Kaplan is a professor of anthropology at University of New Mexico. He received his Ph.D.from the University of Utah in 1983. He has conducted fieldwork in Paraguay, Brazil, Botswana, andBolivia. His research interests include evolutionary perspectives on life course development and se-nescence, and brain evolution. He has launched theoretical and empirical investigations into each ofthese areas, uniting evolutionary and economic approaches. He has applied human capital theorytoward explaining human life history evolution, and the proximate physiological and psychologicalmechanisms governing fertility and parental investment in both traditional, high-fertility, subsistenceeconomies and modern, low-fertility, industrial societies.
NOTES
1. Interestingly, the only case where net generation wealth flows are upward from younger to olderindividuals occurs in developed nations, as a result of public transfer programs, such as SocialSecurity and Medicare. Even in developed nations, net within-family wealth flows are down-ward.
2. Although it might be the case that such laws also serve to reduce competition between adults andchildren for menial jobs, the justification for those laws is to provide children with the opportu-nity to improve their skills so that they will be able to find better jobs as adults.
3. We also hypothesize that the feeding niche specializing in large, valuable food packages, andparticularly hunting, promotes cooperation between men and women and high levels of maleparental investment because it favors sexual specialization in somatic investments and thus gen-erates a complementarity between male and female inputs (Bird 1999). The economic and repro-ductive cooperation between men and women facilitates provisioning of juveniles, which bothbankrolls their somatic investments and enables lower mortality during the juvenile and earlyadult periods. Cooperation between males and females also allows women to allocate more timeto childcare, increasing both survival and reproductive rates. Finally, large packages also appearto promote interfamilial food sharing. Food sharing reduces risk of food shortfalls resulting fromthe vagaries of foraging, providing insurance against illness and against variance in family sizeowing to stochastic mortality and fertility. These buffers favor a longer juvenile period and higherinvestment in other mechanisms to increase lifespan.
4. The parameters in the Cobb-Douglas function for return rate, A × si(age)α × ki(age)β [wheresi(age) and ki(age) were parameterized as above], were chosen as:
Strength Skill α β A b1α + b3β b2α + b4 β
low low 0.1 0.1 40.00 0.34 0.009low high 0.1 0.7 2.60 1.24 0.024high low 0.7 0.1 2.63 1.46 0.045high high 0.7 0.7 0.18 2.36 0.060
001-Gurven/Kaplan 2/27/06, 5:00 PM45

46 Human Nature / Spring 2006
5. This result is consistent with the time allocation to garden labor reported for a different group ofMachiguenga by Baksh (1984).
6. Three other nonlinear models from Ratkowsky (1990) were considered (see text for model 1):
Yi = 1 / [a + (b × Xi) + (c × Xi2)] Model 2
Yi = Xi / [a + (b × Xi) + (c
X i )] Model 3
Yi = a + (b × X) + (c × X2) + d × X3 Model 4
We made qualitative assessments of goodness-of-fit in the following three ways suggested byHuet et al. (1996): (a) plots of y vs. y, (b) plots of ê vs. y and ê vs. x, and (c) plots of êi vs. êi–1.These examine whether the regression function is correct, whether the variance function is cor-rect, and whether observations are independent. While models 1, 3, and 4 all give suitable fits tothe data, models 1 and 3 are perhaps preferable to model 4 since they contain fewer estimatedparameters. However, model 4 might be more appropriate for modeling high-strength/high-skillactivities because the rate of decline continues to accelerate until death, whereas the other curvescontain an inflection point which decreases the rate of decline for the most advanced ages.
REFERENCES
Alvard, M. S.1993 Testing the Ecologically Noble Savage Hypothesis. Ph.D. dissertation, University of New
Mexico, Albuquerque.Baksh, M.
1984 Cultural Ecology and Change of the Machiguenga Indians of the Peruvian Amazon. Ph.D.dissertation, Department of Anthropology, University of California, Los Angeles.
Becker, G. S.1991 A Treatise on the Family, enlarged ed. Cambridge: Harvard University Press.
Bird, D. W., and R. Bliege Bird2002 Children on the Reef. Human Nature 13:269–297.
Bird, R.1999 Cooperation and Conflict: The Behavioral Ecology of the Sexual Division of Labor. Evolu-
tionary Anthropology 8(2):65–75.Bliege Bird, R. and D. W. Bird
2002 Constraints of Knowing or Constraints of Growing? Human Nature 13:239–267.Blurton Jones, N. G., and F. W. Marlowe
2002 Selection for Delayed Maturity: Does It Take 20 Years to Learn to Hunt and Gather? HumanNature 13:199–238.
Blurton Jones, N. G., K. Hawkes, and P. Draper1994 Differences between Hadza and !Kung Children’s Work: Original Affluence or Practical
Reason? In Key Issues in Hunter-Gatherer Research, E. S. Burch, ed. Pp. 189–215. Oxford: Berg.Bock, J.
1995 The Determinants of Variation in Children’s Activities in a Southern African Community.Ph.D. dissertation, Department of Anthropology, University of New Mexico, Albuquerque.
2002a Learning, Life History, and Productivity: Children’s Lives in the Okavango Delta ofBotswana. Human Nature 13:161–198.
2002b Evolutionary Demography and Intrahousehold Time Allocation: Schooling and Children’sLabor among the Okavango Delta Peoples of Botswana. American Journal of Human Biology14:206–221.
2004a Farming, Foraging, and Children’s Play in the Okavango Delta, Botswana. In The Nature ofPlay: Great Apes and Humans, A. Pellegrini and P. K. Smith, eds. Pp. 254–281. New York: Guilford.
2004b What Makes a Competent Adult Forager? In Hunter-Gatherer Childhoods, B. Hewlett andM. Lamb, eds. Pp. 109–128. Piscataway, New Jersey: Aldine/Transaction.
001-Gurven/Kaplan 2/27/06, 5:01 PM46
Time Allocation across the Lifespan 47
Bock, J., and S. Johnson2004 Play and Subsistence Ecology among the Okavango Delta Peoples of Botswana. Human
Nature 15:63–81.Bock, J., and D. W. Sellen
2002 Childhood and the Evolution of the Human Life Course: An Introduction. Human Nature13:153–161.
Cain, M. T.1977 The Economic Activities of Children in a Village in Bangladesh. Population and Develop-
ment Review 3:201–227.1981 Extended Kin, Patriarchy, and Fertility. Liege, Belgium: International Union for the Scien-
tific Study of Population, Committee on Comparative Analysis of Fertility.Caldwell, J. C.
1982 Theory of Fertility Decline. London and New York: Academic Press.Caro, T. M.
1988 Adaptive Significance of Play: Are We Getting Closer? Trends in Ecology and Evolution3:50–53.
Charnov, E. L.1993 Life History Invariants. Oxford: Oxford University Press.
Draper, P.1975 !Kung Women: Contrasts in Sexual Egalitarianism in Foraging and Sedentary Contexts. In
Toward an Anthropology of Women, edited by R. Reiter, pp. 77–109. New York: Monthly ReviewPress.
Fagen, R.1981 Animal Play Behavior. New York: Oxford University Press.
Gow, P.2001 An Amazonian Myth and Its History. Oxford: Oxford University Press.
Hames, R.1979 A Comparison of the Efficiencies of the Shotgun and Bow in Neotropical Forest Hunting.
Human Ecology 7:219–252.1989 Time, Efficiency, and Fitness in the Amazonian Protein Quest. Journal of Economic An-
thropology 11:43–45.1992 Time Allocation. In Evolutionary Ecology and Human Behavior, E. A. Smith and B.
Winterhalder, eds. Pp. 203–236. New York: Aldine de Gruyter.Hawkes, K.
2003 Grandmothers and the Evolution of Human Longevity. American Journal of Human Biol-ogy 15:380–400.
Hawkes, K., and R. Bliege Bird2002 Showing Off, Handicap Signaling and the Evolution of Men’s Work. Evolutionary Anthro-
pology 11:58–67.Hawkes, K., K. Hill, J. O’Connell, and E. L. Charnov
1985 How Much Is Enough? Hunters and Limited Needs. Ethology and Sociobiology 6:3–15.Hawkes, K., J. F. O’Connell, et al.
1998 Grandmothering, Menopause, and the Evolution of Human Life Histories. Proceedings ofthe National Academy of Science 95:1336–1339.
Hill, K., and A. Hurtado1996 Ache Life History: The Ecology and Demography of a Foraging People. New York: Aldine
de Gruyter.Huet, S., A. Bouvier, M. Gruet, and E. Jolivet
1996 Statistical Tools for Non-linear Regression. New York: Springer-Verlag.Hurtado, A. M., and K. Hill
1990 Experimental Studies of Tool Efficiency among Machiguenga Women and Implications forRoot-digging Foragers. Journal of Anthropological Research 35:207–217.
Hurtado, A. M., et al.1985 Female Subsistence Strategies among Ache Hunter-Gatherers of Eastern Paraguay. Human
Ecology 13:29–47.
001-Gurven/Kaplan 2/27/06, 5:01 PM47
48 Human Nature / Spring 2006
Hurtado, A. M., K. Hill, H. Kaplan, and I. Hurtado1992 Tradeoffs between Female Food Acquisition and Childcare among Hiwi and Ache Foragers.
Human Nature 3:185–216.Janson, C. H., and C. P. Van Schaik
1993 Ecological Risk Aversion in Juvenile Primates: Slow and Steady Wins the Race. In JuvenilePrimates: Life History, Development and Behavior, M. Pereira and L. Fairbanks, eds. Pp. 57–76.New York: Oxford University Press.
Johnson, A.1975 Time Allocation in a Machiguenga Community. Ethnology 14:301–310.2003 Families of the Forest: The Matsigenka Indians of the Peruvian Amazon. Berkeley: Univer-
sity of California Press.Johnson, S. E., and J. Bock
2004 Trade-offs in Skill Acquisition and Time Allocation among Juvenile Chacma Baboons. HumanNature 15:45–62.
Kaplan, H.1994 Evolutionary and Wealth Flows Theories of Fertility: Empirical Tests and New Models.
Population and Development Review 20:753–791.1996 A Theory of Fertility and Parental Investment in Traditional and Modern Human Societies.
Yearbook of Physical Anthropology 39:91–135.1997 The Evolution of the Human Life Course. In Between Zeus and Salmon: the Biodemography
of Aging, K. Wachter and C. Finch, eds. Pp. 175–211. Washington, D.C.: National Academy ofSciences.
Kaplan, H., and A. Robson2002 the Co-evolution of Intelligence and Longevity and the Emergence of Humans. Proceed-
ings of the National Academy of Sciences 99:10221–10226.Kaplan, H., J. Lancaster, et al.
2003 Embodied Capital and the Evolutionary Economics of the Human Lifespan. Population andDevelopment Review 29 (Supplement):152–182.
Kaplan, H., K. Hill, J. Lancaster, and A. M. Hurtado2000 A Theory of Human Life History Evolution: Diet, Intelligence, and Longevity. Evolution-
ary Anthropology 9:156–185.Kelly, R. L.
1983 Hunter-Gatherer Mobility Strategies. Journal of Anthropological Research 29:277–306.Kopischke, K.
2001 Talkng to Children, Caring for Children: A Comparative Analysis of Modern and Tradi-tional Communication Environments. M.A. thesis, University of New Mexico, Albuquerque.
Kramer, K.2002 Variation in Duration of Juvenile Dependence: Helping Behavior among Maya Children.
Human Nature 13:299–325.Kramer, K., and J. Boone
2002 Why Intensive Agriculturalists Have Higher Fertility: A Household Labor Budget Approachto Subsistence Intensification and Fertility Rates. Current Anthropology 43:511–517.
Kumar, S. K., and D. Hotchkiss1988 Consequences of Deforestation for Women’s Time Allocation, Agricultural Production, and
Nutrition in Hill Areas of Nepal. International Food Policy Research Institute, Research Report69. Washington, D.C.
Lee, R.1996 A Cross-Cultural Perspective on Intergenerational Transfers and the Economic Life Cycle.
In Seminar on Intergenerational Economic Relations and Demographic Change: Papers 16:1–25. Liege, Belgium: International Union for the Scientific Study of Population [IUSSP], Com-mittee on Economic Demography.
Lee, R., and K. Kramer2002 Children’s Economic Roles in the Maya Family Life Cycle: Cain, Caldwell and Chayanov
Revisited. Population and Development Review 28:475–499.Lee, Ronald D., Karen L. Kramer, and Hillard Kaplan
2002 Children and the Elderly in the Economic Life Cycle of the Household: A Comparative
001-Gurven/Kaplan 2/27/06, 5:01 PM48

Time Allocation across the Lifespan 49
Study of Three Groups of Horticulturalists and Hunter-Gatherers. Paper presented at the annualmeeting of the Population Association of America, Atlanta.
Munroe, R. H., A. Koel, R. L. Munroe, R. Bolton, C. Michelson, and C. Bolton1983 Time Allocation in Four Societies. Ethnology 22:355–370.
Nag, M., R. C. Peet, and B. White1977 Economic Value of Children in Two Peasant Societies. International Union for the Scien-
tific Study of Population 1977:123–139.Nerlove, M.
1965 Estimation and Identification of Cobb-Douglas Production Functions. Skokie, Illinois: Rand-McNally.
Ratkowsky, D. A.1990 Handbook of Nonlinear Regression Models. New York: Marcel Dekker.
Robson, A., and H. Kaplan2003 The Evolution of Human Life Expectancy and Intelligence in Hunter-Gatherer Economies.
American Economic Review 93:150–169.Roff, D. A.
1992 The Evolution of Life Histories. London: Chapman and Hall.Salisbury, R.
1962 From Stone to Steel. Cambridge: Cambridge University Press.Smith, E. A.
1987 On Fitness Maximization, Limited Needs, and Hunter-Gatherer Time-Allocation. Ethologyand Sociobiology 8:73–85.
Stearns, S.1992 The Evolution of Life Histories. Oxford University Press.
Tiefenthaler, J.1997 Fertility and Family Time Allocation in the Philippines. Population and Development Re-
view 23:377–397.Tooby, J., and I. DeVore
1987 The Reconstruction of Hominid Behavioral Evolution through Strategic Modeling. In TheEvolution of Human Behavior: Primate Models, edited by W. G. Kinzey, pp. 183–237. Albany:SUNY Press.
Turke, P. W.1991 Theory and Evidence on Wealth Flows and Old-Age Security: A Reply to Fricke. Popula-
tion and Development Review 17:687–702, 756, 758.van den Berghe, P. L.
1979 Human Family Systems: An Evolutionary View. New York: Elsevier.Walker, R., K. Hill, and G. McMillan
2002 Age-Dependency in Skill, Strength and Hunting Ability among the Ache of Eastern Para-guay. Journal of Human Evolution 42:639–657.
Winterhalder, B.1983 Opportunity-Cost Foraging Models for Stationary and Mobile Predators. American Natu-
ralist 122:73–84.
001-Gurven/Kaplan 2/27/06, 5:01 PM49