Embed Size (px)
Citation preview

ECONOMIC GROWTH CENTER
YALE UNIVERSITY
P.O. Box 20826927 Hillhouse Avenue
New Haven, CT 06520-8269
CENTER DISCUSSION PAPER NO. 789
DETERMINANTS OF SCHOOL ATTAINMENT OFBOYS AND GIRLS IN TURKEY
Aysit Tansel
Middle East Technical University
April 1998
Note: Center Discussion Papers are preliminary materials circulated to stimulatediscussion and critical comments. Dr. Tansel is a postdoctoral fellow at theEconomic Growth Center at Yale University and Professor at the Middle EastTechnical University, Ankara, Turkey. This is a revised version of the paperoriginally written in February 1997.
This research was supported by the Rockefeller Foundation. The paper was written when I*
was a visiting scholar at Yale University, Economic Growth Center. I am grateful to T. P. Schultz formany suggestions and comments. Comments of Paul Glewwe, programming assistance of PaulMcGuire and data collection assistance of Nil Demet Güngör are appreciated. Members of the StateInstitute of Statistics, President Mehmet S dd k Ensari, vice president Nürgül Ö üt and chief of laborstatistics Hakk Özel helped to implement the study. Any errors are mine alone. An earlier version ofthis paper is presented at the ESPE meeting in Colchester, Essex, U.K., June 1997, and the PAAmeeting in Chicago, April 1998.
Determinants of School Attainment of Boys and Girls in Turkey*
byAys t Tansel
Department of EconomicsMiddle East Technical University
06531 Ankara TurkeyTelephone: 90-312-210 20 57
Fax: 90-312-210 12 44E-mail: [email protected]
Revised, April 1998
Abstract:
This study investigates the determinants of school attainments of boys and girls in Turkey.
Although high levels of enrollments have been achieved at the primary school level for both
boys and girls in much of Turkey, substantial regional differences remain. In particular, in the
Southeastern region, girls begin to drop out of school around the third grade. Only half of the
primary school graduates register at the middle level. Thus, the purpose of this study is to
examine the determinants of educational attainments at the primary, middle and high school
levels. Attainments of boys and girls are examined separately so as to shed light on the causes
for the significantly lower level of attainment for girls. Understanding the constraints causing
the large gender gap in Turkish education and the covariates related to lower overall
educational levels may be useful to policy makers and planners.
Key Words: School attainments; gender; Turkey
JEL Codes: I21; J16
Determinants of School Attainment of Boys and Girls in Turkey
Aysit Tansel
Middle East Technical University
Ankara Turkey
I. Introduction
Recent literature documents the important role of education in economic development
emphasizing its contribution to economic growth, individual and social development. This
study examines the determinants of the demand for schooling in Turkey. Although high levels
of enrollments have been achieved at the primary level for both boys and girls in much of
Turkey, substantial regional differences remain. Enrollment rates at the middle school and
high school levels are low, and there are significant gender differences at these levels. The
estimated labor market private rates of return to women are at least as large as those to men
(Tansel, 1994; 1996). Under these conditions the greater schooling attainment of men reflect
not only inefficient allocation of household resources but is also inequitable . Thus, the1
purpose of this study is to examine the determinants of educational attainments at the primary,
middle and high school levels for boys and girls separately so as to shed light on the causes of
low levels of middle and high school attainments and the gender differences at these levels.
Individual survey data from the 1994 Household Budget Survey are used to estimate
ordered probit models of primary, middle and high school attainments. A number of
individual, household and local characteristics are related to the probability of schooling
attainment. The most consistent factors affecting school attainment were parents' education
and household permanent income. The strong effect of parents' education may mean less
intergenerational socioeconomic mobility. The effect of the permanent income on the
probability of schooling achievement of girls was larger than that of boys. Parental education
effects were also larger on girl's schooling than on boy's schooling implying less social
mobility for girls than for boys. Father being self employed had the expected negative effect
on the probability of schooling at the middle and high school levels suggesting that work at

2
the family farm or business is an alternative to schooling. Effects of migration possibilities,
the industrial composition of the local labor market and the quality of schooling on the
probability of school attainment of boys and girls are also examined.
This paper is organized as follows. The structure of education and recent educational
advancements in Turkey are discussed in Section II. Section III presents the demand for
education model and its empirical specification. Section IV describes the data used in this
study and the considerations for the representativeness of the samples used. Estimation
results are given in Section V. Concluding remarks appear in Section VI.
II. Structure of Education and Recent Developments
The formal educational system consists of primary school, middle school, high school
and tertiary levels of schooling. Primary schools provide five years of training and the middle
schools take three years. Until recently primary school has been the only compulsory
education. In August 1997, compulsory education is extended from five to eight years
covering middle school. High schools encompass general, vocational and technical high2
schools where additional three years (four years in case of technical high schools) of training
is implemented after middle schools. Tertiary levels of schooling take place at universities of
at least four year programs or other institutions of two year programs. Formal education is
provided by the government free of charge in the public schools although at all levels private
schools exist.3
There have been substantial improvements in the gross enrollment rates since the
1960s. Primary school gross enrollment rates increased from an overall 75 percent (58
percent for females) in 1960 to over 100 percent for both males and females in 1993. The
secondary school gross enrollment ratio was only 14 percent in 1960. It increased to 50
percent for females and 74 percent for males in 1993. Tertiary gross enrollment ratio
increased from three percent in 1960 to 16 percent in 1993 (World Bank, 1984; 1997). 4,5
There were also substantial improvements in the stock of human capital measures since the
1960s. Adult illiteracy rate declined from 83 percent in 1960 to 28 percent for females and 8
percent for males in 1995 (World Bank, 1997). However, in spite of compulsory primary6
schooling, Turkey has a high rate of youth illiteracy compared to OECD countries. Illiteracy
3
among 15-19 year olds were 9.4 percent in Turkey in 1990 as compared to 0.7 percent in
Portugal and 1.0 percent in Spain (UNESCO, 1991). The average years of schooling of the
labor force increased from 1.6 for females and 3.6 for males in 1970 to 4 for females and 6 for
males in 1990 (Tansel and Güngör, 1996).
The school enrollment ratios may be overestimated, and they conceal significant7
regional and gender differences. The mean years of schooling, although a stock measure,
gives an idea about the extent of the regional and gender differences. The mean years of
schooling of the labor force were 5.76 for females and 6.48 for males in 1990 in the Marmara
region which is the most developed region of the country. This is to be contrasted with the
same figures of 1.81 for females and 4.75 for males in the Southeastern region (Tansel and
Güngör, 1996). UNICEF-Turkey (1994) notes that in the rural parts of Southeastern Turkey
the proportion of girls drops to 25-30 percent after third grade. The bottleneck in the
schooling system seems to be at the entry to the middle school. According to the 1990
Census, about three-fifths of the literate population (57 percent) had only primary schooling
and no more (State Institute of Statistics, 1993). This means a high rate of drop out from the
educational track after graduation from the mandatory primary schooling. Indeed, only 51
percent of the primary school graduates continued on to middle school in 1981 (TÜSIAD,
1990:47). Further, there were only 64 females per hundred males in 1992 at the secondary8,9
schooling level (World Bank, 1995:219). For these reasons it is of great importance to study
the determinants of primary, middle and high school achievements and the causes of gender
differences in these achievements. 10,11
III. The Model
The human capital theory regards education as an investment so as to maximize
lifetime wealth (Schultz, 1960, 1963, 1974; Mincer, 1958, 1974; and Becker, 1975).
Additional schooling generates benefits in terms of enhanced future earnings and entails direct
costs and opportunity costs associated with delayed entry into the labor market. The
individuals will compare the direct and the opportunity costs of schooling with its future
benefits. The investment will continue so long as the marginal rate of return to additional
schooling exceeds the prevailing cost of borrowing. In this model the optimal level of
4
schooling increases with the returns to human capital and decreases with the cost of schooling.
According to the quality-quantity trade off models of household production parents
maximize a one period utility as a function of number of children, quality of children, a
composite consumption good and the leisure of household members subject to income and
time constraints for the household members and the production functions (Becker, 1965;
Becker and Lewis, 1973; Becker and Tomes, 1976; 1979; and Becker, 1991). Optimization
results in a set of reduced form household demand equations for the number of children,
children's education, consumption good, leisure and the derived demand equations for the
market goods and the labor force participation. The demand for the schooling of children
could be represented as a function of the wages of household members, market prices of
inputs, unearned household income and a set of child, household and the local labor market
characteristics. Assuming that parents have different preferences for their son's and daughter's
education leads to gender specific demand functions for schooling. This differential
preference may be a response to the actual or perceived differences in the labor market returns
to female and male schooling (Rosenzweig and Schultz, 1982). The prevailing social norms
or household resource constraints may also be important in producing gender specific
schooling demand functions. If the society or parents do not see daughters as future providers,
then parents may not invest in their daughters' education. If the labor market returns to men's
schooling are higher than those to women's, then it will be efficient for the household to invest
in son's schooling than in daughter's schooling. Education enhances the productivity of
individuals in nonmarket activities as well (Haveman and Wolfe, 1984). The external benefits
of education such as increased nutrition and health, increased child schooling, reduced child
mortality and fertility are not easy to quantify. However, such returns in developing countries
are greater for female schooling than for male schooling (Behrman, 1990; King and Hill,
1993; Schultz, 1988; 1993; 1995a; 1995b). Schultz (1995a) reviews the market failures which
may be responsible for less than socially efficient investment in the schooling of girls than of
boys.
The assumptions of altruistic parents and imperfect capital markets produce causal
relationships with causality running from parents' schooling and household income to
children's schooling attainment. Parents' education may represent their taste for schooling and
5
the genetic factors while mother's education may further reflect home investments since
mothers are primary child care providers (Leibowitz, 1974). Mother's education may also
represent permanent income, opportunity cost of mother's time in the labor market and
efficient household production. If schooling is a normal good, the higher the income and
wealth the higher will be the schooling attainment, ceteris paribus. Schooling could be a
luxury for low income households in which case the income effect would be very large. If
schooling is purely an investment good, under imperfect capital markets there will still be a
positive association between schooling and income since higher income households are better
able to finance the time in school.
Direct costs of schooling are the cash outlays on books, uniforms, transportation and
tuition. However, the largest component of the cost of schooling is the opportunity cost of
children's time diverted from household production or the labor market participation. In
particular in the rural areas working at the family farm or business may be the alternatives to
the time spent in school.
Empirical Specification
Ordered probit models (Maddala, 1983) are specified for primary, middle and high
school attainments. The latent demand for the desired level of schooling, y is defined as an*
unobserved continuous variable:
y = 'x + u*
where x is a vector of individual, household and locational explanatory variables and u is the
normally, independently distributed disturbance term. is the vector of coefficients to be
estimated. Different levels of schooling for the individuals, y is the observed counterpart of y *
. It is discrete rather than continuous and censored at zero since a number of individuals are
observed to have zero years of schooling. Application of ordinary least squares (OLS) is ruled
out because an assumption of OLS is that the dependent variable be continuous and unlimited.
Further, the benefits of schooling may not be uniform across different levels of schooling.
Then, OLS which hypothesizes a linear expected value locus is inappropriate. The individuals
are assigned to one of the J categories according to their observed levels of schooling such as
0, 2, 5, 8, 11, 15 or more years of schooling. Zero years of schooling indicate the people who
6
are illiterate. Two years of schooling is assumed for people who are literate but not a graduate
of any school assuming that literacy is acquired in school. The graduates of primary schools
have five years of schooling. The graduates of the middle and high schools have eight and
eleven years of schooling, respectively. Finally, those with a tertiary level degree or higher
are assumed to have 15 or more years of schooling. The ordinal variable y is defined to take a
value of j if y falls in the jth category:*
y = j if < y < j = 1, ..., Jj-1 j*
where 's are unknown threshold parameters that must be estimated along with assuming -1
= - , = 0 and = . The probability of obtaining an observation with y = j is equal to:0 J
Prob (y = j) = F ( - 'x) - F( - 'x)j j-1
where F is the cumulative standard normal distribution function. The estimation is carried out
by maximum likelihood methods which provide consistent and efficient parameter estimates.
The effect of the independent variable on the probability of the jth level of schooling is given
by:
Prob (y = j) / x = [f ( - 'x) - f ( - 'x)] (1)j-1 j
where f is the standard normal density function.
In this study children age 14-19 corresponding to primary school graduates are fit with
three categories of schooling, 0, 1, and 2 corresponding to 0, 2 and 5 or more years of
schooling. Children age 16-19, corresponding to middle school graduates are fit with four
categories of schooling, 0, 1, 2 and 3 corresponding to 0, 2, 5 and 8 or more years of
schooling. Finally, children age 19-20, corresponding to high school graduates are fit with
five categories of schooling, 0, 1, 2, 3 and 4 corresponding to 0, 2, 5, 8 and 11 or more years
of schooling. The reasons for these samples and choice of educational categories are
discussed in the section on the sample randomness.
The following variables are used as the determinants of schooling. Children's age and
a squared term in age are included to observe the cohort effects and to capture the nonlinear
effect of age on schooling. Years of schooling achieved by the father and the mother
represent parents' education. Whether the father is self employed or not and whether the
mother is self employed or not are two dummy variables which are expected to capture the
effects of the alternative opportunities for children's time. The effects of the unobserved
7
schooling of parents who were not present in the household are captured by the two dummy
variables which indicated whether they are present in the household or not.
Total household expenditure per adult over 15 is used as a proxy for household
permanent income. There were several reasons for this choice. First, total household
expenditure is easier to measure than total household income, and it is measured with less
errors of measurement. Second, total expenditure is a better proxy for household permanent
income than total income itself since income may be subject to transitory fluctuations whereas
savings allow smoothing of expenditures over time. Finally, per adult total expenditure
figures are computed in order to avoid contamination of the income variable by the fertility -
schooling choices that the parents make jointly. Positive association between household
income and the schooling of children is confirmed in a number of studies. 12
A dummy variable indicates whether the household is located in an urban area which is
defined as locations with populations over twenty thousand. Rural location was the reference
category. Within an urban location the streets were classified as developed, undeveloped or a
squatter settlement according to the personal observations of the interviewer. Two dummy
variables which indicated undeveloped streets and squatter settlements are included to control
for location of residence. Developed streets were the reference category. Population density
is used as an indicator of the availability of schools and expected to positively influence the
schooling attainment. In thinly populated areas students probably have to commute long13
distances to schools. The longer distances to schools reflect a higher price for schooling since
the opportunity cost of a child's time in traveling to school will be higher. Distance of a
province from the province which could be considered a regional metro center and the
distances of provinces from Istanbul are both expected to capture the effects of migration
possibilities on schooling attainment. I expect that easier migration opportunities will14,15
increase schooling attainment since migration enables individuals to obtain higher returns on
their educational investments. Further, closeness to the metro centers may change traditional
attitudes about schooling and increase demand for it.
The industrial composition of employment changes over time during the development
process. It is observed in many countries that the proportion of the employment in agriculture
declined over time with a corresponding increase in the proportion of the employment in
8
industry and the service sectors. Such developments may affect the relative wage
opportunities for men and women and may be accompanied by an increase in the returns to
educated labor since industrial activities place a premium on formal education (Schultz, 1975;
Schultz and Zeng, 1995). This will induce households to better educate their children in the
industrializing communities than in the agricultural ones. However, the service sector
activities especially in wholesale and retail trade may employ unskilled labor. Thus, the move
away from agriculture to the service activities (although it may increase wage employment
opportunities outside of the family farming activities) may not affect the wage returns to
schooling and the demand for schooling. In this study the industrial composition of the16
provincial employment is hypothesized to affect demand for schooling. Provincial
percentages of the employed people in industry and in the service sectors represent local
employment characteristics . The percentage of employment in agriculture is the reference17
category. Finally, dummy variables representing residence in one of the seven regions of the
country are included to control for further regional differences in schooling attainments.
Marmara is the reference region.
IV. Data
The individual level sample data used in this study come from the household income
and expenditure survey conducted by the State Institute of Statistics of Turkey in 1994. It was
administered to 26,256 households around the country . It was possible to identify 12,00018
households with "children" in their relation to the household head. In this study I considered
only those children in the 14-19 age group (19-20 in the high school sample) in order to obtain
a representative sample of children. This issue is elaborated in the section on sample
randomness.
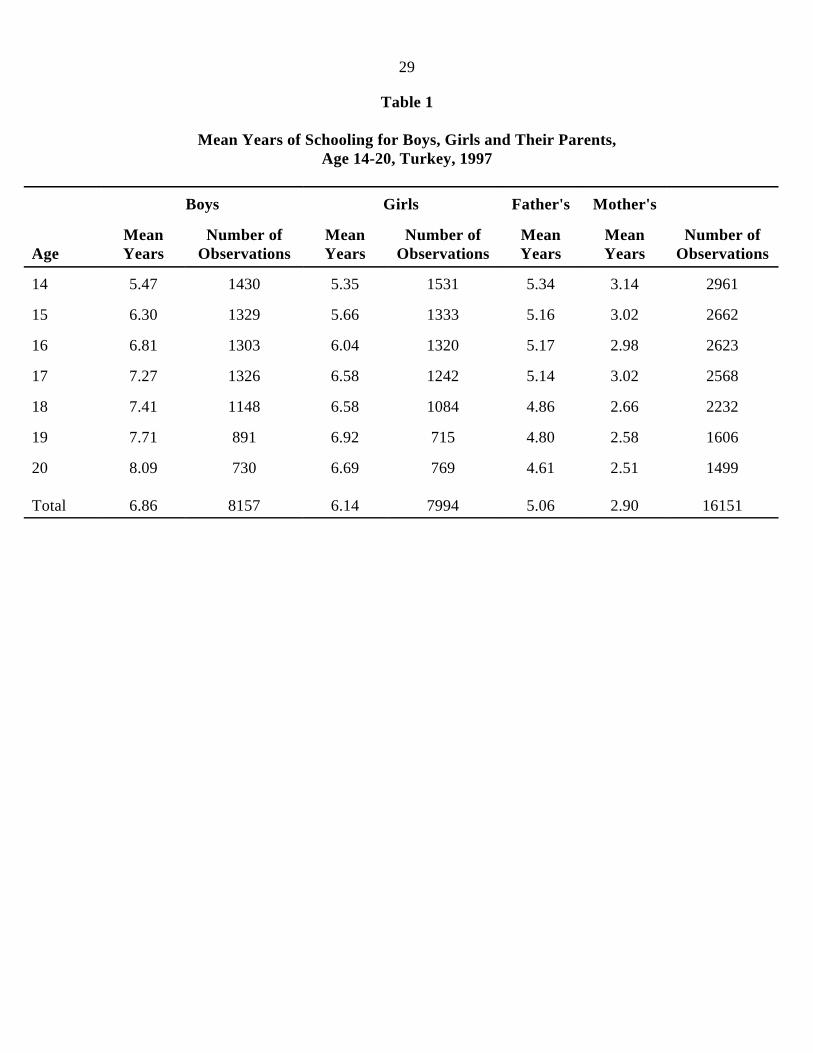
The mean years of schooling achieved by the children in the sample and by their
parents are given in Table 1. While the mean years of schooling is about the same for boys
and girls at age 14, the gender gap in achievement increases with age. By age 20 girls achieve
a year and a half less schooling than boys. Mothers achieve on average 2 years less schooling
than fathers. The difference between fathers' and mothers' years of schooling is more
pronounced than the difference between boys' and girls' years of schooling. This suggests that
9
there have been substantial improvements towards closing the gender gap recently. 19
Issue of Sample Randomness
For children who are enrolled in school at the time of the survey, final schooling
attainment is unknown. Such observations are right censored and could potentially bias the
estimates of the school attainment model. To circumvent this problem, estimation is carried20
out on different samples restricted to individuals above graduation ages from different levels
of schooling. For example, students starting primary school around the age of 6-7 will be at
least 12 years of age at completion. Therefore, in studying the determinants of primary school
completion, the sample is restricted to individuals age 14 years and over. Similarly, the
sample is restricted to individuals 16 years and over for studying the determinants of middle
school completion since a student completing three additional years will be at least 15 years
of age. Finally, for examining the determinants of high school completion the sample is
restricted to individuals 19-20 years.
The sample used in this study includes only the "children" in relation to the household
head. Indeed, the majority of the children in the sample were own children of the household
head and the spouse if present. However, in the household there were grandchildren and other
relatives in relation to the household head. Grandchildren were combined with the daughter-
in-laws in the household. Therefore, it was not possible to identify the grandchildren or their
parents since no information was collected on the marital status of the individuals. Further, it
was not possible to observe the parents' education of the "other relatives" in the household.
For this reason, the latter two groups are excluded and the sample is restricted only to the
children in relation to the household head. This exclusion may render the sample of children
non random and potentially bias the estimation results. Further, it is also possible and likely
that the children, grandchildren, and the other relatives are all considered differently by the
household in terms of the investments into their human capital. If this is the case, it
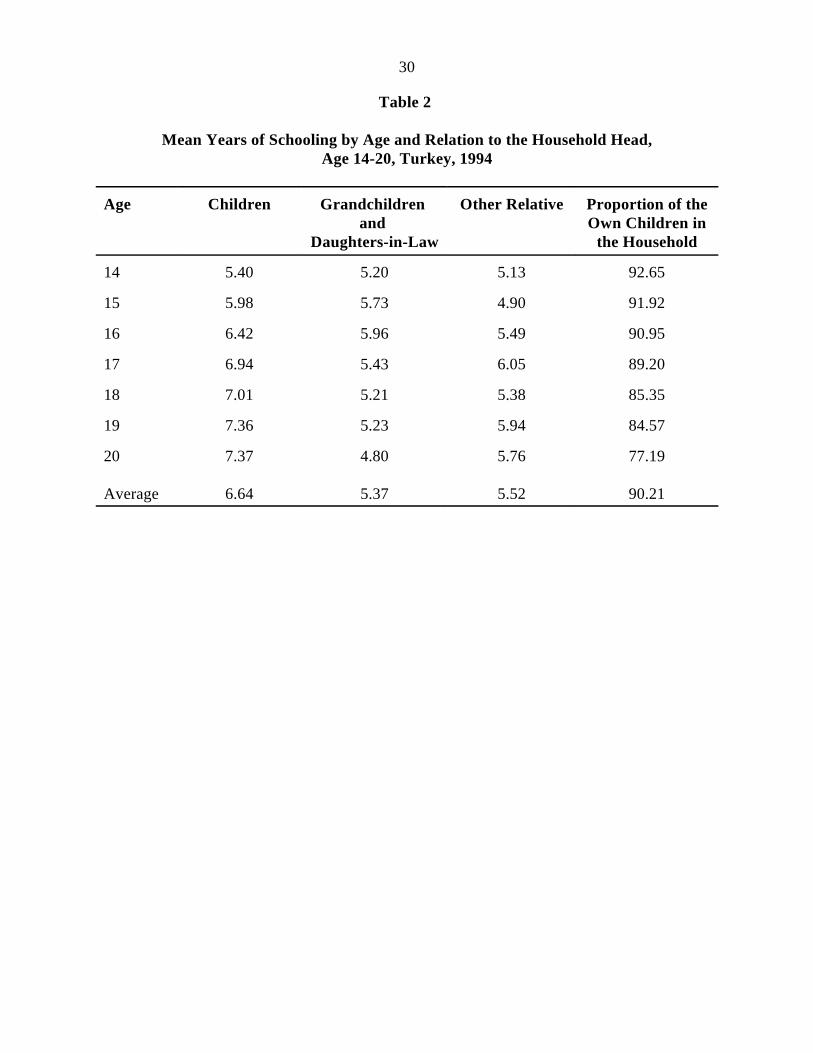
necessitates modeling their schooling separately. Table 2 shows the mean years of schooling
by age and relation to the household head for the 14-20 year olds. This table shows that the
mean years of schooling of the grandchild plus daughter-in-law and the other relative
categories are somewhat smaller than the mean years of schooling of the own children.

10
Another source of nonrandomness arises from the fact that children leave the
household of their parents after a certain age and therefore, those we observe still in the
household would be an unrepresentative sample. To investigate this issue, I computed the
proportion of the own children in the household by age. The last column of Table 2 shows
that the proportion of the own children in the household drops substantially after age 19.
Therefore, to preserve the representativeness, I restrict the sample to age 14-19 to study the
determinants of primary schooling and age 16-19 to study determinants of middle schooling.
For studying the determinants of high schooling the sample is restricted to 19-20 year olds
although in this case the inclusion of 20 year olds may compromise the representativeness of
the sample. The alternative of having only 19 year olds to study the determinants of high
school level resulted in too small a sample size.
V. Estimation Results
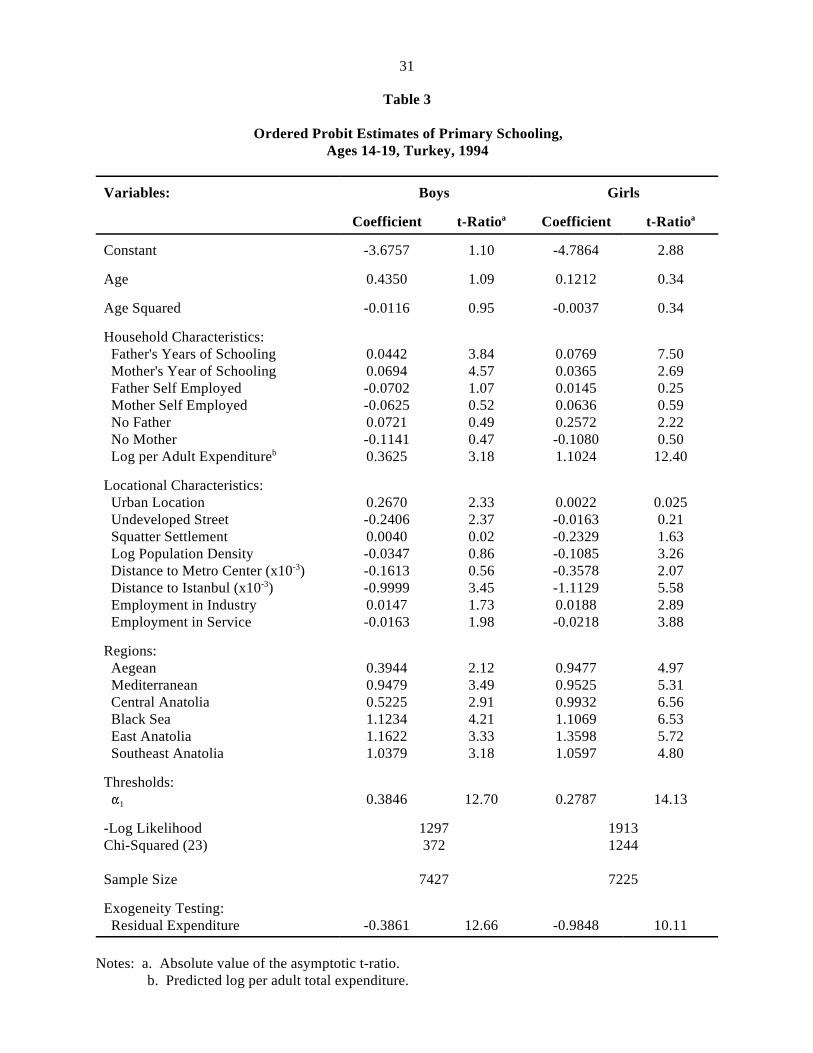
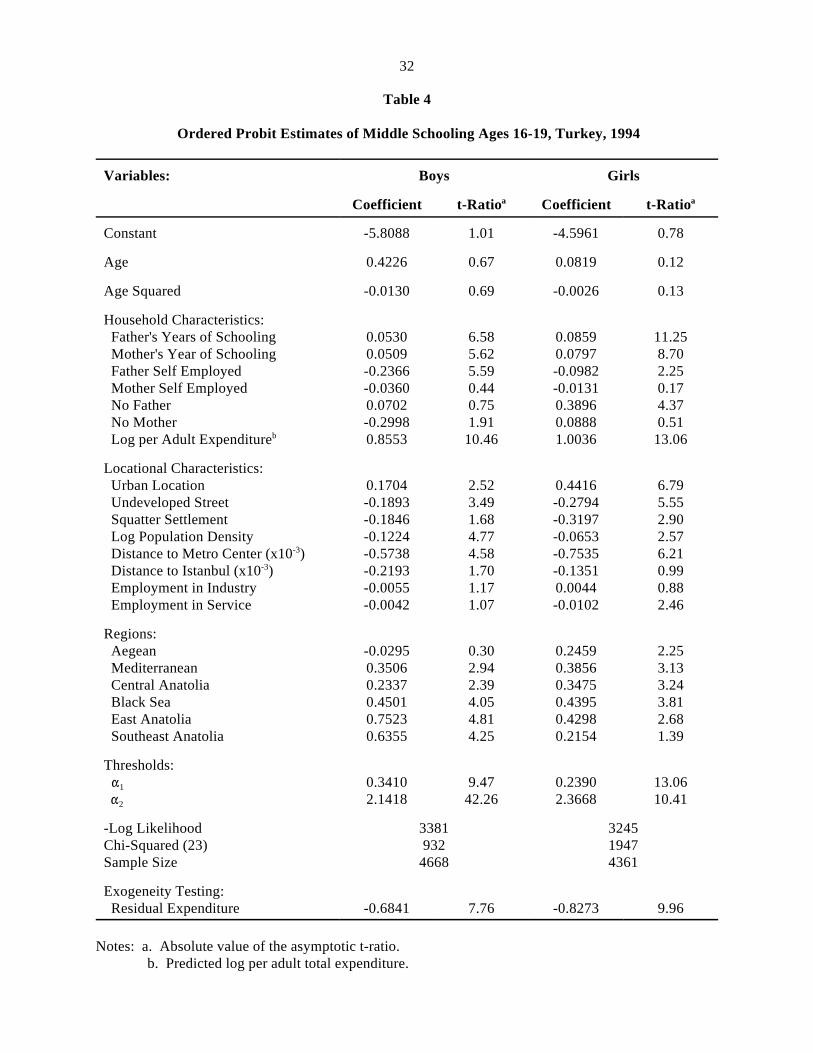
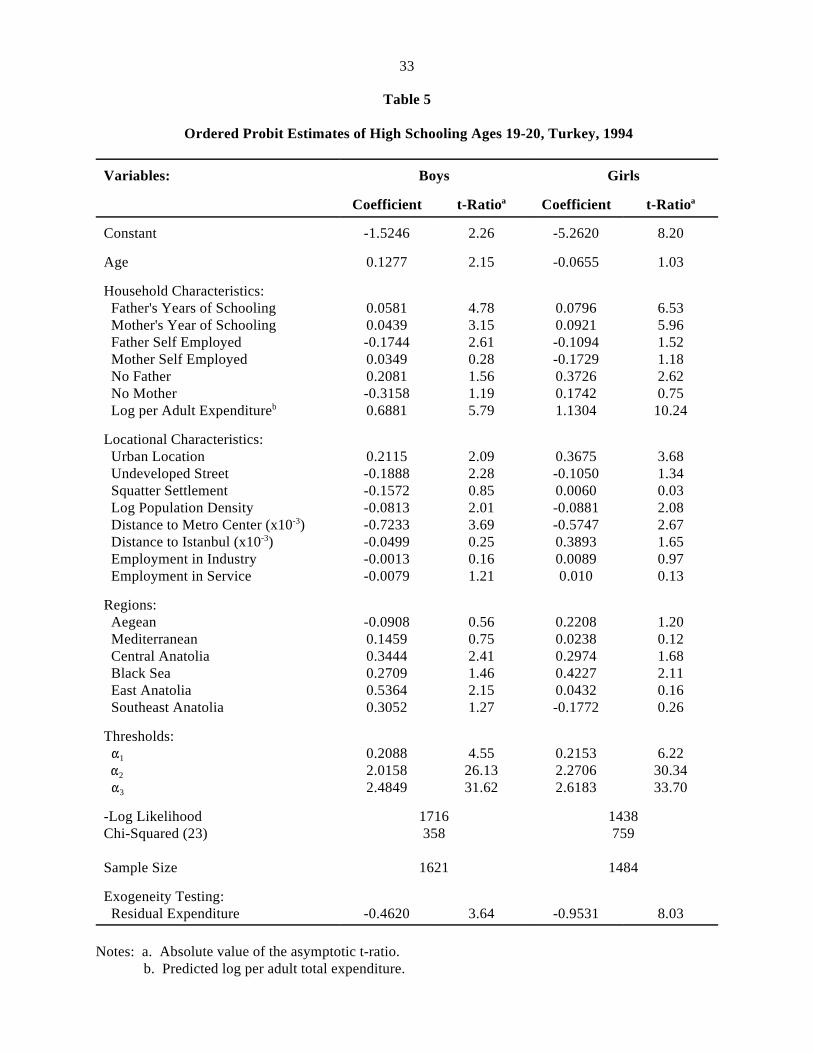
This section presents the maximum likelihood ordered probit estimates of determinants
of primary, middle and high schooling for boys and girls separately which are given
respectively, in Tables 3,4 and 5. Table 6 gives the marginal effects of the selected covariates
on the probability of attaining different levels of schooling computed using equation (1).
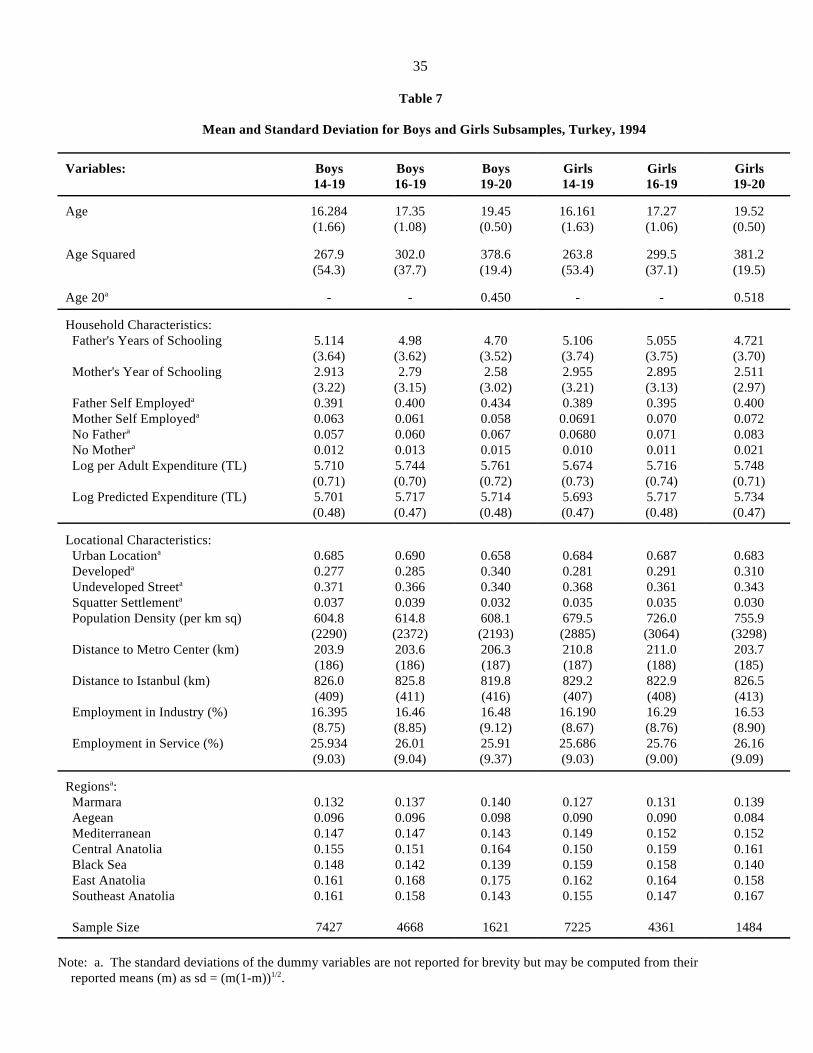
Table 7 shows the mean and standard deviation of the variables for different samples used in
the analysis.
Effects of Permanent Income
Per adult household expenditure is used as a proxy for household permanent income. 21
It may be correlated with the error terms in the schooling demand equations rendering
potentially biased estimates. Several factors may cause this possible endogeneity. Labor
supply decisions of the individuals and the savings decisions of the households which are
endogenous will cause total expenditures to be endogenous also. Exogeneity testing of the log
per adult total expenditure is performed using the suggestion of Rivers and Vuong (1988)
which is a version of the Hausman (1978) test. The test involved testing for significance the
coefficient estimate of the residuals included among the regressors of the schooling equations.
The residuals came from an auxiliary regression of the total expenditure on exogenous

11
variables and identifying instruments. The coefficient estimates on the residuals are22
presented in the last rows of the Tables 3-5. The null hypothesis of exogeneity of the total
expenditure was rejected strongly in all samples. Thus, in the ordered probit estimates of
schooling equations in Tables 3-5, predicted log per adult total expenditure is used. 23
Per adult expenditures have strongly significant positive effects on the schooling
achievement at all levels of schooling. Thus an increase in household permanent income
reduces the probability of an illiterate individual and increases the probability of higher
schooling achievements unambiguously in all the primary, middle and high school levels for
both boys and girls. The positive coefficient indicates that schooling is a normal good and the
growth in permanent income will increase the schooling achievement. It also indicates that
households were credit constrained and the credit constraints may be more important among
the poor. In all three levels of schooling, the coefficient estimate of the per adult expenditure
was much larger for girls than for boys implying that an increase in permanent income
contributes more to the probability of schooling achievement of girls than of boys. The
positive connection between household income and schooling of children is confirmed in a
number of studies (Behrman and Wolfe, 1984a; 1984b; Birdsall, 1985; Behrman et al. 1994;
Parish and Willis, 1995; Alderman et al., 1997).
Effects of Parents Education
The coefficient estimates on the father's and mother's years of schooling were all
positive and highly significant at the three levels of schooling considered. The results suggest
that an increase in the parents years of schooling unambiguously reduces the probability of
illiterate children and increases the probability of children's higher schooling achievements.
Further, in all samples, the effects of the both parents' schooling on the probability of their
daughters' achievement was larger than on their sons' achievement except for the mother’s
schooling at the primary level. Similar evidence on mother's schooling being more important
for the schooling of daughters than of sons is provided by Behrman and Wolfe (1984), King
and Lillard (1987), de Tray (1988), King and Bellew (1988), Lillard and Willis (1992), and
Behrman et al. (1994). Further, a test of the hypothesis of equality of the father's and mother's
schooling coefficients was not rejected at five percent level of significance in all samples
12
except at the primary level in the girls sample. On the other hand, the size of mother's
schooling coefficients in the girl's samples increased with the level of schooling implying
larger impact of mother's education on daughter's schooling at high school level than at the
primary level, while in the boy's samples parental education effects remained about the same
at different levels of schooling. Behrman and Wolfe (1987) in Nicaragua, King and Bellew
(1988) in Peru and Behrman and Sussungkarn (1987) in Thailand found that the effects of the
mother's and father's schooling on children's schooling achievements do not significantly
differ from each other. Mother's schooling is found to be more important than the father's
schooling in high-income countries (Schultz, 1993; Birdsall, 1985). Behrman (1997) provides
a survey of the effect of mother’s schooling on child education.
Effects of the Parents' Employment Status
For children who can work with their parents the opportunity cost of going to school
will be higher than those who can not. If the father or the mother have their own business,
this may facilitate the children's potential contribution to the household income. The dummy
variables indicating the self employment status of the parents are expected to measure the
effect of the alternative opportunities for children’s time. The effect of mother being self
employed was not statistically significant possibly due to the fact that there were very few self
employed mothers. However, the effect of father being self employed was negative and
statistically significant at the middle and high school levels for boys and at the middle school
level for girls. Since only a few women are self employed, it is clearly the son who is being
prepared to take over the father’s business, and this apparently involves apprenticeship
training more often than formal schooling. These results suggest that a father being self
employed unambiguously reduces the probability of his son continuing middle and high
school.24
Effects of Urban Location, School Availability and School Quality
The effect of an urban location was statistically significant in all samples except for
girls at the primary level. The positive coefficient signifies that residing in an urban area
unambiguously reduces the probability of becoming an illiterate individual and increases the
13
probability of receiving higher schooling. The significant coefficient estimates were much
larger for girls than for boys suggesting that urbanization contributes more to the probability
of schooling of girls than of boys.
The dummy variables indicating residence on an undeveloped street and a squatter
settlement were mostly insignificant at the primary level. At the middle school level they
were statistically significantly negative for both boys and girls with larger coefficient
estimates for girls. At the high school level only the coefficient estimate of undeveloped
street was statistically significantly negative for boys. The residence on an undeveloped street
or in a squatter settlement may mean unavailability of local middle and high schools. Thus,
the residence in these disadvantaged locations reduces the probability of schooling attainment.
The effect was larger for girls than for boys.
Population densities of the district clusters were used as an indicator of the availability
of schools and thus the costs of schooling. I expect better access to schooling in the densely
populated areas. This price variable was statistically significant but had the unexpected
negative sign for both boys and girls at the middle and high school levels. It was insignificant
at the primary school level for boys. It is also possible that the population density is
measuring the overcrowding at schools in the densely populated areas which would reduce
their quality.
In an attempt to control for the differences in school quality, student-teacher ratios are
computed at the primary, middle and high school levels for the districts and included among
the explanatory variables. The coefficient estimates on the student-teacher ratios were25
negative as expected but, statistically significant only at the primary school. This result
implies that an increase in student-teacher ratio (which is a decline in the school quality)
reduces probability of school attainment at the primary school level but has no significant
impact at the other levels. The coefficient estimates of all other variables were robust to the
inclusion of the student-teacher ratios. These results are not shown for brevity. 26
Migration Effects
The distance of a province to the regional metro center and to Istanbul were both
expected to capture the effects of migratory opportunities. The coefficients on distance to the
14
regional metro center were all negative and statistically significant except at the primary
school level for boys. The coefficient estimates on the distance to Istanbul were negative and
statistically significant except at the middle school level for girls and high school level for
boys. The negative coefficient estimates on distance to Istanbul continued to persist even27
when a dummy variable for Istanbul is included. (This result is not shown.) The results
suggest that easier migration possibilities increase schooling attainment by allowing
individuals to reap the higher rewards on schooling investments in an urban center than in a
rural area. It may also be that the modernizing influences spread from these urban areas,
changing the traditional attitudes of parents about schooling.
Effects of Local Employment Composition
During the past few decades the industrial composition of employment changed
markedly in Turkey with a reduction in the share of agriculture in favor of the industry and the
service sectors with a larger rate of growth in the service sector than in the industry. The28
provincial percentages of the employment in industry and in service sectors were included to
examine the effects of the local employment opportunities on schooling attainment. The
coefficient estimates on the employment in industry were mostly insignificant and were
positive when statistically significant implying that an increase in industrial employment will
reduce probability of becoming an illiterate individual and increase the probabilities of
receiving higher schooling. The percentage employed in services was insignificant in several
samples and had a negative sign when significant suggesting that an increase in the share of
service sector in local employment reduces the probability of receiving higher schooling. This
may be due to poor wage prospects in the service sector. Further, the service sector includes29
a heterogenous group of productive activities which may comprise higher skills options for
men than for women. This may be the reason for the lack of inducement for girls to go to
school to get service jobs.
15
Region Effects
Dummy variables for the six regions were included to take into account various
regional differentials that are not considered hitherto in the analysis. Marmara was the
reference region. All of the coefficient estimates were positive when statistically significant
suggesting, ceteris paribus, higher probability of schooling attainment in those regions as
compared to the Marmara region. This was a surprising result since Marmara is the most
developed region of the country with higher schooling attainments than the other regions. 30
Tunal (1996) also found that other regions had higher school enrollment probabilities than
Marmara with the 1994 child labor survey data.
Threshold Coefficients
The threshold coefficients were statistically significant at all three levels of schooling
for both boys and girls. They imply that for the same conditioning variables it is easier for
girls to get literacy but, the balance turns in favor of boys at the other levels: Boys surmount
the thresholds of primary and middle schools with greater probability than girls. For both
boys and girls the greatest hurdle seems to be graduating from the primary school. The
expected years of schooling at the high school level was 7.99 years for boys and 6.89 years for
girls.
VI. Conclusion
This paper examines the determinants of school attainment in Turkey. Ordered probit
models are estimated for the primary, middle and high school levels for boys and girls
separately. Schooling attainment was strongly related to household permanent income at the
three levels of schooling for both boys and girls indicating that schooling is a normal good and
that households are resource constrained in that higher incomes lead to higher schooling
attainments. Effect of income on schooling of girls was larger than that of boys in all three
schooling levels. This could be due to a taste effect as much as a more effective income
constraint for girls than for boys. Both the boys' and the girls' schooling were found to be
strongly related to their parents' education which may mean less intergenerational
socioeconomic mobility. Parental education effects were larger on girls' than on boys'
16
schooling. The stronger impact of parental education on girls' schooling suggests less social
mobility for girls than for boys. The test results indicated that the father's and the mother's
education coefficient estimates were not significantly different from each other in most
samples. The effect of father being self employed was negative at the middle and high school
levels for boys and at the middle school level for girls implying that the work opportunity
within the family business or the farm may be an alternative to schooling in particular for
boys.
Urban location was associated with significantly higher schooling attainments for both
boys and girls at most levels.. Undeveloped street or squatter settlements which could be
indicators of school availability were associated with lower schooling attainments in several
samples. Local population density may be measuring the overcrowding in schools in the
densely populated areas. It had a negative impact on the probability of schooling in all
samples.
The longer distances to the regional metro centers were associated with lower school
attainments for both boys and girls at the middle and high school levels. Distance to Istanbul
was also associated with lower schooling attainment at the primary school level for both boys
and girls.. These results suggest that easier migration possibilities or easier spread of modern
attitudes about schooling as measured by the propinquity to the regional metro centers or to a
mega center like Istanbul increases the probability of school attainments. The greater the
proportion of local employment in industry the higher the probability of schooling at the
primary level, but it was insignificant at higher levels. This suggests that households in the
industrializing communities tend to better educate their children than households in the
agricultural communities. The proportion of local employment in the service sector was
negatively associated with the probability of school attainment in some of the samples
particularly for women. This may imply that schooling is not rewarded as highly in the
service sector as compared to even agriculture.
In the future, income growth, increased parents' education, urbanization with
accompanying improvement in the availability of schools and industrialization will contribute
to increased schooling of the children, possibly more to girls' schooling than to boys'
schooling. These factors must be considered in planning to meet the demands for educating

17
the youth of the country, who constitute about one-third of the sixty-three million people of
Turkey.
18
Notes
1. The labor market, private return on investment in women's education in manydeveloping countries are significantly larger than those in men's education (Schultz,1995a). Deolalikar (1995) finds in Indonesia that although returns to women'sschooling is larger than men's, the school enrollment rates of boys is larger than girl's. Behrman and Deolalikar (1995) also find that returns for women's schooling is largerthan those for men's in Indonesia. Schultz (1995a) finds that returns to womenexceeded those to men for the last 15 years in Thailand but, women received two thirdsof the secondary schooling years of men. In Côte d'lvoire and Ghana while womenreceive only half as many years of schooling as men, the returns to men and womenare similar in Côte d'lvoire and the returns to women are higher at the middle schoollevel than to men in Ghana (Schultz, 1995a). Vijverberg (1995) finds in Côte d'lvoirethat labor market private returns to schooling favor women.
2. The seventh five year development plan has the goal of universal enrollments for theeight year schooling and 75 percent enrollment rate at high school level (SPO, 1995).
3. Some tuition fees are now being charged at the university level since 1988.4. These improvements took place in spite of the declines in the educational expenditures
during this period. Total public educational expenditures as percentage of GNPdeclined from 3.7 in 1965 to 2.8 in 1980 and 3.1 in 1990. Educational expenditures aspercentage of the total public budget declined from 19.4 in 1964 to 10.5 in 1980 and13.3 in 1990 (Tansel and Kazemi, 1995).
5. The increase in the secondary enrollment ratios in the 1990s was remarkable. Thetotal secondary enrollment rate was 51 percent (40 percent for females) in 1991 andincreased to 60 percent (50 percent for females) in 1992; a total of about 10 percentincrease in one year (World Bank, 1994; 1995). In 1991, Turkey's secondaryenrollment ratio lagged behind that of the average for Middle East and North Africancountries by about six percentage points (10 percentage points for females). It alsolagged behind that of the average for middle-income economies by about fivepercentage points (15 percentage points for females). Turkey seems to have caught upwith them in this respect in 1992. However, these secondary enrollment rates are farbehind those of OECD countries.
6. Egypt has higher total and female secondary enrollment rates than Turkey. These rateswere 80 and 73 percent respectively, in Egypt compared to 60 and 50 percentrespectively, in Turkey in 1992 (World Bank, 1995). However, since primaryschooling is compulsory in Turkey, the adult illiteracy rates are much lower in Turkeythan in Egypt. The adult illiteracy rates were 61 and 32 percent respectively, forfemales and males in Egypt compared to 28 and 8 percent in Turkey in 1995 (WorldBank, 1996).
7. Behrman and Rosenzweig (1994:149) state that the enrollment data from internationalsources "seem often to reflect opening day enrollments ..." and therefore, they wouldoverestimate the actual enrollment ratios. The survey based attendance figures theycompute for Malaysia indicate that official UNESCO figures overstate attendance forprimary schooling by about ten percent.
19
8. According to the same source, 86 percent of the middle school graduates continued onto high school in 1984.
9. There is no indicator of the enrollments and the gender differences at the middleschool level separately from the high school level. Sources give both together underthe title of "secondary enrollment ratio."
10. The 1994 Household budget survey data which is being used in this study does notallow a study of the determinants of tertiary level schooling, since children attendingtertiary level school do not live in their parents' household in general. Therefore, itwould not be possible to observe most of them in this household level data. Thosewho are observed in their parents' household would constitute an unrepresentative andnonrandom sample.
11. The university system expanded enormously since the early 1980s. Recently, thenumber of universities scattered around the country increased to 57 and theenrollments expanded in the 1990s, in particular at the distance university which nowaccounts for about half of the total tertiary level enrollments. There is excess demandfor the university education mainly due to high rates of return to schooling at this level(Tansel, 1994; Tansel, 1996). Vocational, technical and general high school graduatestake part in the competitive examination for a place at the university. In general, about20 percent of the participants of the two tier examinations gain admission to auniversity.
12. Alderman et al. (1987) discuss a number of circumstances which give rise to thepositive association between household income and demand for schooling of children.
13. Information about population density of the 220 districts (ilce) in the sample wasacquired from the 1990 Census of Population and merged with the individual levelsample data. Population density of a district is measured as the number of people perkilometer square in that district. Data are obtained from State Institute of Statistics(1993).
14. Distance to a metro center is the distance of each of the 58 provinces (il) in the samplefrom a regional metro center in each of the seven regions, measured in kilometers. This data are merged with the individual level sample data. A province in a region isselected as the metro center of that region as the province which received most internalin migration during 1985-1990 according to the State Institute of Statistics (1994a),Table 59_ Net migration and migration rate 1985-1990. The provinces that wereselected as metro center of a region were as follows. Istanbul in the Marmara region,Izmir in the Aegean region, Mersin in the Mediterranean region, Ankara in the CentralAnatolia, Samsun in the Black Sea region, Malatya in the Eastern region andGaziantep in the Southeastern region. The distance data are obtained from KarayollarGenel Müdürlü ü (1996).
15. Distance to Istanbul in kilometers in 1996 are measured for each of the 58 provinces inthe sample and merged with the individual level sample data. The data are obtainedfrom Karayollar Genel Müdürlü ü (1996).
16. Freeman (1986) classifies sectors such as finance, insurance and professional servicesas high education-intensive sectors; manufacturing, transportation, wholesale and retail
20
trade as intermediate education-intensive and agriculture, mining and construction asnon-education intensive.
17. Data on the sector of employment of the employed people in each of the 58 provincesin the sample are merged with the individual level sample data. They werepercentages of the total employed in industry and in service sectors in a province. Thedata are obtained from the State Institute of Statistics (1994a), Table 28_ Percentageof population by last week's economic activity and sex, 1990.
18. Interviews covered the 58 provinces out of the total of 76 provinces in the country. There were 281 clusters which were selected with stratified sampling.
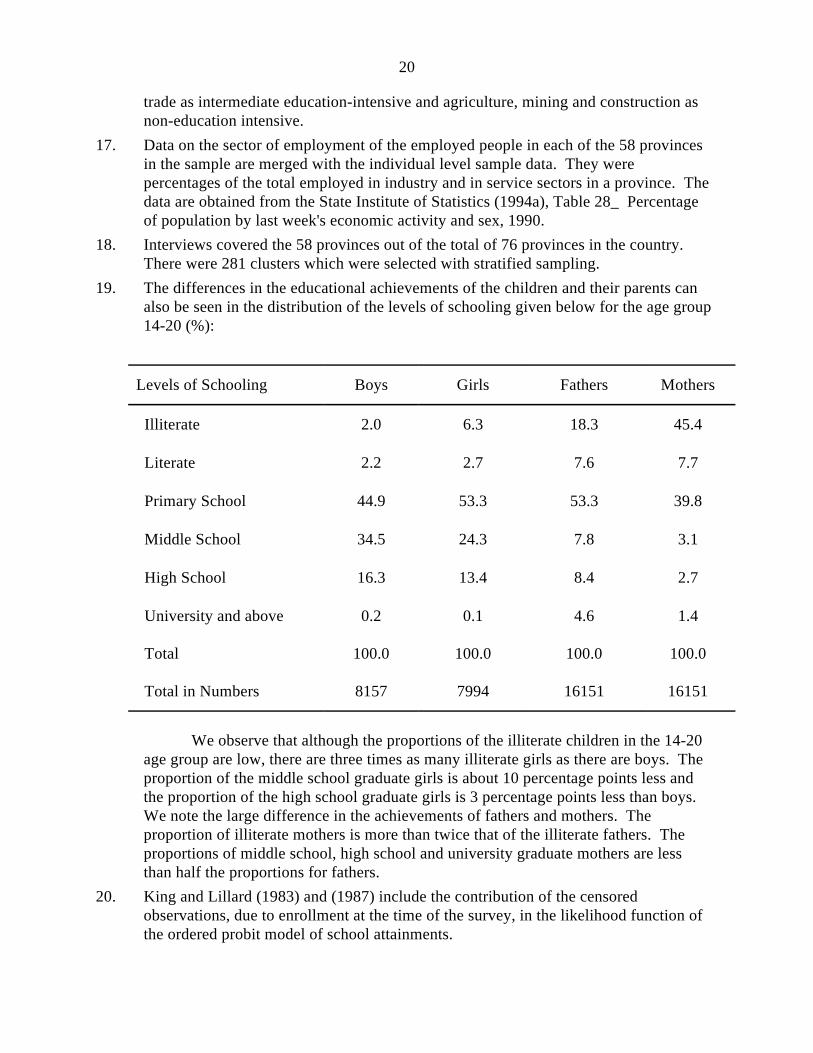
19. The differences in the educational achievements of the children and their parents canalso be seen in the distribution of the levels of schooling given below for the age group14-20 (%):
Levels of Schooling Boys Girls Fathers Mothers
Illiterate 2.0 6.3 18.3 45.4
Literate 2.2 2.7 7.6 7.7
Primary School 44.9 53.3 53.3 39.8
Middle School 34.5 24.3 7.8 3.1
High School 16.3 13.4 8.4 2.7
University and above 0.2 0.1 4.6 1.4
Total 100.0 100.0 100.0 100.0
Total in Numbers 8157 7994 16151 16151
We observe that although the proportions of the illiterate children in the 14-20age group are low, there are three times as many illiterate girls as there are boys. Theproportion of the middle school graduate girls is about 10 percentage points less andthe proportion of the high school graduate girls is 3 percentage points less than boys. We note the large difference in the achievements of fathers and mothers. Theproportion of illiterate mothers is more than twice that of the illiterate fathers. Theproportions of middle school, high school and university graduate mothers are lessthan half the proportions for fathers.
20. King and Lillard (1983) and (1987) include the contribution of the censoredobservations, due to enrollment at the time of the survey, in the likelihood function ofthe ordered probit model of school attainments.

21
21. Since the households were interviewed at different months throughout 1994 duringwhich the annual rate of inflation was about 90 percent the household total expenditureand unearned income figures were deflated by the local monthly consumer price index(CPI). Households in 16 major cities were assigned the monthly CPIs for those cities. Households in other locations were assigned either a rural or an urban monthly CPI forone of the five regions in which they are located according to whether they are in arural or an urban location. A location is considered urban if its population is over20,000. The base for the CPI figures was 1987. They were obtained from the StateInstitute of Statistics (1994b).
22. See note 23 for the list of identifying instruments.23. Log per adult expenditure is predicted using a number of identifying instruments such
as mother's age, father's age, number of adults, unearned rental income, unearnedinterest income, transfers from abroad and from the government, the decars of landowned, and the decars of orchard owned. These variables were individually andjointly significant in the prediction equation. The explanatory variables explained the43 percent of the total variation in log per adult household expenditure with an F valueof 240 with 38 and 11,961 degrees of freedom. The importance of having instrumentsthat explain a significant portion of the variation in the endogenous explanatoryvariable in the first-stage regression is emphasized by Nelson and Startz (1990),Staiger and Stock (1993) and Bound et al. (1993). Since the instruments listed aboveperformed quite well in predicting the log per adult total expenditure in the first-stageregression, inconsistency is not a likely problem in the estimates presented in Tables 3-5.
24. Child labor force participation is a problem among low-income families. Further,since only five years of primary level schooling was compulsory, children have beenentering the labor force at a younger age than in the OECD countries. Tunali (1996)reports that 7.4 percent of the children age 6-14 are engaged in market work whichresulted in cash or in kind income or they supplied unpaid family labor according tothe 1994 child labor survey.
25. The student-teacher ratios are computed at the three levels of schooling for the 220districts (ilçe) and merged with the individual level sample data. The data for thenumber of students and the number of teachers at each level of schooling in eachdistrict for the 1994-1995 academic year are obtained from State Institute of Statistics(1996b). In this case, since the student-teacher ratios are predicted on the basis ofdistrict averages, the standard errors are potentially biased downward. These could becorrected by a generalized White heteroscedasticity corrected estimator or by Huberstandard errors (Deaton, 1995).
26. Indicators of school quality are also used by Behrman et al. (1994) and Birdsall (1995).27. Per capita gross domestic product of Istanbul was US$ 3 111 in 1994 which was the
fifth largest among the provinces of Turkey. (State Institute of Statistics, 1996a). Istanbul draws large numbers of migrants from all over the country.
28. The percentage of the labor force in agriculture was 79 in 1960, declined to 53 in 1990while the percentage in industry increased from 11 in 1960 to 18 in 1990 and the

22
percentage in services increased from 10 in 1960 to 29 in 1990 (World Bank, 1984;1996).
29. OECD (1996) points out to the poor quality of the jobs in general.30. Marmara region generated the 35.6 percent of the gross domestic product of Turkey in
1987 prices (State Institute of Statistics, 1996a).

23
References
Alderman, H., J.R. Behrman, S. Khan, D.R. Ross and R. Sabot (1997). The Income Gap inCognitive Skills in Rural Pakistan, Economic Development and Cultural Change46(1):97-122.
Becker, G.S. (1965). A Theory of the Allocation of Time, Economic Journal 75:493-517.
(1975). Human Capital: A Theoretical and Empirical Analysis with Special Referenceto Education, Second Edition, New York: National Bureau of Economic Research.
(1991). A Treatise on the Family. Cambridge, MA: Harvard University Press.
Becker, G.S. and H.G. Lewis (1973). On the Interaction Between the Quantity and Quality ofChildren, Journal of Political Economy 81(2):S279-S288.
Becker, G.S. and N. Tomes (1976). Child Endowments and the Quantity and Quality ofChildren, Journal of Political Economy, 84(4/2):S143-S162.
(1979). An Equilibrium Theory of the Distribution of Income and IntergenerationalMobility, Journal of Political Economy, 87(6):1153-1189.
Behrman, J.R. (1990). Women's Schooling and Nonmarket Productivity: A Survey and aReappraisal. Processed. University of Pennsylvania, Philadelphia.
(1997). Mother’s Schooling and Child Education: A Survey, Processed. University ofPennsylvania, Philadelphia, PA.
Behrman, J.R. and A. B. Deolalikar (1995). Are There Differential Returns to Schooling byGender? The Case of Indonesian Labor Markets, Oxford Bulletin of Economics andStatistics, 57 (1): 97-117.
Behrman, J.R., M. Ii and D. Murillo (1994). How Family and Individual CharacteristicsAffect Schooling Demands in Urban Bolivia: Multiple Schooling Indicators,Unobserved Community Effects, Nonlinearities and Interactions. Processed,University of Pennsylvania, Philadelphia.
Behrman, J.R. and M.R. Rosenzweig (1994). Caveat Emptor: Cross-Country Data onEducation and the Labor Force, Journal of Development Economics , 44(2):147-171.
Behrman, J.R. and C. Sussangkarn (1989). Parental Schooling and Child Outcomes: Motherversus Father, Schooling Quality and Interactions. Processed. University ofPennsylvania, Philadelphia.
24
Behrman, J.R. and B.L. Wolfe (1984a). The Socioeconomic Impact of Schooling in aDeveloping Economy, Review of Economics and Statistics , 66(2):296-303.
(1984b). Who Is Schooled in Developing Countries? The Role of Income, ParentalSchooling, Sex, Residence and Family Size, Economics of Education Review, 3(3):231-245.
, (1987). Investment in Schooling in Two Generations in Pre-Revolutionary Nicaragua: The Roles of Family Background and School Supply, Journal of DevelopmentEconomics, 27:395-419.
Birdsall, N. (1985). Public Inputs and Child Schooling in Brazil, Journal of DevelopmentEconomics, 18(1):67-86.
Bound, J.D., A. Jaeger and R. Baker (1993). The Cure can be Worse than the Disease: ACautionary Tale Regarding the Instrumental Variables. NBER Technical Paper No.137. Cambridge, MA.
Deolalikar, A.B. (1995). Gender Differences in the Returns to Schooling and in SchoolEnrollment Rates in Indonesia. In Investment in Women's Human Capital , ed. T.P.Schultz, Chicago: The University of Chicago Press.
Deaton, A. (1995). Data and Econometric Tools for Development Analysis, Handbook ofDevelopment Economics Vol. 3, J. Behrman and T. N. Srinivasan (eds.), Amsterdam:Elsevier Science B.V.
de Tray, D. (1988). Government Policy, Household Behavior and the Distribution ofSchooling: A Case Study of Malaysia. In Research in Population Economics: AResearch Annual, Vol. 5, ed. T.P. Schultz, Greenwich, CT: JAI Press, 303-336.
Freeman, R. B. (1986). Demand for Education. In Handbook of Labor Economics, Vol. I, eds.O. Ashenfelter and R. Layard, Amsterdam: North-Holland, 357-386.
Hausman, J.A. (1978). Specification Tests in Econometrics, Econometrica, 46:931-959.
Haveman, R. and B. Wolfe (1984). Education and Being: The Role of Nonmarket Effects,Journal of Human Resources, 19(4): 377-407.
Karayollar Genel Müdürlü ü (Directorate of Highways) (1996). Karayollar Haritas Cetveli
(Map of Highways), Ankara: Karayollar Genel Müdürlü ü.
King, E. M. and M. A. Hill (eds.) (1993). Women's Education in Developing Countries:Barriers, Benefits and Policies, Baltimore: The Johns Hopkins University Press for theWorld Bank.

25
King, E.M. and R. Bellew (1988). Education Policy and Schooling Levels in Pern,Washington, D.C.: Processed. The World Bank.
King, E.M. and L.A. Lillard (1983). Determinants of Schooling Attainment and EnrollmentRates in the Philippines, A Rand Note, Santa Monica: Rand Corporation.
(1987). Education Policy and Schooling Attainment in Malaysia and the Philippines,Economics of Education Review, 6(2):167-181.
Lavy, V. (1996). School Supply Constraints and Children's Educational Outcomes in RuralGhana, Journal of Development Economics , 51(2):291-314.
Leibowitz, A. (1974). Home Investments in Children. In Economics of the Family, ed. T.W.Schultz, Chicago: The University of Chicago Press.
Lillard, L.A. and R.J. Willis (1994). Intergenerational Educational Mobility: Effects ofFamily and State in Malaysia. Journal of Human Resources, 29(4): 1126-1166.
Maddala, G.S. (1983). Limited Dependent and Qualitative Variables in Econometrics . Cambridge: Cambridge University Press.
Mincer, J. (1958). Investment, Human Capital and Personal Income Distribution, Journal ofPolitical Economy, 66(1):281-321.
(1974). Schooling Experience and Earnings . New York: National Bureau ofEconomic Research.
Nelson, C.R. and R. Startz (1990). The Distribution of the Instrumental Variables Estimatorand its t-Ratio When the Instrument Is a Poor One, Journal of Business, 63(1-2):S125-S140.
Organization for Economic Cooperation and Development (OECD) (1996). OECD EconomicSurveys, Turkey, 1996, Paris: OECD.
Parish, W.L. and R.J. Willis (1995). Daughters, Education and Family Budgets: TaiwanExperiences. In Investments in Women's Human Capital , ed. T.P. Schultz, Chicago: The University of Chicago Press.
Rivers, D. and Q.H. Vuong (1988). Limited Information Estimators and Exogeneity Tests forSimultaneous Probit Models, Journal of Econometrics, 39:347-366.

26
Rosenzweig, M. and T.P. Schultz (1982). Market Opportunities, Genetic Endowments andIntrafamily Resource Distribution: Child Survival in Rural India, American EconomicReview, 72(4):808-815.
Schultz, T.P. (1988). Education Investment and Returns. In Handbook of DevelopmentEconomics, Vol. 1, eds. H. Chenery and T.N. Srinivasan, Amsterdam: ElsevierScience Publishers.
(1993). Returns to Women's Education. In Women's Education in DevelopingCountries: Barriers, Benefits and Policies , eds. E.M. King and M.A. Hill, Baltimoreand London: The Johns Hopkins University Press for the World Bank, pp. 51-99.
(1995a). Investments in the Schooling and Health of Women and Men: Quantities andReturns. In Investment in Women's Human Capital , ed. T.P. Schultz, Chicago: TheUniversity of Chicago Press.
(1995b). The Economics of Women's Schooling. In The Politics of Women'sSchooling: Perspectives from Asia, Africa and Latin America , eds. J.K. Conway andS.C. Bourque. Ann Arbor: The University of Michigan Press.
Schultz, T.P. and Y. Zeng (1995). Fertility of Rural China: Effects of Local Family Planningand Health Programs, Journal of Population Economics, 8(4):329-350.
Schultz, T.W. (1960). Capital Formation by Education, Journal of Political Economy,68(12):571-583.
(1963). The Economic Value of Education. New York: Columbia University Press.
(1974). Economics of the Family. Chicago: University of Chicago Press. (1975). The Value of the Ability to Deal with Disequilibria, Journal of Economic
Literature, 13(3):827-846.
Staiger, D. and J.H. Stock (1993). Instrumental Variables Regression with Weak Instruments,Econometrica, 65(3): 557-586.
State Institute of Statistics (SIS) (1993). 1990 Population Census: Social and EconomicCharacteristics of the Population, Ankara: SIS.
(1994a). l ve Bölge Istatistikleri (Provincial and Regional Statistics), Ankara: SIS.
27
(1994b). Monthly Bulletin of Statistics, Ankara: SIS.
(1996a). Haber Bülteni (Newsletter), April 4, 1996, Ankara: SIS.
(1996b). National Education Statistics, 1994-1995 , Data Diskettes. Ankara: SIS.
State Planning Organization (SPO) (1995). Seventh Five Year Development Plan, 1995-2000 ,Ankara: SPO.
Tansel, A. (1994). Wage Employment and Returns to Education for Men and Women inTurkey, Economics of Education Review, 13(4):305-320.
(1996). Self Employment, Wage Employment and Returns to Education for Urban Menand Women in Turkey. In Education and the Labor Market in Turkey: ed. T. Bulutay,Ankara: State Institute of Statistics.
(1997). School Attainment, Parental Education and Gender in Côte d'Ivoire and Ghana,Economic Development and Cultural Change , 45(4):825-856.
Tansel, A. and N.D. Güngör (1996). The Educational Attainment of the Turkey's LaborForce: A Comparison Across Provinces and Over Time, Economic Research ForumWorking Paper No. 9706. Cairo: ERF.
Tansel, A. and A. Kazemi (1995). Equity in Educational Expenditures in the Middle East andNorth Africa, Economic Research Forum Working Paper No. 9628. Cairo: ERF.
Tunal , I. (1996). Education and Work: Experience of 6-14 Year Old Children in Turkey. InEducation and the Labour Market in Turkey, ed. T. Bulutay, Ankara: State Institute ofStatistics.
Türkiye Sanayicileri ve adamlar Derne i (TÜS AD) (1990). Türkiyede E itim, Sorunlarve De i ime Yap sal Uyum Önerileri (Education in Turkey: Problems and Proposalsfor Structural Adjustment to Change), Istanbul: TÜSIAD.
UNESCO (1991). World Education Report, Paris: UNESCO.
UNICEF-Turkey (1994). For a Better Child in Turkey, Turkey's Mid-Decade Goals, Adum-19/A, Ankara: UNICEF-Turkey.

28
Vijverberg, W.P.M. (1995). Educational Investments and Returns for Women and Men inCôte d'Ivoire. In Investment in Women's Human Capital , ed. T.P. Schultz, Chicago: The University of Chicago Press.
World Bank (1984). World Development Report 1984, Washington, D.C.: Oxford UniversityPress.
(1994). World Development Report 1994, Washington, D.C.: Oxford University Press.
(1995). World Development Report 1995, Washington, D.C.: Oxford University Press.
(1996). World Development Report 1996, Washington, D.C.: Oxford University Press.
(1997). World Development Report 1997, Washington, D.C.: Oxford University Press.
29
Table 1
Mean Years of Schooling for Boys, Girls and Their Parents,Age 14-20, Turkey, 1997
Boys Girls Father's Mother's
Age Years Observations Years Observations Years Years ObservationsMean Number of Mean Number of Mean Mean Number of
14 5.47 1430 5.35 1531 5.34 3.14 2961
15 6.30 1329 5.66 1333 5.16 3.02 2662
16 6.81 1303 6.04 1320 5.17 2.98 2623
17 7.27 1326 6.58 1242 5.14 3.02 2568
18 7.41 1148 6.58 1084 4.86 2.66 2232
19 7.71 891 6.92 715 4.80 2.58 1606
20 8.09 730 6.69 769 4.61 2.51 1499
Total 6.86 8157 6.14 7994 5.06 2.90 16151
30
Table 2
Mean Years of Schooling by Age and Relation to the Household Head,Age 14-20, Turkey, 1994
Age Children Grandchildren Other Relative Proportion of theand Own Children in
Daughters-in-Law the Household
14 5.40 5.20 5.13 92.65
15 5.98 5.73 4.90 91.92
16 6.42 5.96 5.49 90.95
17 6.94 5.43 6.05 89.20
18 7.01 5.21 5.38 85.35
19 7.36 5.23 5.94 84.57
20 7.37 4.80 5.76 77.19
Average 6.64 5.37 5.52 90.21
31
Table 3
Ordered Probit Estimates of Primary Schooling,Ages 14-19, Turkey, 1994
Variables: Boys Girls
Coefficient t-Ratio Coefficient t-Ratioa a
Constant -3.6757 1.10 -4.7864 2.88
Age 0.4350 1.09 0.1212 0.34
Age Squared -0.0116 0.95 -0.0037 0.34
Household Characteristics: Father's Years of Schooling 0.0442 3.84 0.0769 7.50 Mother's Year of Schooling 0.0694 4.57 0.0365 2.69 Father Self Employed -0.0702 1.07 0.0145 0.25 Mother Self Employed -0.0625 0.52 0.0636 0.59 No Father 0.0721 0.49 0.2572 2.22 No Mother -0.1141 0.47 -0.1080 0.50 Log per Adult Expenditure 0.3625 3.18 1.1024 12.40b
Locational Characteristics: Urban Location 0.2670 2.33 0.0022 0.025 Undeveloped Street -0.2406 2.37 -0.0163 0.21 Squatter Settlement 0.0040 0.02 -0.2329 1.63 Log Population Density -0.0347 0.86 -0.1085 3.26 Distance to Metro Center (x10 ) -0.1613 0.56 -0.3578 2.07-3
Distance to Istanbul (x10 ) -0.9999 3.45 -1.1129 5.58-3
Employment in Industry 0.0147 1.73 0.0188 2.89 Employment in Service -0.0163 1.98 -0.0218 3.88
Regions: Aegean 0.3944 2.12 0.9477 4.97 Mediterranean 0.9479 3.49 0.9525 5.31 Central Anatolia 0.5225 2.91 0.9932 6.56 Black Sea 1.1234 4.21 1.1069 6.53 East Anatolia 1.1622 3.33 1.3598 5.72 Southeast Anatolia 1.0379 3.18 1.0597 4.80
Thresholds: 0.3846 12.70 0.2787 14.131
-Log Likelihood 1297 1913Chi-Squared (23) 372 1244
Sample Size 7427 7225
Exogeneity Testing: Residual Expenditure -0.3861 12.66 -0.9848 10.11
Notes: a. Absolute value of the asymptotic t-ratio. b. Predicted log per adult total expenditure.
32
Table 4
Ordered Probit Estimates of Middle Schooling Ages 16-19, Turkey, 1994
Variables: Boys Girls
Coefficient t-Ratio Coefficient t-Ratioa a
Constant -5.8088 1.01 -4.5961 0.78
Age 0.4226 0.67 0.0819 0.12
Age Squared -0.0130 0.69 -0.0026 0.13
Household Characteristics: Father's Years of Schooling 0.0530 6.58 0.0859 11.25 Mother's Year of Schooling 0.0509 5.62 0.0797 8.70 Father Self Employed -0.2366 5.59 -0.0982 2.25 Mother Self Employed -0.0360 0.44 -0.0131 0.17 No Father 0.0702 0.75 0.3896 4.37 No Mother -0.2998 1.91 0.0888 0.51 Log per Adult Expenditure 0.8553 10.46 1.0036 13.06b
Locational Characteristics: Urban Location 0.1704 2.52 0.4416 6.79 Undeveloped Street -0.1893 3.49 -0.2794 5.55 Squatter Settlement -0.1846 1.68 -0.3197 2.90 Log Population Density -0.1224 4.77 -0.0653 2.57 Distance to Metro Center (x10 ) -0.5738 4.58 -0.7535 6.21-3
Distance to Istanbul (x10 ) -0.2193 1.70 -0.1351 0.99-3
Employment in Industry -0.0055 1.17 0.0044 0.88 Employment in Service -0.0042 1.07 -0.0102 2.46
Regions: Aegean -0.0295 0.30 0.2459 2.25 Mediterranean 0.3506 2.94 0.3856 3.13 Central Anatolia 0.2337 2.39 0.3475 3.24 Black Sea 0.4501 4.05 0.4395 3.81 East Anatolia 0.7523 4.81 0.4298 2.68 Southeast Anatolia 0.6355 4.25 0.2154 1.39
Thresholds: 0.3410 9.47 0.2390 13.061
2.1418 42.26 2.3668 10.41 2
-Log Likelihood 3381 3245Chi-Squared (23) 932 1947Sample Size 4668 4361
Exogeneity Testing: Residual Expenditure -0.6841 7.76 -0.8273 9.96
Notes: a. Absolute value of the asymptotic t-ratio. b. Predicted log per adult total expenditure.
33
Table 5
Ordered Probit Estimates of High Schooling Ages 19-20, Turkey, 1994
Variables: Boys Girls
Coefficient t-Ratio Coefficient t-Ratioa a
Constant -1.5246 2.26 -5.2620 8.20
Age 0.1277 2.15 -0.0655 1.03
Household Characteristics: Father's Years of Schooling 0.0581 4.78 0.0796 6.53 Mother's Year of Schooling 0.0439 3.15 0.0921 5.96 Father Self Employed -0.1744 2.61 -0.1094 1.52 Mother Self Employed 0.0349 0.28 -0.1729 1.18 No Father 0.2081 1.56 0.3726 2.62 No Mother -0.3158 1.19 0.1742 0.75 Log per Adult Expenditure 0.6881 5.79 1.1304 10.24b
Locational Characteristics: Urban Location 0.2115 2.09 0.3675 3.68 Undeveloped Street -0.1888 2.28 -0.1050 1.34 Squatter Settlement -0.1572 0.85 0.0060 0.03 Log Population Density -0.0813 2.01 -0.0881 2.08 Distance to Metro Center (x10 ) -0.7233 3.69 -0.5747 2.67-3
Distance to Istanbul (x10 ) -0.0499 0.25 0.3893 1.65-3
Employment in Industry -0.0013 0.16 0.0089 0.97 Employment in Service -0.0079 1.21 0.010 0.13
Regions: Aegean -0.0908 0.56 0.2208 1.20 Mediterranean 0.1459 0.75 0.0238 0.12 Central Anatolia 0.3444 2.41 0.2974 1.68 Black Sea 0.2709 1.46 0.4227 2.11 East Anatolia 0.5364 2.15 0.0432 0.16 Southeast Anatolia 0.3052 1.27 -0.1772 0.26
Thresholds: 0.2088 4.55 0.2153 6.221
2.0158 26.13 2.2706 30.34 2
2.4849 31.62 2.6183 33.703
-Log Likelihood 1716 1438Chi-Squared (23) 358 759
Sample Size 1621 1484
Exogeneity Testing: Residual Expenditure -0.4620 3.64 -0.9531 8.03
Notes: a. Absolute value of the asymptotic t-ratio.b. Predicted log per adult total expenditure.

34
Table 6
Marginal Effects of Mother’s and Father’s Schooling and Income (x 100)__________________________________________________________________________________
Primary School Middle School High SchoolBoys Girls Boys Girls Boys Girls
14-19 14-19 16-19 16-19 19-20 19-20__________________________________________________________________________________Father’s Schooling:
Illiterate -.09 -.34 -0.0 -.05 -.17 -.43Literate -.13 -.25 -.00 -.04 -.10 -.22Primary School .22 .59 -.001 -2.83 -1.97 -2.51Middle School - - .001 2.92 -.05 .43High School - - - - 2.28 2.72
Mother’s Schooling:Illiterate -.15 -.16 -.00 -.04 -.12 -.49Literate -.20 -.12 -.00 -.04 -.07 -.25Primary School .35 .28 -.001 -2.61 -1.46 -2.88Middle School - - .001 2.69 -.04 .49High School - - - - 1.69 3.12
Income:Illiterate -.77 -4.88 -.00 -.51 -1.98 -5.73Literate -.1.04 -3.54 -.00 -.49 -1.15 -2.90Primary School 1.81 8.42 -.01 -32.17 -23.48 -33.66Middle School - - .01 33.18 -.60 5.77High School - - - - 27.20 36.52
Sample Size 7427 7225 4668 4361 1621 1484__________________________________________________________________________________
35
Table 7
Mean and Standard Deviation for Boys and Girls Subsamples, Turkey, 1994
Variables: Boys Boys Boys Girls Girls Girls14-19 16-19 19-20 14-19 16-19 19-20
Age 16.284 17.35 19.45 16.161 17.27 19.52(1.66) (1.08) (0.50) (1.63) (1.06) (0.50)
Age Squared 267.9 302.0 378.6 263.8 299.5 381.2(54.3) (37.7) (19.4) (53.4) (37.1) (19.5)
Age 20 - - 0.450 - - 0.518a
Household Characteristics: Father's Years of Schooling 5.114 4.98 4.70 5.106 5.055 4.721
Mother's Year of Schooling 2.913 2.79 2.58 2.955 2.895 2.511
Father Self Employed 0.391 0.400 0.434 0.389 0.395 0.400a
Mother Self Employed 0.063 0.061 0.058 0.0691 0.070 0.072a
No Father 0.057 0.060 0.067 0.0680 0.071 0.083a
No Mother 0.012 0.013 0.015 0.010 0.011 0.021a
Log per Adult Expenditure (TL) 5.710 5.744 5.761 5.674 5.716 5.748 (0.71) (0.70) (0.72) (0.73) (0.74) (0.71) Log Predicted Expenditure (TL) 5.701 5.717 5.714 5.693 5.717 5.734
(3.64) (3.62) (3.52) (3.74) (3.75) (3.70)
(3.22) (3.15) (3.02) (3.21) (3.13) (2.97)
(0.48) (0.47) (0.48) (0.47) (0.48) (0.47)
Locational Characteristics: Urban Location 0.685 0.690 0.658 0.684 0.687 0.683a
Developed 0.277 0.285 0.340 0.281 0.291 0.310a
Undeveloped Street 0.371 0.366 0.340 0.368 0.361 0.343a
Squatter Settlement 0.037 0.039 0.032 0.035 0.035 0.030a
Population Density (per km sq) 604.8 614.8 608.1 679.5 726.0 755.9
Distance to Metro Center (km) 203.9 203.6 206.3 210.8 211.0 203.7
Distance to Istanbul (km) 826.0 825.8 819.8 829.2 822.9 826.5
Employment in Industry (%) 16.395 16.46 16.48 16.190 16.29 16.53
Employment in Service (%) 25.934 26.01 25.91 25.686 25.76 26.16 (9.03) (9.04) (9.37) (9.03) (9.00) (9.09)
(2290) (2372) (2193) (2885) (3064) (3298)
(186) (186) (187) (187) (188) (185)
(409) (411) (416) (407) (408) (413)
(8.75) (8.85) (9.12) (8.67) (8.76) (8.90)
Regions :a
Marmara 0.132 0.137 0.140 0.127 0.131 0.139 Aegean 0.096 0.096 0.098 0.090 0.090 0.084 Mediterranean 0.147 0.147 0.143 0.149 0.152 0.152 Central Anatolia 0.155 0.151 0.164 0.150 0.159 0.161 Black Sea 0.148 0.142 0.139 0.159 0.158 0.140 East Anatolia 0.161 0.168 0.175 0.162 0.164 0.158 Southeast Anatolia 0.161 0.158 0.143 0.155 0.147 0.167
Sample Size 7427 4668 1621 7225 4361 1484
Note: a. The standard deviations of the dummy variables are not reported for brevity but may be computed from their reported means (m) as sd = (m(1-m)) .1/2