Embed Size (px)
Citation preview

Determinants of Automobile Demand and Implications for Hybrid-Electric Market Penetration
Sruthi M. Thatchenkery*
Professor Arie Beresteanu, Faculty Advisor
Honors Thesis submitted in partial fulfillment of the requirements for Graduation with
Distinction in Economics in Trinity College of Duke University
Duke University
Durham, North Carolina
2008
* I would like to thank my advisor, Dr. Arie Beresteanu, whose guidance was essential to the design and execution of this study. I would also like to thank Dr. Michelle Connolly, Dr. Edward Tower, and the students in the economics honors seminar, for their continuous advice and suggestions for improvement.
Abstract This paper investigates market receptivity to hybrid-electric vehicles by using cross-sectional data on vehicle registrations to estimate demand functions for the overall market, the hybrid market, and specialized vehicle segments. Each specification features intrinsic product attributes such as fuel efficiency and horsepower, while the hybrid specification also includes external influences on demand, such as government incentives, demographics, and environmentalism. I find that a preference for greater fuel efficiency is fairly consistent across most markets, but is typically overshadowed by stronger affinities for horsepower and weight. Certain external influences, such as convenience-based incentives and environmentalism, boost explanatory power but do not outweigh the effects of vehicle attributes.
2
I. Introduction
Although the concept dates back to 1901, when Ferdinand Porsche designed the
Mixte series-hybrid, automotive hybrid technology did not gain traction in the consumer
market until the introduction of the Honda Insight and the Toyota Prius at the turn of the
millennium. In the midst of escalating concerns about the dangers of greenhouse gas
emissions, environmentalists hailed the superior fuel economy and wide range of the
hybrid-electric engine as a critical breakthrough that could help save the environment
without inconveniencing consumers. Other major automakers quickly followed Honda
and Toyota’s lead in an attempt to cash in on what many saw as the future of
transportation, while US policymakers at the local, state, and federal level jumped on the
bandwagon by offering varied incentives for residents that purchased a hybrid vehicle,
ranging from free parking to tax rebates.
Eight years after the introduction of the first hybrid-electric vehicle to the United
States, however, little scholarly work has been done on consumer demand for hybrids.
Moreover, that which exists is based on first-generation hybrids and thus is already out of
date. This study aims to fill the gap by using data on US vehicle registrations from 2006
to estimate demand functions for automobiles in the context of the overall market, the
hybrid market, and specialized vehicle segments. I then use those results to analyze the
extent to which hybrids might be able to gain market share in the future. To accomplish
this, I use the Berry logit framework to regress the number of vehicle registrations for
each model on an array of explanatory variables. In the case of the overall market and
vehicle segment specifications, the explanatory variables are intrinsic product attributes
such as fuel efficiency and horsepower. In the hybrid specification I also include external
3

influences, such as local demographics, community environmentalism, and government
incentives. Although investigation of external influences on demand for automobiles is
relatively rare, it tends to add a great deal of insight into what attracts consumers to
“specialty” vehicles such as hybrids. The inclusion of government incentives in particular
creates the potential for interesting policy implications. Moreover, most existing studies
do not separate vehicles by segment. Given that a consumer shopping for a minivan
probably prefers a very different mix of product attributes than one shopping for a sports
car, this division of the market results in a clearer picture of the relative viability of
hybrids between segments.
The value added by such an analysis is clear, as the factors affecting the decision
to purchase a hybrid over a conventional gas-powered vehicle, or one hybrid over
another, are still a matter of controversy. Indeed, despite the obvious success of the
compact Toyota Prius, General Motors’ Vice Chairman of Product Development Bob
Lutz went on record as saying that compact hybrids were bad business, and that the
greatest potential for hybrid success comes from higher-margin, less fuel-efficient
vehicles such as SUVs and pickups (CNN Money, 2004). Honda and Toyota obviously
disagree, as they have continued to push hybrid sedans and compacts through the market.
By estimating separate demand functions for each vehicle segment I am able to extract
more specialized estimates of consumer preference for fuel efficiency, thereby gaining
insight into which segments might be most suited for hybrids. In contrast, the results for
fuel efficiency and other relevant product attributes in the generalized demand estimation
could offer some insight into the extent to which hybrids will be able to lure consumers
away from conventional gas powered vehicles in the overall market.
4
Mass media outlets have been quick to chime in on possible determinants of
demand for hybrids. Some point to the recent rise in gasoline prices as the primary driver
behind a surge in hybrid sales (International Herald Tribune, 2007) while others claim
that an increased level of environmental consciousness evidenced by the success of the
burgeoning “Green” movement should be credited (BusinessWeek, 2005). News and
magazine articles, however, offer little in the way of serious empirical analysis. There
certainly may be a correlation between rising gas prices, stronger environmentalist
sentiment, and an increase in hybrid sales, but that in and of itself does not answer the
question of whether either of the former caused the latter. I therefore take care to include
both local gas prices and a proxy for community environmentalism in my hybrid demand
specification, so that I may test the veracity of these common claims.
I find that the primary determinants of demand are quite similar between the
overall market and the hybrid market, but vary greatly between vehicle segments. In
particular, my results suggest that a relatively strong preference for fuel efficiency exists
in the markets for hybrids, certain vehicle segments, and automobiles in general. This
affinity for fuel efficiency, however, is typically overshadowed by stronger preferences
for horsepower and weight, two characteristics that are negatively related to a vehicle’s
fuel economy. Other consistent influences on demand include brand or model-based
prestige, safety ratings, and brand nationality, although the competitive advantage gained
by one nationality over another varies between segments. The external influences on
demand included in the hybrid specification increase the model’s explanatory power but
do not outweigh the effects of vehicle attributes. Nevertheless, I find that
environmentalism, convenience-based incentives, median income, average commute
5
time, and age all have significant effects on hybrid demand, while cost- and tax-based
incentives and other demographic factors do not appear to stimulate purchase of hybrids.
Gas price only returns as significant if not controlling for environmentalism, which is
likely a result of the cross-sectional nature of the data.
The rest of the paper is organized as follows. Section II surveys the existing
economic literature on hybrid-electric vehicles and consumer preference for fuel-
efficiency. Section III covers data sources and presents summary statistics for the
explanatory variables used in various specifications. Section IV describes the empirical
framework used to estimate the demand functions. Section V outlines the study’s
findings. Section VI explores marketing and policy implications, as well as suggestions
for further research.
II. Literature Review
The existing economic literature on hybrid cars is quite limited in scope. This can
be at least partially attributed to the fact that hybrid-electric vehicles have only been on
the market for a relatively short period of time. Still, some papers have examined the
dynamics of the production, distribution, and consumption of these vehicles. Calef and
Goble studied the effectiveness of technology-forcing in California, in which the
government mandated and stringently regulated the development and sale of low-
emission vehicles (2007). Although the study focused primarily on the steps taken by
producers to develop the necessary technology, Calef and Goble saw it as no coincidence
that California came to be home to one of the largest concentrations of electric and
hybrid-electric vehicles in the world, and deemed the state’s aggressive promotion of
alternative fuel vehicles in order to reduce air pollution a success. However, there was no
6

discussion on why exactly California consumers might have responded so positively to
the introduction of the hybrid. It is possible that California residents were already
particularly inclined towards alternative fuel-powered vehicles, and thus would have
chosen to purchase such cars regardless of whether the government had taken such a
pointed interest in the matter.
Others seek to predict consumer behavior by evaluating the true value of hybrids;
that is, whether the benefits of lower emissions and increased fuel economy offset the
costs of raised sticker prices and increased technological complexity. Lave and MacLean
address this by comparing the lifetime costs of a Toyota Prius, the earliest and most
successful commercial hybrid, to its closest conventional counterpart, the compact
Toyota Corolla (2002). Calculating the relative costs of owning a Prius versus a Corolla
over 14 years and 250,000 miles, they estimate that gasoline prices would have to rise to
$3.55 per gallon in order for the savings in gasoline expenditures to offset the purchase
price premium of the Prius. Because the average price of gas was at the time $1.50, the
authors conclude that hybrids would be unable to sell themselves on fuel efficiency alone.
Although their calculations were sound, the authors fail to take into account any
environmentalist sentiment that may make hybrids a desirable option for those who place
a high value on environmental protection and derive a great amount of utility from
believing that they are helping combat pollution. In addition, recent advancements in
hybrid technology combined with the rapid rise of gas prices have narrowed the gap
between the savings and purchase premium associated with hybrids.
Some studies pre-dating the diffusion of hybrids have looked at consumer
preference for fuel-efficiency, especially in light of rising or falling gasoline prices. A
7
survey conducted by Opinion Research in 1999 asked about the amount consumers would
be willing to pay as a premium for a doubling of fuel economy, with the average
consumer claiming they would pay only an extra $2563 in exchange for such a dramatic
increase in fuel efficiency (cited in Kenworthy & Laube, 1999). Greene (1998) studied
the relationship between vehicle size and fuel costs, with the assumption that consumers
do take into account the inverse relationship between a vehicle’s size and its fuel-
efficiency, and showed that compact and subcompact market share is in fact a positive
function of gasoline price. A more recent study by Greene et. al. (2005) modeled
hypothetical increases in fuel efficiency among the US automotive fleet and found that
increases in overall fuel efficiency would most likely be due to general technological
improvement rather than consumer substitution towards more fuel-efficient vehicles. In
studying the potency of government regulation of fuel economy, Dreyfus and Viscusi
(1995) found that consumers do to some extent take a long-term perspective on fuel
efficiency, and government interventions that affect the payoffs associated with fuel
economy could affect consumer choice.
Santini, Patterson, and Vyas (1999) examined survey data from 1981 through
1998 and found that a higher proportion of consumers rated fuel-efficiency as the most
important attribute considered in their purchase decision in years in which gas prices
were greatly and frequently rising. Alternatively, as gas prices dropped, a much smaller
percentage of consumers rated fuel-efficiency as a major consideration. Later in the same
paper, they consider the imminent introduction of the Toyota Prius to the US market by
estimating expected costs and benefits, quantified through variables such as fuel savings,
lowered performance, purchase price premium, and expected battery life. Like Lave and
8
MacLean, they conclude that the US market for hybrids would be quite limited. It is
important to keep in mind, however, that authors base their calculations on the first-
generation Prius, which, compared to its descendents, suffers from lowered performance
in terms of acceleration and fuel economy. In addition, the paper predates the rapid rise in
gas prices experienced in the early 2000s. The authors acknowledge that such a rise
would probably serve as a boost to hybrid sales, but warn that a subsequent downturn in
gas prices would likely cool demand unless there was something else to attract consumers
to the product.
Although it did not explicitly consider consumer demand for hybrid cars,
Kayser’s study of the determinants of demand for gasoline yielded an especially relevant
and intriguing result. Using household-level data from 1981, which at the time was the
most recent year in which gas prices rose sharply, the author found that in response to the
sudden and rapid increase in gas prices, households lowered total gasoline consumption
without lowering total miles traveled (Kayser, 2000). The implication was that they must
be switching to more fuel-efficient cars. Because data was drawn from only a single year,
the author assumed consumers were most likely switching between cars already in their
household fleet. Kayser was interested in how households purchase behavior might have
been influenced, but lacked sufficiently detailed information to draw any conclusions on
the subject.
Certainly, the existing economic literature on fuel efficiency and hybrid vehicles
offers valuable insights into possible challenges and opportunities for automakers hoping
to penetrate the market or policymakers looking to encourage environmentally-friendly
purchasing patterns among their constituents. The hybrid sector of the automobile
9
industry, however, is moving forward at a blistering pace, with new models being
introduced by major manufacturers on a yearly basis. Even the most recently published
studies were not able to take into account the ongoing rise in gasoline prices, ever-
expanding government incentives, or the rapid diversification of available hybrid makes
and models. In addition, no empirical work has been done on the viability of hybrids
between vehicle segments or the influence of external variables on consumer preference
for hybrids. In light of all this, I believe there is much to be gained in using up-to-date
data to investigate the determinants of demand and relative preference for fuel efficiency
in hybrids, specific vehicle segments, and automobiles in general.
III. Data
3.1 Vehicle Registrations
Information on vehicle sales comes from a subset of the 2006 Polk New Vehicle
Registration dataset, available free of charge through the Duke library. This cross-
sectional dataset reports the raw number of new registrations for a particular make and
model within a given year for 21 randomly selected Designated Market Areas (DMAs)1.
Registration numbers for each DMA are further split up into individual counties. The
DMAs included are listed below.
Table 3.1 - Selected Designated Market Areas
DMA State Ranking2
Albany-Schenectady-Troy NY 17 Atlanta GA 2
Cleveland-Akron-Canton OH 7
1 The ‘DMA’ grouping was coined by Nielsen Media Research and is defined as a group of counties covered by a specific set of television stations. The Polk dataset is likely organized in this way for the benefit of auto manufacturers hoping to optimize their advertising strategy. 2 Refers to the DMA’s population-based rank in the context of the subset
10

Denver CO 8 Des Moines IA 18
Harrisburg-Lancaster-York PA 15 Hartford-New Haven CT 11
Houston TX 3 Las Vegas NV 16 Madison WI 20
Miami-Ft. Lauderdale FL 6 Milwaukee WI 13
Monterey-Salinas CA 21 Nashville TN 12 Phoenix AZ 4
San Antonio TX 14 San Diego CA 10
San Francisco-San Jose-Oakland CA 1 Seattle-Tacoma WA 5
St. Louis MO & IL 9 Syracuse NY 19
The use of registrations as opposed to sales is a particular strength of the dataset.
It is fairly common for consumers to purchase a vehicle in a different city or even state
than the one in which they reside. Thus, a vehicle being sold in a particular DMA would
not necessarily mean it was purchased by a resident of that DMA. Vehicle registrations,
on the other hand, must be filed in the proper state of residency, regardless of where the
owner purchased the vehicle. I can therefore be quite confident that the locus of a vehicle
registration is a good indicator of the owner’s true residency.
Unfortunately, the Polk dataset has some weaknesses as well. Most obvious is the
fact that the reported registration numbers come from a single year. In a young, fast-
growing market segment like hybrids, panel data would have been especially useful. The
cross-sectional nature of the data mitigates this somewhat, as differences in demographics
and environmental attitudes between locations also offer potential for interesting insights.
While a higher number of DMAs would have been nice, these selected DMAs cover a
11

solid cross-section of the country and should be adequate for the purposes of this study.
Finally, it must be pointed out that the Polk dataset reports only aggregate registration
numbers. Although household- or consumer-level data is always ideal when embarking
on demand estimation, an extensive review of the existing literature indicates that such a
dataset on purchasing decisions for automobiles simply does not exist.
Because I am only interested in vehicles purchased by households, I exclude
models primarily purchased for commercial use, such as cargo vans or heavy trucks. In
addition, the dataset occasionally lists separate registration numbers for different trims of
the same model. For example, data for the GMC Yukon, Yukon XL, Yukon Denali, and
Yukon Denali XL were all reported separately. In order to make sure registration
numbers were aggregated at the same level across models, I combine the numbers for
each trim into one base model data point.
After excluding non-household vehicles and aggregating separate trims, I am left
with 338 distinct models, eleven of which are hybrids. The hybrid models included in the
dataset are listed below:
Table 3.2 - Hybrid models included in Polk New Registration Dataset
Make/Model Total RegistrationsHonda Civic 7,216Honda Insight 193Honda Accord 1,191Toyota Prius 26,448Toyota Camry 6,941Toyota Highlander 7,502Lexus GS 450H 424Lexus RX 400H 4,952Ford Escape 3,794Mercury Mariner 532Saturn Vue 306
12
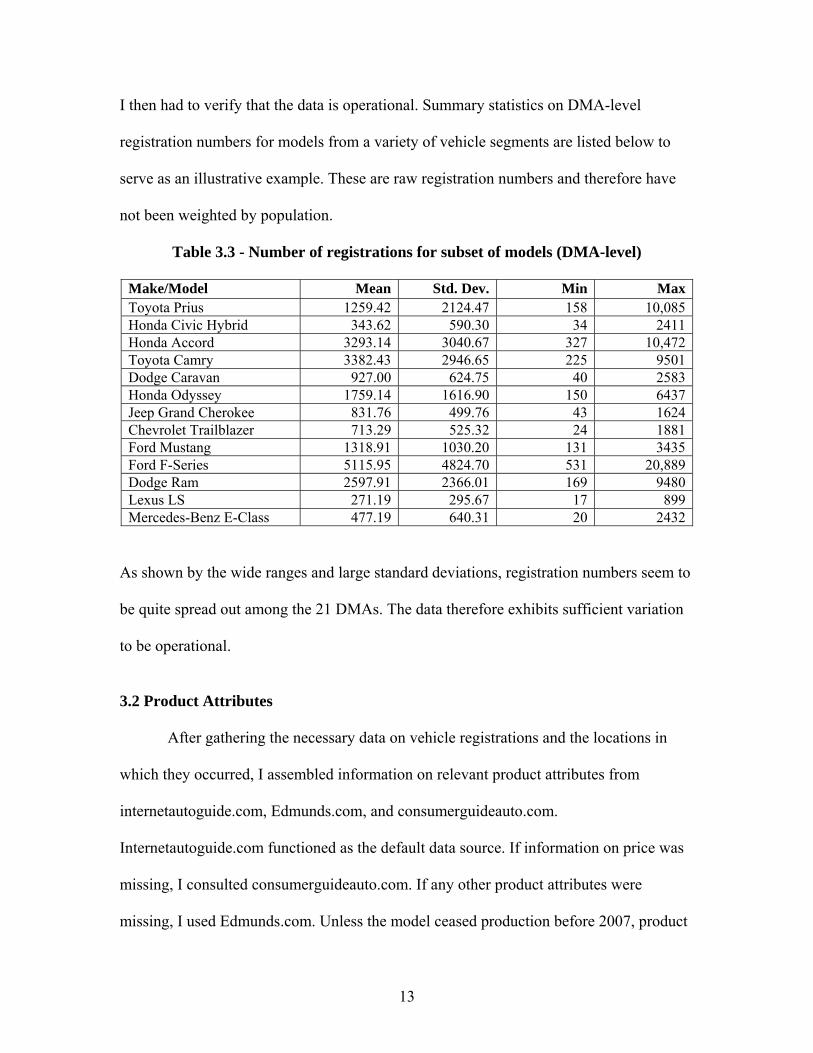
I then had to verify that the data is operational. Summary statistics on DMA-level
registration numbers for models from a variety of vehicle segments are listed below to
serve as an illustrative example. These are raw registration numbers and therefore have
not been weighted by population.
Table 3.3 - Number of registrations for subset of models (DMA-level)
Make/Model Mean Std. Dev. Min MaxToyota Prius 1259.42 2124.47 158 10,085Honda Civic Hybrid 343.62 590.30 34 2411Honda Accord 3293.14 3040.67 327 10,472Toyota Camry 3382.43 2946.65 225 9501Dodge Caravan 927.00 624.75 40 2583Honda Odyssey 1759.14 1616.90 150 6437Jeep Grand Cherokee 831.76 499.76 43 1624Chevrolet Trailblazer 713.29 525.32 24 1881Ford Mustang 1318.91 1030.20 131 3435Ford F-Series 5115.95 4824.70 531 20,889Dodge Ram 2597.91 2366.01 169 9480Lexus LS 271.19 295.67 17 899Mercedes-Benz E-Class 477.19 640.31 20 2432
As shown by the wide ranges and large standard deviations, registration numbers seem to
be quite spread out among the 21 DMAs. The data therefore exhibits sufficient variation
to be operational.
3.2 Product Attributes
After gathering the necessary data on vehicle registrations and the locations in
which they occurred, I assembled information on relevant product attributes from
internetautoguide.com, Edmunds.com, and consumerguideauto.com.
Internetautoguide.com functioned as the default data source. If information on price was
missing, I consulted consumerguideauto.com. If any other product attributes were
missing, I used Edmunds.com. Unless the model ceased production before 2007, product
13

specifications were recorded for 2007 base models. If a 2007 model did not exist, data
from the last model year produced was used instead.
The following tables report descriptive statistics for relevant product attributes,
first among hybrids only, and then for all 338 models.
Table 3.4 - Summary statistics for product attributes, hybrids only
Variable Mean Std. Dev. Min MaxHorsepower 184.27 86.78 73.00 339.00MPG 37.55 12.70 26.35 62.70Size (sq ft) 88.37 7.14 71.84 95.02Weight (lbs) 3521.00 731.22 1850.00 4365.00Cargo Room (cu ft) 18.65 10.47 7.50 38.30MSRP ($) 29,794.55 10,262.92 19,330.00 54,900.00Years Sold 3.36 2.73 1.00 9.00
Table 3.5: Summary statistics for product attributes, all models
Variable Mean Std. Dev. Min MaxHorsepower 254.55 108.89 73.00 1001.00MPG 21.63 6.03 10.40 62.70Size (sq ft) 95.77 12.73 65.95 137.48Weight (lbs) 3850.70 855.77 1850.00 7189.00Cargo Room (cu ft) 22.35 14.38 1.50 83.26MSRP ($) 52,137.73 98,695.46 9430.00 1,440,800.00Years Sold 11.35 12.12 1.00 59.00
MPG is the combined fuel-efficiency, based on official EPA measurements and
calculated using the EPA’s standard formula for combining city and highway mileage.3
Size represents an approximate cross-sectional area of the vehicle and is defined as length
multiplied by width. Weight is the vehicle’s curb weight, i.e. the weight of the vehicle
when completely empty, measured in pounds. Cargo is the amount of cargo space in a
vehicle, measured in cubic feet when all seats are in their upright position. MSRP is the
manufacturer’s suggested retail price for the base model or trim. Years is the number of
3 Combined MPG = (.45)(highway MPG) + (.55)(city MPG)
14
years a model has been sold in the US market. The only cause for concern comes from
the oddly skewed variation in MSRP, due to the existence of extremely high-priced
outliers.
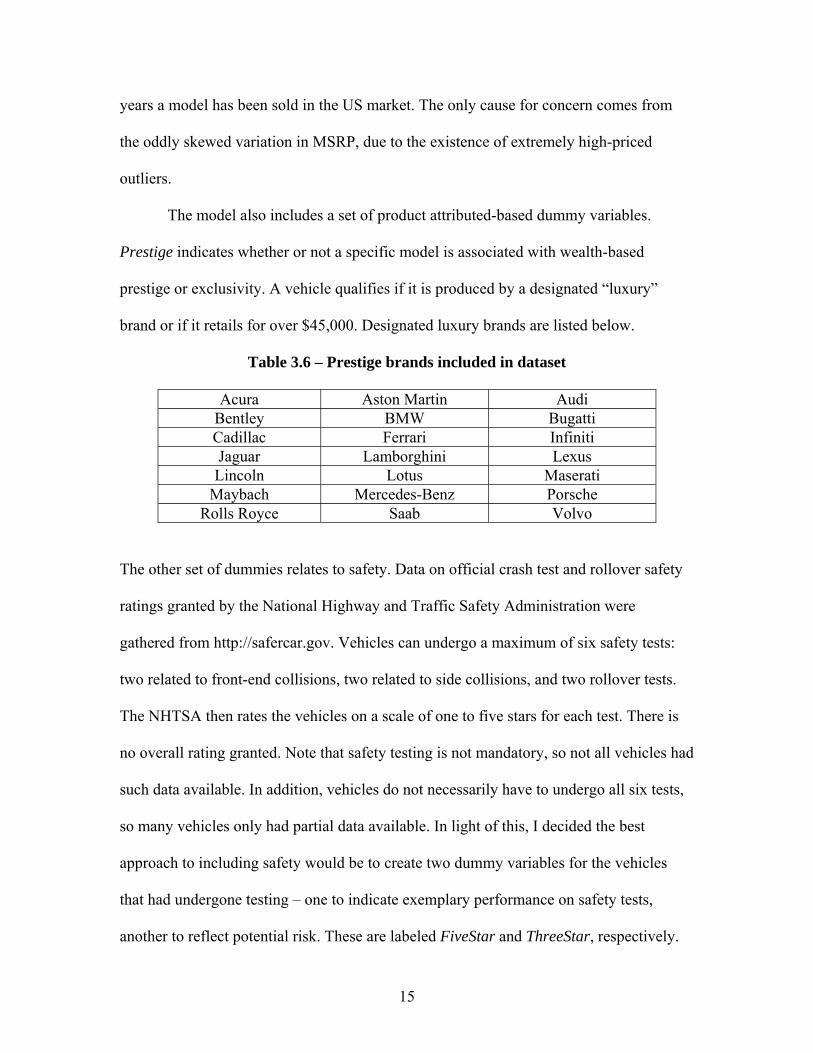
The model also includes a set of product attributed-based dummy variables.
Prestige indicates whether or not a specific model is associated with wealth-based
prestige or exclusivity. A vehicle qualifies if it is produced by a designated “luxury”
brand or if it retails for over $45,000. Designated luxury brands are listed below.
Table 3.6 – Prestige brands included in dataset
Acura Aston Martin Audi Bentley BMW Bugatti Cadillac Ferrari Infiniti Jaguar Lamborghini Lexus Lincoln Lotus Maserati
Maybach Mercedes-Benz Porsche Rolls Royce Saab Volvo
The other set of dummies relates to safety. Data on official crash test and rollover safety
ratings granted by the National Highway and Traffic Safety Administration were
gathered from http://safercar.gov. Vehicles can undergo a maximum of six safety tests:
two related to front-end collisions, two related to side collisions, and two rollover tests.
The NHTSA then rates the vehicles on a scale of one to five stars for each test. There is
no overall rating granted. Note that safety testing is not mandatory, so not all vehicles had
such data available. In addition, vehicles do not necessarily have to undergo all six tests,
so many vehicles only had partial data available. In light of this, I decided the best
approach to including safety would be to create two dummy variables for the vehicles
that had undergone testing – one to indicate exemplary performance on safety tests,
another to reflect potential risk. These are labeled FiveStar and ThreeStar, respectively.
15

FiveStar means a vehicle earned a strict majority of five star ratings on the tests it
underwent. ThreeStar indicates that a vehicle earned at least one rating of three stars or
lower. Most vehicles earn a mix of four star and five star ratings, with about half or the
majority being four stars. I did not take the number of tests a vehicle underwent into
account.
3.3 External Influences
The question then turns to possible external influences on demand, which, with
the exception of federal tax rebates, vary between DMAs. Summary statistics for three
geographic influences are listed below:
Table 3.7 - Summary statistics for geographic influences
Variable Mean Std. Dev. Min MaxAverage gas price ($) 2.33 .15 2.11 2.59Average LCV score 54.26 23.78 21.67 98.50
Gas is the price of regular unleaded fuel at the end of 2006, taken from Triple A’s Daily
Fuel Gauge Report. If a DMA covered more than one of Triple A’s “metropolitan areas,”
I averaged the values to arrive at an estimated DMA-wide price. Although data on
premium fuel prices was also available, I had no way of knowing what proportion of
consumers actually purchased higher grades of gasoline. Thus, I decided it would be
safest to impute only the standard baseline price. LCV is the average League of
Conservations Voters Score for all representatives in a particular DMA for the 109th
Congress. Scores are based on voting patterns on key environmental legislation and range
from 0 to 100, with 100 representing the most environmentally-conscious a
congressperson can be. This is meant to serve as a proxy for community
16
environmentalism, as a representative who votes in favor of the environment 80% of the
time has probably been elected by a markedly different constituency than one who votes
against it 80% of the time. Note that Congressional districts do not follow county lines,
so certain districts were only partially contained within a DMA. For the purposes of this
study, a Congressperson’s scores were included in a DMA’s average if they had any
constituents at all within its geographic bounds.
Details regarding federal tax rebates for selected models can be found at
http://fueleconomy.gov, a site run by the US Department of Energy. The level of a tax
rebate varies by the type of model and the number of cars sold. Once a model has sold
over 60,000 units, the rebate is cut down to 50% of the original value, and then to 25% of
the initial value before being completely phased out. This complicates the inclusion of
federal tax rebates in my model, as the Toyota hybrids were eligible for the full rebate
until October 1st 2006, and then only half the rebate for the rest of the year. To address
this, I calculated a weighted average based on the length of time the model was eligible
for the full versus the half-rebate. No other manufacturers have been affected by the
phase-out, so all other values are the original full rebate.
Information on state and local government incentives are also a matter of public
record and are tracked by the Union of Concerned Scientists at HybridCenter.org. State
or local incentives that were in effect at some point in 2006 are included in the model.
This means that incentives that expired during or after 2006 are included, while
incentives that did not become viable until 2007 are not. Although the details of these
incentive structures vary, they are grouped into four basic categories and will be
represented by four dummy variables in the model: HOV, Park, SalesTax, and Emissions.
17
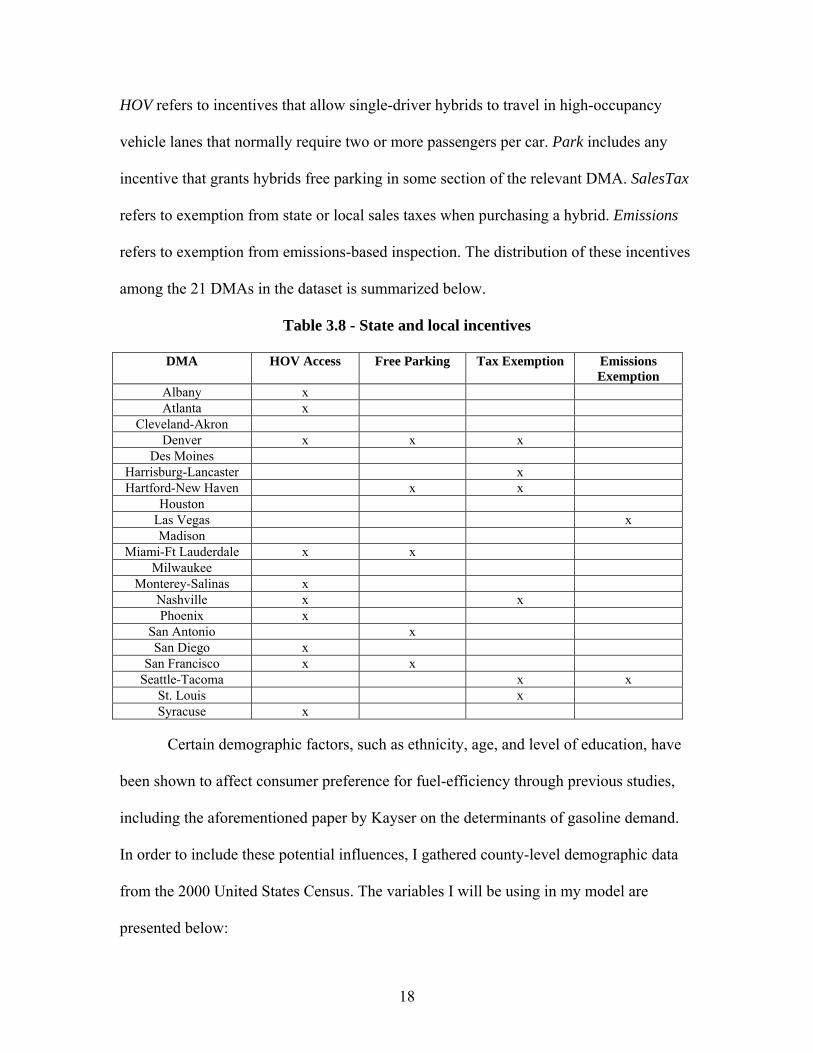
HOV refers to incentives that allow single-driver hybrids to travel in high-occupancy
vehicle lanes that normally require two or more passengers per car. Park includes any
incentive that grants hybrids free parking in some section of the relevant DMA. SalesTax
refers to exemption from state or local sales taxes when purchasing a hybrid. Emissions
refers to exemption from emissions-based inspection. The distribution of these incentives
among the 21 DMAs in the dataset is summarized below.
Table 3.8 - State and local incentives
DMA HOV Access Free Parking Tax Exemption Emissions Exemption
Albany x Atlanta x
Cleveland-Akron Denver x x x
Des Moines Harrisburg-Lancaster x Hartford-New Haven x x
Houston Las Vegas x Madison
Miami-Ft Lauderdale x x Milwaukee
Monterey-Salinas x Nashville x x Phoenix x
San Antonio x San Diego x
San Francisco x x Seattle-Tacoma x x
St. Louis x Syracuse x
Certain demographic factors, such as ethnicity, age, and level of education, have
been shown to affect consumer preference for fuel-efficiency through previous studies,
including the aforementioned paper by Kayser on the determinants of gasoline demand.
In order to include these potential influences, I gathered county-level demographic data
from the 2000 United States Census. The variables I will be using in my model are
presented below:
18
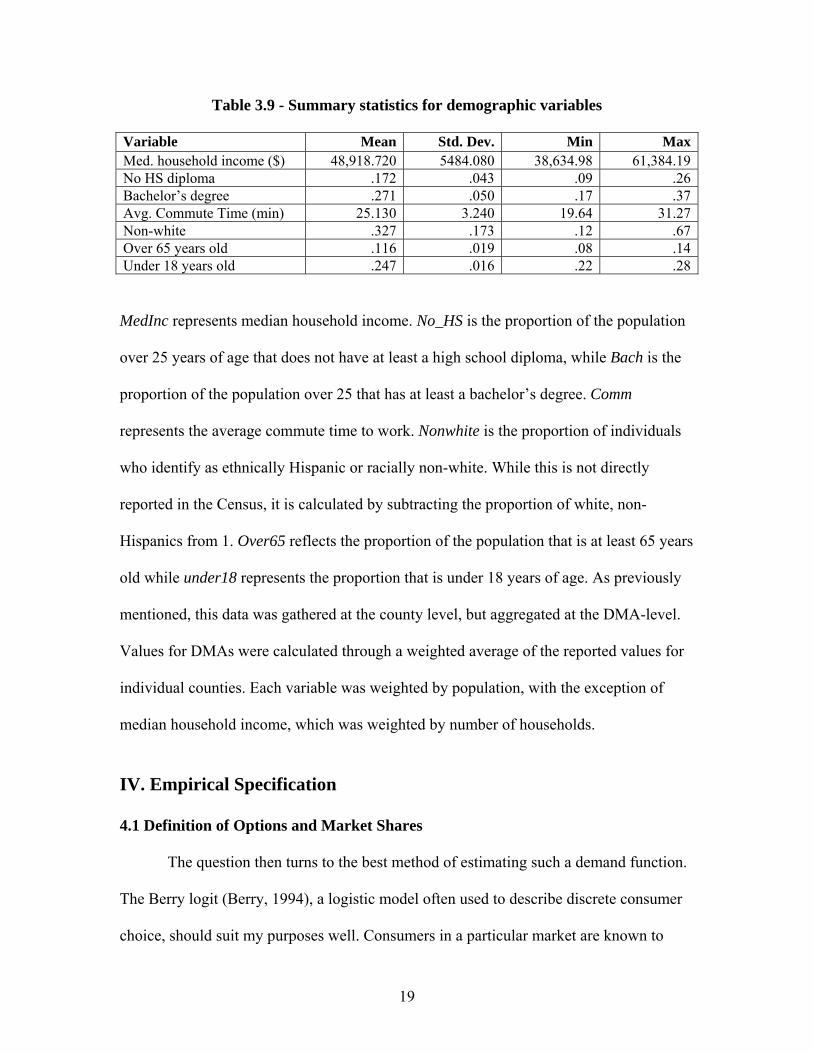
Table 3.9 - Summary statistics for demographic variables
Variable Mean Std. Dev. Min MaxMed. household income ($) 48,918.720 5484.080 38,634.98 61,384.19No HS diploma .172 .043 .09 .26Bachelor’s degree .271 .050 .17 .37Avg. Commute Time (min) 25.130 3.240 19.64 31.27Non-white .327 .173 .12 .67Over 65 years old .116 .019 .08 .14Under 18 years old .247 .016 .22 .28
MedInc represents median household income. No_HS is the proportion of the population
over 25 years of age that does not have at least a high school diploma, while Bach is the
proportion of the population over 25 that has at least a bachelor’s degree. Comm
represents the average commute time to work. Nonwhite is the proportion of individuals
who identify as ethnically Hispanic or racially non-white. While this is not directly
reported in the Census, it is calculated by subtracting the proportion of white, non-
Hispanics from 1. Over65 reflects the proportion of the population that is at least 65 years
old while under18 represents the proportion that is under 18 years of age. As previously
mentioned, this data was gathered at the county level, but aggregated at the DMA-level.
Values for DMAs were calculated through a weighted average of the reported values for
individual counties. Each variable was weighted by population, with the exception of
median household income, which was weighted by number of households.
IV. Empirical Specification
4.1 Definition of Options and Market Shares
The question then turns to the best method of estimating such a demand function.
The Berry logit (Berry, 1994), a logistic model often used to describe discrete consumer
choice, should suit my purposes well. Consumers in a particular market are known to
19

have J options. As previously explained, these J options will constitute all passenger
vehicle models that are typically purchased for personal rather than commercial use.
Consumers also have an “outside option,” known as option zero. In this case, the outside
option refers to the portion of the market that did not purchase a passenger vehicle for
personal use in 2006. In order to define this, I will make two assumptions. First, all
households in the US have some need for transportation, and this need can be fulfilled by
a personal vehicle. Second, I assume that households purchase at most one car per year.
In doing this, I can define the outside option as the number of households in each DMA
that did not purchase a vehicle. This is calculated by subtracting the number of vehicles
sold in a particular market from the total number of households in that market.
The market share captured by a particular option, in this case a specific vehicle
model, is labeled Sj, while the outside option is designated by S0. Summary statistics for
individual shares and the outside option are reported below. Individual shares vary across
each model and DMA, while the share of the outside option is consistent across models
within the same DMA.
Table 4.1 - Summary statistics for market shares
Variable Mean Std. Dev. Min MaxIndividual Models .0003906 .0007555 0.00 .0125Outside Option .8679550 .0288586 .799 .8963
The outside option’s market share falls within a 10% range across DMAs. This serves as
a reassurance that the propensity to buy some kind of personal vehicle is relatively
consistent across different geographic markets. The fact that the outside option
constitutes such a large portion of the market is also to be expected, as only a small share
of households purchase a vehicle in a given year.
20
4.2 Utility and Discrete Choice
We then turn our attention to how utility enters into this model of discrete choice,
using the method developed by Berry and further explained by Beresteanu (2007). The
market of J options contains N individual consumers. The utility consumer n gains from
purchasing option j, labeled Unj, is composed of two parts. The first, Vnj, is known and
observable up to some parameters. We call this the average utility of option j for
consumer n. There also exists, however, an unknown and unobservable part that we are
forced to treat as random. This is labeled εnj, and is referred to as consumer n’s “shock
taste” for option j. Thus:
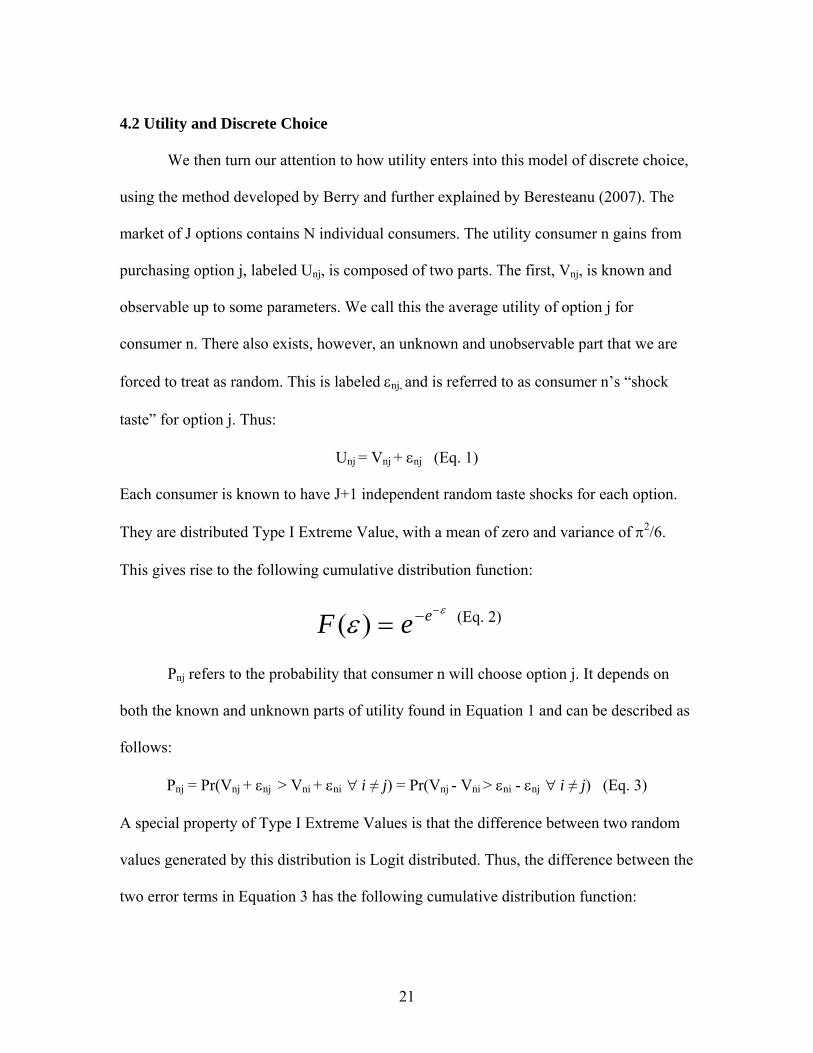
Unj = Vnj + εnj (Eq. 1) Each consumer is known to have J+1 independent random taste shocks for each option.
They are distributed Type I Extreme Value, with a mean of zero and variance of π2/6.
This gives rise to the following cumulative distribution function:
ε
ε−−= eeF )( (Eq. 2)
Pnj refers to the probability that consumer n will choose option j. It depends on
both the known and unknown parts of utility found in Equation 1 and can be described as
follows:
Pnj = Pr(Vnj + εnj > Vni + εni ∀ i ≠ j) = Pr(Vnj - Vni > εni - εnj ∀ i ≠ j) (Eq. 3)
A special property of Type I Extreme Values is that the difference between two random
values generated by this distribution is Logit distributed. Thus, the difference between the
two error terms in Equation 3 has the following cumulative distribution function:
21
ε
ε
εe
eF+
=1
)( (Eq. 4)
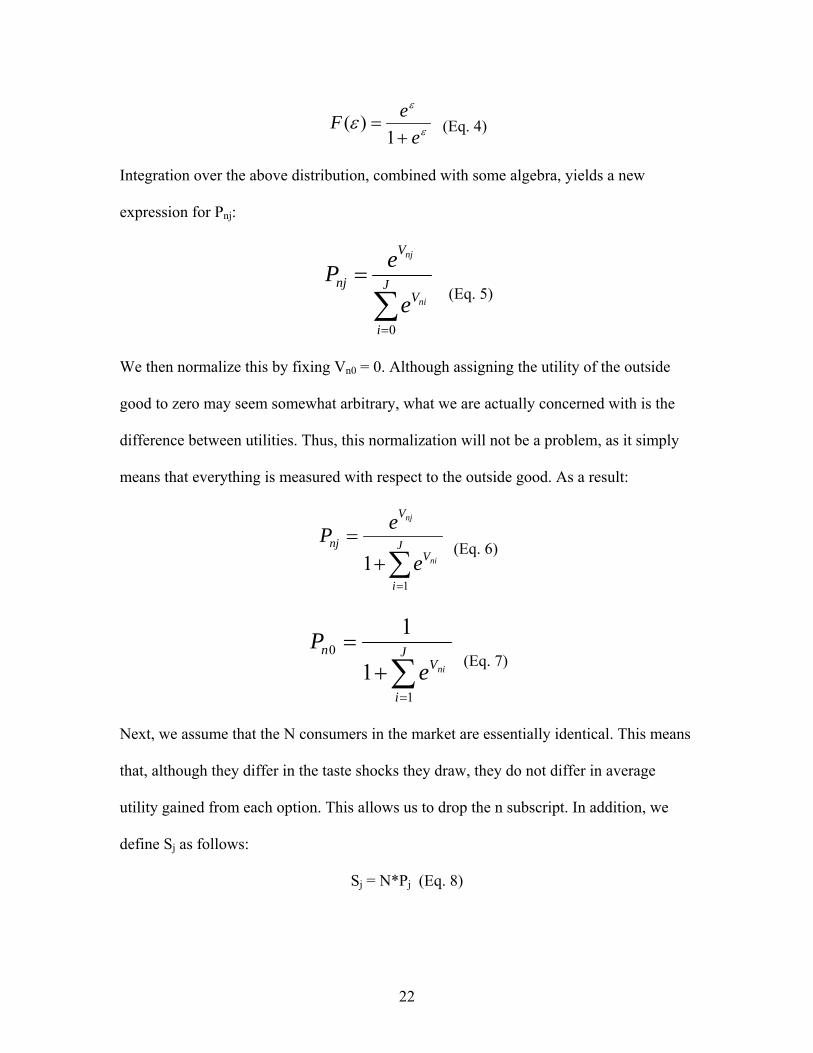
Integration over the above distribution, combined with some algebra, yields a new
expression for Pnj:
∑=
= J
i
V
V
njni
nj
e
eP
0
(Eq. 5)
We then normalize this by fixing Vn0 = 0. Although assigning the utility of the outside
good to zero may seem somewhat arbitrary, what we are actually concerned with is the
difference between utilities. Thus, this normalization will not be a problem, as it simply
means that everything is measured with respect to the outside good. As a result:
∑=
+= J
i
V
V
njni
nj
e
eP
11
(Eq. 6)
∑=
+= J
i
Vn
nieP
1
0
1
1 (Eq. 7)
Next, we assume that the N consumers in the market are essentially identical. This means
that, although they differ in the taste shocks they draw, they do not differ in average
utility gained from each option. This allows us to drop the n subscript. In addition, we
define Sj as follows:
Sj = N*Pj (Eq. 8)
22

Dividing Equation 6 by Equation 7 and plugging into Equation 8, we find an expression
for relative market share in terms of average utility:
jVj eSS
=0
(Eq. 9)
Taking the natural logarithm of Equation 9 yields:
jj V
SS
=⎟⎟⎠
⎞⎜⎜⎝
⎛
0
log (Eq. 10)
Finally, we assume that average utility is linear in characteristics and price. Thus,
observed market shares for all j options plus the outside option can be used to construct
the following regression:
log(Sj/S0) = β0 + β1X1 +...+ βkXk – αPj – ηj (Eq. 11)
X1 through Xk represent explanatory variables, i.e. the aforementioned product
characteristics and external influences on consumer preferences, Pj represents the price of
the option, and ηj encapsulates unobserved product characteristics.
4.3 Endogeneity of Prices
A simultaneity problem arises in that Pj is likely correlated with at least some of
the unobserved product characteristics included in ηj. To remedy this, instrumental
variables must be used to derive an expected value of Pj. A satisfactory instrument will
affect the price of an option without being correlated with any unobserved product
characteristics. In his 1995 paper on automobile prices, Berry included miles per dollar
rather than miles per gallon into the demand equation, as the former represents the true
cost of use to the consumer. Miles per gallon may then be used on the supply side, as
increased fuel-efficiency is in fact expensive to produce. I can calculate miles per dollar
23
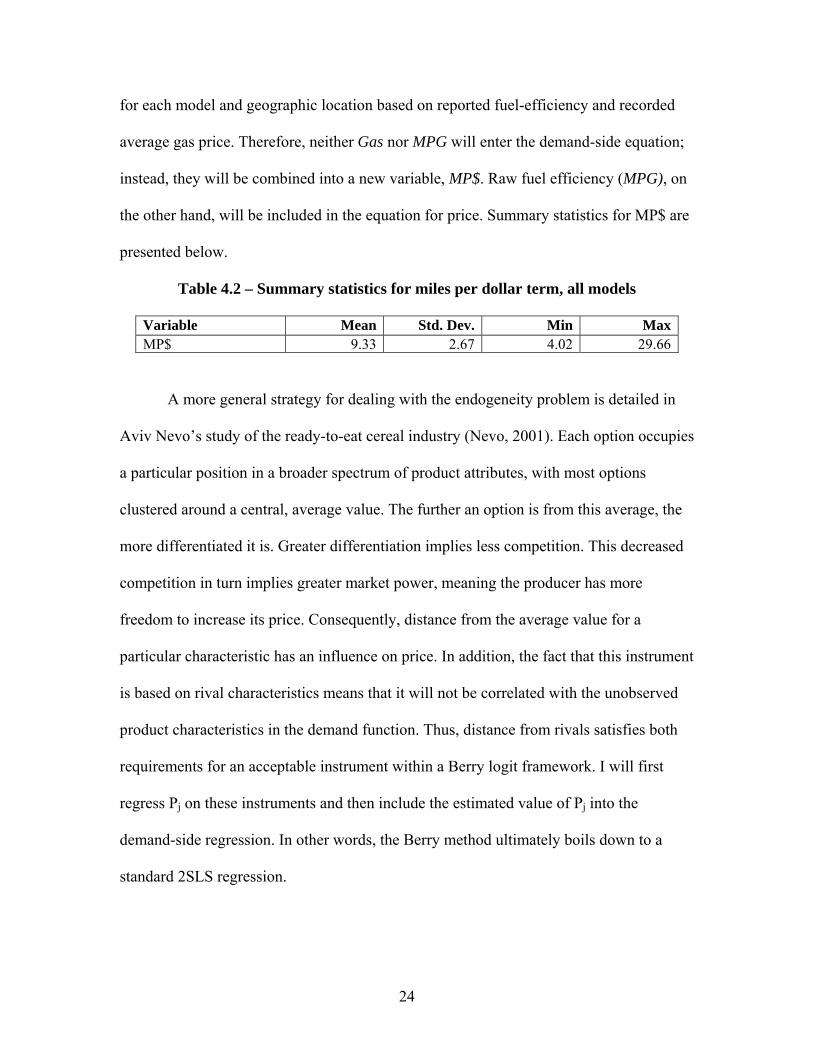
for each model and geographic location based on reported fuel-efficiency and recorded
average gas price. Therefore, neither Gas nor MPG will enter the demand-side equation;
instead, they will be combined into a new variable, MP$. Raw fuel efficiency (MPG), on
the other hand, will be included in the equation for price. Summary statistics for MP$ are
presented below.
Table 4.2 – Summary statistics for miles per dollar term, all models
Variable Mean Std. Dev. Min MaxMP$ 9.33 2.67 4.02 29.66
A more general strategy for dealing with the endogeneity problem is detailed in
Aviv Nevo’s study of the ready-to-eat cereal industry (Nevo, 2001). Each option occupies
a particular position in a broader spectrum of product attributes, with most options
clustered around a central, average value. The further an option is from this average, the
more differentiated it is. Greater differentiation implies less competition. This decreased
competition in turn implies greater market power, meaning the producer has more
freedom to increase its price. Consequently, distance from the average value for a
particular characteristic has an influence on price. In addition, the fact that this instrument
is based on rival characteristics means that it will not be correlated with the unobserved
product characteristics in the demand function. Thus, distance from rivals satisfies both
requirements for an acceptable instrument within a Berry logit framework. I will first
regress Pj on these instruments and then include the estimated value of Pj into the
demand-side regression. In other words, the Berry method ultimately boils down to a
standard 2SLS regression.
24

V. Findings 5.1 Determinants of Demand for Passenger Vehicles
I first estimate a demand function for all models based solely on product
attributes. To aid in interpreting the results, the independent variables are scaled down to
similar magnitudes. In addition, in order to isolate a vehicle’s power from its size,
horsepower is divided by curb weight. Summary statistics for the scaled variables are
available in the appendix. The scaled variables are then imputed into the previously
described Berry logit model. Only observations that recorded at least one registration for
a particular model were included, as dependent values of zero are dropped from the
regression.4 Results from three different specifications are as follows:
Table 5.1 – 2SLS estimation for all models
(1) (2) (3)Log(Sj/S0) β p-value β p-value β p-valueMSRP -0.810 .11 -2.229 .00 -1.542 .00HP/Weight -0.245 .77 5.833 .00 4.309 .00Miles per dollar 1.245 .00 1.789 .00 1.384 .00Size 0.003 .89 -0.317 .00 -0.234 .00Cargo room 0.189 .00 -0.099 .00 -0.432 .15Weight 0.161 .19 2.312 .00 1.384 .00Years 0.011 .00 0.022 .00 0.019 .00Prestige -0.661 .00 1.543 .00 0.954 .00Five star 1.093 .00 1.051 .00Three star -0.095 .15 -0.138 .02Japanese 0.340 .00 0.310 .00European 0.313 .01 0.074 .47Korean -0.395 .00 -0.292 .01Weight subsidy 0.729 .00Constant -10.519 .00 -14.130 .00 -12.028 .00N 6370 4921 4921 R-Squared .221 .446 .451
4 Recall that the Berry logit involves taking the natural log of a vehicle’s relative market share. Given that the natural log of zero is undefined, observations of zero are automatically dropped from the regression.
25
The first specification is what can be called a “bare bones” regression, similar to
the minimal product attribute-based regression run by Berry (1995). This minimalist
approach tends to be favored in the literature on automobile demand, as researchers are
often wary of overspecifying their demand functions (Arguea et al, 1994). The magnitude
and significance of my results are similar to Berry’s. Both found that horsepower was
insignificant, while fuel efficiency was significant, positive, and greatest in magnitude.
The similarity of my results to some found in the existing literature is encouraging;
however, the interpretation of these results is a bit perplexing. While it is not hard to
understand why consumers would find fuel efficiency very important, especially given
the recent and continuing rise in gas prices, horsepower being altogether insignificant is a
bit hard to believe. It may not necessarily be a consumer’s primary concern in choosing
one model over another, but I find it unlikely that it would not matter at all, especially
given the preponderance of “power-based” vehicles like SUVs in the overall market. The
insignificance of MSRP is also odd, as one would expect price to have a strong effect on
a vehicle’s market share. Finally, the negative coefficient on prestige does not make
much sense, as one would expect prestige associated with a specific brand or model to
have a positive effect on demand, given that I have controlled for price.
The most likely explanation for these odd results is that they are being skewed by
outliers. “Exotic” vehicles such as Ferraris and Rolls Royce tend to come attached to
extremely high values for horsepower and MSRP, as well as very low individual market
shares. The Berry logit framework combats this somewhat by automatically dropping
observations in which no registrations for a particular model were recorded. A model that
sells one unit, however, is given equal weight as a model that sells 10,000 units, leaving
26

ample opportunity for low-selling exotic vehicles to skew the results. Dropping vehicles
that do not pass a certain sales benchmark could be one option for minimizing this effect;
however, that would also involve dropping models that were aimed at the mass market
but for one reason or another sold poorly. Because an accurate demand function must
include vehicles that failed in addition to those that succeeded, I am reluctant to drop
models from my regressions simply because they do not sell well.
An alternate approach to minimizing the effect of outliers comes through the
inclusion of safety ratings, as shown in specifications two and three. As previously
mentioned, not all vehicles undergo federal crash and rollover testing. Those that avoid
testing tend to be prestige sports cars, very high-end luxury cars, and heavy duty utility
vehicles. Incidentally, these are also the segments that are most likely to contain outliers
that could potentially skew my results. With few exceptions, vehicles aimed at the mass
market underwent safety testing, unsurprising given that a vehicle without safety
information would likely raise suspicion in the minds of mainstream consumers.
“Specialty” vehicles such as high-performance sports cars or high-end luxury cars,
however, are aimed at niche markets. These consumers may be less concerned with
safety ratings as compared to the performance or other amenities of the vehicle, and as a
result the manufacturer or testing agencies may not see testing as worthwhile. Thus, the
existence of safety ratings seems to be an adequate tool for separating mass market
vehicles from high-end niche models.
In addition to including safety ratings, the second specification also includes
dummies for the nationality of the vehicle’s brand. An attempt to include dummies for
each individual brand was made; however the resulting regression ran into numerous
27

problems with multicollinearity and dropped terms. The inclusion of brand nationality
seems to be a good way to acknowledge the potential effects of the producers’ image on
demand without making the model too complicated. Brands fell into one of four
categories: domestic (i.e. American), Japanese, European, and Korean. Note that this is
based entirely on the brand and not the parent company. For example, the United
Kingdom-based Jaguar brand falls into the European category, despite being owned by
Ford in 2006. The highest proportion of models belonged to the domestic category, so it
was the term excluded from the overall regression.
In general, the second specification seems to be a great improvement on the first.
Besides the greater explanatory power reflected by the jump in R-squared, the direction
of most coefficients now make much more intuitive sense. MSRP becomes more strongly
negative and is now significant. Horsepower switches from negative to positive and also
becomes significant. In addition, its coefficient is greatest in magnitude. This is not
surprising, given that consumers tend to have a preference for greater horsepower,
evidenced by how powerful vehicles such as SUVs and trucks often dominate year-end
“best seller” lists. Horsepower is also probably acting as a proxy for other performance-
related specifications, such as acceleration. Fuel efficiency, on the other hand, remains
positive and significant and only rises slightly in magnitude. This consistency is
encouraging, as it is this study’s primary variable of interest. Although it no longer has
the strongest effect on demand, it remains a relatively important regardless of the
specification used. Granted, this may also be influenced by the fact that the data is drawn
from only 2006, creating a snapshot of automobile demand squarely in the midst of a
historic rise in fuel prices. Nevertheless, Berry’s longitudinal estimation also found that
28
fuel efficiency had a large impact on demand, so I am not too concerned by the study’s
narrow time focus.
The contrasting coefficients on size and weight may be seen as counterintuitive,
given that the terms are correlated with each other. Delving deeper, the apparent
contradiction can likely be traced to the definition of size. Recall that in creating the term,
I took a length by width cross section of the vehicle, thereby excluding height. Thus, a
full size sedan and an SUV with the same lengths and widths would be considered the
same size, despite the fact that the SUV is likely to be larger due to greater height and
heavier build. In light of that, the positive coefficient on weight is probably picking up on
a preference for taller, strongly built vehicles that cannot be adequately captured by an
approximation of cross-sectional area. In addition, because I scaled horsepower by
weight, the weight term may also be picking up on a preference for more horsepower
overall, rather than simply a high level of horsepower given the size of the vehicle.
The coefficients on years and cargo room both come out quite small. Years is
positive and significant, likely due to consumers being attracted to more established
models. The relatively small influence of the years term is also to be expected, as once a
model moves past the introductory and potential “debugging” stage, the added benefit of
existing for forty years as opposed to ten is probably quite small. In contrast, the negative
coefficient on cargo room stands out as the one counterintuitive result from the second
specification. All else equal, I cannot think of a plausible reason as to why consumers
would prefer less cargo room. In light of the apparent soundness of all the other results,
however, the negative coefficient on cargo room is not enough to discount the entire
specification.
29
Finally, results for the dummy variables fall in line with expectations. Controlling
for MSRP, prestige comes out positive and significant. Similarly, being regarded as a five
star vehicle in terms of safety has a positive, significant, and fairly strong effect on
demand. Results for the nationality dummies are also quite intuitive; Japanese and
European brands have similar positive and significant effects, while the also-significant
effect of Korean brands is similar in magnitude but opposite in sign. These results seem
to reflect the general market perception of each nation as an automobile manufacturer
compared to the United States. Japanese cars are typically seen as being very high in
quality, European cars tend to come attached to an added aura of desirability, and the
much more recently established Korean brands are viewed as uncertain, “cheap”
alternatives (Parameswaran & Pisharodi, 1994). With time the Korean brands may
undergo a journey similar to the Japanese automakers and emerge as high-quality sources
of production, but for now it seems they are still seen as relatively undesirable.
While the second specification’s results seem to be quite sound, the relatively
large coefficient on weight could be related to an outside variable which I did not include
in my product attribute-based specification. Section 179 of the United States Internal
Revenue Code, often referred to as the “SUV subsidy,” allows small business owners to
deduct up to $25,000 of the cost of a vehicle with a gross weight over 6,000 pounds from
their reported income (26 U.S.C. § 179). Note that gross weight is not the same as the
curb weight measure used in this study. Curb weight refers to the vehicle’s weight when
empty while gross weight adds the maximum load the vehicle is capable of carrying. In
contrast, small business owners can only deduct $10,610 of the cost of a regular
30
automobile. This therefore provides an incentive for small business owners to purchase
heavy vehicles such as trucks and SUVs instead of sedans or compacts.
Because this subsidy only applies to small businesses, however, it is not clear if it
should be included in a demand function aimed at household demand. Nevertheless, I ran
a third regression with a dummy variable indicating whether or not a vehicle qualified for
the subsidy. Unsurprisingly, the weight subsidy had a small, positive, and significant
effect on demand, with the relatively small magnitude likely the result of its being aimed
at small business owners rather then the overall market. In addition, the coefficient on
weight remained positive and significant, but decreased by over 40 percent. Thus, it
seems the existence of this subsidy does in fact partially account for the relatively high
coefficient on weight. Most other results remained consistent between the second and
third specification. Notably, however, three star safety ratings now return as negative and
significant, as was expected.
I can then use these results to make some inferences about the potential for greater
hybrid penetration in the overall market. The consistently positive, significant, and
relatively strong coefficient on fuel efficiency confirmed by both this study and the
existing literature is encouraging. Consumers clearly have a taste for fuel efficiency
which may grow even stronger if gas prices continue to rise. It is important to keep in
mind, however, that there exist important trade-offs in automobile production. Barring
breakthrough technology, increased fuel efficiency typically comes at the cost of features
also shown to have a strong positive effect on demand, namely horsepower and weight.
In addition, the magnitude of the coefficients on horsepower and weight are quite a bit
larger than the magnitude of the coefficient on horsepower. Thus, the relative difficulty
31
many hybrid models have encountered when attempting to penetrate the American
market may be related to consumers having a stronger preference for large, powerful
vehicles than they have for fuel-efficiency. Firms therefore need to be very careful to
strike the right balance in terms of fuel efficiency, power, and size. Sacrificing too much
for the sake of fuel efficiency, as was likely the case with the now-defunct 73 horsepower
Honda Insight, would make it very difficult for a hybrid model to successfully penetrate
the market. Consumer preferences, however, are not invariable across different locations,
nor are they immune to external intervention. The next section therefore narrows the
estimation’s focus to only hybrid vehicles in order to investigate the possible effects of
external influences on demand for hybrids.
5.2 Determinants of Demand for Hybrid Vehicles
In limiting the regression’s scope to hybrid vehicles, non-hybrid vehicles were
excluded, but market shares were not recalculated. Thus this specification still places
hybrids in the context of the overall passenger vehicle market, but allows the factors that
attract consumers specifically to hybrids to be brought to the surface, rather than be
buried amongst determinants of demand for the much greater number of conventional
vehicles. I also added the previously described “external influences,” i.e. gas prices,
environmentalism, government incentives, and demographics.
Before analyzing regression results, however, it is necessary to discuss the
limitations of this approach. Compared to the 338 models in the overall market, there are
only eleven hybrid models included in the dataset. This drops the number of observations
down to 226. A second difficulty arises in the interpretation of the regression output. In
previous specifications run on the entire market, coefficients could be used to determine
32
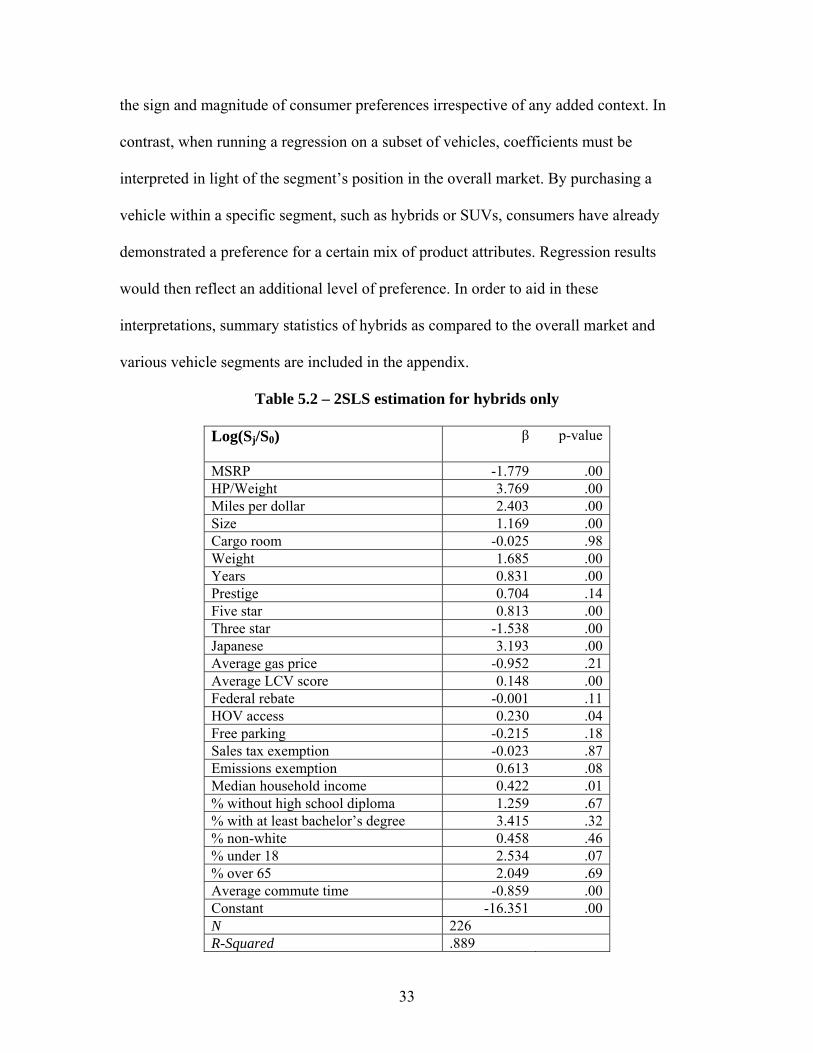
the sign and magnitude of consumer preferences irrespective of any added context. In
contrast, when running a regression on a subset of vehicles, coefficients must be
interpreted in light of the segment’s position in the overall market. By purchasing a
vehicle within a specific segment, such as hybrids or SUVs, consumers have already
demonstrated a preference for a certain mix of product attributes. Regression results
would then reflect an additional level of preference. In order to aid in these
interpretations, summary statistics of hybrids as compared to the overall market and
various vehicle segments are included in the appendix.
Table 5.2 – 2SLS estimation for hybrids only
Log(Sj/S0)
β p-value
MSRP -1.779 .00 HP/Weight 3.769 .00 Miles per dollar 2.403 .00 Size 1.169 .00 Cargo room -0.025 .98 Weight 1.685 .00 Years 0.831 .00 Prestige 0.704 .14 Five star 0.813 .00 Three star -1.538 .00 Japanese 3.193 .00 Average gas price -0.952 .21 Average LCV score 0.148 .00 Federal rebate -0.001 .11 HOV access 0.230 .04 Free parking -0.215 .18 Sales tax exemption -0.023 .87 Emissions exemption 0.613 .08 Median household income 0.422 .01 % without high school diploma 1.259 .67 % with at least bachelor’s degree 3.415 .32 % non-white 0.458 .46 % under 18 2.534 .07 % over 65 2.049 .69 Average commute time -0.859 .00 Constant -16.351 .00 N 226 R-Squared .889
33
The coefficient on MSRP is negative, significant, and fairly high in magnitude, as
expected. The prestige dummy being insignificant is also understandable. There are only
two qualifying models in the hybrid subset, both sold under the Lexus marquee. The GS
450 had only been sold for four months at the time the data was collected, so its sales
numbers were understandably low. The more established RX400, on the other hand, sold
quite well for a hybrid. The conflict between these opposing data points is probably the
source of prestige’s lost significance.
As was the case in the overall market, preference for both horsepower and fuel
efficiency appears to be quite strong. The magnitude of these coefficients for hybrids,
however, are much closer, with the effect of fuel efficiency being only slightly weaker
than that of horsepower. Since hybrids already have, on average, significantly higher fuel
economy than the overall market, this demonstrated preference can be seen as
particularly strong. The high priority placed on both horsepower and fuel efficiency even
in the hybrid market makes the previous suggestion to properly balance fuel efficiency
with the existing consumer preference for size and power even more critical. As
previously mentioned, too much fuel efficiency at the expense of performance can doom
a hybrid to failure; however, it seems too little fuel efficiency would give consumers
insufficient incentive to make the switch from a conventional vehicle, as well as make it
difficult to successfully compete with other hybrids.
Like in the overall specification, the years term has a positive and significant
effect on demand. In the hybrid regression, however, its magnitude greatly increases.
This is probably related to the fact that hybrids are a much newer technology and
consumers are therefore likely to be cautious when purchasing relatively unproven
34
vehicles. The coefficients on safety can also be related to the newness of hybrid
technology. The five star term is positive and significant, as expected, but what is
particularly interesting is that the three star term is negative, significant, and greater in
magnitude. Thus, while in the overall market consumers were primarily concerned with
seeking out five star ratings, in the nascent hybrid market consumers appear to place a
higher priority on avoiding safety risks.
The Japanese term is positive and significant, as expected, but the large
magnitude stands in stark contrast to previous results. This is probably due to Japanese
manufacturers, namely Toyota and Honda, being the first to enter the hybrid market and
thus benefiting from first mover advantage. Indeed, ever since the Prius took off at the
turn of the century, domestic manufacturers have been left playing catch up. As domestic
automakers gain more experience with hybrids and better establish themselves in the
market this positive effect of Japanese branding may subside. Note that European and
Korean dummies were excluded from the specification due to the fact that no European
or Korean hybrids currently exist. Given that European automakers seem to enjoy a
nationality-based boost similar to that of the Japanese in the overall market, a European
hybrid may have a bit of an advantage over a domestic rival, in spite of its later entry.
Since hybrids are on average significantly smaller than automobiles in general,
the positive coefficient on size may simply reflect a desire for an “average” sized vehicle
as opposed to a large one. The magnitude associated with weight could be picking up a
desire for higher levels of horsepower overall, as again the horsepower term has been
scaled by curb weight. Or, like size, it could simply have to do with hybrids being lighter,
and consumers having a certain desire for a “normal” vehicle weight. Although the
35
difference in mean weights between hybrids and the overall market is not very dramatic,
hybrids are more tightly spread and max out at a much lower weight. Thus, in spite of the
relatively close means, interpretation of the weight coefficient should still reflect the fact
that a “heavy” hybrid is nowhere near the same as a “heavy” conventional vehicle.
I then turn to the coefficients on gas price and LCV score, the two factors that lie
at the heart of the debate on what exactly is driving demand for hybrids. Surprisingly, gas
price is found to be insignificant. It is possible, however, that part of the effect of gas
price may be picked up by the LCV term. According to the Energy Information
Administration, around one-fifth of gasoline price is determined by federal and state
taxes, with an additional component entering in the form of local and county taxes (EIA,
2006). These taxes vary from region to region and, at the state and local level, tend to be
levied or strengthened in an attempt to reduce gasoline consumption by increasing its
price (Fullerton & West, 2002). Higher gas taxes, and by extension higher gas prices, are
therefore often found in areas with environmentally-minded officials. Consequently, it is
feasible that the inclusion of the LCV score is crowding out the effects of regional
variation in gas price. To confirm this, I ran an alternate regression that excluded the
LCV score, and as predicted found that the coefficient on gas price turned significant and
positive. Thus, these results do not prove gas price to be insignificant; rather, they
highlight the limitations of using cross-sectional data. In order to more accurately
investigate the effects of changes in gasoline price, I would need panel data, preferably
starting before the rise in gas prices and continuing through the recent spike.
The LCV score is found to be positive and significant, as expected. Its relatively
small magnitude, however, is somewhat surprising. In light of the fact that many people
36
still believe hybrids are not cost-effective, I had expected environmentalism to have a
strong effect on hybrid demand. It is possible that LCV score did not do a good job of
proxying for community environmentalism. Or perhaps community environmentalism is
irrelevant, as consumers ignore the judgment of their peers and make buying decisions
based solely on their own environmental preferences. Further investigation and use of an
alternate proxy or more detailed data on environmental sentiment would be needed to
determine which is more likely to be the case.
The effectiveness of government incentives appears to be a mixed bag. The
insignificance of free parking is understandable, as it only applies to select areas and lots
in the DMA, and so could lack broad appeal to those who do not travel to those locations.
The insignificance of the size of the federal rebate and exemption from sales taxes may
indicate that tax incentives are not very effective at stimulating demand for hybrids. Note,
however, that these results can only evaluate the effect of the size of the rebate, not the
existence of the rebate itself. There may also be endogeneity issues at play with regards
to the rebate, since the size of the rebate is directly influenced by vehicle sales. But
because running the regression without the rebate did not significantly change the results,
I kept it in the main specification. On the bright side, exemptions from emissions
inspection and access to HOV lanes were both found to be positive and significant, with
the magnitude for emissions exemption being quite a bit larger than that for HOV access.
Demographic variables were also met with mixed success in terms of having
explanatory power for hybrid demand. Education and race are insignificant.
Median household income had a relatively small, positive, and significant effect on
demand for hybrids, which can be attributed to the fact that hybrids are on average more
37
expensive than conventional gas-powered vehicles. Commute time is found to be
negative, significant, and somewhat large. This may be related to comfort, as hybrids are
often smaller and lacking in amenities compared to similarly-priced gas-powered
vehicles. Thus, consumers who spend more time in their cars may view that as more of a
drawback. The proportion of the population over 65 is insignificant, but the proportion
under eighteen has a large, positive, and significant effect on demand. The proportion of
the population under eighteen is positively correlated with the proportion of younger
adults. This inverse relationship between age and hybrid demand supports Kayser’s
earlier results regarding age and implicit preference for fuel efficiency. Also, younger
adults have been found to be more likely to adopt new technology that they consider
useful, whereas older adults tend to be more concerned with societal norms and the extent
to which others see the technology as necessary (Morris & Venkatesh, 2000). Young
consumers who see value in hybrid-electric technology are probably more likely to
purchase a hybrid regardless of how hybrids are viewed by their social network.
Overall, although inclusion of external influences greatly increases the
explanatory power of the model, it seems that the set of variables that constitute the
primary determinants of demand for hybrids is not necessarily vastly different from those
of automobiles in general. Product attributes still tend to have the strongest effects, even
when including government incentives and demographics. Thus, although external
influences such as environmentalism and certain government incentives do aid demand, it
seems hybrids must first and foremost be able to compete with other vehicles in terms of
their attribute-based merits if they hope to gain widespread market penetration.
Technological advancement may therefore be the single most important driver of hybrid
38

demand, as improvements in mechanical design could lessen or even eliminate the
severity of power and size-related sacrifices for fuel-efficiency.
5.3 Determinants of Demand by Vehicle Segment
Vehicle segment likely exerts great influence on the mix of product attributes
consumers prefer most, and would therefore affect relative preference for fuel efficiency
and the extent to which a hybrid model would be able to penetrate the market.
Consequently, the final set of regressions breaks the market into six segments, within
which vehicle models are distributed as follows:
Table 5.3: Distribution among vehicle segments
Segment Hybrids All Models Compact 3 53 Sedan 3 87 SUV 5 104 Minivan 0 18 Truck 0 20 Sport 0 56
With the exception of “Sedan,” all segment labels reflect official vehicle classifications.
Vehicles classified as full-size or mid-size are categorized as sedans for the purposes of
this study. Note that, as of 2006, hybrids had only entered three of the six segments.
Results for minivans, trucks, and sports cars should therefore be particularly interesting.
I then split the dataset according to these six segments and ran product-attribute
based regressions for each one. Results are presented below. Brand nationality and
prestige dummies were occasionally dropped due to a lack of such vehicles in the
segment. Since the sports cars segment contains an unusually high concentration of
MSRP- or power-based outliers that would skew the results, observations sold for an
MSRP of over $80,000 were dropped.
39
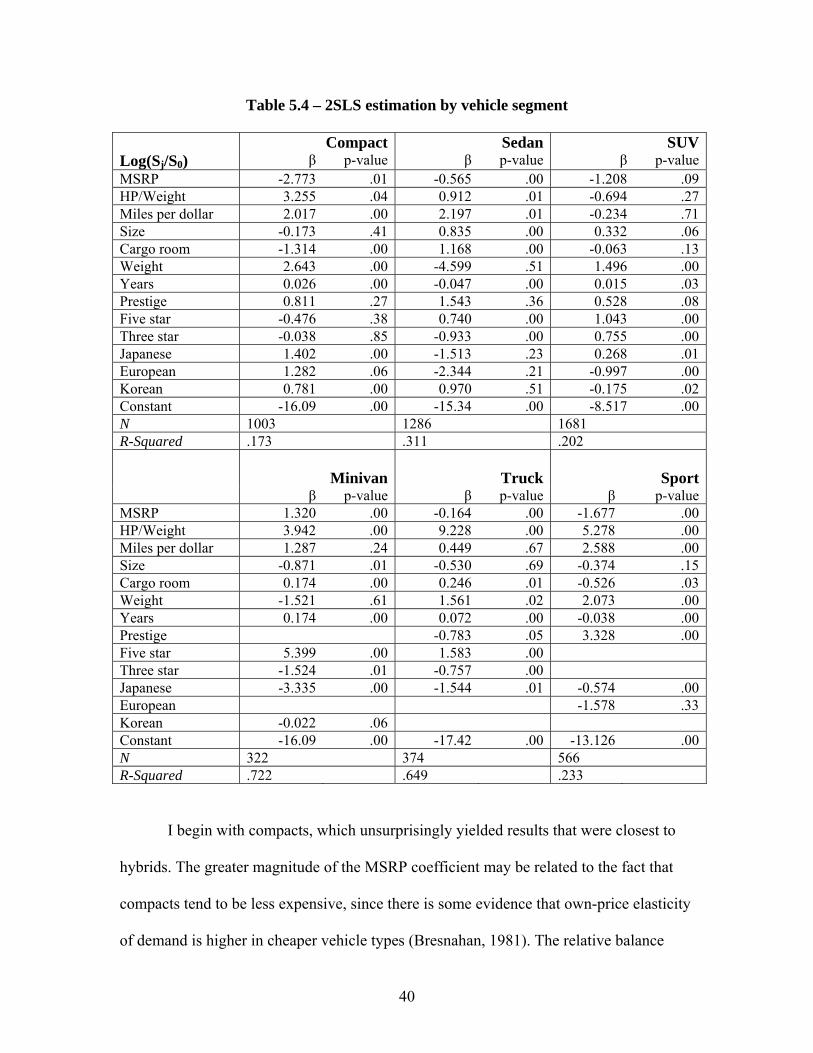
Table 5.4 – 2SLS estimation by vehicle segment
Compact Sedan SUVLog(Sj/S0) β p-value β p-value β p-valueMSRP -2.773 .01 -0.565 .00 -1.208 .09HP/Weight 3.255 .04 0.912 .01 -0.694 .27Miles per dollar 2.017 .00 2.197 .01 -0.234 .71Size -0.173 .41 0.835 .00 0.332 .06Cargo room -1.314 .00 1.168 .00 -0.063 .13Weight 2.643 .00 -4.599 .51 1.496 .00Years 0.026 .00 -0.047 .00 0.015 .03Prestige 0.811 .27 1.543 .36 0.528 .08Five star -0.476 .38 0.740 .00 1.043 .00Three star -0.038 .85 -0.933 .00 0.755 .00Japanese 1.402 .00 -1.513 .23 0.268 .01European 1.282 .06 -2.344 .21 -0.997 .00Korean 0.781 .00 0.970 .51 -0.175 .02Constant -16.09 .00 -15.34 .00 -8.517 .00N 1003 1286 1681 R-Squared .173 .311 .202
Minivan Truck Sport β p-value β p-value β p-valueMSRP 1.320 .00 -0.164 .00 -1.677 .00HP/Weight 3.942 .00 9.228 .00 5.278 .00Miles per dollar 1.287 .24 0.449 .67 2.588 .00Size -0.871 .01 -0.530 .69 -0.374 .15Cargo room 0.174 .00 0.246 .01 -0.526 .03Weight -1.521 .61 1.561 .02 2.073 .00Years 0.174 .00 0.072 .00 -0.038 .00Prestige -0.783 .05 3.328 .00Five star 5.399 .00 1.583 .00 Three star -1.524 .01 -0.757 .00 Japanese -3.335 .00 -1.544 .01 -0.574 .00European -1.578 .33Korean -0.022 .06 Constant -16.09 .00 -17.42 .00 -13.126 .00N 322 374 566 R-Squared .722 .649 .233
I begin with compacts, which unsurprisingly yielded results that were closest to
hybrids. The greater magnitude of the MSRP coefficient may be related to the fact that
compacts tend to be less expensive, since there is some evidence that own-price elasticity
of demand is higher in cheaper vehicle types (Bresnahan, 1981). The relative balance
40
between horsepower and fuel efficiency is very close to that of hybrids, and once again it
is important to keep in mind that compact horsepower is lower than average, and compact
fuel efficiency is higher than average. Thus, compact owners seem to exhibit a preference
for moderately powerful vehicles on top of a very strong preference for greater fuel
efficiency. The coefficient on weight is positive, significant, and quite large, reflecting a
possible preference for greater overall strength of the vehicle. Combining the
insignificance of prestige with the positive coefficient on Korean branding, it appears that
compact owners do not care much about brand image when making purchasing decisions.
Finally, the coefficients on Japanese and European branding are positive and significant,
with a greater magnitude on Japanese branding, as was expected.
The bulk of the results for sedans make intuitive sense. MSRP enters as negative
and significant. Horsepower and fuel efficiency both come out positive and significant,
however for the first time fuel efficiency is much greater in magnitude than horsepower.
Excepting sports cars, sedans had the highest values of horsepower per weight, while
sedan fuel efficiency was merely average. Thus, it seems that sedan owners would like to
continue purchasing relatively powerful cars, but now also desire a much greater level of
fuel efficiency. Weight coming back as insignificant lends further credence to the
hypothesis that sedan owners care more about relative horsepower given the vehicle’s
size rather than a high level of overall power. Both size and cargo room are positive,
significant, and relatively high in magnitude. It is worth noting that the strength of the
coefficient on cargo room is stronger for sedans than for any other segment. Five star
ratings have a positive and significant impact on demand, while three star ratings have an
even larger negative and significant effect. Sedan owners therefore are concerned with
41

safety, but seem to be more concerned with avoiding risk than seeking out safer-than-
average vehicles.
Unfortunately, the insignificance of the prestige and brand nationality dummies in
the sedan regression is very surprising and quite difficult to explain. I find it extremely
unlikely that prestige has no effect on consumer demand for sedans, especially given that
many of the most widely recognizable and best-selling luxury vehicles fall into this
segment. Likewise, although it is possible that sedan owners do not have a preference for
one brand nationality over another, it strikes me as very strange that such a preference
would exist for literally every other segment, but disappear in the sedan market. I am
therefore quite skeptical of the accuracy of these particular results. There may be issues
with omitted variable bias at play, perhaps related to the necessity of a more detailed set
of brand dummies rather than generalized prestige and nationality descriptors.
Results of the SUV regression are mostly understandable. The coefficient on
MSRP conforms to expectations. The large, positive, and significant coefficient on
weight is also expected, as is the smaller, positive, and significant result for size. SUVs
tend to grow in height faster than they grow in length and width, so the stronger effect of
weight as opposed to horizontal cross-sectional area makes sense. The strength of the
coefficient on weight likely explains the insignificance of horsepower per ten pounds as
well, as consumers in search of an SUV seem more concerned with overall rather than
relative power. The insignificance of fuel efficiency may also make sense, as the fact that
SUVs sell quite well despite being considerably less fuel efficient than other vehicle
types could reflect an outright disinterest in fuel economy on the part of SUV owners.
Cargo room being insignificant is somewhat unexpected. This may be related to the way
42
in which cargo room was imputed into the dataset. I used the measurement of cargo room
when all seats were in place in order to keep the variable consistent across models and
vehicle segments, since not all models offer the option of folding up seats, nor would all
consumers want to sacrifice seating for storage space. SUVs, however, were much more
likely to have foldaway seats as an option, and the disparity between maximum and
baseline cargo space tended to be very pronounced. Thus, the cargo room term as
imputed into the dataset may not accurately reflect the vehicle’s true storage capacity in
the minds of SUV consumers.
Most of the results for the SUV dummy variables make intuitive sense. Prestige is
positive, significant, and fairly strong. The effects of the brand nationality dummies, on
the other hand, are a bit different than what we have previously seen. Though the
coefficient on Japanese branding remains positive and significant, it is much smaller in
the SUV regression than in others. In addition, the effect of European branding remains
significant but has turned negative. Although Japanese and European manufacturers tend
to have reputations of higher quality or desirability, SUVs are marketed less based on
quality or prestige and more on the basis of a tough, rugged, very individualistic image
(Gunster, 2004). This fits better with consumer perceptions of American as opposed to
foreign branding. Thus, even if a consumer thinks foreign-made vehicles are better than
domestic counterparts in general, when purchasing an SUV they may prefer a more
rugged “American” image.
A five star safety rating has a strong, positive, and significant effect on SUV
demand. Interestingly, however, the three star rating also has a fairly strong, positive, and
significant effect. At first glance this seems very counter-intuitive. In the case of SUVs,
43
however, three star ratings were almost always granted in the rollover tests, not the crash
tests. This is a common problem in SUV design, as increasing height without adequately
increasing width moves the vehicle’s center of gravity upwards and makes it much more
prone to rollover (Penny, 2004). Thus, the positive coefficient on the three star term
seems to have inadvertently caught a taste for height.
Results from the minivan regression are a bit harder to understand. Most
obviously, MSRP has a strong positive effect on demand, which flies in the face of basic
economic intuition. Referring back to the summary statistics, minivans were the most
tightly clustered in terms of price, with an overall range of only fifteen thousand dollars.
Given that price has been shown to influence a consumer’s perception of product quality
(Zeithaml, 1988), minivan owners could be using price as a partial proxy for the quality
of the model. The absence of any quality measures in my specification could therefore be
the cause of the positive coefficient on MSRP. Fuel efficiency, size, and weight all return
insignificant. As was the case with SUVs, minivans are less fuel efficient than average
and owners may simply not care about fuel economy. And similar to MSRP, the
distribution of size and weight is quite tightly clustered in the minivan segment. This
apparent lack of variety probably leads consumers to ignore those factors when deciding
which minivan to purchase. The magnitude of the positive and significant coefficient on
horsepower is somewhat surprising, as one would not expect minivan owners to be overly
concerned with their vehicle’s power. Because minivans have on average fewer
horsepower per ten pounds than vehicles in every other segment, this could reflect a
desire for moderately more powerful options in the minivan market. Both Korean and
Japanese branding have a negative and significant effect. While the Korean results are
44

expected, I cannot think of a good reason as to why minivan owners would so strongly
want to avoid Japanese vehicles. Similar to the problems with nationality dummies in the
sedan regression, there may be brand-level effects muddying the nationality-level results.
Fortunately, the effects of the three remaining terms in the minivan regression
make intuitive sense, especially in light of the fact that minivans are specifically
developed for and targeted towards families with children (Porac et al, 2001). The
positive and significant coefficient on cargo room likely reflects a desire for enough
storage space to meet the needs of transporting or shopping for a family. Five star safety
ratings seem to be the strongest determinant of minivan demand, and three star ratings are
more strongly negative than usual. This makes sense, as parents are extremely concerned
with keeping their children as safe as possible and would want to avoid potentially unsafe
vehicles more than any other type of consumer.
Most of the results for the truck regression fall in line with expectations. MSRP is
negative and significant. Fuel efficiency is insignificant, which again is probably a result
of trucks being less fuel efficient than average and owners not placing a high priority on
fuel economy. Cargo room is positive and significant. Its magnitude may seem small, but
we must keep in mind that trucks already have by far the highest storage capacity of any
segment. Extra cargo capacity on top of that may not be very important, especially given
that truck owners can simply attach a trailer to haul large loads. The results for weight
must be discussed alongside the unusual results for horsepower per ten pounds. Although
both return positive and significant, as expected, the magnitude of the coefficient on
horsepower is extremely large, perhaps too much so. It does make sense, however, that
truck owners would be most concerned with the power of their vehicles relative to its
45

mass, as they need their trucks to be strong enough to handle heavy cargo loads and tows.
The smaller but still relatively large coefficient on weight probably reflects both a desire
for more overall power and a need for greater strength and bulk.
Coefficients on the prestige, safety, and nationality dummies in the truck
regression also make sense. A five star safety rating has a strong, positive, and significant
effect on demand, while a three star rating has a somewhat weaker but still significant
negative effect. While the negative direction of the prestige coefficient might seem
counterintuitive, it is worth noting that there was only one qualifying model in the truck
segment, so the prestige coefficient is probably picking up consumer taste for unobserved
characteristics of that particular model more than anything else. The negative, significant,
and relatively large magnitude of the Japanese term matches expectations. Pickup trucks
are seen as distinctly American, and although Japanese models have been making some
headway in recent years, the market for trucks is still unambiguously dominated by
American brands.
Finally, the results for sports cars are quite interesting. MSRP is negative and
significant, as is cargo room. Given that sports cars are built for performance rather than
convenience, and therefore tend to have very little storage space, the latter is not at all
surprising. The coefficient on prestige is positive, significant, and quite large. Sports cars
are often thought of as “trophies” of sorts, so it makes sense that prestige associated with
either the brand or the specific model would be very important. The negative and
significant coefficient on Japanese branding and the insignificance of European branding,
on the other hand, are somewhat unexpected. Similar to trucks and SUVs, this could be
another case in which a “performance” vehicle gets a boost from domestic branding. Also
46
note that safety ratings were excluded from the regression. A high proportion of sports
cars did not have crash test data available and the exclusion of these models when
specifically investigating demand for sports cars would bias the results.
Of particular interest, however, are the results for horsepower per ten pounds, fuel
efficiency, and weight. Unsurprisingly, horsepower per ten pounds is by far the strongest
determinant of demand. Its very high coefficient comes on top of the fact that sports cars
already have a much higher mean horsepower than the rest of the dataset. The strong
positive and significant coefficient on weight may also reflect a desire for a high level of
horsepower overall. What is interesting, however, is that fuel efficiency also returns a
strong, positive result. In fact, only horsepower and prestige exert a stronger influence on
demand. Keep in mind that the average fuel efficiency of the sports cars used in this
regression is already quite close to the industry average, so the strength of the coefficient
on gas mileage does in fact reflect a desire for superior fuel economy. It therefore seems
like sports car owners may in fact think practically when making purchasing decisions, at
least in the matter of fuel efficiency.
I can now use these results to discuss the possibility of successfully introducing
new hybrids in each segment, as well as the extent to which we might be able to expect
further hybrid penetration of segments that already have hybrid models. Consumers of
compacts and sedans, both of which currently house a few hybrid models, display a
pronounced preference for greater fuel efficiency. In the case of sedans, this preference
actually outweighs the desire for greater horsepower. Thus, hybrid sedans may be able to
attract consumers in spite of lower horsepower if they are able to make up for the loss in
power with significant gains in fuel efficiency. The same could be said for compacts, but
47
the relative weight given to horsepower over fuel efficiency in the compact results means
producers should tread more carefully. It is certainly fine for a compact to be less
powerful than the average automobile, but a hybrid compact should take care to not
further reduce power by too much compared to other compacts. As proven by the Honda
Insight, a dismal amount of engine power can prove disastrous.
Most surprisingly, the mainstream sports car market also looks like it would be a
viable candidate for hybrid-electric success. Certainly, horsepower and other
performance-based attributes reign supreme. But the strength of the coefficient on gas
mileage shows that the average sports car owner is not closed to the idea of taking
mileage into account when choosing one model over another. Thus, if a hybrid-electric
engine could provide a comparable or superior level of horsepower to the average gas-
powered sports car, it could be a great success. Releasing the model under a prestige
brand would act as an added boost. Whether or not the technology necessary to achieve
this currently exists, however, is unclear. A substantial dip in horsepower for the sake of
improving fuel efficiency would certainly not be advisable. Thus, despite the market’s
apparent readiness for a hybrid-electric sports car, it may be several years before a viable
candidate can be introduced.
In contrast, fuel economy does not appear to be of great concern to consumers in
the SUV, minivan, and pickup truck segments. In all three estimations, fuel efficiency
returned insignificant. In addition, both minivans and trucks place a great deal of
importance on relative horsepower, with trucks adding in an extra focus on weight.
Although the insignificance of horsepower per ten pounds for SUVs could be seen as
encouraging, the importance of weight likely accounts for both size-related preferences
48
and desire for vehicles with an overall high horsepower rating. Both power and weight
act as significant barriers to improving fuel efficiency and existing hybrid technology has
not yet found a way around this. Indeed, the hybrid SUVs in the dataset either made great
sacrifices in terms of horsepower or did not make significant strides with regard to fuel
efficiency. The extent to which hybrids could make significant gains in market share in
any of these segments therefore appears uncertain.
In light of that, it might seem like GM’s vice chairman was wrong to claim that
high-margin fuel-inefficient vehicles are, from a manufacturer’s standpoint, a better
choice for hybrids than compacts and sedans. It is important, however, to keep the
limitations of this study’s approach in mind before writing off his statement. I only
studied demand, while an executive in an automotive firm would also have to consider
factors influencing supply. It could be that the cost of developing hybrid technology for
compacts and sedans cannot be recuperated through the low profit margins earned on
their sales. Thus, even if demand for SUV, minivan, or pickup truck hybrids would not be
as strong, the higher profit margins could go further to recover the costs of necessary
research and development. In addition, the estimations presented in this paper can only
describe consumer preferences among already existing options. As of 2006, very little in
the way of fuel efficient SUVs, minivans, or trucks were on the market. It could very well
be the case that there exists a substantial base of consumers that would have liked to
purchase more fuel efficient versions of those vehicles, but were prevented from doing so
by the dearth of options available to them. Introducing hybrid SUVs, trucks, and
minivans could therefore take advantage of an untapped market, the potential size of
which would be unknown. Finally, we should keep in mind that the vice chairman’s
49

statement comes from the perspective of an American manufacturer. According to this
paper’s results, domestic producers enjoy a competitive advantage over foreign brands in
the SUV, pickup truck, and perhaps even minivan segments. Thus, by introducing high-
powered SUV, truck, or minivan hybrids, an American producer would be taking
advantage of an existing competitive edge. It is therefore unsurprising that Ford and
General Motors have favored sport utility hybrids.
VI. Conclusion
In my paper, I utilized the Berry logit framework and data on year 2006 vehicle
registrations to estimate three sets of automobile demand functions. These demand
functions varied in scope, covering the overall market, the hybrid market, and separate
vehicle segments. I found that primary determinants of demand are relatively similar
between the overall market and hybrids, but that they vary wildly among class-based
vehicle segments. Horsepower per ten pounds, fuel efficiency, and weight have a
relatively consistent and strong effect on demand in the overall market, the hybrid
market, and several vehicle segments. The sports car segment in particular returns a high
priority on fuel efficiency, although it is unsurprisingly overshadowed by a much
stronger preference for horsepower. The importance of weight was likely increased by
the nature of the specification, as horsepower was scaled by vehicle curb weight, leaving
the overall weight term to partially reflect the engine’s raw power. In addition, the
existence of a weight-based tax incentive for small business owners increased the
magnitude of weight’s effect. The fact that this particular set of attributes consistently
returns positive and mostly significant points to the importance of balance in positioning
new vehicles in the market. Hybrids benefit from the demonstrated consumer preference
50

for fuel efficiency, but are hurt by the often stronger preference for horsepower and
weight. It may therefore take technological advancements that allow for significantly
increased fuel efficiency without the loss of power and weight before hybrids break out
of their current niche markets. The compact and sedan segments, however, do appear to
be more forgiving of lost horsepower and weight than the SUV, minivan, truck, and
sports car segments. Thus, compact and sedan hybrids are free to place a greater
emphasis on fuel efficiency, while SUV, minivan, truck, and sports car hybrids need to be
more careful to not sacrifice too much in terms of power.
Manufacturers should also be wary of weakening other product attributes shown
to have an effect on demand. Safety ratings, for example, exert a relatively consistent
influence on demand. Hybrid manufacturers need to be particularly careful to avoid low
safety ratings, as the negative effect of perceived safety risk outweighs the positive effect
of exemplary safeness in the hybrid market. The importance of these non-performance
based attributes also varies between segments. Safety reigns supreme in the minivan
segment, while cargo room is very importance in the sedan and pickup truck markets.
Thus, in terms of non-performance-based determinants of demand, manufacturers should
take care to position hybrids as closely to successful existing gas-powered models as
possible. They could also try to lure consumers by improving on these features in their
hybrids; however, given the strength of consumers’ preferences for performance and the
relatively low sales of hybrids, from the manufacturer’s standpoint there is little reason to
specifically limit improvements in these product attributes to hybrid models and to not
extend the upgrades to their conventional gas-powered counterparts as well.
51
In the overall market, the hybrid market, and some vehicle segments, Japanese
branding aids demand relative to the effect of a domestic nameplate. The same holds true
for European brands when applicable. But in performance-based segments such as SUVs,
trucks, and sports cars, domestic manufacturers have an advantage over their foreign
rivals. With the exception of compact, Korean branding always returns as a negative
influence. Thus, domestic manufacturers may find particular success in introducing
hybrid SUVs and trucks, but this nationality-based competitive advantage should be
evaluated against the greater preference for fuel efficiency present in other vehicle
segments. Korean manufacturers may find success with hybrid compacts, but should
probably work to improve their overall image before attempting to introduce hybrids into
other segments. The effect of prestige on demand for hybrids is inconclusive due to the
relative newness of luxury brands in the hybrid market. Brand or model-based prestige
does, however, positively affect demand after controlling for price in the overall market
and in most segments. The consistency of the results on prestige, combined with the fact
that hybrids sold better in markets with higher median incomes, means there is little
reason to believe that prestige branding would not have a positive effect on hybrid
demand once the hybrid market matures and offers a greater array of luxury options.
External influences such as demographics, government incentives, and measures
of environmentalism are shown to have an effect on the demand for hybrid, but these
effects are never so pronounced that they overtake product attributes in importance. Thus,
it seems consumers primarily view hybrids as just another option in the overall
automobile market and make their purchasing decisions based mostly on how well a
model fits their transportation needs and wants. That is not to say, however, that external
52
influences do nothing to lure consumers to or away from hybrids. Environmentalism as
quantified by LCV score has a positive effect on demand, so increasing environmental
awareness and emphasizing the environmental benefits of driving a hybrid could
certainly improve hybrid sales. Median income also has a positive effect, meaning there
may exist special opportunities for luxury brands in the hybrid market. Age appears to
have an inverse effect on demand, implying that marketers should focus their immediate
efforts on younger consumers and wait for widespread changes in attitudes regarding the
importance of fuel-efficiency before aggressively targeting older adults. Commute time,
on the other hand, has a negative effect on demand, so hybrid manufacturers may want to
make their models more comfortable and inviting to consumers who must spend extended
periods of time inside their cars.
Although tax incentives and free parking return insignificant, access to HOV
lanes and exemption from emissions inspection return as positive and significant. What is
particularly interesting is that both these incentives are convenience-based rather than
cost-based, as the primary benefit to consumers relates to saving time rather than saving
money. Given the apparent success of these two incentives, policy makers may find it in
their best interest to investigate other ways to stimulate demand for hybrids through
saving their owners time. One possibility for densely populated urban areas could relate
to increasing access to parking rather than simply decreasing its monetary costs. Hybrid
owners could be exempt from time limits on metered parking spots, or be allowed to park
in areas that normally have time and day-based restrictions on public access. Whatever
the approach, convenience-based incentives certainly seem to be an avenue worth further
exploration.
53
There is great potential for further research on the topic of hybrid demand. The
market for hybrids is fast-growing and constantly changing, with models being added to
and dropped from manufacturer lineups every year. A panel study of the growth of the
hybrid market from its inception in the late 1990s could be very illuminating. Adding a
level of time variance to gas prices would almost entirely disentangle them from the
effects of legislative environmentalism, thus offering a much clearer picture of the effects
of both gasoline prices and environmentalism on hybrid demand. Better data on
environmentalism would also be of great value. Although the proxy used in this paper
may have been valid, a more direct measure of a community’s level of environmentalist
sentiment, such as membership in environmental organizations, would add much to an
analysis of environmentally-motivated consumption. It would be important, however, to
keep in mind that a certain degree of the recent rise in demand for hybrids is likely a
result of their moving out of the early adopter stage and into more mainstream
acceptance, a phenomenon common to newly introduced technologies and entirely
separate from changes in gas price or environmental attitudes.
Individual or household-level data would be extremely useful, as that would allow
for a much more nuanced picture of how factors such as personal environmentalism,
education, age, and other demographics affect demand. Unfortunately, household level
data is quite hard to come by, especially with regards to recent automobile purchases.
Even moving down to the county level, however, would add a great deal of detail and
credence to the results on demographic and geographic influences on demand, as there
was often significant variation within the DMAs themselves. Data on a wider cross-
54
section of the country may also be helpful, although there does not seem to be any reason
to believe that the selection of DMAs biased this paper’s results in any way.
There certainly exists potential for improvement on this paper’s specification. For
example, a model that disentangles the effects of horsepower and weight would clear up
the ambiguity regarding that particular relationship found in my results. Factoring height
into the measurement of size may be useful, as consumer preference for the increased
height of SUVs, trucks, and minivans was never directly measured. Brand-level effects
would also be quite interesting and could potentially shed light on some of the odd results
yielded on the nationality dummies by a few segment-based regressions. Finally, a more
extensive set of explanatory variables, similar in spirit to the data gathered for hybrid
demand, could add a great deal of explanatory power to the segment-specific estimations.
For example, age may have an effect on the demand for sports cars, while family size
could influence demand for minivans.
In spite of its limitations, this paper still offers valuable insight into the
determinants of demand for various types of automobiles and the implications for the
future of hybrid-electric vehicles. As hybrids diversify and enter new areas of the
automobile market, it will be very interesting to see how they are met by varying levels
of success in different vehicle segments, and how external factors such as the continuing
rise of gasoline prices influence consumer preferences. Although it is impossible to
predict future consumer response with any kind of certainty, the results presented here
offer a starting point for manufacturers and policymakers as they investigate how to best
manipulate product characteristics, local incentives, and environmentalist sentiment in
order to attract a larger number of consumers to the hybrid market.
55
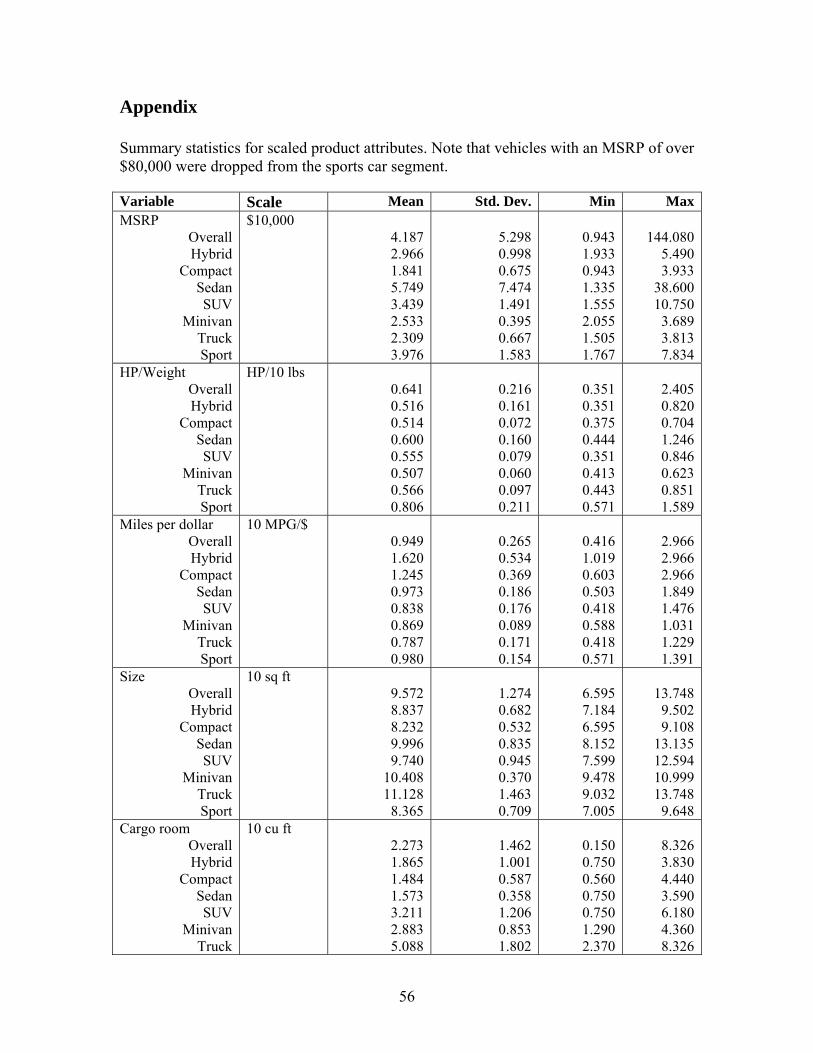
Appendix Summary statistics for scaled product attributes. Note that vehicles with an MSRP of over $80,000 were dropped from the sports car segment.
Variable Scale Mean Std. Dev. Min MaxMSRP
Overall Hybrid
Compact Sedan SUV
Minivan Truck Sport
$10,000 4.187 2.966 1.841 5.749 3.439 2.533 2.309 3.976
5.298 0.998 0.675 7.474 1.491 0.395 0.667 1.583
0.943 1.933 0.943 1.335 1.555 2.055 1.505 1.767
144.080
5.490 3.933
38.600 10.750
3.689 3.813 7.834
HP/Weight Overall Hybrid
Compact Sedan SUV
Minivan Truck Sport
HP/10 lbs 0.641 0.516 0.514 0.600 0.555 0.507 0.566 0.806
0.216 0.161 0.072 0.160 0.079 0.060 0.097 0.211
0.351 0.351 0.375 0.444 0.351 0.413 0.443 0.571
2.405 0.820 0.704 1.246 0.846 0.623 0.851 1.589
Miles per dollar Overall Hybrid
Compact Sedan SUV
Minivan Truck Sport
10 MPG/$ 0.949 1.620 1.245 0.973 0.838 0.869 0.787 0.980
0.265 0.534 0.369 0.186 0.176 0.089 0.171 0.154
0.416 1.019 0.603 0.503 0.418 0.588 0.418 0.571
2.966 2.966 2.966 1.849 1.476 1.031 1.229 1.391
Size Overall Hybrid
Compact Sedan SUV
Minivan Truck Sport
10 sq ft 9.572 8.837 8.232 9.996 9.740
10.408 11.128
8.365
1.274 0.682 0.532 0.835 0.945 0.370 1.463 0.709
6.595 7.184 6.595 8.152 7.599 9.478 9.032 7.005
13.748
9.502 9.108
13.135 12.594 10.999 13.748
9.648Cargo room
Overall Hybrid
Compact Sedan SUV
Minivan Truck
10 cu ft 2.273 1.865 1.484 1.573 3.211 2.883 5.088
1.462 1.001 0.587 0.358 1.206 0.853 1.802
0.150 0.750 0.560 0.750 0.750 1.290 2.370
8.326 3.830 4.440 3.590 6.180 4.360 8.326
56
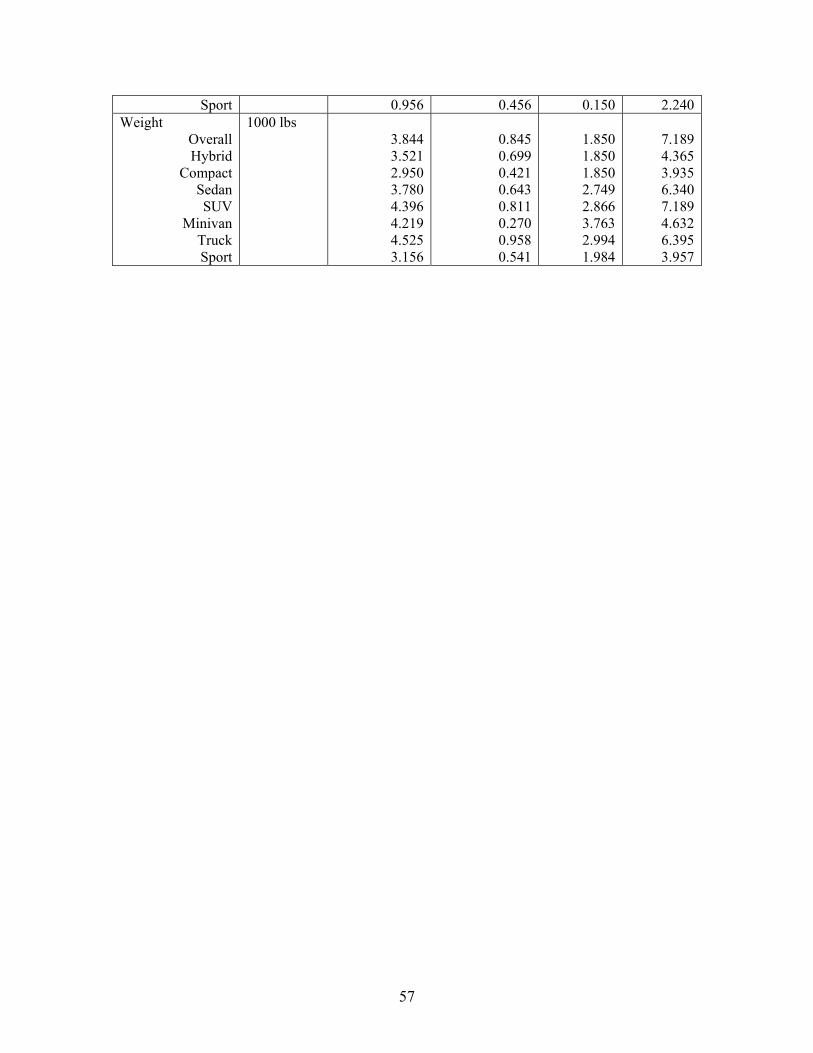
Sport 0.956 0.456 0.150 2.240Weight
Overall Hybrid
Compact Sedan SUV
Minivan Truck Sport
1000 lbs 3.844 3.521 2.950 3.780 4.396 4.219 4.525 3.156
0.845 0.699 0.421 0.643 0.811 0.270 0.958 0.541
1.850 1.850 1.850 2.749 2.866 3.763 2.994 1.984
7.189 4.365 3.935 6.340 7.189 4.632 6.395 3.957
57
References Arguea, N.M., Hsiao, C., & Taylor, G.A. (1994). Estimating consumer preferences using market data: An application to US automobile demand. Journal of Applied Econometrics, 9, 1-18. Beresteanu, A. (2007). Discrete and static choice models based on the Logit model. Berry, S. (1994). Estimating discrete choice models of product differentiation. RAND Journal of Economics, 25 (2), 242-262. Berry, S., Levinsohn, J., & Pakes, A. (1995). Automobile prices in market equilibrium. Econometrica, 63 (4), 841-890. Bresnahan, T. F. (1981). Departures from marginal-cost pricing in the American automobile industry: Estimates for 1977-1978. Journal of Econometrics, 17 (2), 201- 227. Calef, D. & Goble, R. (2007). The allure of technology: How France and California promoted electric and hybrid vehicles to reduce urban air pollution. Policy Sciences, 40 (1), 1-34. Dreyfus, M. K. & Viscusi, W. K. (1995). Rates of time preference and consumer valuations of automobile safety and fuel efficiency. Journal of Law and Economics, 38 (1), 79-105. Energy Information Administration. (2005). A primer on gas prices. Washington, D.C., National Energy Information Center. Fullerton, D. & West, S.E. (2002). Can taxes on cars and gasoline mimic an unavailable tax on emissions? Journal of Environmental Economics and Management, 43 (1), 135-157. Greene, D.L. (1998). Why CAFE worked. Energy Policy, 26 (8), 595-613. Green, D.L., Patterson, P.D., Singh, M., & Li, J. (2005). Feebates, rebates and gas- guzzler taxes: a study of incentives for increased fuel economy. Energy Policy 33 (6), 757-775. Gunster, S. (2004). You belong outside: Advertising, nature, and the SUV. Ethics and the Environment, 9 (2), 4-32. Isidore, C. (2004). GM: Hybrid cars make no sense. CNN/Money. Retrieved March 22, 2008, from http://money.cnn.com/2004/01/06/pf/autos/detroit_gm_hybrids/ Kayser, H.A. (2000). Gasoline demand and car choice: estimating gasoline demand
58
using household information. Energy Economics, 22, 331-348. Kahn, M.E. (2006). Do Greens drive Hummers or hybrids? Environmental ideology as a determinant of consumer choice and the aggregate ecological footprint. Journal of Environmental Economics and Management, 54 (2), 129-145. Kenworthy, J.R., & F.B. Laube (1999). Patterns of automobile dependence in cities: An international overview of key physical and economic dimensions with some implications for urban policy. Transportation Research, 33, 691-723. Kerwin, K. (2005). The Green American car company. BusinessWeek. Retrieved March 22, 2008, from http://www.businessweek.com/magazine/content/05_39/b3952096.htm Lave, L. B. & MacLean, H. L. (2002). An environmental-economic evaluation of hybrid electric vehicles: Toyota's Prius vs. its conventional internal combustion engine Corolla. Transportation Research, 7 (2), 155-162. Maynard, E. (2007, July 4). Toyota Prius sales benefit from unique design. International Herald Tribune, pp C4. Morris, M.G. & Venkatesh, V. (2000). Age differences in technology adoption decisions: Implications for a changing workforce. Personnel Psychology, 53 (2), 375-403. Nevo, A. (2001). Measuring market power in the ready-to-eat cereal industry. Econometrica, 69 (2), 307-342. Parameswaran, R. & Pisharodi, R. M. Facets of country of origin image: An empirical assessment. Journal of Advertising, 23 (1), 43-56. Penny, D. N. (2004). Rollover of sport utility vehicles. The Physics Teacher, 42 (2), 86- 91. Porac, J., Rosa, J., Spanjol, J., & Saxon, M. (2001). America’s family vehicle: path creation in the US minivan market. In: Garud, R. & Karnoe, P. (Eds.), Path Dependence and Creation. Lawrence Earlbaum Associates, Mahwah, NJ, pp. 213– 242. Santini, D. J., Patterson, P. D., & Vyas, A. D. (1999). The importance of vehicle costs, fuel prices, and fuel efficiency to HEV market success. Proceedings from 79th
Annual Meeting of the Transportation Research Board, Washington, DC. United States Internal Revenue Code. Election to expense certain depreciable business assets. 26 U.S.C. § 179. Zeithaml, V.A. (1988). Consumer perceptions of price, quality, and value: A means-end model and synthesis of evidence. Journal of Marketing, 52 (3), 2-22.
59