Embed Size (px)
Citation preview

8/19/2019 Detection of Ski Slopes in Vibration Spectrums
http://slidepdf.com/reader/full/detection-of-ski-slopes-in-vibration-spectrums 1/7
See discussions, stats, and author profiles for this publication at: https://www.researchgate.net/publication/263320083
Detection of Ski Slopes in Vibration Spectrums
ARTICLE · APRIL 2011
READS
369
3 AUTHORS, INCLUDING:
Mohd Moesli Muhammad
Science and Technology Research Institute f…
21 PUBLICATIONS 11 CITATIONS
SEE PROFILE
Mohd Subhi bin Din Yati
Science and Technology Research Institute f…
15 PUBLICATIONS 9 CITATIONS
SEE PROFILE
All in-text references underlined in blue are linked to publications on ResearchGate,
letting you access and read them immediately.
Available from: Mohd Moesli Muhammad
Retrieved on: 09 March 2016

8/19/2019 Detection of Ski Slopes in Vibration Spectrums
http://slidepdf.com/reader/full/detection-of-ski-slopes-in-vibration-spectrums 2/7
i
DETECTION OF SKI SLOPES IN VIBRATION SPECTRUMS
Mohd Moesli Muhammad*, Subhi Din Yati & Irwan Mohamad Noor
Maritime Technology Division (BTM), Science and Technology Research Institute for
Defence (STRIDE), Ministry of Defence, Malaysia
ABSTRACT
The most important parameter that must be considered in vibration analysis is the recognition
of patterns of faulty data. Ski slopes are commonly present in vibration spectrums when the
transducer is not properly mounted. The primary objective of this paper is to study the effect
of ski slopes on the overall value of vibration level reading. The test was carried out in two
different conditions of mounting; properly mounted and with gap of 2 mm. The properly
mounted transducer had a good vibration spectrum with a smooth and flat pattern of noise
floor. The transducer with gap of 2 mm had a faulty pattern of vibration spectrum. A ski slope
was present, while the noise floor had a rough pattern. Observation of the overall vibrationlevels showed that the vibration level of the 2 mm gap mounted transducer had increased as
compared to the properly mounted transducer. This study demonstrated that loose mounting
of transducers can contribute to the presence of ski slopes in vibration spectrums, resulting in
increase of overall value of vibration level reading.
Keyword: Vibration analysis; loose mounting; ski slope; vibration spectrum; transducer .
1. INTRODUCTION
Vibration analysis is widely used for machinery diagnostics and has been implemented for
many applications in condition monitoring of machinery. In vibration analysis, the recognition
of patterns of faulty data is an essential skill for vibration analysts. Faulty data can be caused
by faulty cables or cable connectors, sensor faults, mounting conditions, settling time, or even
cable movement. One of the typical indications of faulty data pattern is the presence of ski
slopes in vibration spectrums. A ski slope is a high amplitude of very low frequency content
which can cause the increase of overall value of vibration level (Barrett, 2011; Commtest
Instruments Ltd., 2006; Metrix Instrument Co., 2011). Figure 1 shows an example of ski slope
present in the vibration spectrum of a boat propulsion system.
The overall vibration level is the total sum of all energies in the spectrum of the vibration
measured by the transducer within the frequency span chosen (Berry, 2002). The transducer
may even sense vibrations from an adjacent machine and include it within the vibration
spectrum. It collects all vibrations regardless of source or origin, making them part of both
the vibration spectrum and the overall vibration. Overall vibration is different from vibrationspectrums in frequency domain as it is a total summation of all the vibrations, no matter what
the frequency range. Figure 2 shows the overall vibration level of a spectrum. The overall
vibration level is calculated by taking the square of the amplitude ( A2) of each frequency bin
( A ), summing the squared amplitudes, computing the square root of the sum, and dividing this
sum with the noise factor for the FFT window chosen. The equation of overall vibration level
is summarised in Equation 1.
50

8/19/2019 Detection of Ski Slopes in Vibration Spectrums
http://slidepdf.com/reader/full/detection-of-ski-slopes-in-vibration-spectrums 3/7
2
.
i
BF
Figure 1: High amplitude of ski slope at 0 Hz present in the vibration spectrum of a
boat propulsion system.
n
∑ Ai
OA(inRSS) = i=1
N BF
(1)
OA = Digital overall level of vibration spectrum RSS = Root sum square level, which is the “summation of energies” in the
spectrum from F min
to F max
n = Number of FFT lines.
= Amplitude of each FFT line.
= Noise bandwidth for window chosen (1.5 for Hanning Window).
Figure 2: Overall vibration level of a spectrum.
(Source: Berry, 2002)
The problem related to ski slopes is the interruption of online condition monitoring systems
due to the alarm limit being triggered, which means that the vibration level has exceeded the
51

8/19/2019 Detection of Ski Slopes in Vibration Spectrums
http://slidepdf.com/reader/full/detection-of-ski-slopes-in-vibration-spectrums 4/7
limits set. There are many reasons why ski slopes occur and in many cases, it is contributed
by manmade mistake or artefacts (Mobius Institute, 2008; Dahl, 2001).
The primary objective of this paper is to study the effect of ski slopes on the overall value
of vibration level reading. It is demonstrated that loose mounting, which can occur when
the setup of the vibration measurement is not conducted properly, is one of the causes of the
presence ski slopes in vibration. In addition, it is also shown that analysis of vibration shouldnot only be based on overall value reading but must also be in conjunction with vibration
spectrum in the frequency domain in order to validate the data and avoid wrong interpretation
of the system that is being monitored.
2. EXPERIMENTAL SETUP
The test rig used in this study is shown in Figure 3. It consists of an AC motor which is
connected to the shaft and is supported by two bearing housings. A transducer with sensitivity
of 10 pc/g and dynamic range of 0.1 to 12 kHz was used to measure vibration. The transducer
was mounted using a magnet mount in the vertical direction on the bearing housing just above
the drive shaft bearing. The test was carried out in two different conditions of mounting,
properly mounted and with gap of 2 mm (Figure 4). The motor was run at a constant speed of 3,600 RPM or 60 Hz. The data of the vibration measurement test was recorded and the results
were displayed in frequency domain and root mean square (RMS) respectively. Before the
test, the bearing housings were tightened and each component in the test rig was checked to
be in good condition in order to eliminate component fault frequency.
Figure 3: Experimental setup of the test rig: (1) AC drive motor; (2) Bearing housing;
(3) Transducer; (4) Drive shaft; (5) Data acquisition hardware; and (6) Pulse
Labshop software.
52

8/19/2019 Detection of Ski Slopes in Vibration Spectrums
http://slidepdf.com/reader/full/detection-of-ski-slopes-in-vibration-spectrums 5/7
(a) (b)
Figure 4: The two different conditions of transducer mounting tested: (a) Properly
mounted (no gap); and (b) 2 mm gap.
3 RESULTS AND DISCUSSION
The vibration signals from the two conditions of transducer mounting are shown in Figure
5. The results are presented in frequency domain, which is a normal practice in vibrationanalysis to determine the individual frequency of each component (Tongue, 1996; Goldman,
1999; Wowk, 1991). In this paper, the vibration spectrum is zoomed in the range of 100 Hz in
order to examine the ski slope peak at a very low frequency.
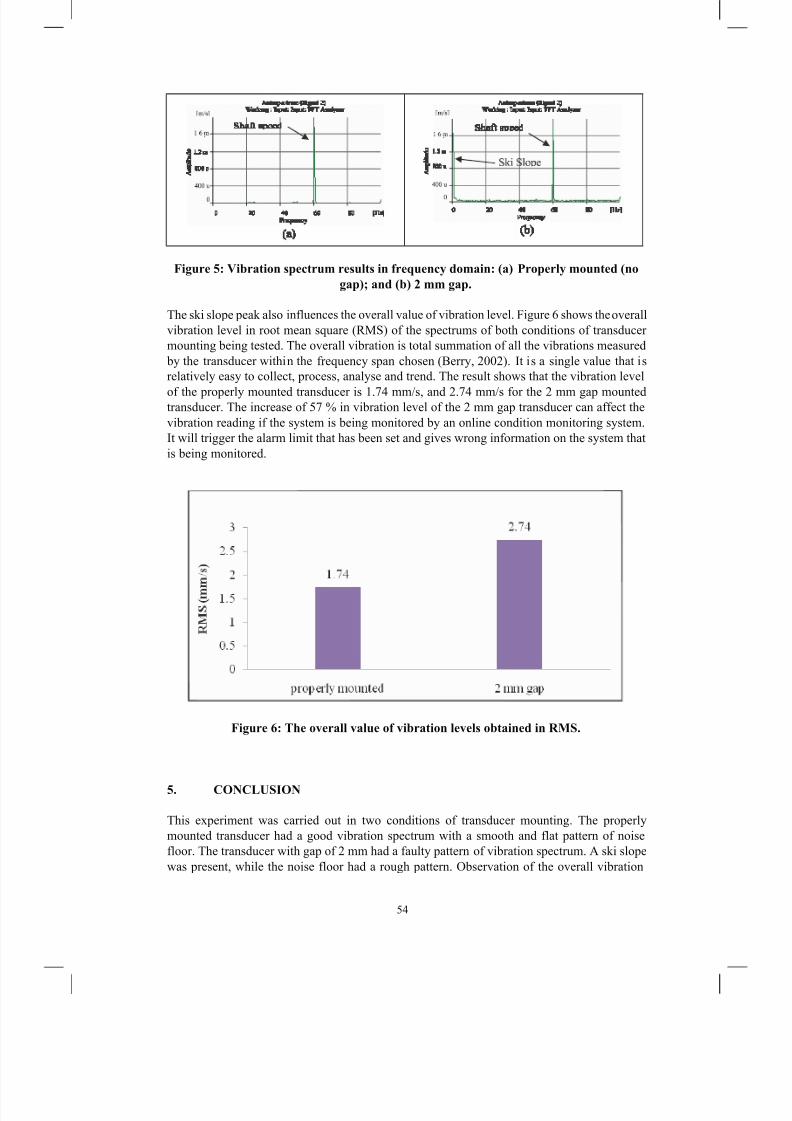
In Figure 5(a), where the transducer was properly mounted, a distinct peak appears at frequency
of 60 Hz and is identified as the shaft or running speed. The noise floor pattern is smooth
and almost flat. Noise floors in vibration spectrums represent the condition of background
vibration during measurements, which causes noise. It can originate from the test rig, cables
or adjacent machinery. Since all sources of noise were eliminated before the experiment was
carried out, a smooth pattern of noise floor was obtained, indicating that the transducer had a
strong contact and was firmly in place on the bearing housing.
The signal of the transducer with gap of 2 mm is shown in Figure 5(b). Similar to Figure 5(a),
the shaft speed appears at frequency of 60 Hz. However, at a very low frequency, near 0 Hz,
a peak with high amplitude is present. This peak is a ski slope, which shows that the data is
faulty . It indicates a faulty vibration spectrum which is due to poor vibration measurement.
The mounting gap affects the contact between the transducer and the bearing housing. The
transducer itself easily rattles and vibrates when the component that is being measured is
vibrating. It creates noise and produces a rough pattern on the noise floor in the vibration
spectrum. However, in practice, the presence of ski slopes is not just limited to mounting
looseness but also can be due to thermal transience, excessive cavitations, saturation of
sensors and sensors being bumped at the beginning of the measurement (Mobius Institute,
2008; Cole-Parmer, 2011; LaRocque, 2011).
53
8/19/2019 Detection of Ski Slopes in Vibration Spectrums
http://slidepdf.com/reader/full/detection-of-ski-slopes-in-vibration-spectrums 6/7
Figure 5: Vibration spectrum results in frequency domain: (a) Properly mounted (no
gap); and (b) 2 mm gap.
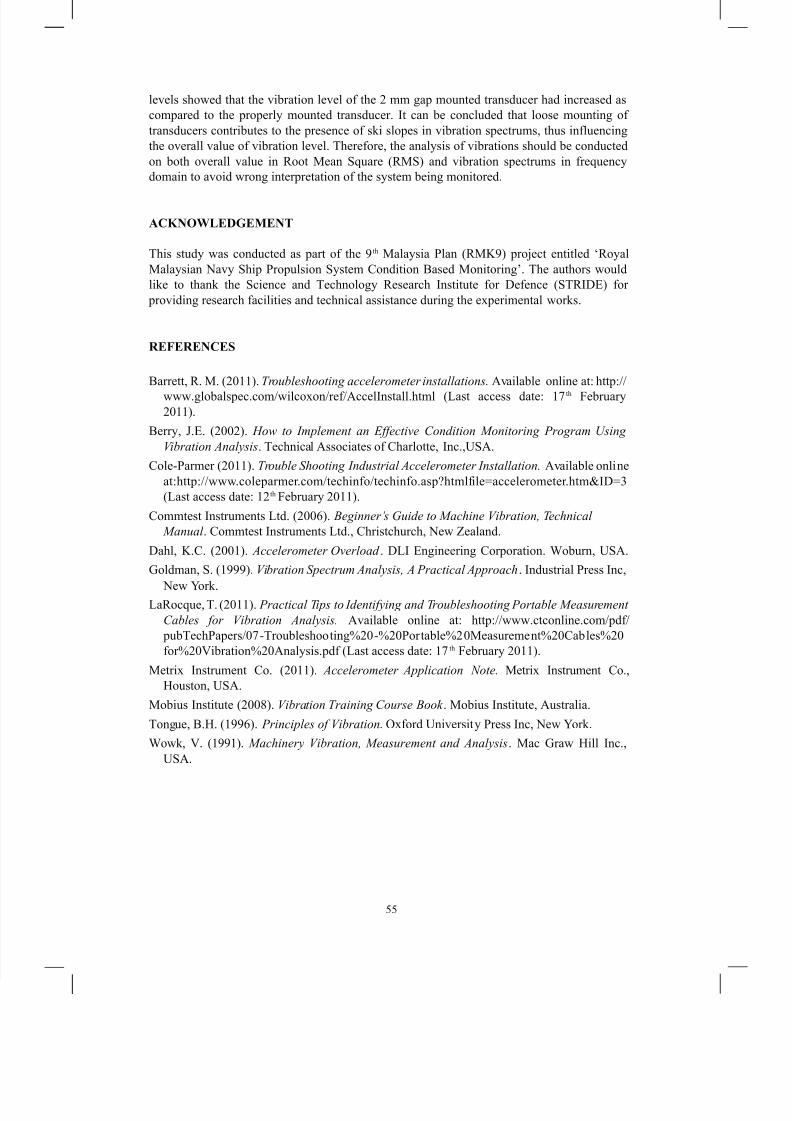
The ski slope peak also influences the overall value of vibration level. Figure 6 shows the overall
vibration level in root mean square (RMS) of the spectrums of both conditions of transducer
mounting being tested. The overall vibration is total summation of all the vibrations measured
by the transducer within the frequency span chosen (Berry, 2002). It is a single value that is
relatively easy to collect, process, analyse and trend. The result shows that the vibration level
of the properly mounted transducer is 1.74 mm/s, and 2.74 mm/s for the 2 mm gap mountedtransducer. The increase of 57 % in vibration level of the 2 mm gap transducer can affect the
vibration reading if the system is being monitored by an online condition monitoring system.
It will trigger the alarm limit that has been set and gives wrong information on the system that
is being monitored.
Figure 6: The overall value of vibration levels obtained in RMS.
5. CONCLUSION
This experiment was carried out in two conditions of transducer mounting. The properly
mounted transducer had a good vibration spectrum with a smooth and flat pattern of noise
floor. The transducer with gap of 2 mm had a faulty pattern of vibration spectrum. A ski slope
was present, while the noise floor had a rough pattern. Observation of the overall vibration
54
8/19/2019 Detection of Ski Slopes in Vibration Spectrums
http://slidepdf.com/reader/full/detection-of-ski-slopes-in-vibration-spectrums 7/7
levels showed that the vibration level of the 2 mm gap mounted transducer had increased as
compared to the properly mounted transducer. It can be concluded that loose mounting of
transducers contributes to the presence of ski slopes in vibration spectrums, thus influencing
the overall value of vibration level. Therefore, the analysis of vibrations should be conducted
on both overall value in Root Mean Square (RMS) and vibration spectrums in frequency
domain to avoid wrong interpretation of the system being monitored.
ACKNOWLEDGEMENT
This study was conducted as part of the 9th Malaysia Plan (RMK9) project entitled ‘Royal
Malaysian Navy Ship Propulsion System Condition Based Monitoring’. The authors would
like to thank the Science and Technology Research Institute for Defence (STRIDE) for
providing research facilities and technical assistance during the experimental works.
REFERENCES
Barrett, R. M. (2011). Troubleshooting accelerometer installations. Available online at: http://
www.globalspec.com/wilcoxon/ref/AccelInstall.html (Last access date: 17th February 2011).
Berry, J.E. (2002). How to Implement an Effective Condition Monitoring Program Using
Vibration Analysis. Technical Associates of Charlotte, Inc.,USA.
Cole-Parmer (2011). Trouble Shooting Industrial Accelerometer Installation. Available online
at:http://www.coleparmer.com/techinfo/techinfo.asp?htmlfile=accelerometer.htm&ID=3
(Last access date: 12th February 2011).
Commtest Instruments Ltd. (2006). Beginner’s Guide to Machine Vibration, Technical
Manual . Commtest Instruments Ltd., Christchurch, New Zealand.
Dahl, K.C. (2001). Accelerometer Overload . DLI Engineering Corporation. Woburn, USA.
Goldman, S. (1999). Vibration Spectrum Analysis, A Practical Approach. Industrial Press Inc,
New York. LaRocque, T. (2011). Practical Tips to Identifying and Troubleshooting Portable Measurement
Cables for Vibration Analysis. Available online at: http://www.ctconline.com/pdf/
pubTechPapers/07-Troubleshooting%20-%20Portable%20Measurement%20Cables%20
for%20Vibration%20Analysis.pdf (Last access date: 17th February 2011).
Metrix Instrument Co. (2011). Accelerometer Application Note. Metrix Instrument Co.,
Houston, USA.
Mobius Institute (2008). Vibration Training Course Book . Mobius Institute, Australia.
Tongue, B.H. (1996). Principles of Vibration. Oxford University Press Inc, New York.
Wowk, V. (1991). Machinery Vibration, Measurement and Analysis. Mac Graw Hill Inc.,
USA.
55