Embed Size (px)
Citation preview

I
DETECTION OF AEROBIC GRAM NEGATIVE
BACTERIA AND BACTERIAL ENDOTOXINS
FROM THE ORAL CAVITIES OF PATIENTS ON
CANCER THERAPY
Juliana Susan Mathews
A research report submitted to the faculty of Health Sciences, University of the
Witwatersrand, Johannesburg, in the partial fulfilment of the requirements for the
Degree of Master of Science in Dentistry,
Johannesburg, 2017
II
DECLARATION
I, Juliana Mathews, declare that this research report is my own work. It is being submitted for
the degree of Master of Science in Dentistry to the University of The Witwatersrand,
Johannesburg. It has not been submitted before for any degree or examination at this or any
other University.
(Signature of candidate)
……19………….day of…June……2017

III
DEDICATION
This research report is dedicated to God,
“I can do all things through Him who strengthens me.” Philippians 4:13
my family, who did not stop believing in me
and who remained the “footprints in the sand”.
My parents- who taught me to get up after a fall and start again
My husband, - where there is hope there is faith, where there is faith, miracles happen
and my two children- both young and young at heart who love to dream.

IV
ABSTRACT
Chemotherapy and radiation therapy are the most widely used interventions for the treatment
of cancer. Several adverse effects including mucositis are associated with these therapies,
which affect a patient’s quality of life, resulting in morbidity and mortality. Cancer therapy
also causes an imbalance in the oral flora which allows colonization of the oral cavity with
uncommon bacteria, including aerobic gram negative bacteria and less commonly, Candida.
These organisms can become established in the lesions of oral mucositis. These gram
negative bacteria produce endotoxins. Although the involvement of endotoxins in the
development of systemic infections is well described, the role of endotoxins in oral mucositis
is not known. Therefore, this study investigated the presence of aerobic gram negative
bacteria and endotoxins in the oral cavities of patients receiving cancer treatment and their
role in the development of oral mucositis.
Oral cavity rinse samples were collected from 100 cancer patients on cancer treatment and 50
healthy individuals. Ethical clearance was obtained from The Committee for Research on
Human Subjects (Medical). The demographic and clinical data were recorded. Samples were
serially diluted and cultured onto Mitis Salivarius Agar for Streptococci, Baird Parker Agar
for Staphylococcus aureus, MacConkey Agar for aerobic gram negative bacteria (AGNB)
and Chromagar for Candida species. Colony counts were obtained and the cultures of AGNB
and Candida species were further identified at the species level using the API technique. An
antimicrobial susceptibility test was performed on AGNB. Oral rinse samples were further
tested for the presence of endotoxin using the Hycult Biotech Limulus Amebocyte Lysate
(LAL) assay. Results were analysed using the Mann-Whitney and chi-square test. P-values of
≤ 0.05% were considered significant.
Eighty percent of cancer patients were females with breast (58%) or cervical cancer (9%).
The majority of these patients were on chemotherapy (61%), were receiving a combination of
chemotherapeutic drugs and had completed many cycles of chemotherapy treatment. Twelve
percent of patients had oral mucositis of various grades. Healthy individuals also comprised
of mainly females (76%). All cancer patients and 98% of healthy individuals carried
Streptococci. No significant difference in the carriage of S. aureus was found between the
two groups. However, the Candida carrier rate was significantly high in cancer patients
(55%) compared to the healthy (20%) individuals (p<0.01). Although the Candida counts
were not different between the groups (p>0.05), cancer patients carried a variety of Candida

V
species and some patients carried more than one type of Candida species in their oral cavity.
In addition, C. glabrata was only found in cancer patients. Between the groups of cancer
patients and healthy individuals, no significant difference in the carrier rate of AGNB was
found (cancer 24% vs 14% healthy). However, cancer patients carried a variety of AGNB.
Enterobacter cloacae and Klebsiella pneumonia was isolated from the oral cavities of both
the study groups. These bacteria were resistant to many antibiotics. When the prevalence of
these oral bacteria was compared between patients with and without oral mucositis, it was
found that the percentage prevalence of Candida species was significantly high in patients
with oral mucositis.
A mean endotoxin concentration of 3.65ng/ml and 3.37ng/ml was detected in the oral rinse
samples of cancer patients and healthy individuals respectively. The difference in the
endotoxin between the two groups was not significant (p=0.5). Mean values of 4.1ng/ml and
3.53ng/ml were found in cancer patients with and without oral mucositis respectively. The
difference in the quantities of endotoxins between the two groups was not significant (p=0.6).
In addition, endotoxin present in cancer patients with AGNB (3.39ng/ml) and without AGNB
(3.8ng/ml) was also not significantly different.
These results suggest that although cancer patients carry aerobic gram negative bacteria and
endotoxins in their oral cavities, they may not contribute in the exacerbation of oral
mucositis. However, Candida species may contribute in the exacerbation of oral mucositis
and therefore, during cancer treatment, it is important to take preventative measures to reduce
the colonization of Candida to prevent infection.

VI
ACKNOWLEDGEMENTS
I wish to express my gratitude to the following people who contributed to my research project
My supervisor, Prof M. Patel, senior scientist/lecturer at Oral Biological Sciences
Department at the University of the Witwatersrand for mentoring me with patience
guidance and incredible insight.
The National Research Foundation for their financial support.
The staff of the Oral Microbiology Laboratory, especially Malefaso Whitney, for their
invaluable assistance in the laboratory experiments.
My husband and children for their endless patience, encouragement and moral
support.
My parents for their ongoing encouragement and financial support to fulfil my
research endeavours.
VII
TABLE OF CONTENTS PAGE
TITLE PAGE I
DECLERATION II
DEDICATION III
ABSTRACT IV
ACKNOWLDGEMENTS VI
TABLE OF CONTENTS VII
LIST OF FIGURES XI
LIST OF TABLES XIII
LIST OF ABBREVIATIONS AND ACRONYMS XIV
CHAPTER 1: 1
INTRODUCTION AND LITERATURE REVIEW 1
Introduction 1
1 Literature Review 2
1.1 Cancer epidemiology 2
1.2 Cancer treatment 3
1.2.1 Oral effects of radiotherapy 4
1.2.2 Oral complications of chemotherapy 5
1.2.3 Oral complications of chemoradiation 6
1.3 Oral Mucositis 6
1.3.1 Aetiology of oral mucositis 7
1.3.2 Pathophysiology of oral mucositis 8
1.3.3 Clinical presentation of oral mucositis 9

VIII
1.3.4 Management of oral mucositis 10
1.4 Microbiology of the oral cavity during cancer treatment 11
1.4.1 Cancer treatment and aerobic gram negative bacteria 13
1.4.2 Factors associated with aerobic gram negative bacterial colonization
and oral mucositis 13
1.4.3 Treatment associated with gram negative bacteria and oral mucositis 14
1.5 Endotoxins 15
1.5.1 Endotoxins and oral mucositis 18
1.6 Aim 18
1.6.1 Study Objectives 18
CHAPTER 2 19
MATERIALS AND METHODS 19
2 Study population 19
2.1 Exclusion and inclusion criteria 19
2.2 Ethics 20
2.3 Microbiological analysis 20
2.3.1 Microbiological plating procedure 20
2.3.2 Colony counts 21
2.3.3 The isolation and identification of Candida spp. 23
2.3.4 The isolation and identification of aerobic gram negative bacteria 26
2.4 Antibiotic Sensitivity Test 29
2.5 Endotoxin assay 30
2.6 Statistical analysis of the data 34

IX
CHAPTER 3 35
RESULTS 35
3.1 Demographic data and clinical parameters 35
3.2 Demographic data and clinical parameters of healthy individuals 37
3.3 Microbiological analysis of oral rinse samples collected from the
cancer patients on treatment 37
3.4 Antimicrobial susceptibility of aerobic gram negative bacteria isolated
from the oral cavities of cancer patients on treatment 38
3.5 Microbiological analysis of oral rinse samples collected from
healthy individuals 40
3.6 Antimicrobial susceptibility of aerobic gram negative bacteria isolated
from the oral cavities of healthy individuals 41
3.7 Summary results of cancer patients and healthy individuals 42
3.8 S. aureus, Candida species and aerobic gram negative bacteria (AGNB)
in cancer patients with and without oral mucositis 44
3.9 Endotoxin in the oral rinse samples of cancer patients and healthy
Individuals 45
3.10 Endotoxin in the oral rinse samples of cancer patients with and without 46
oral mucositis
3.11 Endotoxin in the oral rinse samples of cancer patients with and without 48
aerobic gram negative bacteria
CHAPTER 4 50
DISCUSSION 50
4.1 Streptococci and S. aureus 52

X
4.2 Candida species 54
4.3 Aerobic gram negative bacteria 55
4.4 Endotoxin 58
4.5 Prevention, treatment and recommendations 61
CHAPTER 5 64
CONCLUSIONS, LIMITATIONS AND FUTURE RESEARCH 64
5.1 Conclusions 64
5.2 Limitations 65
5.3 Future research 65
CHAPTER 6 66
REFERENCES 66
CHAPTER 7 83
APPENDICES 83
Appendix A: Data collection sheets 83
Appendix B: Consent form 85
Appendix C: Ethics clearance certificate 86
Appendix D: Composition and preparation of Media 87
Appendix E: Raw data of microbiological results 89
Appendix F: Endotoxin Assay Results 94
Appendix G: Statistical analysis 96
XI
LIST OF FIGURES PAGE
Figure 1.1 Various grades of oral mucositis 10
Figure 2.1: Layout of agar plates for the microbiological analysis 21
Figure 2.2: Colonies of Streptococcus mutans on a Mitis Salivarius Agar plate 21
Figure 2.3: Colonies of Staphylococcus aureus on a Baird Parker Agar plate 22
Figure 2.4: Mixed culture of Candida species on a Chromagar plate 22
Figure 2.5: Plate A and B: Colonies of aerobic gram negative bacteria on a 23
MacConkey Agar plate
Figure 2.6: Isolated colonies of Candida spp. on Sabouraud Agar plate 24
Figure 2.7: API® 20 C AUX system for the identification of Candida species. 25
Figure 2.8: Plate A and B: isolation of aerobic gram negative bacteria on 26
MacConkey Agar plates
Figure 2.9: Oxidase test for aerobic gram negative bacteria 27
Figure 2.10: API® 20 E system for the identification of aerobic gram negative 28
bacteria
Figure 2.11: Antibiotic Susceptibility Test Müeller-Hinton Agar plate 30
Figure 2.12: Preparation of dilutions of standard series of E. coli endotoxin 33
Figure 2.13: The assigned wells for the standard series, samples and controls 34
Figure 3.1: Prevalence of S. aureus, Candida species and aerobic gram negative 43
bacteria (AGNB) in the oral cavities of cancer patients and healthy
individuals
Figure 3.2: Prevalence of S. aureus, Candida species and aerobic gram negative 44
bacteria (AGNB) in the oral cavities of cancer patients with and
without oral mucositis

XII
Figure 3.3: Presence of endotoxin in the oral rinse samples of cancer patients 46
on treatment and healthy individuals
Figure 3.4: Presence of endotoxin in the oral rinse samples of cancer patients 48
with and without oral mucositis
Figure 3.5: Presence of endotoxin in the oral rinse samples of cancer patients 50
with and without aerobic gram negative bacteria
Figure 4.1: Flow diagram of the study and outcome 51
LIST OF TABLES PAGES
Table 2.1: Contents of the cupules of the API® 20 C tray 25
Table2.2: Reading Table: API® 20E System 28
(Adapted from API® 20E System reading manual)
Table 3.1: Demographic data and clinical parameters of cancer patients on 35
treatment
Table 3.2: Demographic data and clinical parameters of healthy individuals 37
Table 3.3: Microbiological analysis of oral rinse samples collected from 38
cancer patients on treatment
Table 3.4: Antimicrobial susceptibility of aerobic gram negative bacteria isolated 39
from the oral cavities of cancer patients on treatment
Table 3.5: Microbiological analysis of oral rinse samples collected from 40
healthy individuals
Table 3.6: Antimicrobial susceptibility of aerobic gram negative bacteria 41
isolated from the oral cavities of healthy individuals
Table 3.7: Summary results of cancer patients and healthy individuals 42
Table 3.8: Presence of S. aureus, Candida species and aerobic gram negative 44

XIII
bacteria (AGNB) in cancer patients with and without oral mucositis
Table 3.9: Presence of endotoxin in the oral rinse samples of cancer patients on 45
treatment and healthy individuals
Table 3.10: Presence of endotoxin in the oral rinse samples of cancer patients 47
with and without oral mucositis
Table 3.11: Presence of endotoxin in the oral rinse samples of cancer patients with 49
and without aerobic gram negative bacteria
XIV
LIST OF ABBREVIATIONS AND ACRONYMNS
Ab: Antibiotic
AK: Amikacin
AGNB: Aerobic gram negative bacteria
AP: Ampicillin
API: Analytical profile index
AUG: Amoxicillin-clavulanate potassium
BHI: Brain Heart Infusion
BP: Baird Parker
C: Chloramphenicol
C. albicans: Candida albicans
C. dubliniensis: Candida dubliniensis
C. famata: Candida famata
C. glabrata: Candida glabrata
C. krusei: Candida krusei
C. tropicalis: Candida tropicalis
CAZ: Ceftazidime
cfu/ml: Colony forming units
CIP: Ciprofloxacin
CLSI: Clinical and Laboratory Standards Institute
CO2: Carbon dioxide
COX-2: Cyclooxygenase-2
CPM: Cefepime
CTX: Cefotaxime
CXM: Cefuroxime
DNA: Deoxyribonucleic acid
E. cloacae: Enterobacter cloacae

XV
E. coli: Escherichia coli
E. sakazaki: Enterobacter sakazaki
EFW: Endotoxin free water
ETP: Ertapenem
EU: Endotoxin Units
EU/Kg/Hour: Endotoxin Units/Kilogram/Hour
FDA: Food and Drug Administration
FOX: Cefoxitin
GM: Gentamycin
Gy: Gray
HIV: Human Immunodeficiency Virus
HPV: Human papillomavirus
HSCT: Hematopoietic stem cell transplant
I: Intermediate
IARC: The International Agency for Research on Cancer
IL-1β: Interleukin 1β
IL-6: Interleukin 6
IMI: Imipenem
K. oxytoca: Klebsiella oxytoca
KDO: 2-keto-3-deoxyoctonoic acid
LAL: Limulus Amebocyte Lysate
LPS: Lipopolysaccharide
MEM: Meropenem
ml: Millilitre
MMPs: Matrix metalloproteinases
MRSA: Methicillin-resistant S. aureus

XVI
MSA: Mitis Salivarius Agar
NA: Nalidixic acid
N/D: Not done
NF-κB: Nuclear factor-κB
ng/ml: Nanograms per millilitre
nm: Nanometre
OD: Optical Density
P. aeruginosa: Pseudomonas aeruginosa
P. vulgaris: Proteus vulgaris
pg/ml: Picogram per millilitre
PTA: Polymyxin, tobramycin, and amphotericin B
PTZ: Piperacillin-tazobactam
R: Resistant
ROS: Reactive oxygen species
S Susceptible
S. aureus: Staphylococcus aureus
S. epidermidis: Staphylococcus epidermidis
S. pneumoniae: Streptococcus pneumoniae
S. sanguis: Streptococcus sanguis
SD: Standard deviation
TN: Tobramycin
TLR4: Toll-like receptor-4
TNF-α: Tumour necrosis factor- α
TS: Trimethoprim-sulfamethoxazole
5-FU: 5-fluorouracil
μl: Microlitre

1
CHAPTER 1
INTRODUCTION AND LITERATURE REVIEW
Introduction
The development of cancer arises from the mutagenesis of normal cells from a particular
organ as a result of the interaction of complex aetiologies. Various treatment modalities are
used but intensive chemotherapy and radiotherapy are conventionally required. Several
adverse effects including mucositis are associated with these therapies, which affect a
patient’s quality of life, resulting in morbidity and mortality. Oral mucositis is associated
with immense oral discomfort, excruciating pain, an altered taste sensation, painful
swallowing and subsequent dehydration and malnutrition. Due to the loss of balance between
commensal bacteria and opportunistic bacteria, changes in the oral environment and
microbiome occurs. Some of these opportunistic bacteria such as gram negative bacteria and
Candida species become established in the lesions of oral mucositis. These gram negative
bacteria produce endotoxins and Candida species produce hydrolytic enzymes as virulence
factors. The endeavour to find an efficient solution to manage and prevent this pathology has
been challenging. The efficacy of antimicrobials and other treatment modalities have been
controversial. Although the involvement of endotoxins in the development of other bacterial
infections is well described, the role of endotoxins in oral mucositis is not known. Therefore,
this study investigated the presence of aerobic gram negative bacteria and endotoxins in the
oral cavities of patients receiving cancer treatment and their role in the development of oral
mucositis.

2
1 Literature Review
1.1 Cancer epidemiology
Cancer-related deaths have reached epic proportions, both in South Africa and
internationally. This pandemic has amounted to approximately 8.2 million cancer-related
deaths in 2012 and an incidence of 14.1 million cancer cases reported every year
(GLOBOCAN 2012). By 2030, this is expected to rise to 21.7 million new cancer cases and
13 million cancer deaths (GLOBOCAN 2012). In recent articles (Stefan et al, 2013 and
Sartorius et al, 2016), by 2030, South African cancer rates have been predicted to escalate by
78%. Cancer can arise from a complex aetiology affecting various cells and organs (Baskar et
al, 2012). Although the incidence and mortality rates in western developed countries have
decreased, almost half the number of reported incidences worldwide has been related to lung,
female breast, colorectal and stomach malignancies (Jemal et al, 2010). Lifestyle factors such
as smoking, alcohol, a sedentary lifestyle and obesity are risk factors seen in western
countries, but increased incidences in cervical, liver and stomach cancers, have been related
to cancers developing from infectious agents in underdeveloped countries and improved
socioeconomic countries (Jemal et al, 2010).
The habitual use of tobacco and alcohol are predominant risk factors in the development of
head and neck carcinomas. In less developed countries, carcinogenic infection is an important
cause of cancer. Of concern, oncogenic viruses such as the Epstein- Barr virus, Human
papillomavirus virus (HPV) and Helicobacter pylori have been linked to endemic
nasopharyngeal cancer, oropharyngeal cancers and gastric cancer respectively (Jemal et al,
2010; Schoenfeld, 2015 and Plummer et al, 2016 ). The development of HIV-related cancers
has been associated with immunosuppression and the increased expression of carcinogenic
infectious agents (IARC, 2012 and Plummer et al, 2016). Many cases of fatalities could be
prevented in countries where HIV and HPV are prevalent, by implementing screening
procedures, proper diagnosing and treatment of precancerous lesions (Crosbie et al, 2013 and
Plummer et al, 2016).
3
Various other risk factors are commonly associated with cancer, including prolonged sun
exposure, demographic factors, occupational inhalants, marijuana use, poor nutrition and
immunosuppression (Khan and Khan, 2015). Family history and pre-existing medical
conditions play a significant role (Pai and Westra, 2009; and Khan and Khan, 2015).
Hormone replacement therapy and oral contraceptives may increase the risk of some cancers
but decrease it for others. Ironically, specific chemotherapy agents such as Chlorambucil
have been found to allow growth of cancer at a different anatomical site (American Cancer
Society, 2014).
1.2 Cancer treatment
Most cancers are treated with surgery, radiotherapy, chemotherapy and immunotherapy
(Payne and Miles, 2008). The choice of treatment depends on the site, grade and stage of
tumor, as well as the patient’s age and general medical condition (Khan and Khan, 2015).
Surgery with complete tumour resection, radiotherapy and /or chemotherapy are used to treat
most early stages of cancer, but stage III and IV malignancies may require adjuvant
radiotherapy and chemotherapy for effective tumour regression and organ preservation for
better survival (Caballero et al, 2009 and Alvarez et al, 2015). Surgery can be aggressive,
consequently affecting aesthetics and function and therefore can affect the patient both
socially and psychologically. Regardless of treatment, recurrence of the tumour can occur at
the same region and if distant metastasis occurs, death can be inevitable (Alvarez et al, 2015).
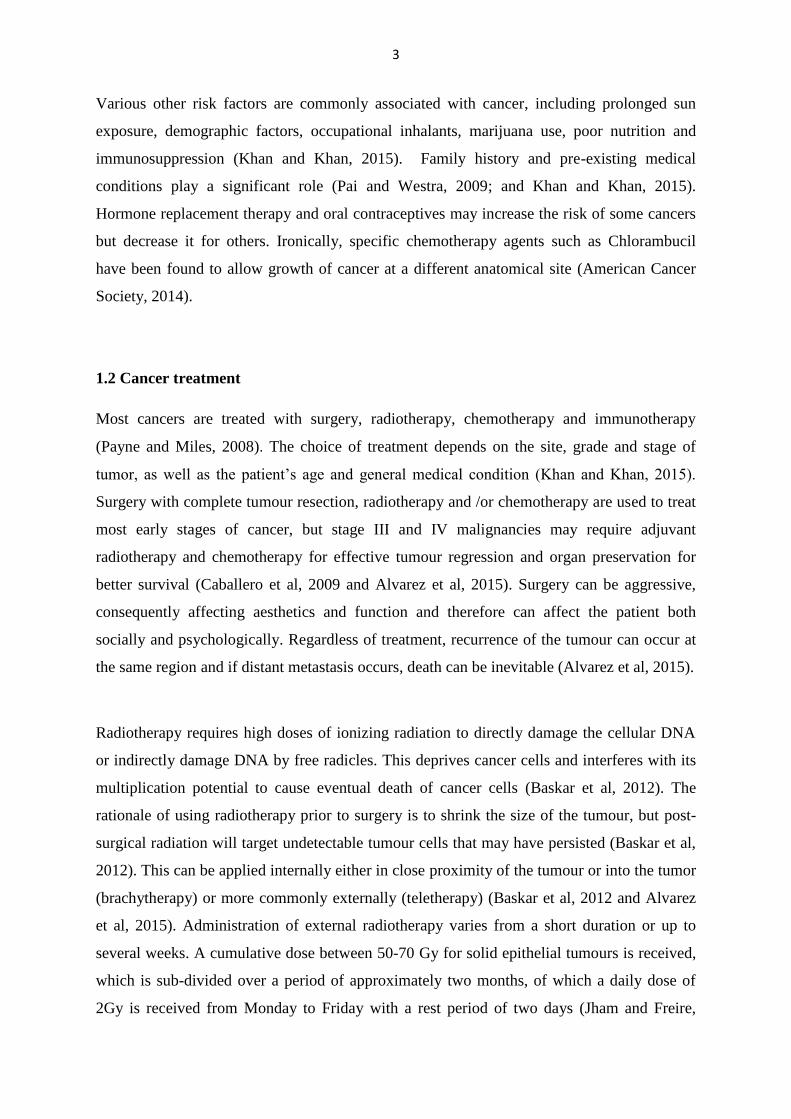
Radiotherapy requires high doses of ionizing radiation to directly damage the cellular DNA
or indirectly damage DNA by free radicles. This deprives cancer cells and interferes with its
multiplication potential to cause eventual death of cancer cells (Baskar et al, 2012). The
rationale of using radiotherapy prior to surgery is to shrink the size of the tumour, but post-
surgical radiation will target undetectable tumour cells that may have persisted (Baskar et al,
2012). This can be applied internally either in close proximity of the tumour or into the tumor
(brachytherapy) or more commonly externally (teletherapy) (Baskar et al, 2012 and Alvarez
et al, 2015). Administration of external radiotherapy varies from a short duration or up to
several weeks. A cumulative dose between 50-70 Gy for solid epithelial tumours is received,
which is sub-divided over a period of approximately two months, of which a daily dose of
2Gy is received from Monday to Friday with a rest period of two days (Jham and Freire,

4
2006). Moreover, this allows the tumour to receive the maximum required dosage of
radiation, thereby excluding the adjacent healthy tissues from toxicity of the treatment. The
period of rest during the weekend allows for re-oxygenation of tumour cells, increases its
sensitivity towards the treatment and allows for healthy cells to repopulate tissues (Joiner and
van der Kogel, 2009; and Alvarez et al, 2015).
The principle of chemotherapy is to interfere with replicating cancer cells within the various
phases of the cell cycle, thereby causing selective cell death and inhibiting tumour growth
(Sak, 2012 and Alvarez et al, 2015). This cocktail of drugs, work in synergy to reduce the
development of resistance and to allow for better efficacy of treatment, without injuring the
host (Sak, 2012 and Alvarez et al, 2015). Cytotoxic drugs such as methotrexate and
vincristine are active at specific periods in the cell cycle to kill proliferating cells and are
affected by the duration of exposure. Chemotherapeutic agents such as chlorambucil and
cisplatin can efficiently target tumour cells throughout the whole cell cycle and their degree
of cytotoxicity is dose dependant (Payne and Miles, 2008 and Sak, 2012). Adjuvant
chemotherapy is required if there is a known risk of relapse, due to the aggressive nature of
the cancer. As there is a lack of specificity towards cancer cells and normal rapidly dividing
cells, with certain cytotoxic drugs such as 5- fluorouracil and cisplatin, these result in
adverse effects of bone marrow suppression, loss of hair, mucositis, nausea and vomiting,
which have been associated with the morbidity of this treatment (Payne and Miles, 2008).
1.2.1 Oral effects of radiotherapy
Intraorally, acute complications can arise as a result of salivary hypofunction from direct
injury of the salivary glands by radiation. This can be reversible, although irreversible and
permanent xerostomia can affect the volume and quality of saliva produced. Xerostomia can
temporarily affect the sense of taste which affects a patient’s appetite and nutritional status,
but permanent side effects of a reduction or loss in taste can persist (Alvarez et al, 2015).
The sparse volume of saliva becomes more viscous and the buffering capacity is reduced,
with a change in the salivary electrolyte concentration and the compromise of the host’s oral
defence system (Kielbassa et al, 2006, Naidu et al, 2004 and Gupta et al, 2015). Oral
5
tenderness, tooth decay, oral disease and difficulty in swallowing are common complaints
associated with this treatment. It accounts for a reduction in oral clearance, allowing for an
acidic environment to persist and the emergence of cariogenic bacteria such as Streptococcus
mutans and Lactobacillus, as seen in a study by Epstein et al, (1998).
These cancer patients are more likely to develop periodontitis, bacterial and viral infections
and oral candidosis (from Candida species) associated with immunosuppression (Gupta et al,
2015 and Jham and Freire et al, 2006). The emergence of opportunistic infections, largely
due to Candida infections, is associated with radiation-related hyposalivation, the presence of
oral prostheses, poor oral care and vices such as tobacco smoking and the consumption of
alcoholic beverages. Although topical antifungal drugs are the treatment of choice for this
infection, systemic medication is frequently recommended for patients undergoing
radiotherapy (Meurman and Grönroos, 2010 and Alvarez et al, 2015). One of the most
common complications associated with patients undergoing head and neck radiotherapy is
oral mucositis. Late complications of radiotherapy can result in trismus and
osteoradionecrosis (Alvarez et al, 2015).
1.2.2 Oral complications of chemotherapy
The direct effects of stomatotoxicity, depends on the type of chemotherapeutic agent used,
the dosage and frequency. Agents such as cisplatin, 5- fluorouracil and methotrexate are used
in the treatment head and neck cancers, are known to cause mucosal injury as seen in a study
by Kasettya et al, (2012) and consequently, conditions such as oral mucositis and microbial
infections develop (Kasettya et al, 2012). The outcome of this mucosal atrophy is attributed
to the cytotoxic effects of these drugs on the genetic replication and proliferation of basal
cells of the mucosa (Lopez et al, 2011 and Kasettya et al, 2012). Lopez et al, (2012)
concluded that indirect stomatotoxicity was related to signs of bone marrow suppression,
immunosuppression and a loss of the host’s salivary defence mechanisms against infection
(Lopez et al, 2011 and Kasettya et al, 2012).

6
1.2.3 Oral complications of chemoradiation
The combination of radiotherapy and chemotherapy improves therapeutic results, allows for
better tumor control in the region and controls distant metastasis (Joiner and van der Kogel,
2009; and Alvarez et al, 2015). Consequently, high daily doses and total cumulative doses of
radiotherapy to an exposed area, in combination with cytotoxic treatment, can affect the
incidence, severity and duration of the complication (Jham and Freire et al, 2006). The
complications of chemoradiation are similar to the oral complications associated solely from
either treatment, but are significantly accentuated (Kasettya et al, 2012).
1.3 Oral Mucositis
The complications associated with cytotoxic treatment can have a significant impact on
various mucosal tissues in the gastrointestinal tract, including the oral cavity, oesophagus,
stomach and intestine. Symptoms of pain, ulceration, nausea and vomiting, diarrhoea and
rectal bleeding have been reported, depending on the area affected. Individuals experience
different degrees of mucosal injury across different sites within the gastrointestinal tract (Al-
Dasooqi et al, 2013).
Oral mucositis is a debilitating, acute, multifactorial complication associated with cancer
patients receiving radiotherapy, chemotherapy or hematopoietic stem cell transplantation
(HSCT) (Vozza et al, 2015). Clinical symptoms of severe oral pain, bleeding and ulceration
can affect the person’s quality of life and delay the management of cancer. Hospitalization
and additional use of antibiotics and parenteral opioid analgesics delays cancer treatment
(Naidu et al, 2004 and Vozza et al, 2015). As the severity of oral mucositis and pain
heightens, their oral intake is restricted and patients may require the insertion of a feeding
tube for their nutritional requirements and the intake of multiple drugs. Severe oral mucositis
is commonly found in patients that receive radiation of the oral cavity and surrounding
structures and those treated with HSCT, as these patients have prolonged and intense
myelosuppression. It is less frequently seen as a complication of chemotherapy in treating
solid tumours, but it is most severe when the patient has underlying neutropenia (Redding,
2005).
With the initiation of treatment, when doses reach up to 20Gy at the field of radiation or
within two weeks of initiating chemotherapy, either transient hyperkeratinisation or erythema

7
develops. Multiple, daily, fractioned radiotherapy may result in repeated tissue damage
(Redding, 2005 and Vozza et al, 2015) and eventually lead to ulceration covered by a
pseudomembrane and healing can take up to six weeks following the completion of treatment
(Vozza et al, 2015). The severity of radiotherapy-related oral mucositis is affected by factors
surrounding the treatment such as the cumulative dose, the volume of area undergoing
radiation and predisposing patient factors such as habitual use of cigarette smoking, alcohol
consumption (Köstler et al, 2001 and Naidu et al, 2004) and radiation-induced xerostomia as
seen in a study by Franzén et al, (1992).
Oral mucositis associated with chemotherapy is restricted to non-keratinized oral mucosal
tissue with healing and resolution occurring three weeks after the end of treatment (Redding,
2005). This severity is also related to the neutropenic state of the patient. The combined
effects of the type of chemotherapeutic agent used, the therapeutic regimen, the dosage and
the concomitant medication, can affect the severity of ulceration. Lower doses of cytotoxic
agents with prolonged or repetitive administration and prior episodes of chemotherapy-
induced oral mucositis have been implicated in affecting the severity (Köstler et al, 2001).
1.3.1 Aetiology of oral mucositis
Some of these risk factors associated with oral mucositis include age, particularly younger
patients, poor oral health care and hyposalivation before and during treatment. Compromised
nutrition, the type of malignancy, the neutrophil count before treatment and the underlying
genetic predisposition are factors contributing to this pathology (Naidu et al, 2004). There is a
higher chance of stomatotoxicity with the use of 5-fluorouracil (5-FU) in combination with
anthracycline-based, taxane-based or platinum-based chemotherapeutic drugs (Redding,
2005). Methotrexate found in saliva contributes to the development of oral mucositis. When
used in combination with drugs such as antidepressants, which have an anticholinergic effect,
can promote xerostomia and enhance the symptoms of oral mucositis (Naidu et al, 2004).
Chemoradiation is a choice of treatment to allow for better cancer response, but
consequently, it is proportionally responsible for the high oral mucositis rates (Redding,
2005). Any form of iatrogenic trauma such as ill-fitting dentures and defective restorations
can initiate ulceration. Cancer patients are prone to oral mucosal infections of bacterial, viral
and fungal aetiology, and these can exacerbate oral mucositis with the resultant ulceration
acting as a portal of entry for these organisms into the systemic circulation (Redding, 2005).

8
Other factors include the substitution of gram-positive bacteria for gram-negative bacteria as
a result of the tumour, the cancer treatment and supportive therapies (Donelly et al, 2003 and
De Sanctisa et al, 2016). Alcohol consumption predisposes the patient to malnutrition and
immunosuppression; and the accumulation of alcoholic toxic metabolites allows for mucosal
damage, thereby enhancing the progression of oral mucositis. Cigarette smoking elicits
mucosal inflammation and causes the host defence mechanism to be vulnerable to infectious
agents and therefore compromising the healing of oral mucositis (De Sanctisa et al, 2016).
1.3.2 Pathophysiology of oral mucositis
The pathology of oral mucositis can be divided into various phases. The first phase involves
the initiation of oral mucositis. Direct injury to the basal cellular epithelium occurs due to
DNA strand breaks and the generation of oxidative stress and reactive oxygen species (ROS)
by radiation and/or chemotherapeutic agents. This ROS directly damages the mucosal cells,
tissues and blood vessels and it also stimulates the release of transcription factors which
initiates this toxicity in the mouth (Sonis et al, 2004).
During the second phase, injury to the DNA strands and the ROS, activate transcription
factors such as Nuclear factor-κB (NF-κB). Proinflammatory cytokines such as tumour
necrosis factor- α (TNF-α), Interleukin-1β (IL-1β), and Interleukin-6 (IL-6) are produced
contributing towards tissue injury and apoptosis. Apoptosis can also be activated by the
ceramide pathway with the production of sphingomyelinase or ceramide synthase. With the
destruction of fibronectin, the activated macrophages activate matrix metalloproteinases
(MMPs) that cause direct tissue injury (Sonis et al, 2004 and Redding, 2005). NF-κB also
upregulates genes to activate cyclooxygenase-2 (COX-2), which causes inflammation,
oedema and tissue damage with the production of prostaglandin from the submucosal
fibroblasts and endothelial cells after two weeks of radiation (Al-Dasooqi et al, 2013).
In the signalling and amplification stage, proinflammatory cytokines indirectly exaggerate
mucosal injury. A further production of cytokines allow further tissue injury via other
pathways like the ceramide and caspase pathway and NF-κB activates the transcription
pathway (Sonis et al, 2004).
9
The ulcerative phase is the most clinically significant phase associated with pain, oral
discomfort and loss of function, as the mucosa is breached and the neuronal endings are
exposed (Redding, 2005). Pathogenic bacterial colonization of gram positive, gram negative
and anaerobic bacteria, occur. The presence of endotoxins released from the cell walls of
gram negative bacteria, further stimulate the production of proinflammatory cytokines such
as TNF-α , IL-1β , IL-6, which amplify and accelerate local tissue damage to form ulcers and
allows the ingress of endotoxins through the mucosal tissues and into the systemic
circulation and possibly causing sepsis (Sonis et al, 2004). Secondary infection is common in
this phase and patients with neutropenia are more likely to develop complications such as
bacteraemia, viral, fungal infections and sepsis (Al-Dasooqi et al, 2013).
In the healing phase, there is renewed cell production and angiogenesis. The commensal
bacteria are re-established and the leukopenia is resolved. Although the mucosa eventually
has a healthy appearance, the epithelium remains significantly altered increasing the risk for
future episodes of oral mucositis (Redding, 2005).
1.3.3 Clinical presentation of oral mucositis
Oral mucositis may begin within two weeks of commencing chemotherapy and it resolves
within three weeks of completing the cancer treatment. This may depend on the dose,
duration, course of treatment and the patient’s personal experience. The initial presentation
begins with generalized burning or sensitivity of the delicate oral mucosa or in some cases
with leukoedema (Köstler et al, 2001 and Redding, 2005). Areas of erythema and atrophy of
the mucosa lead to the emergence of ulcers that may be covered by a pseudomembrane.
These ulcers present with a tendency to bleed as many of these patients have
thrombocytopaenia (Naidu et al, 2004).
With the emergence of ulcers in the oral cavity and oropharyngeal region, mild or intense
pain may be experienced, which result in poor nutrition and hydration and this affects their
oral care. Decreased salivary flow as a complication of cancer treatment allows poor
lubrication with the accumulation of debris in the mouth and signs of a hairy tongue may be
observed.

10
The World Health Organization Oral Toxicity Scale (WHO, 1979) is routinely used to
evaluate oral mucositis clinically. Grade 0 has no signs or symptoms of oral mucositis. Grade
I oral mucositis presents with painless ulcers, erythema and oedema but patients are able to
eat. Grade II is categorized by its painful erythema and ulcers and the presence of oedema but
they are able to eat. With progression, the ulcers become more painful, erythematous and
oedematous and the patient is unable to eat in Grade III. If the previous symptoms persist, but
without the ability to eat or drink, Grade IV oral mucositis is present, where patients may
require parenteral or enteral support (Sonis et al, 2004 and Naidu et al, 2004).
Adapted from [http://www.prothelial.com/oral_mucositis/index.html]
Figure 1.1 Various grades of oral mucositis
1.3.4 Management of oral mucositis
The first approach taken in the management of oral mucositis has been to practice better oral
care, to ultimately reduce the frequency and extremity of this pathology. Studies have shown
that enforcing strict oral care protocols and managing pre-existing periodontal and dental
disease, showed better control of this oral injury (Eilers and Million, 2011 and Lalla et al,
2008). By delivering a known volume of radiation to a precisely demarcated irregular-shaped
diseased region, alleviates high doses of radiation to surrounding healthy tissue, as used when
defining the Planned Target Volume of the radiation beam (Kouloulias et al, 2013 and De
Sanctisa et al, 2016).
Treatment modalities such as cryotherapy, the use of Amifostine and glutamine, have been
suggested, but these have proven ineffective (De Sanctisa et al, 2016). Controversy also
exists with the use of topical antibacterial mouthwashes such as 0.12% chlorhexidine
digluconate to reduce oral mucositis and candidosis (Lopez et al, 2011 and De Sanctisa et al,
2016).

11
Several combinations of topical antimicrobials have been incorporated to develop a solution
to prevent and treat oral mucositis, but results have been controversial. By integrating
polymyxin, tobramycin, and amphotericin B (PTA) in the form of an antimicrobial lozenge,
this eliminated selective oral flora, but it did not accomplish the role of reducing the severity
of oral mucositis (Saunders et al, 2013 and Stokman et al, 2003). Similarly, many other
antibiotics and treatment modalities have been suggested (Donnelly et al., 2003; Laheij et al,
2012 and Spijkervet et al, 1990). Studies have shown that systemic antibiotics, antivirals or
antifungals are recommended for preventative use, but only in the presence of neutropenia
(Saunders et al, 2013). Therapeutic treatment may be required if a prominent infection has
been diagnosed and the causative agent is identified (Saunders et al, 2013 and Bergmann et
al, 1995). As most antibiotic interventions have not been consistently successful, this may
suggest that the microbial flora might not be the primary culprit in initiating oral mucositis
(Napeñas et al, 2010 and Al-Dasooqi et al, 2013).
1.4 Microbiology of the oral cavity during cancer treatment
Chemoradiation may induce an alteration of the oral environment resulting in a loss of
balance between oral commensal bacterial flora and the emergence of opportunistic bacteria.
The systemic and oral mucosal immunity is compromised by the residing tumour,
antineoplastic treatment and by the recommended adjunctive treatment, thus leading to an
imbalance and changes to the oral environment (De Sanctisa et al, 2016, Napeñas et al, 2010)
and Donnelly et al, 2003).
In addition to the cytotoxic effects of cancer treatment, factors such as neutropenia,
xerostomia and the use of multiple drugs including antibiotics can affect this harmony.
Patient-related factors such as the compromised oral hygiene, pre-existing periodontal disease
and the presence of nosocomial pathogens can disrupt this delicate balance (Meurman et al.,
1997).
When the bacterial flora is investigated in the presence of oral infection, the total number of
commensal oral Streptococci is reduced with the colonization of opportunistic pathogens
(Napeñas et al, 2010). This can be also observed in immunocompromised cancer patients
with radiation-induced xerostomia, as higher counts of Streptococcus mutans, Lactobacillus

12
spp., Candida (mainly C. albicans) and Staphylococcus spp. have been found, whereas the
number of S. sanguis, Neisseria spp. and Fusobacterium spp. has been shown to decline (De
Ryck et al, 2015 and Brown et al, 1975). These changes allow for a higher prevalence of
radiation-induced caries in these patients due to the poor saliva present, the altered pH and
buffering capacity in saliva (Brown et al, 1975 and Almståhl et al 2001). The oropharyngeal
mucosae is covered by a glycoprotein fibronectin that possesses attachment sites for gram
positive microorganisms including S. pneumoniae, S. aureus and Actinomyces spp., whereas
receptor sites for aerobic gram negative bacteria are thought to emerge after denudement of
oral mucosae from fibronectin by the underlying disease (Yoneda et al, 2007).
In a study done by Panghal et al, (2012), a predominance of gram positive bacteria (S. aureus
and S. epidermidis) was found in the oropharynx and in the bloodstream of patients with
varying grades of oral mucositis undergoing intensive chemotherapy and radiation. During
the ulcerative phase of oral mucositis, bacterial translocation through the bloodstream may
induce fever, infection and possible sepsis (Al-Dasooqi et al, 2013). These organisms could
also enter into the bloodstream with the use of a central venous line (Panghal et al, 2012).
Alteration in the microbiome has also been noted where proper sanitation is compromised in
overcrowded hospitals or where oral and personal hygiene has been neglected (Panghal et al,
2012). When oral pain is heightened to a degree that no alimentation is possible as seen in
Grade IV oral mucositis, cancer patients have to be tube-fed and hence the emergence of
other opportunistic gram positive pathogens such as Corynebacterium striatum and
Streptococcus agalacticae (Renom et al, 2014).
Moreover, immunocompromised patients undergoing antineoplastic chemotherapy, radiation
and HSCT frequently develop infections arising from candida and have been associated with
factors such as the immunosuppression of the host, the alteration of the oral microbiome and
xerostomia (Naidu et al, 2004). The colonization of Candida spp. as seen in candidiasis and
invasive candidemias, has been frequently seen in patients with neutropenia (Laheij et al,
2012). As candidiasis can present clinically in its pseudomembranous and erythematous
forms, patients with the erythematous forms complain of pain with or without a burning
sensation and this can be confused with symptoms of oral mucositis (Jham and Freire, 2006).
Although Candida albicans has been the most prevalent Candida species, non-albicans
Candida species such as C. glabrata, C. krusei and C. dubliniensis have been identified in
13
radiation patients and patients undergoing HSCT (Laheij et al, 2012), and studies has shown
variations of certain species according to geographical locations (Jham and Freire, 2006,
Ramla et al, 2016).
Theories of an association between periodontitis and the severity of oral mucositis have been
considered by Laheij et al, (2012) as they both have similar features of local and systemic
inflammation and periodontal gram negative anaerobic bacteria have also been found in
patients with oral mucositis. Evidence of this theory was disproved in a pilot study by Khaw
et al, (2014) where even though a greater portion of patients with oral mucositis had
periodontitis, this risk factor did not demonstrate any significance. Reports have shown that
colonisation of bacteria in the ulcerative phase can enhance the severity of oral mucositis but
evidence of antimicrobials failing to treat oral mucositis may prove that the microbial flora
may not be the primary causative factor for this condition (Barasch et al, 2006 and Al-
Dasooqi et al, 2013).
1.4.1 Cancer treatment and aerobic gram negative bacteria
The presence of aerobic gram negative bacteria in the oral cavity is less frequently found in
healthy individuals. The cells lining the oral cavity to the gastrointestinal tract are influenced
by similar microbiological and immunological characteristics. This is illustrated by the
presence of indigenous Escherichia coli in the gastrointestinal tract and the absence of
aerobic gram negative bacteria in the oropharynx of healthy individuals. Individuals, who are
carriers of Pseudomonas aeruginosa orally, are generally faecal carriers of the same strain
(Leenstra et al, 1996).
1.4.2 Factors associated with aerobic gram negative bacterial colonization and oral
mucositis
This colonization of gram negative organisms and the release of endotoxins in the ulcerative
phase of oral mucositis occur on damaged mucosal tissue, which may be further complicated
by concomitant neutropenia (Naidu et al, 2004). Inflammatory mediators are released which
influence the progression of oral mucositis (Köstler et al 2001).

14
Studies have demonstrated an overall increase in the prevalence of aerobic gram negative
bacilli such as Escherichia coli, Pseudomonas aeruginosa, Klebsiella and Enterobacter spp.
in cancer patients (Soares et al, 2011, Gaetti-Jardim et al, 2011 and Panghal et al, 2012).
Panghal et al, (2012) describes that in developing countries like Lebanon, Malaysia and
India, gram negative bacteria were the most predominant pathogen observed in febrile
neutropenic patients. In a study done by Anirudhan et al, (2008) similar bacterial pathogens
were found, but their blood culture showed bacterial sepsis due to the presence of
Escherichia coli, Klebsiella and Enterococcus spp. In a systemic review by Napeñas et al,
(2007) although paediatric cancer patients undergoing chemotherapy were more susceptible
to gram positive oral bacteria such as Streptococci and Staphylococci, adult oncology patients
were associated with changes involving gram negative bacteria such as Enterobacteriaceae
and Pseudomonas spp.
Similarly, bacterial translocation of aerobic gram negative bacteria, as described by Leenstra
et al, (1996) can take place at the oropharynx and gastrointestinal tract regardless of presence
of indigenous gram negative flora. Factors such as bacterial overgrowth, immunosuppression,
and physical disruption of the gastrointestinal tract by cancer treatment, trauma and
endotoxins are contributing factors of bacterial translocation (Jubelirer, 2011).
1.4.2 Treatment associated with gram negative bacteria and oral mucositis
Several suggestions have been made to prevent and treat oral mucositis by the reduction of
the total bacterial count. The effect of PTA lozenges (Saunders et al, 2013 and Stokman et al,
2003) and chlorhexidine gluconate may have eliminated selective oral flora but they were not
efficacious in reducing the acute symptoms of oral mucositis (Wijers et al, 2001). In a study
by Sano et al, (2015), various combinations of antibiotics such as ceftazidime plus
piperacillin/tazobactum and ampicillin plus aztreonam, were some of the antibiotics that
could be used. In a study by Baskaran et al, (2007) these antibiotics were also combined with
an aminoglycoside and /or vancomycin for better results. The fact that most antibiotic
interventions have failed, may suggest that other factors may be involved in the progression
of oral mucositis (Napeñas et al, 2010 and Al-Dasooqi et al, 2013).

15
1.5 Endotoxins
Gram negative aerobic and anaerobic bacteria possess endotoxins which are composed of
lipopolysaccharides (LPS) found in the bacterial cell membrane (Leenstra et al, 1996). As
these endotoxins are released, it may intensify the inflammatory process and promote or
exacerbate ulcer formations in oral mucositis (Napeñas et al, 2007). Pathogens such as
Escherichia coli, Pseudomonas and Vibrio cholerae have been associated with endotoxins.
Routinely, in conjunction with the intestinal barrier, Kupffer cells in the liver can remove
endotoxins by a process of detoxification and phagocytosis, but high prevalence of these
endotoxins are seen in the systemic circulation if these cells cannot cope with the
overwhelming burden of the presence of endotoxin (O'Brien and Bruce, 2007).
In general, one endotoxin unit/ml (EU/ml) equals to 0.1ng/ml. It has been reported that the
normal endotoxin levels circulating in healthy individuals is between 0.3-10.4pg/ml (O'Brien
and Bruce, 2007). In endotoxemia, plasma endotoxin concentrations are greater than
2.5EU/ml or 0.25ng/ml (O'Brien and Bruce, 2007). There are recommendations for the
allowable endotoxin limit for biological products, drugs and devices. According to the Food
and Drug Administration (FDA 2012), water added to drugs that require dilution prior to
injecting, sterile water for parenteral use and sterile, non-pyrogenic water for irrigation of
body wounds or medical devices have an allowable endotoxin limit of 0.25 EU/ml. The
maximum allowable endotoxin exposure for humans is calculated as 5 EU/Kg/Hour (or 350
EU per adult for 70Kg person per hour) to avoid fever and hypotension from endotoxin
contamination (FDA, 2012). For drugs gaining access to the cerebrospinal fluid (intrathecals),
an endotoxin limit of 0.2 EU/Kg/Hour has been determined and 2.5 EU/Kg/Hour for
radiopharmaceuticals (FDA, 2012).
Endotoxin testing is crucial in establishing endotoxin limits for pharmaceutical and medical
devices, in establishing procedures for validating the use of the bacterial endotoxin testing in
the laboratory and establishing procedures for conducting routine testing. The Limulus
Amebocyte Lysate (LAL) Test is utilized to test many drug and device products (FDA,
2012). The most frequently used test is the LAL Chromogenic endpoint test which is a
sensitive and specific test based on the chromogenic detection and measurement of
endotoxin.

16
The lipopolysaccharide complex consists of three regions. The first region consists of O-
specific chains (O- antigens), which is known as the antibiotic-combining site affecting the
immunogenicity of the pathogen cell wall. Diverse antigenic variations of the O side chains
can occur between species and strains of pathogens as seen in Salmonella and E. coli and
other strains of gram negative species. Absence of this region or parts of this region in E. coli
and Salmonella allows for partial loss in virulence, making them susceptible to phagocytosis,
serum bactericidal reactions, antibiotics and hydrophobic compounds as the permeability of
the outer membrane is affected (Todar, 2002).
The second component consists of the Core (R) antigen, which supports the LPS structure. It
consists of various sugars including heptose which binds to 2-keto-3-deoxyoctonoic acid
(KDO) (Koga et al, 1985). KDO is one of the sugars present in the Lipid A portion of LPS
which is used as a positive index in investigating the presence of LPS. LPS from the
Bacteroides species (anaerobic gram negative bacteria) lack composition of KDO and
heptose (Leenstra et al, 1996). This region is less variable but they may not have identical
cores (Todar, 2002).
The Lipid A structure forms part of the third component of the LPS and affects the toxicity
among Enterobacteriaceae. It is the least variable region (Peterson, 1996). They are
associated with the toxicity of gram negative bacteria and when released in the circulation
(Beveridge, 1999; Fry, 2013), are responsible for causing fever, diarrhoea, leukopenia,
disseminated intravascular coagulation, hypotension and possible fatal endotoxic shock (Dey
and Dey, 1978). Both Lipid A and the polysaccharide side chains determine the virulence of
gram negative bacteria. They are liberated in large quantities only after the death,
disintegration or autolysis of the organism (Dey and Dey, 1978). The endotoxicity of LPS for
anaerobic gram negative bacteria such as Bacteroides species is much lower (1000 times less)
than that of endotoxin from AGNB such as E.coli. This explanation can be justified by the
course and outcome of septicaemia caused by Bacteroides species being more favourable
than those with septicaemia caused E. coli (Leenstra et al, 1996).

17
LPS binds to lipid binding protein, which is associated with Toll-like receptor-4 (TLR4) for
the recognition of the endotoxin in the host (Lundin and Checkoway, 2009). Endotoxic shock
is the outcome as a result of the secretion of pro-inflammatory cytokines and nitric oxide by
macrophages and endothelial cells. Several cytokines (IL-1, IL-6, IL-8 and TNF-α) and
platelet- activating factor stimulate the production of prostaglandins and leukotriene, which
are responsible for inflammation and septic shock. T-lymphocytes affect cell-mediated and
humoral immunity and the complement cascade promotes histamine release leading to
vasodilation. These patients are susceptible to blood clotting, thrombus formation and acute
disseminated intravascular coagulation with the depletion of platelets and various clotting
factors. Hypotension arises with the release of bradykinins and other vasoactive peptides.
These sequences of events lead to inflammation, intravascular coagulation, haemorrhage and
shock which is characteristic of endotoxemia (Lundin and Checkoway, 2009).
The virulence and the rate of release of endotoxins are affected by variance in its biological
activity, its potency between the different species and its pathogenic property among similar
species. This may also be affected by host factors such as leukopenia (Hurley, 1995). On the
contrary, if after the initial exposure to endotoxins, the body tolerates subsequent exposure of
continuous small doses of LPS without adverse symptoms, this phenomenon is known as
endotoxin tolerance (Lundin and Checkoway, 2009).
The control of endotoxin absorption is crucial at the oropharynx and gastrointestinal tract.
Neutralization of endotoxin occurs with the macrophages and lymphoid tissue in these
tissues. Endotoxins that enter into the systemic circulation are neutralized by platelets,
proteins and leucocytes in blood. Intraorally, the action of swallowing, reflex movements,
tongue movement, salivary flow and salivary mucins affect the clearance of aerobic gram
negative bacteria and endotoxin. Gastric motility and bile are important for the removal of
endotoxins in the gastrointestinal tract (Leenstra et al, 1996). Bacterial translocation of
aerobic gram negative bacteria can occur regardless of the presence of indigenous gram
negative flora which elevates the LPS concentration systemically and attributes towards the
high endotoxicity (Leenstra et al, 1996).

18
1.5.1 Endotoxins and oral mucositis
Although the involvement of endotoxins in the development of bacterial infections is well
described, the role of endotoxins in oral mucositis is not known. Cancer patients develop oral
mucositis due to the cytotoxicity of chemotherapy and the changes in the oral flora with the
alteration in the oral environment. The abnormal presence of aerobic gram negative bacteria
which produce endotoxins, has also been reported, which interact with the host's cells to
induce the production and secretion of proteases and pro-inflammatory cytokines (Gaetti-
Jardim et al, 2011 and Ramachandran, 2014). Nevertheless, the role of these endotoxins in
the exacerbation of oral mucositis has not studied.
1.6 Aim
The aim of this study was to isolate and identify all aerobic gram negative bacteria and
endotoxins in the oral cavities of patients receiving cancer treatment; and to determine
whether the concentration levels of endotoxins affect the severity of oral mucositis within its
various grades.
1.6.1 Study Objectives
To isolate Streptococci, Staphylococcus aureus, Candida species and aerobic
gram negative bacteria (AGNB) from the oral cavities of patients on cancer
treatment and healthy individuals.
To identify all the aerobic gram negative bacteria and perform antimicrobial
susceptibility tests.
To detect endotoxin from the oral cavities of cancer patients with and without
oral mucositis.

19
CHAPTER 2
METHODS AND MATERIALS
2 Study population
A cross-sectional study was done on patients diagnosed with any type of malignant solid
tumor, who were scheduled for either radiation and chemotherapy or only chemotherapy that
were attending clinics at the Department of Radiation Oncology and the Department of
Oncology, at the Charlotte Maxeke Johannesburg Academic Hospital, were approached and
asked to volunteer for the study.
A sample size of one hundred cancer patients was determined, based on previous studies on
cancer patients undergoing treatment (Panghal et al, 2012 and Anirudhan et al, 2008), and
studies done on the presence of gram negative bacteria in healthy individuals who smoked or
wore dentures (Conti et al, 2009). In both studies a large sample size was required, as the
percentage of gram negative bacteria isolated were lower in proportion as compared to other
bacterial isolates.
2.1 Exclusion and inclusion criteria
These patients were chosen based on the criteria as per the data collection sheet (Appendix
B). The exclusion criteria included HIV positive patients, diabetic patients, smokers and
patients who wore oral prostheses. Patients who were presently on antimicrobials and patients
who had less than 2 weeks of cancer treatment were also not eligible to participate in the
study. At the time of sampling, the procedure was explained to the selected patients and
written consent was obtained (Appendix A and B). The demographic data and clinical
parameters such as the type of cancer, type treatment and duration of treatment were
recorded. The presence or absence and the grade of oral mucositis (WHO, 1979), was
observed by inspecting their oral cavity. Oral observation, periodontal and caries screening
procedures were used to detect halitosis, periodontitis, dry mouth and dental caries. Eligible
patients were asked to rinse their oral cavity with 10 ml of sterile distilled water and this was
collected back into a sputum jar. All samples collected were processed at the Oral
Microbiology Laboratory.

20
A sample size of fifty healthy individuals over the age 18 years old and of either gender from
the Oral Biological Sciences Department and Wits Oral Health Department, was used as a
control group and chosen as per the criteria from the data collection sheet (Appendix A and
B). The exclusion criteria included individuals who did have any systemic diseases (such as
diabetes), smokers, those who wore oral prostheses and individuals who were presently on
antimicrobials. Similarly, an oral rinse was collected from the control group. All samples
that were collected were processed at the Oral Microbiology Laboratory.
2.2 Ethics
Ethical clearance (Certificate number: M160562) for the study was obtained from The
Committee for Research on Human Subjects (Medical), University of the Witwatersrand,
Johannesburg (Appendix C).
2.3 Microbiological analysis
2.3.1 Microbiological plating procedure
Media preparation procedures are described in Appendix D.
The oral cavity rinse samples were vortexed and one hundred microlitres of this sample was
serially diluted in 0.9ml of phosphate buffered saline and mixed using a vortex mixer to
create dilutions of 1/10 to 1/1000. One hundred microlitres of the oral rinse and the
respective serially diluted saliva were plated using an air displacement micropipette with
disposable pipette tips on Mitis Salivarius Agar (MSA), Baird Parker Agar (BP), Candida
Chromagar and MacConkey Agar (Figure 2.1). In addition, 0.5 ml of oral rinse was added
into Brain Heart Infusion broth (BHI) and this was incubated at 37oC for 24 hours as an
enrichment step to allow low numbers of aerobic gram negative bacteria to be detected
(Stokman et al, 2003). The Mitis Salivarius Agar plates were incubated at 37oC for 48 hours
under CO2 to isolate Streptococci. The Baird Parker Agar plates (to isolate Staphylococci),
the Candida Chromagar plates (to isolate Candida) and the MacConkey Agar plates (to
isolate aerobic gram negative bacteria) were incubated at 37oC for 48 hours aerobically. After
the incubation period, the colonies were manually counted and expressed as colony forming

21
unit/ml (cfu/ml), similar to a study that was done by Ahmed et al (2013). One millilitre of
oral rinse from all cancer patients and healthy individuals were labelled and stored in
Eppendorff tubes at -20oC for the endotoxin assay.
Figure 2.1: Layout of agar plates for the microbiological analysis
2.3.2 Colony counts
Blue colonies were counted (cfu/ml) to obtain the total bacterial count of Streptococcus
mutans on the Mitis Salivarius Agar plate (Figure 2.2). Counts were multiplied with the
dilution factors and expressed as counts per ml of oral rinse.
Figure 2.2: Colonies of Streptococcus mutans on a Mitis Salivarius Agar plate
MSA MSA McConkey
McConkey
BP
Chrom
Oral
rinse BHI
Vortex
22
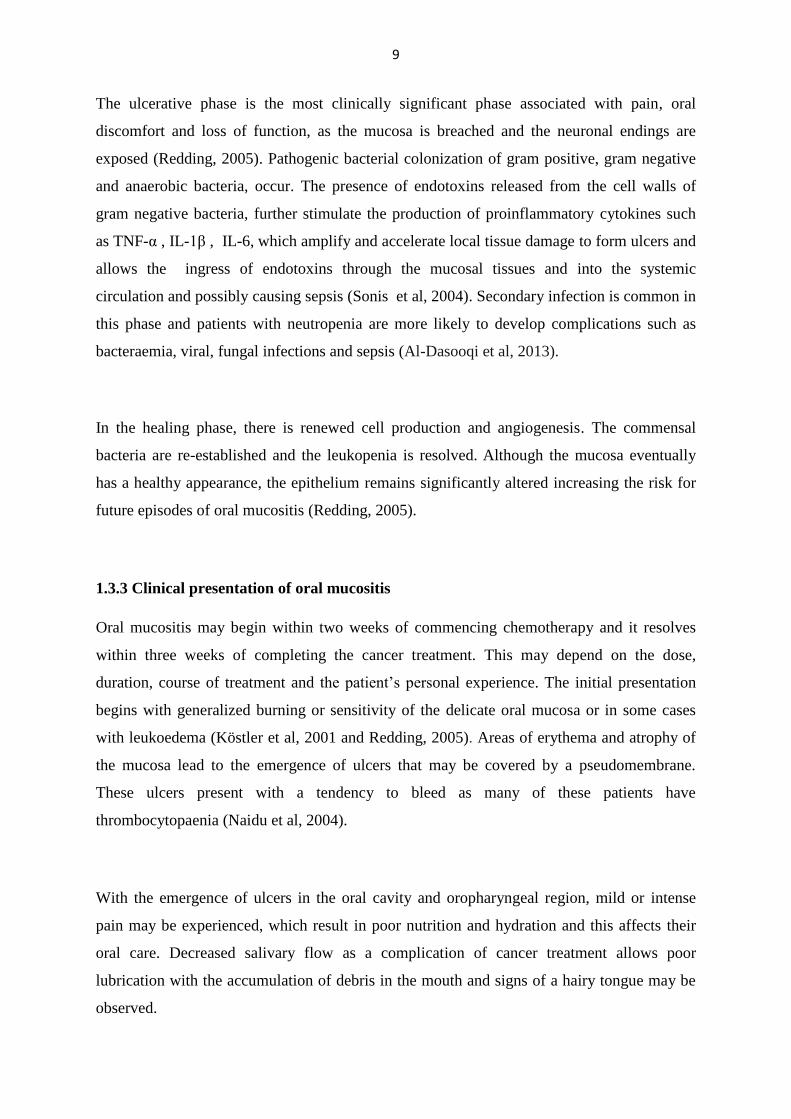
Black colonies with a halo around the colony were counted to obtain the total bacterial count
of Staphylococcus aureus (cfu/ml) from the Baird Parker Agar plate (Figure 2.3).
Figure 2.3: Colonies of Staphylococcus aureus on a Baird Parker Agar plate
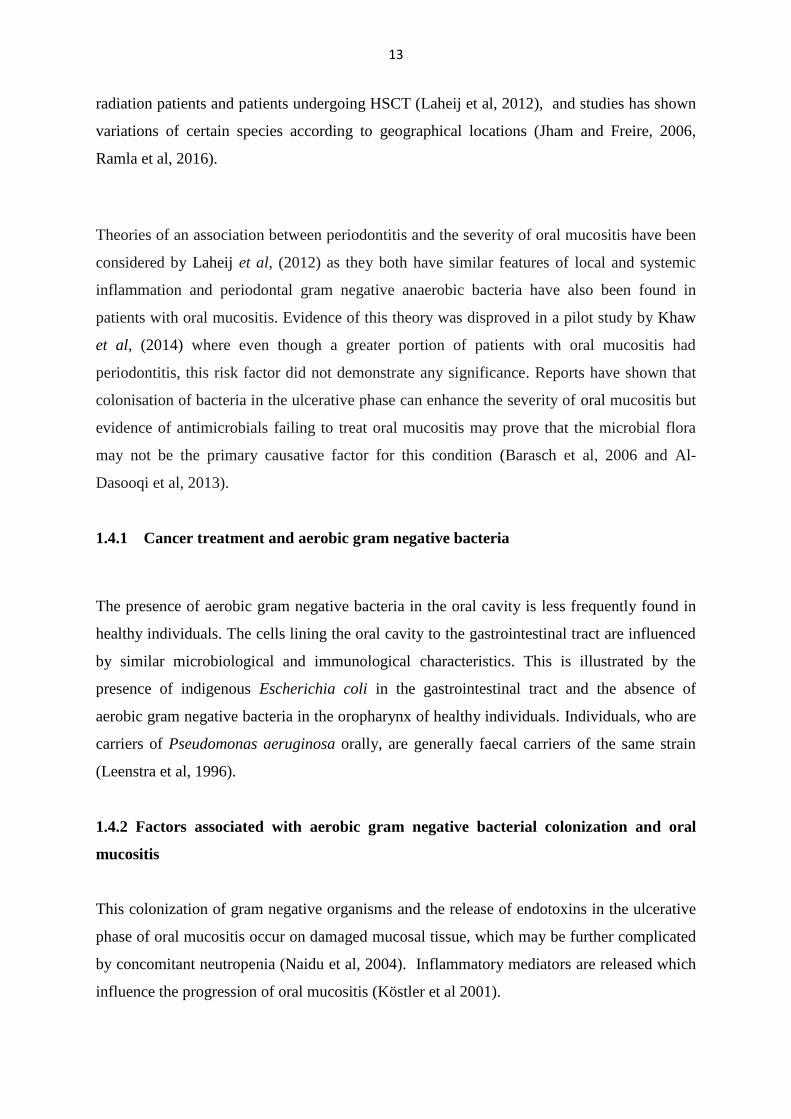
Green, purple and blue colonies of Candida species were counted (cfu/ml) on the Candida
Chromagar plates (Figure 2.4).
Figure 2.4: Mixed culture of Candida species on a Chromagar plate

23
The light and dark pink colonies of aerobic gram negative bacteria were counted (cfu/ml)
from the MacConkey Agar plates. After incubation, the BHI broth showed turbidity from the
growth of microorganisms. This was sub-cultured on MacConkey Agar plates and incubated
at 37oC for a further 48 hours by the streaking technique using a cooled sterilized loop. The
Gram staining technique was preliminary performed on certain isolated colonies, similar to a
technique described in a study by Ahmed et al, (2003) to identify the presence of gram
positive and gram negative cocci and bacilli.
Figure 2.5 Plate A and B: Colonies of aerobic gram negative bacteria on a MacConkey
Agar plate
2.3.3 The isolation and identification of Candida spp.
An isolated colony of Candida spp. from the Chromagar was randomly selected and plated
using the streaking technique. A cooled sterilized loop was used to streak a Sabouraud Agar
plate, which was used as an isolation plate and incubated for a further 48 hours at 37°C
(Figure 2.6). These cultures were then identified using the API® 20 C AUX (bioMérieux)
system. All the different colour colonies were isolated and identified separately.
Plate A Plate B

24
Figure 2.6: Isolated colonies of Candida spp. on Sabouraud agar
The API® 20 C AUX system was used for the precise identification of C. albicans and other
yeasts that were encountered which was similarly also used in a study by Ahmed et al,
(2013). The API® 20 C AUX strip consists of 20 cupules (Table 2.1), containing dehydrated
substrates which enable the performance of 19 assimilation tests. A suspension constituting
of a young culture of a portion of a well isolated yeast colony from the isolation Sabouraud
Agar plate and 2ml of the API C Medium, was mixed with turbidity equal to 2 McFarland
standard. This is done to standardize the turbidity of the yeast solution tested by obtaining a
solution with a specific optical density.
This was used to inoculate the cupules using a Pasteur pipette. The strips were tilted forward
and the Pasteur pipette was placed against the side of the cupule to prevent the formation of
air bubbles at the base of the tubes and care was taken not to overfill and underfill the
cupules. The yeasts only grew if they were capable of utilizing each substrate as their sole
carbon source. After 48 and 72 hours of incubation at 37°C, growth was read by comparing
its turbidity to growth controls (Figure 2.7). Identification was obtained by referring to the
Analytical Profile Index or using the identification software.

25
Table 2.1: Contents of the cupules of the API® 20 C tray
Tests Active Ingredients Quantity(mg/cup)
0 None -
GLU D-GLUcose 1.2
GLY GLYcerol 1.2
2KG Calcium 2-Keto-Gluconate 1.2
ARA L-ARAbinose 1.2
XYL D-XYLose 1.2
ADO ADOnitol 1.2
XLT XyLiTol 1.2
GAL D-GALactose 1.9
INO INOsitol 2.36
SOR D-SORbitol 1.2
MDG Methyl-αD-
Glucopyranoside
1.2
NAG N-Acetyl-Glucosamine 1.2
CEL D-CELlobiose 1.2
LAC D-LACtose (bovine origin) 1.2
MAL D-MALtose 1.2
SAC D-SACcharose (sucrose) 1.2
TRE D-TREhalose 1.2
MLZ D-MeLeZitose 1.2
RAF D-RAFfinose 1.9
Figure 2.7: API® 20 C AUX system for the identification of Candida species.

26
2.3.4 The isolation and identification of aerobic gram negative bacteria
On each MacConkey Agar plate where growth of aerobic gram negative bacteria had been
found from cancer patients and healthy subjects, isolated colonies of this bacteria were
randomly selected and plated using a cooled sterilized loop onto another MacConkey Agar
plate and incubated for 48 hours at 37°C (Figure 2.8).
Figure 2.8 Plate A and B: Isolation of aerobic gram negative bacteria on MacConkey
Agar plates
Plate A
Plate B

27
An oxidase test was performed to determine the presence of the bacterial cytochrome oxidase
enzyme by using the wet filter paper method, similarly, as performed in a study by Ahmed et
al, (2003). Using a sterile cool loop, a small portion of a pure colony was transferred onto a
filter paper saturated with oxidase reagent and rubbed onto the reagent. A positive reaction
was indicated by an intense deep-purple hue within 10- 30 seconds. A negative test resulted
in a light-pink or absence of colouration (Figure 2.9).
Figure 2.9: Oxidase Test for the aerobic gram negative bacteria
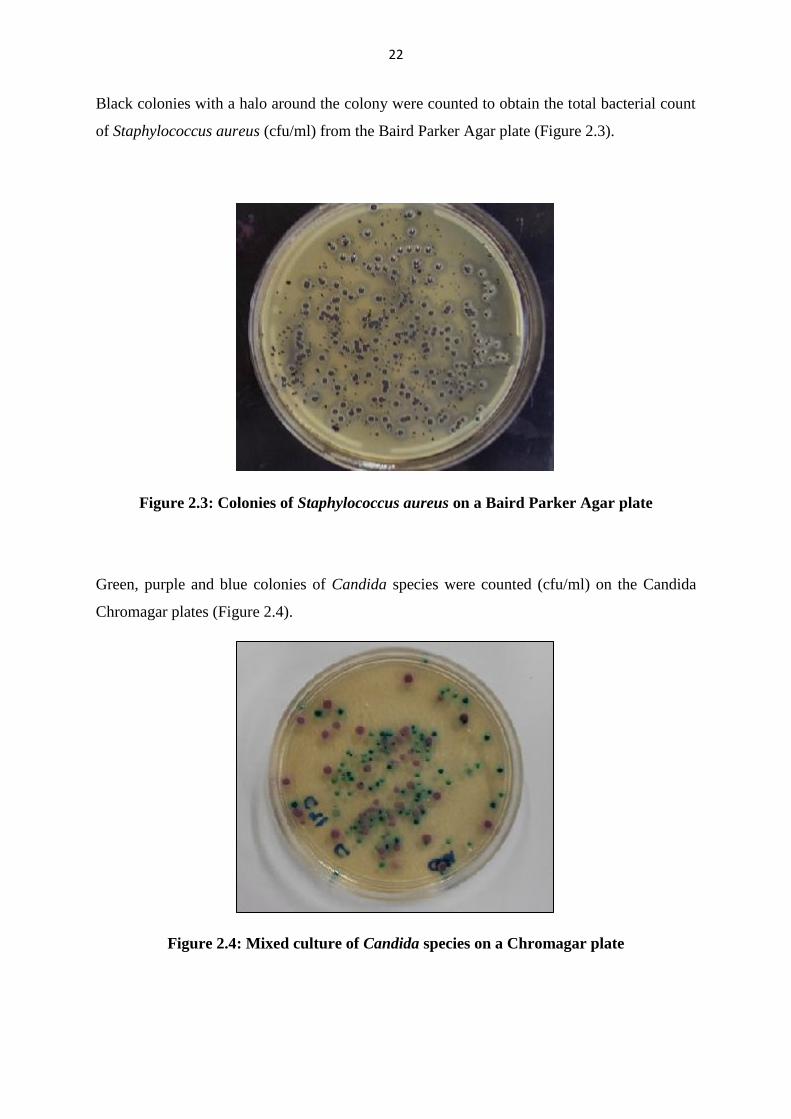
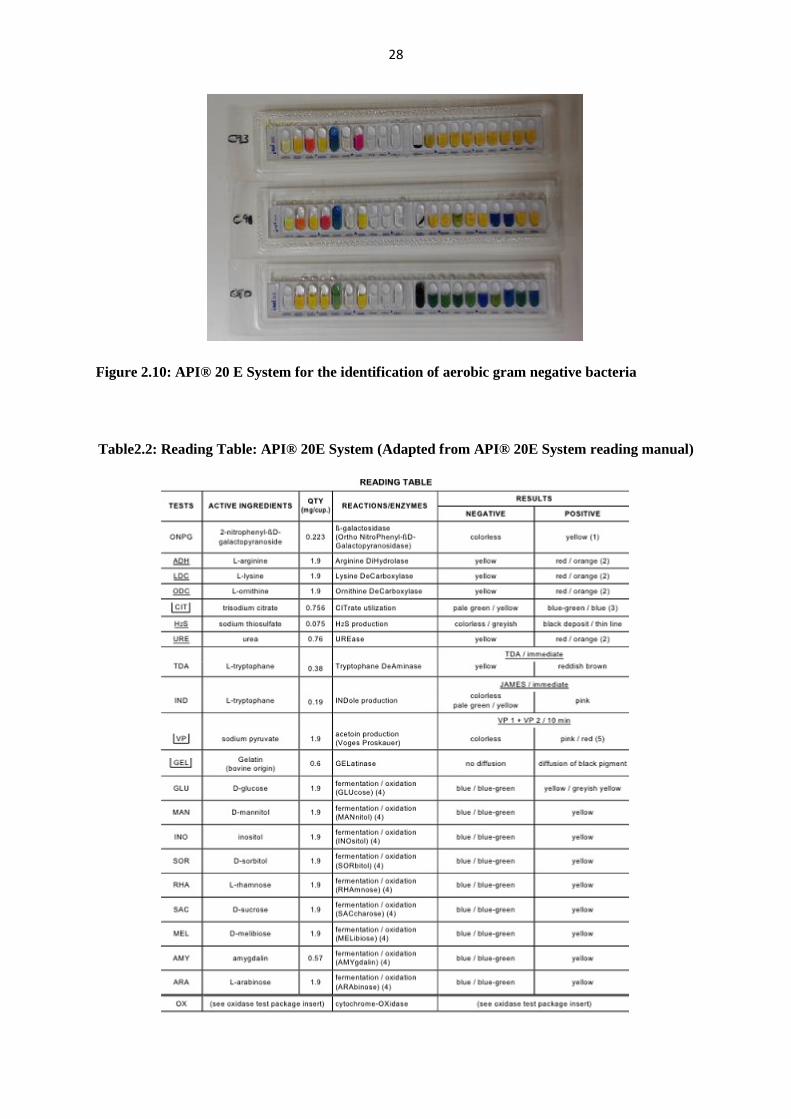
These cultures were identified using the API® 20 E (bioMérieux) system. This system was
similarly used in a study by Conti et al, (2009) to identify Enterobacteriaceae on the dorsum
of the tongue and a study by Leenstra et al, (1996) in the identification of gram negative
aerobic bacteria. It consists of 20 microtubes containing dehydrated chromogenic substrates.
A bacterial suspension consisting of a well isolated colony from the isolation MacConkey
Agar plate was added to 5ml of sterile distilled water without additives and emulsified. The
tests were inoculated with the bacterial suspension using a Pasteur pipette, tilting the strips
forward and placing the Pasteur pipette against the side of the cupule to prevent the formation
of air bubbles at the base of the tubes. They were incubated at 37oC for 24 hours. Colour
changes occurred either spontaneously during incubation from metabolism or after the
addition of reagents after the incubation period (Figure 2.10). These reactions were read
according to the Reading Table and the identification was obtained by referring to the
Analytical Profile Index or using the identification software.
28
Figure 2.10: API® 20 E System for the identification of aerobic gram negative bacteria
Table2.2: Reading Table: API® 20E System (Adapted from API® 20E System reading manual)
29
2.4 Antibiotic Sensitivity Test
The inoculum was prepared by making a saline suspension of young culture of isolated colonies
from the MacConkey Agar plate of cancer patients and healthy individuals with a positive
identification for aerobic gram negative bacteria. The suspension was adjusted to match the 0.5
McFarland turbidity standard, using a spectrophotometer at an absorbance of 625nm.
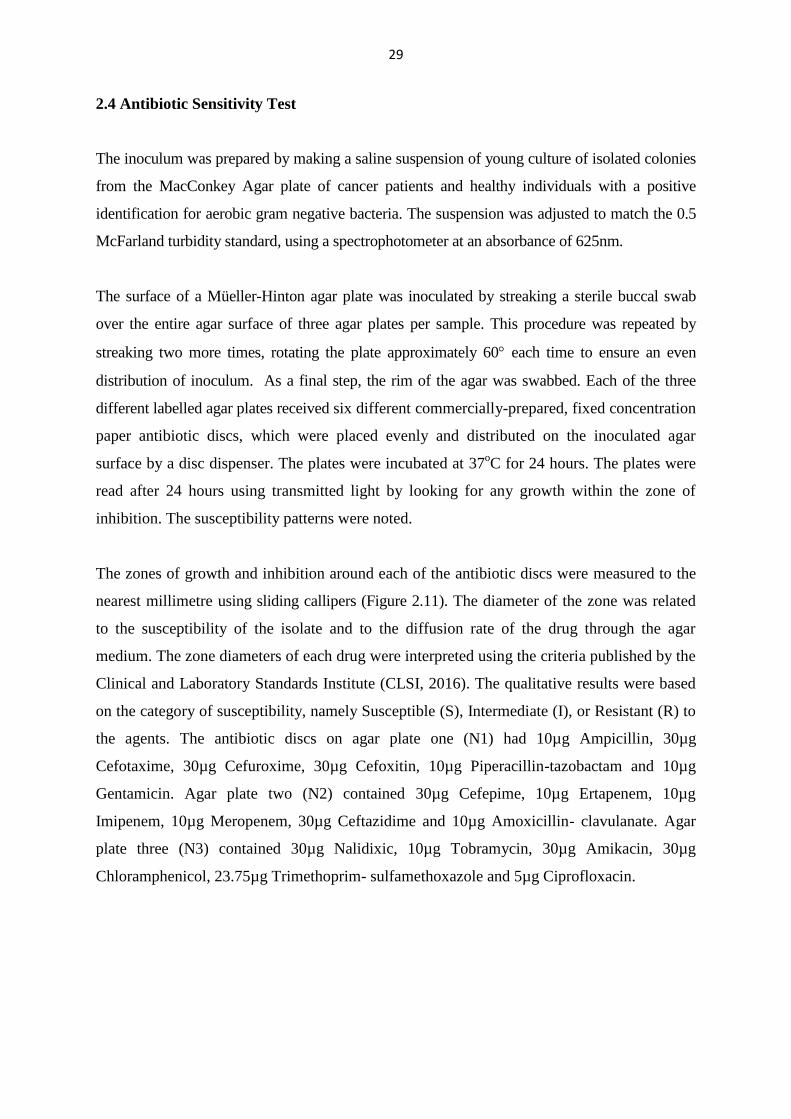
The surface of a Müeller-Hinton agar plate was inoculated by streaking a sterile buccal swab
over the entire agar surface of three agar plates per sample. This procedure was repeated by
streaking two more times, rotating the plate approximately 60 each time to ensure an even
distribution of inoculum. As a final step, the rim of the agar was swabbed. Each of the three
different labelled agar plates received six different commercially-prepared, fixed concentration
paper antibiotic discs, which were placed evenly and distributed on the inoculated agar
surface by a disc dispenser. The plates were incubated at 37oC for 24 hours. The plates were
read after 24 hours using transmitted light by looking for any growth within the zone of
inhibition. The susceptibility patterns were noted.
The zones of growth and inhibition around each of the antibiotic discs were measured to the
nearest millimetre using sliding callipers (Figure 2.11). The diameter of the zone was related
to the susceptibility of the isolate and to the diffusion rate of the drug through the agar
medium. The zone diameters of each drug were interpreted using the criteria published by the
Clinical and Laboratory Standards Institute (CLSI, 2016). The qualitative results were based
on the category of susceptibility, namely Susceptible (S), Intermediate (I), or Resistant (R) to
the agents. The antibiotic discs on agar plate one (N1) had 10µg Ampicillin, 30µg
Cefotaxime, 30µg Cefuroxime, 30µg Cefoxitin, 10µg Piperacillin-tazobactam and 10µg
Gentamicin. Agar plate two (N2) contained 30µg Cefepime, 10µg Ertapenem, 10µg
Imipenem, 10µg Meropenem, 30µg Ceftazidime and 10µg Amoxicillin- clavulanate. Agar
plate three (N3) contained 30µg Nalidixic, 10µg Tobramycin, 30µg Amikacin, 30µg
Chloramphenicol, 23.75µg Trimethoprim- sulfamethoxazole and 5µg Ciprofloxacin.
30
Figure 2.11: Antibiotic Susceptibility Test on Müeller-Hinton Agar plate
2.5 Endotoxin assay
The Hycult Biotech Limulus Amebocyte Lysate (LAL) assay was used to detect endotoxins
in the oral rinse samples collected from 60 cancer patients and 16 healthy individuals. The
oral rinse samples analysed from cancer patients were with or without aerobic gram negative
bacteria and with or without oral mucositis. The oral rinse samples analysed from healthy
individuals did not present with aerobic gram negative bacteria. This assay can measure the
bacterial endotoxin in gram negative bacteria from various biological fluid (including sera),
devices, (air) filters and tissue culture medium. It is a sensitive product that detects from as
little as 0.04 EU/ml of endotoxin and ranges to 10 EU/ml. It is a specific and accurate product
which uses the endotoxin standard from the kit to accurately quantify bacterial endotoxin.
N1
N3
N2

31
The basis of this test was that these bacteria caused intravascular coagulation in the American
horseshoe crab, Limulus Polyphemus by endotoxin, triggering the turbidity and gel-forming
reaction enzymatically. The enzymatic reaction of this test will cause a yellow colour to
develop upon cleavage of chromophore, p-nitroaniline (pNA), which is stopped by the
addition of acetic acid as a stop solution. The absorbance at 405 nm is measured with a
spectrophotometer. The endotoxin concentration of samples with unknown concentrations,
which are run concurrently with the standards, can be determined from a standard curve. It
uses an endotoxin standard of known concentration that is derived from the E. coli strain as
stated on the Certificate of Analysis to create a standard curve. The developed colour
intensity is proportional to the amount of endotoxin present in the sample and its
concentration is determined by extrapolating the absorbance of an unknown sample against
this standard curve.
The oral rinse that was stored at -20ºC in the Eppendorff tubes were warmed back to room
temperature. Samples were centrifuged at 5000 rpm for 5 minutes, similar to a method
described by Leenstra et al, (1996). The supernatants were collected (200μl) into another
Eppendorff tube. These were placed on a heating block at 75ºC for 5 minutes to neutralize
any endotoxin inhibiting compounds. From each sample of oral rinse, 25μl was diluted with
175μl of endotoxin free water (EFW) from the Hycult Biotech Limulus Amebocyte Lysate
(LAL) assay kit to give a dilution of 1:8.
All materials in contact with the oral rinse such as pipette tips, the test material and its
contents and reagents were endotoxin free. Depyrogenated test tubes were also utilized. All
reagents were equilibrated to room temperature at 25°C.
The LAL reagent was prepared by adding 4ml of EFW to the LAL reagent vial. This was
gently swirled until the LAL reagent dissolved into a colourless solution. The standard
solution was reconstituted by pipetting 1.8ml of EFW (as stated on the Certificate of
Analysis) to the concentrated endotoxin (E. coli) standard (Lot number 19819K0316-A), to
give a concentration of 50 EU/ml after reconstitution. This was vortexed for 5 minutes. The
Stop solution was prepared by adding 10ml of 2.5x concentrated stop solution to 15ml of
distilled water.

32
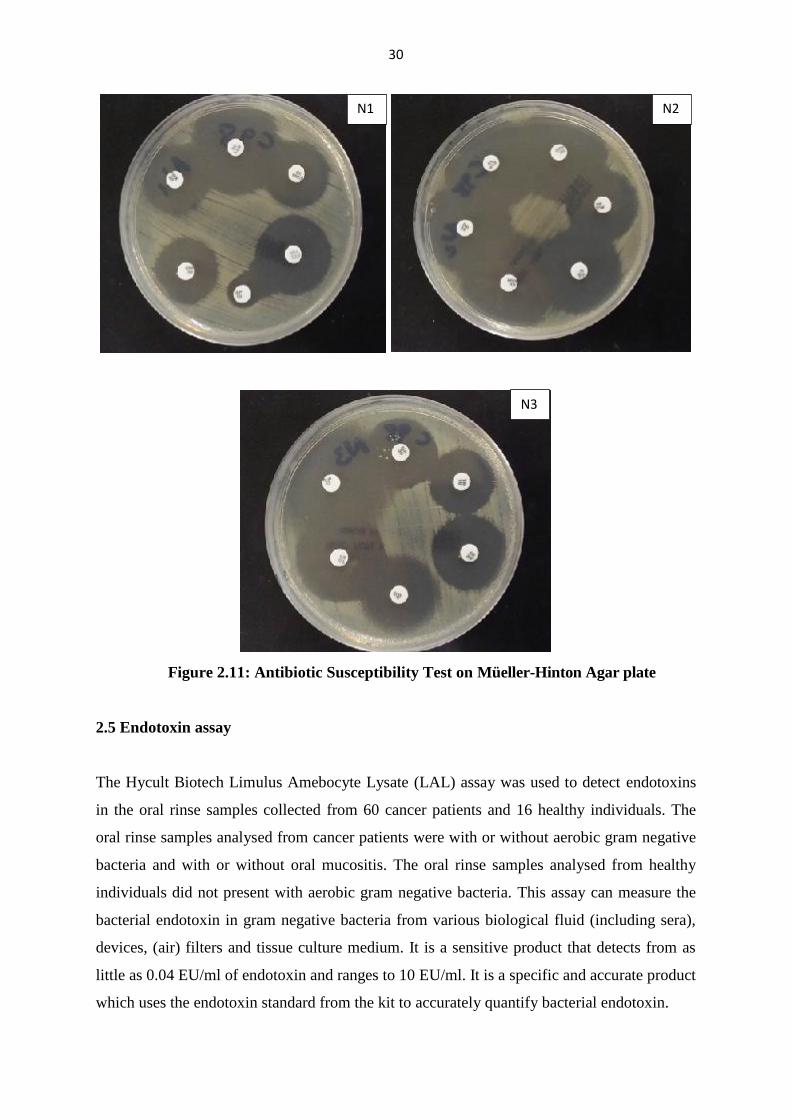
The number of test wells required to assay the standards, controls and samples in duplicate
was determined and labelled accordingly. For the standard series, 50μl of the reconstituted
standard was added to 50μl of EFW using a calibrated micropipette, and vortexed for 30
seconds, to dilute it further to obtain a concentration of 25 EU/ml (Figure 2.12). For the
duplicate standard curve, 16 wells of the plate were filled with 50μl of EFW. Thereafter, 33μl
of the diluted standard was added to well A1 and diluted 1:1.5 further and mixed thoroughly.
This was repeated by pipetting 33μl of this over to well B1 and again to the next well and so
on until well number G1. From well G1, 33μl was discarded and well H1 was used as a
control. This procedure was repeated for the standard dilution method for the A2-H2. This
gave a concentration range of endotoxin as follows: 10, 4, 1.6, 0.64, 0.26, 0.10, and 0.04
EU/ml.
From each of the diluted samples, 50μl was transferred in duplicate to the assigned sample
and control wells with a clean pipette for each transfer done. From the reconstituted LAL
reagent, 50μl was added to each well, except in the control wells, where 50μl of EFW was
added instead of LAL reagent. The plate was covered and incubated for 30 minutes at room
temperature. The enzymatic reaction, triggered by endotoxin, caused a yellow colour to
develop upon cleavage of the chromophore, p-nitroaniline. The samples were measured at
405nm using a calibrated ELISA plate reader (spectrophotometer). Similarly samples were
processed (Figure 2.13).
If the standard concentrations between 10 and 4 EU/ml differed more than 10% in OD value,
this was incubated for an additional 5 minutes. If it differed less than 10% in OD value, the
reaction was halted by adding 50μl of stop solution. The absorbance was measured at 405nm
with the spectrophotometer.

33
Figure 2.12: Preparation of the dilutions of standard series of E. coli endotoxin
Adapted from Limulus Amebocyte Chromogenic Endpoint Assay: Test for endotoxin
detection- Product information and manual. Manual HIT302 Edition 04-13
If individual absorbance values differed by more than 15% from the corresponding mean
value, the sample was retested. The mean absorbance of the zero standard should be less than
0.1 OD 405nm and the mean absorbance of the 10 EU/ml standard should be higher than 0.6
OD 405nm. A standard curve was obtained by plotting the absorbance (linear) versus the
corresponding concentrations of the E. coli standards (log). The endotoxin concentration of
the samples was read from the standard curve and this was multiplied by the dilution factor
(Appendix E).
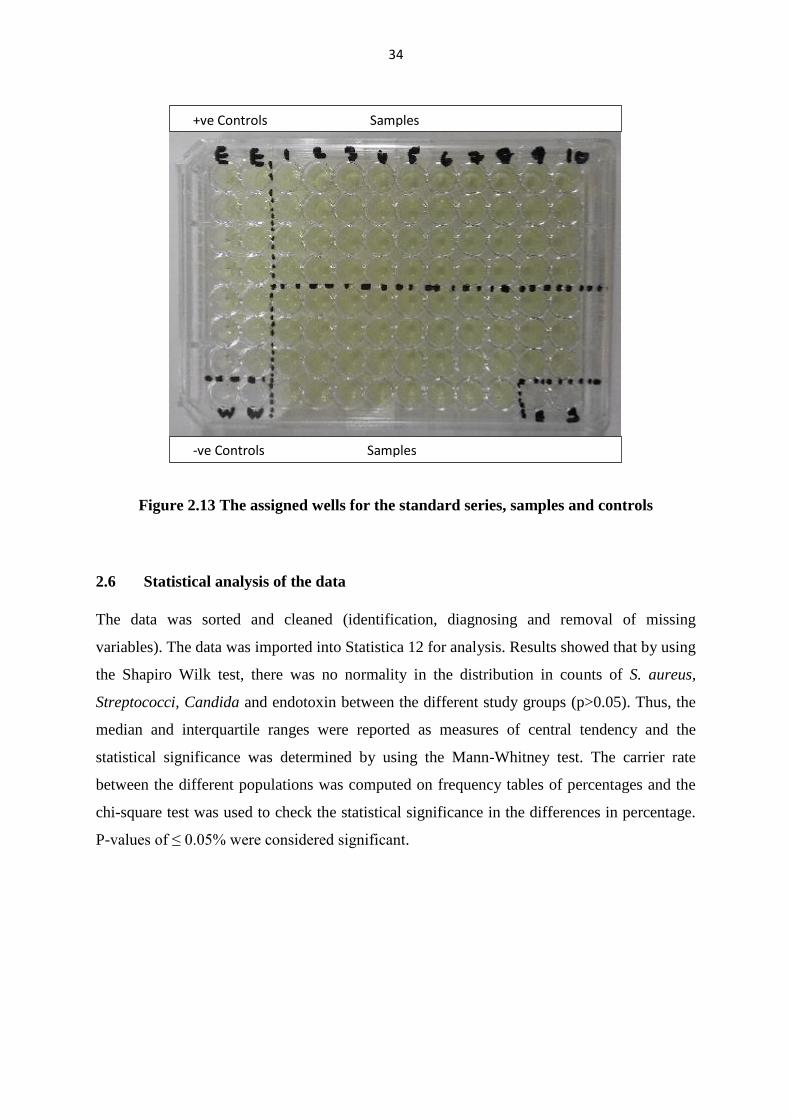
34
Figure 2.13 The assigned wells for the standard series, samples and controls
2.6 Statistical analysis of the data
The data was sorted and cleaned (identification, diagnosing and removal of missing
variables). The data was imported into Statistica 12 for analysis. Results showed that by using
the Shapiro Wilk test, there was no normality in the distribution in counts of S. aureus,
Streptococci, Candida and endotoxin between the different study groups (p>0.05). Thus, the
median and interquartile ranges were reported as measures of central tendency and the
statistical significance was determined by using the Mann-Whitney test. The carrier rate
between the different populations was computed on frequency tables of percentages and the
chi-square test was used to check the statistical significance in the differences in percentage.
P-values of ≤ 0.05% were considered significant.
+ve Controls Samples
-ve Controls Samples

35
CHAPTER 3
RESULTS
3.1 Demographic data and clinical parameters
Demographic data and clinical parameters of cancer patients on treatment are shown in Table
3.1. The mean age of cancer patients was 52 years and 80% of cancer patients were females.
These females mostly had either breast (58%) or cervical cancer (9%). Majority of these
patients were on chemotherapy (61%). Patients were well into their chemotherapy treatment
cycles and were on multiple chemotherapeutic drugs. The majority of them complained of
nausea (61%). Most of them had no major other illness except for hypertension (21%). Some
patients had oral mucositis (12%) which was classified as Grade I, Grade II, Grade III and
Grade IV. Patients complained of dry mouth, altered taste and loss of appetite.
Table 3.1: Demographic data and clinical parameters of cancer patients on treatment
Parameters (n=100) Results Age
Mean ±SD (Range)
51.87 ± 12.8 (25-92)
Gender Male: 20%, Female: 80%
Type of Cancer
Breast cancer: 58%, Cervical cancer: 9%, Prostate cancer:
6%, Colon cancer: 5%, Rectal cancer: 4%, Laryngeal cancer:
3%, Pancreatic cancer: 2%, Skin cancer: 2%,
Bone cancer, Brain cancer, Colon and Liver cancer, Gastric
cancer, Liver cancer, Lung cancer, Nasal cancer, Ovarian cancer,
Ovarian, Intestine, Liver, Vulva cancer, Palatal cancer, Spleen
cancer each 1%
Treatment
Chemoradiation: 39%, Chemotherapy: 61%
Length of treatment
completed
Chemoradiation: (n= 39)
a. Chemotherapy cycles Mean ±SD (Range): 5.41 ±3.4 (2-14)
b. Radiation sessions Mean ±SD (Range): 15.82 ±10.8 (1-35)
Chemotherapy: (n= 61) a. Chemotherapy cycles Mean ±SD (Range): 7.97 ±18.4 (2-144)
Chemotherapy
Medication
Adriamycin + Cyclophosphamide: 24%
Cisplatin: 10%
Taxol: 7%

36
Adriamycin + Cyclophosphamide + Taxol: 6%
5 Fluorouracil + Leucovorin + Calcium: 5%
5 Fluorouracil + Adriamycin + Cyclophosphamide: 5%
5 Fluorouracil: 2%
Adriamycin + Cyclophosphamide + Docetaxel: 2%
Adriamycin, Adriamycin + Cyclophosphamide + Doxorubicin,
Adriamycin + Cyclophosphamide + Tamoxifen, Cisplatin +
Decadron, Docetaxel, Docetaxel + Decadron + Prednisone,
Gemzar, Navelbine, Tamoxifen, Trial Chemo Drug, Xeloda +
Oxaliplatin: each 1%
Unknown: 28%
Nausea & Vomiting Yes: 61%, No: 39%
Diabetes No: 100%
HIV status No: 83%, Unknown: 17%
Other medical
conditions
(n=100)
None: 70%
High blood pressure: 21%
Asthma, Cholesterol, Depression, arthritis, Blood Clotting,
thyroid condition, Stomach Ulcers: 1% each
Smoker No: 100%
Dentures No: 100%
Antimicrobials No: 100%
Oral Mucositis
History of oral mucositis: 27%
Oral mucositis present: 12%
None present or no history: 61%
Grade of oral mucositis
Grade 0: 69%, Grade I: 16%, Grade II: 11%
Grade III: 3%, Grade IV: 1%
Loss of appetite Yes: 57%, No: 43%
Difficulty to swallow Yes: 33%, No: 67%
Altered taste Yes: 74%, No: 26%
Halitosis Yes: 22%, No: 78%
Swollen gums Yes: 24%, No: 76%
Periodontitis Yes: 42%, No: 58%
Dry mouth Yes: 88%, No: 12%
Dental caries Yes: 58%, No: 42%

37
3.2 Demographic data and clinical parameters of healthy individuals
Demographic data and clinical parameters of healthy individuals are shown in Table 3.2. The
mean age of this study group was 31 years and they were mainly females (76%). They were
relatively healthy with no illnesses (94%) and their oral health was also relatively good.
Table 3.2: Demographic data and clinical parameters of healthy individuals
Parameters (n=50) Results Age Mean ±SD (Range) 30.50 ± 11.6 (19-57) Gender Male: 24%, Female: 76% Diabetes No: 100%
Other systemic diseases
High blood pressure: 6%, Hypothyroidism: 2%
None: 94%
Smoker No= 100%
Dentures No= 100%
Antimicrobials No= 100%
Halitosis No= 100%
Swollen gums Yes: 16%, No: 80%
Periodontitis Yes: 2%, No: 98%
Dry Mouth Yes: 16%, No: 84%
Dental caries Yes: 34%, No: 66%
3.3 Microbiological analysis of oral rinse samples collected from the cancer patients
on treatment
The raw data of the microbiological analysis, endotoxin and the statistical analysis are
presented in Appendix E, F and G.
The results of the microbiological analysis of oral rinse samples collected from the cancer
patients on treatment are shown in Table 3.3. All the patients carried Streptococcus species in
their oral cavity and the mean counts were 2.1 x 10⁶ cfu/ml. Staphylococcus aureus and
Candida species was carried by 52% and 54% of patients respectively. The mean S. aureus
counts (1939 cfu/ml) were much higher than the Candida counts (693 cfu/ml). These cancer
patients carried multiple species of Candida. The major species carried was C. albicans,
followed by C. glabrata and C. famata. Six patients carried more than one species of
Candida. Twenty four percent of patients carried aerobic gram negative bacteria in their oral
cavity. Counts of these bacteria were not possible because some of them were identified after
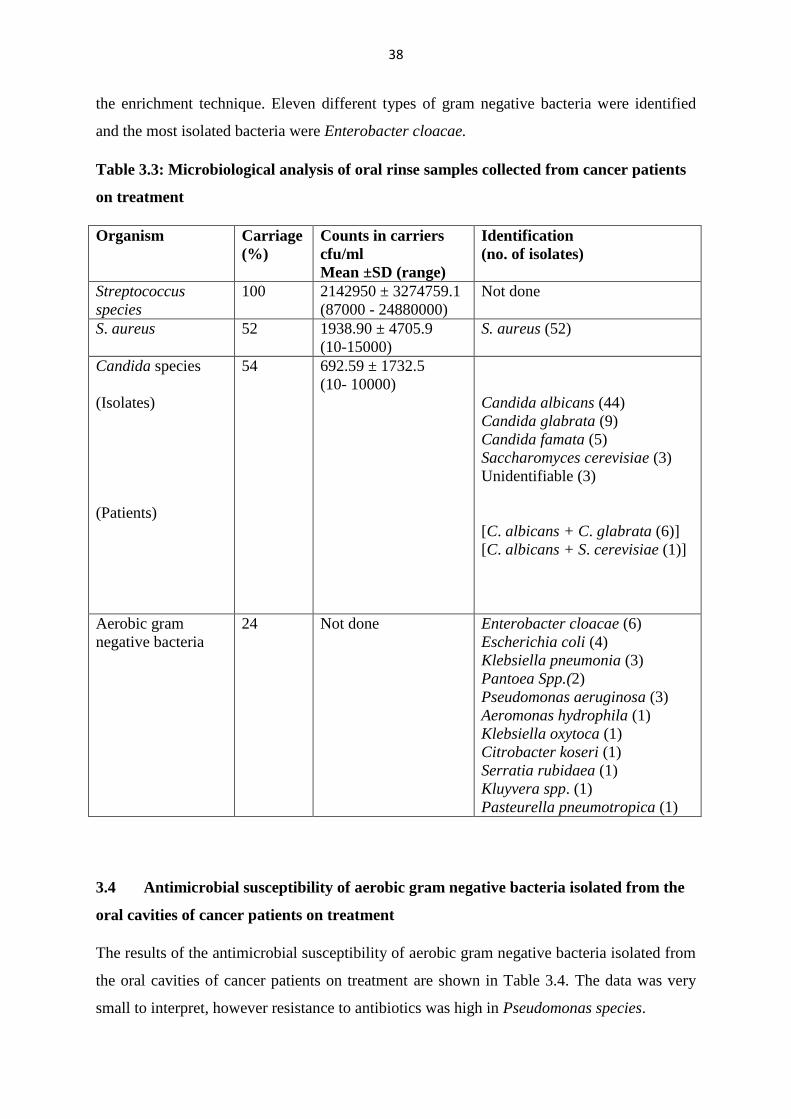
38
the enrichment technique. Eleven different types of gram negative bacteria were identified
and the most isolated bacteria were Enterobacter cloacae.
Table 3.3: Microbiological analysis of oral rinse samples collected from cancer patients
on treatment
Organism Carriage
(%)
Counts in carriers
cfu/ml
Mean ±SD (range)
Identification
(no. of isolates)
Streptococcus
species
100 2142950 ± 3274759.1
(87000 - 24880000)
Not done
S. aureus
52 1938.90 ± 4705.9
(10-15000)
S. aureus (52)
Candida species
(Isolates)
(Patients)
54 692.59 ± 1732.5
(10- 10000)
Candida albicans (44)
Candida glabrata (9)
Candida famata (5)
Saccharomyces cerevisiae (3)
Unidentifiable (3)
[C. albicans + C. glabrata (6)]
[C. albicans + S. cerevisiae (1)]
Aerobic gram
negative bacteria
24 Not done Enterobacter cloacae (6)
Escherichia coli (4)
Klebsiella pneumonia (3)
Pantoea Spp.(2)
Pseudomonas aeruginosa (3)
Aeromonas hydrophila (1)
Klebsiella oxytoca (1)
Citrobacter koseri (1)
Serratia rubidaea (1)
Kluyvera spp. (1)
Pasteurella pneumotropica (1)
3.4 Antimicrobial susceptibility of aerobic gram negative bacteria isolated from the
oral cavities of cancer patients on treatment
The results of the antimicrobial susceptibility of aerobic gram negative bacteria isolated from
the oral cavities of cancer patients on treatment are shown in Table 3.4. The data was very
small to interpret, however resistance to antibiotics was high in Pseudomonas species.

39
Table 3.4 Antimicrobial susceptibility of aerobic gram negative bacteria isolated from the oral cavities of cancer patients on treatment
Number of resistant strains (%)
Ab
N=18
Enterobacter
spp.
n= 6
Klebsiella
spp.
n= 4
Escherichia
spp.
n=4
Pseudomonas
Spp.
n= 3
Pantoea
spp.
n= 2
Kluyvera
spp.
n= 1
Serratia
spp.
n= 1
Pasteurella
spp.
n= 1
Aeromonas
spp.
n= 1
Citrobacter
spp.
n= 1
Total
n= 24
AP 1 (16.66) 3 (75) 3 (75) 2 (66.66) 0 1(100) 0 0 0 1 (100) 11 (45.83)
CTX 0 1 (25) 0 2 (66.66) 0 0 0 0 1 (100) 0 4 (16.66)
CXM 0 1 (25) 0 2 (66.66) 0 0 0 0 1 (100) 0 4 (16.66)
FOX 4 (66.66) 0 0 2 (66.66) 0 0 0 0 0 0 6 (25)
PTZ 1 (16.66) 0 1 (25) 0 0 0 0 0 0 0 2 (8.33)
GM 0 0 1 (25) 0 1 (50) 0 0 0 0 0 2 (8.33)
CPM 0 0 0 1 (33.33) 0 0 0 0 1 (100) 0 2 (8.33)
ETP 0 0 0 1 (33.33) 0 0 1 (100) 0 0 0 2 (8.33)
IMI 0 0 0 0 0 0 0 0 0 0 0
MEM 0 0 0 0 N/D 0 0 0 N/D 0 0
CAZ 1 (16.66) 0 0 1 (33.33) 2 (100) 0 0 0 1 (100) 0 5 (20.83)
AUG 2 (33.33) 1 (25) 1 (25) 2 (66.66) 0 0 0 0 0 0 6 (25)
NA 1 (16.66) 0 2 (50) 2 (66.66) 2 (100) 0 0 1 (100) 1 (100) 0 9 (37.5)
TN 0 1 (25) 1 (25) 0 1 (50) N/D 1 (100) 0 0 0 4 (16.66)
AK 0 0 0 0 0 0 0 0 0 0 0
C 0 1 (25) 0 1 (33.33) 0 0 0 0 1 (100) 0 3 (12.5)
TS 0 2 (50) 3 (75) 0 0 0 0 0 0 0 5(20.83)
CIP 0 1 (25) 1 (25) 0 0 0 0 0 0 0 2 (8.33)
Ab = Antibiotic, N/D = Not done, AP = Ampicillin, CTX = Cefotaxime, CXM = Cefuroxime, FOX = Cefoxitin, PTZ = Piperacillin-tazobactam, GM =
Gentamycin, CPM = Cefepime, ETP = Ertapenem, IMI = Imipenem, MEM = Meropenem, CAZ = Ceftazidime, AUG = Amoxicillin- clavulanate potassium,
NA = Nalidixic acid, TN= Tobramycin, AK = Amikacin, C= Chloramphenicol, TS = Trimethoprim- sulfamethoxazole, CIP = Ciprofloxacin
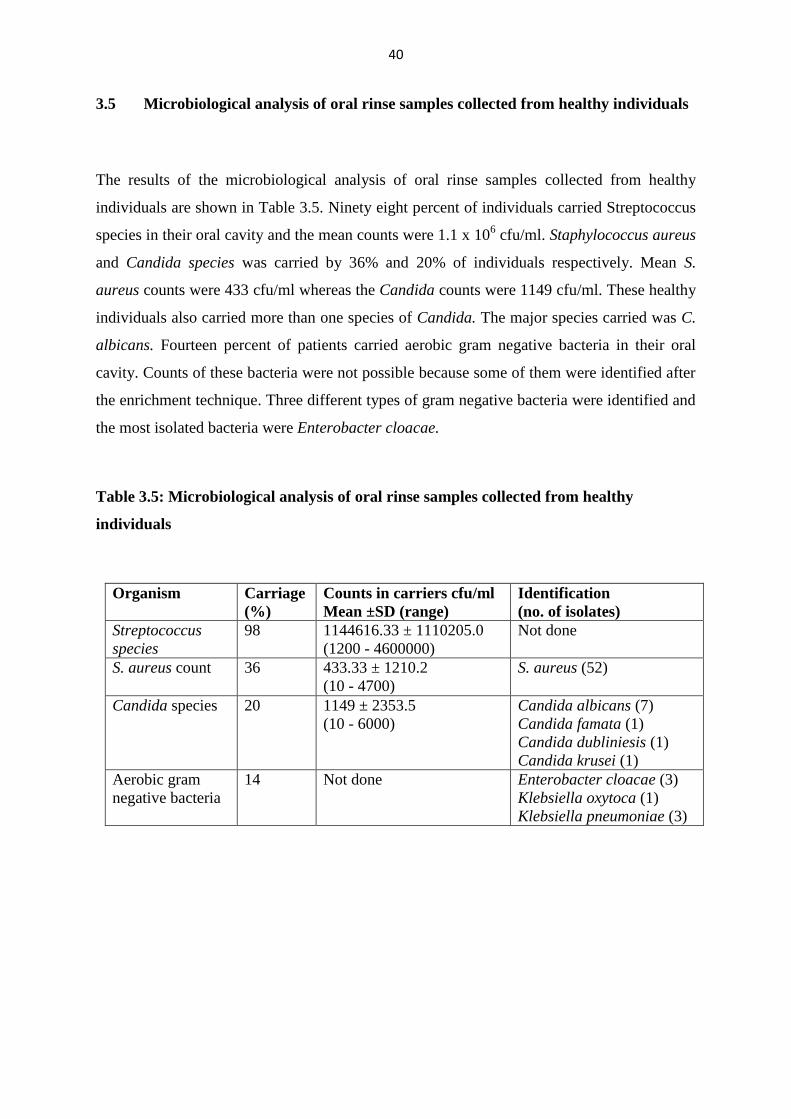
40
3.5 Microbiological analysis of oral rinse samples collected from healthy individuals
The results of the microbiological analysis of oral rinse samples collected from healthy
individuals are shown in Table 3.5. Ninety eight percent of individuals carried Streptococcus
species in their oral cavity and the mean counts were 1.1 x 10⁶ cfu/ml. Staphylococcus aureus
and Candida species was carried by 36% and 20% of individuals respectively. Mean S.
aureus counts were 433 cfu/ml whereas the Candida counts were 1149 cfu/ml. These healthy
individuals also carried more than one species of Candida. The major species carried was C.
albicans. Fourteen percent of patients carried aerobic gram negative bacteria in their oral
cavity. Counts of these bacteria were not possible because some of them were identified after
the enrichment technique. Three different types of gram negative bacteria were identified and
the most isolated bacteria were Enterobacter cloacae.
Table 3.5: Microbiological analysis of oral rinse samples collected from healthy
individuals
Organism Carriage
(%)
Counts in carriers cfu/ml
Mean ±SD (range)
Identification
(no. of isolates)
Streptococcus
species
98 1144616.33 ± 1110205.0
(1200 - 4600000)
Not done
S. aureus count 36 433.33 ± 1210.2
(10 - 4700)
S. aureus (52)
Candida species 20 1149 ± 2353.5
(10 - 6000)
Candida albicans (7)
Candida famata (1)
Candida dubliniesis (1)
Candida krusei (1)
Aerobic gram
negative bacteria
14 Not done Enterobacter cloacae (3)
Klebsiella oxytoca (1)
Klebsiella pneumoniae (3)

41
3.6 Antimicrobial susceptibility of aerobic gram negative bacteria isolated from the
oral cavities of healthy individuals
The results of the antimicrobial susceptibility of aerobic gram negative bacteria isolated from
the oral cavities of healthy individuals are shown in Table 3.6. Klebsiella species was found
to be resistant to many antibiotics.
Table 3.6: Antimicrobial susceptibility of aerobic gram negative bacteria isolated from
the oral cavities of healthy individuals
Number of resistant strains (%)
Ab Enterobacter
spp.
n= 2
Klebsiella
spp.
n= 4
Total
n= 6
AP 0 4 (100) 4 (66.66)
CTX 0 2 (50) 2 (33.33)
CXM 0 2 (50) 2 (33.33)
FOX 2 (100) 2 (50) 4 (66.66)
PTZ 0 0 0
GM 0 2 (50) 2 (33.33)
CPM 0 0 0
ETP 0 0 0
IMI 1 (50) 0 1 (16.66)
MEM 0 0 0
CAZ 0 2 (50) 2 (33.33)
AUG 1 (50) 0 1 (16.66)
NA 0 2 (50) 2 (33.33)
TN 0 2 (50) 2 (33.33)
AK 0 0 0
C 0 2 (50) 2 (33.33)
TS 0 1 (25) 1 (16.66)
CIP 0 0 0 Ab = Antibiotic, AP = Ampicillin, CTX = Cefotaxime, CXM = Cefuroxime, FOX = Cefoxitin, PTZ =
Piperacillin-tazobactam, GM = Gentamycin, CPM = Cefepime,
ETP = Ertapenem, IMI = Imipenem, MEM = Meropenem, CAZ = Ceftazidime, AUG = Amoxicillin-
clavulanate potassium, NA = Nalidixic acid, TN= Tobramycin,
AK = Amikacin, C= Chloramphenicol, TS = Trimethoprim- sulfamethoxazole, CIP = Ciprofloxacin

42
3.7 Summary results of cancer patients and healthy individuals
Summary results of cancer patients and healthy individuals are shown in Table 3.7 and Figure
3.1. Cancer patients carried significantly high numbers of Streptococci compared to the
healthy individuals. The carriage rate of S. aureus was not different between the two groups.
The results also showed that the Candida carrier rate was significantly high in cancer patients
compared to healthy individuals (p<0.01). Although the Candida counts were not different
between the groups (p>0.05), cancer patients carried a variety of Candida species and some
patients carried more than one Candida species in their oral cavity. In addition, C. glabrata
was only found in cancer patients. Between the two groups, no significant difference in the
carrier rate of aerobic gram negative bacteria was found (p>0.05). However, cancer patients
carried a variety of aerobic gram negative bacteria. Enterobacter cloacae and Klebsiella
pneumonia were isolated from the oral cavities of both the study groups.
Table 3.7: Summary results of cancer patients and healthy individuals
Organism Cancer patients Healthy individuals p- value
Streptococcus species
Carriage (%)
Counts (cfu/ml)
Mean ±SD (range)
100
2142950 ± 3274759.1
(87000 - 24880000)
98
1144616.33 ± 1110205
(1200 - 4600000)
Not done
P=0.020
S. aureus
Carriage (%)
Counts (cfu/ml)
Mean ±SD (range)
52
1938.90 ± 4705.9
(10-15000)
36
433.33 ± 1210.2
(10 - 4700)
P=0.064
P=0.310
Candida species
Carriage (%)
Counts (cfu/ml)
Mean ±SD (range)
Species
(Isolates)
54
692.59 ± 1732.5
(10- 10000)
C. albicans (44)
C. glabrata (9)
C. famata (5)
S. cerevisiae (3)
Unidentifiable (3)
20
1149 ± 2353.5
(10 - 6000)
C. albicans (7)
C. famata (1)
C. dubliniesis (1)
C. krusei (1)
P<0.01
P=0.567

43
(Patients) C. albicans+C. glabrata (6)
C. albicans+S.cerevisiae (1)
Aerobic gram
negative bacteria
Carriage (%)
Counts (cfu/ml)
Mean ±SD (range)
Species
24
Not done
E. cloacae (6)
E. coli (4)
K. pneumonia (3)
Pantoea Spp.(2)
Ps. aeruginosa (3)
A. hydrophila (1)
K. oxytoca (1)
C. koseri (1)
S. rubidaea (1)
Kluyvera spp. (1)
P. pneumotropica (1)
14
Not done
E. cloacae (3)
K. oxytoca (1)
K. pneumoniae (3)
P=0.154
Figure 3.1 Prevalence of S. aureus, Candida species and aerobic gram negative bacteria
(AGNB) in the oral cavities of cancer patients and healthy individuals
0
10
20
30
40
50
60
S. aureus Candida sp. AGNB
Cancer healthy
Pre
vale
nce
(%
)
*
*
p <0.01

44
3.8 S. aureus, Candida species and aerobic gram negative bacteria (AGNB) in cancer
patients with and without oral mucositis
The results of S. aureus, Candida species and aerobic gram negative bacteria (AGNB) in
cancer patients with and without oral mucositis are shown in Table 3.8 and Figure 3.2. The
results showed that the prevalence of S. aureus and the counts were not significantly different
in patients with oral mucositis and patients without oral mucositis. Similarly percentage
prevalence of aerobic gram negative bacteria was also similar in both study groups. However,
percentage prevalence of Candida species was significantly high in patients with oral
mucositis compared to the patients without oral mucositis.
Table 3.8: Presence of S. aureus, Candida species and aerobic gram negative bacteria
(AGNB) in cancer patients with and without oral mucositis
Organism Category With oral
mucositis
(n=12)
Without oral
mucositis
(n=88)
P value
S. aureus Prevalence (%) 7 (58.3) 45 (51.13) p >0.05
Mean counts
(cfu/ml)
159.7 2215.7 p >0.05
Candida species Prevalence (%) 9 (75) 47 (53.4) p <0.01
Mean counts
(cfu/ml)
1021.1 616.35 p >0.05
AGNB Prevalence (%) 4 (33.3) 20 (22.7) p >0.05
Figure 3.2 Prevalence of S. aureus, Candida species and aerobic gram negative
bacteria (AGNB) in the oral cavities of cancer patients with and without oral
mucositis
0
10
20
30
40
50
60
70
80
S. aureus Candida sp. AGNB
With mucositis Without mucositis
Pre
vale
nce
(%
)
*
*
p<0.01
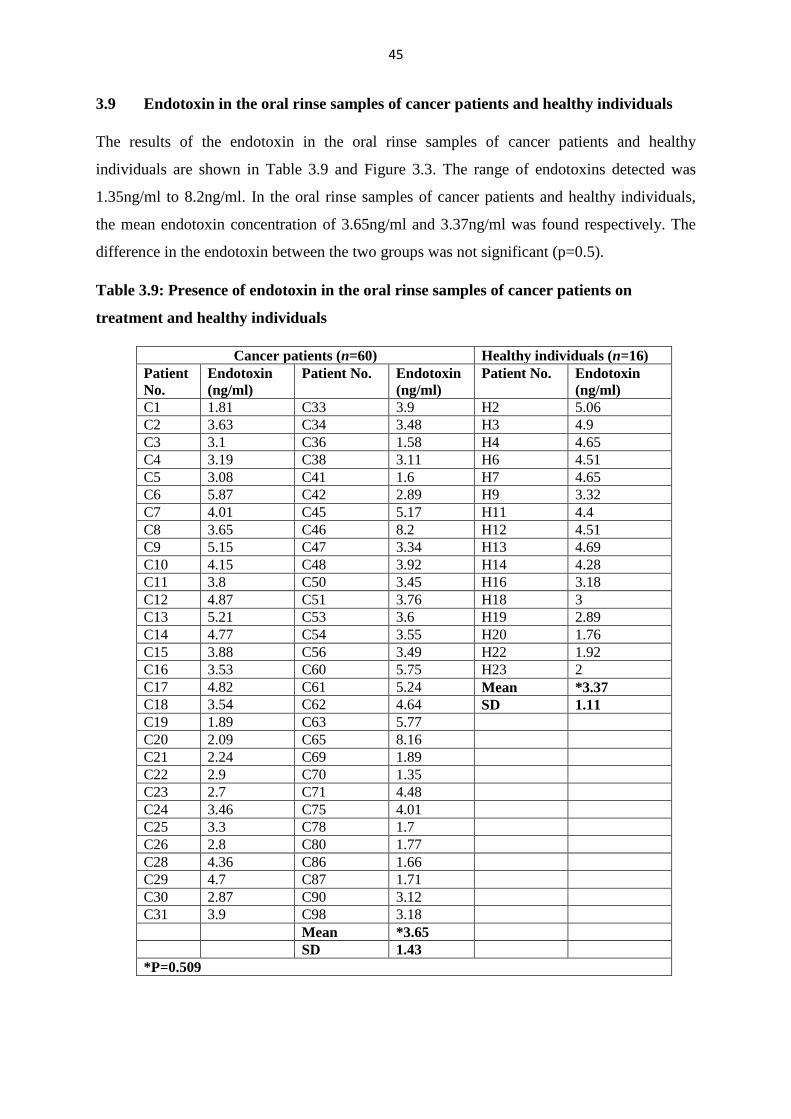
45
3.9 Endotoxin in the oral rinse samples of cancer patients and healthy individuals
The results of the endotoxin in the oral rinse samples of cancer patients and healthy
individuals are shown in Table 3.9 and Figure 3.3. The range of endotoxins detected was
1.35ng/ml to 8.2ng/ml. In the oral rinse samples of cancer patients and healthy individuals,
the mean endotoxin concentration of 3.65ng/ml and 3.37ng/ml was found respectively. The
difference in the endotoxin between the two groups was not significant (p=0.5).
Table 3.9: Presence of endotoxin in the oral rinse samples of cancer patients on
treatment and healthy individuals
Cancer patients (n=60) Healthy individuals (n=16)
Patient
No.
Endotoxin
(ng/ml)
Patient No. Endotoxin
(ng/ml)
Patient No. Endotoxin
(ng/ml)
C1 1.81 C33 3.9 H2 5.06
C2 3.63 C34 3.48 H3 4.9
C3 3.1 C36 1.58 H4 4.65
C4 3.19 C38 3.11 H6 4.51
C5 3.08 C41 1.6 H7 4.65
C6 5.87 C42 2.89 H9 3.32
C7 4.01 C45 5.17 H11 4.4
C8 3.65 C46 8.2 H12 4.51
C9 5.15 C47 3.34 H13 4.69
C10 4.15 C48 3.92 H14 4.28
C11 3.8 C50 3.45 H16 3.18
C12 4.87 C51 3.76 H18 3
C13 5.21 C53 3.6 H19 2.89
C14 4.77 C54 3.55 H20 1.76
C15 3.88 C56 3.49 H22 1.92
C16 3.53 C60 5.75 H23 2
C17 4.82 C61 5.24 Mean *3.37
C18 3.54 C62 4.64 SD 1.11
C19 1.89 C63 5.77
C20 2.09 C65 8.16
C21 2.24 C69 1.89
C22 2.9 C70 1.35
C23 2.7 C71 4.48
C24 3.46 C75 4.01
C25 3.3 C78 1.7
C26 2.8 C80 1.77
C28 4.36 C86 1.66
C29 4.7 C87 1.71
C30 2.87 C90 3.12
C31 3.9 C98 3.18
Mean *3.65
SD 1.43
*P=0.509

46
Figure 3.3: Presence of endotoxin in the oral rinse samples of cancer patients on
treatment and healthy individuals
3.10 Endotoxin in the oral rinse samples of cancer patients with and without oral
mucositis
The results of the endotoxin concentration in the oral rinse samples of cancer patients with
and without oral mucositis are shown in Table 3.10 and Figure 3.4. In cancer patients with
oral mucositis, the range of endotoxins was 1.35ng/ml to 8.2ng/ml, with a mean value of
4.1ng/ml. In cancer patients without oral mucositis, the range of endotoxins was 1.6ng/ml to
5.87ng/ml with a mean value of 3.53ng/ml. The difference in the quantities of endotoxins
between the two groups was not significant (p=0.6).
2.5
2.7
2.9
3.1
3.3
3.5
3.7
3.9
4.1
4.3
4.5
Cancer healthy
End
oto
xin
(n
g/m
l)
*
*
p=>0.05

47
Table 3.10: Presence of endotoxin in the oral rinse samples of cancer patients with and
without oral mucositis
Cancer patients with oral mucositis (n=12) Cancer patients with no oral mucositis (n=48)
Category Patient No. Endotoxin
(ng/ml)
Category Patient No. Endotoxin
(ng/ml)
Grade I C34 3.48 None C1 1.81
C42 2.89 C2 3.63
C46 8.2 C3 3.1
C62 4.64 C4 3.19
C69 1.89 C5 3.08
C70 1.35 C6 5.87
C71 4.48 C7 4.01
C75 4.01 C8 3.65
Grade II C36 1.58 C9 5.15
C65 8.16 C10 4.15
Grade III C25 3.3 C11 3.8
Grade IV C45 5.17 C12 4.87
Mean *4.1 C13 5.21
SD 2.26 C14 4.77
C15 3.88
C16 3.53
C17 4.82
C18 3.54
C19 1.89
C20 2.09
C21 2.24
C22 2.9
C23 2.7
C24 3.46
C26 2.8
C28 4.36
C29 4.7
C30 2.87
C31 3.9
C33 3.9
C38 3.11
C41 1.6
C47 3.34
C48 3.92
C50 3.45
C51 3.76
C53 3.6
C54 3.55
C56 3.49
C60 5.75
C61 5.24
C63 5.77
C78 1.7
C80 1.77
C86 1.66
C87 1.71
C90 3.12
C98 3.18
Mean *3.53
SD 1.14
*P=0.6501

48
Figure 3.4: Presence of endotoxin in the oral rinse samples of cancer patients with and
without oral mucositis
3.11 Endotoxin in the oral rinse samples of cancer patients with and without aerobic
gram negative bacteria
The results of the endotoxin concentration in the oral rinse samples of cancer patients with
and without aerobic gram negative bacteria are shown in Table 3.11 and Figure 3.5. In cancer
patients with aerobic gram negative bacteria, the range of endotoxins was 1.7ng/ml to
5.77ng/ml with a mean value of 3.39ng/ml. In cancer patients without aerobic gram negative
bacteria, the range of endotoxins was 1.58ng/ml to 8.16ng/ml with a mean value of 3.8ng/ml.
The difference in the quantities of endotoxins between the two groups was not significant
(p=0.45).
2.5
3
3.5
4
4.5
5
5.5
With mucositis Without mucositis
End
oto
xin
(n
g/m
l)
*
*
p=>0.05

49
Table 3.11: Presence of endotoxin in the oral rinse samples of cancer patients with and
without aerobic gram negative bacteria
Cancer patients (n=60)
Category Patient
No.
Endotoxin
(ng/ml)
Category Patient No. Endotoxin
(ng/ml)
With AGNB C1 1.81 Without AGNB C2 3.63
(n=23) C10 4.15 (n=37) C3 3.1
C16 3.53 C4 3.19
C18 3.54 C5 3.08
C30 2.87 C6 5.87
C31 3.9 C7 4.01
C34 3.48 C8 3.65
C38 3.11 C9 5.15
C48 3.92 C11 3.8
C50 3.45 C12 4.87
C51 3.76 C13 5.21
C54 3.55 C14 4.77
C56 3.49 C15 3.88
C60 5.75 C17 4.82
C62 4.64 C19 1.89
C63 5.77 C20 2.09
C70 1.35 C21 2.24
C71 4.48 C22 2.9
C78 1.7 C23 2.7
C86 1.66 C24 3.46
C87 1.71 C25 3.3
C90 3.12 C26 2.8
C98 3.18 C28 4.36
Mean *3.39 C29 4.7
SD 1.19 C33 3.9
C36 1.58
C41 1.6
C42 2.89
C45 5.17
C46 8.2
C47 3.34
C53 3.6
C61 5.24
C65 8.16
C69 1.89
C75 4.01
C80 1.77
Mean *3.8
SD 1.56
*P=0.456
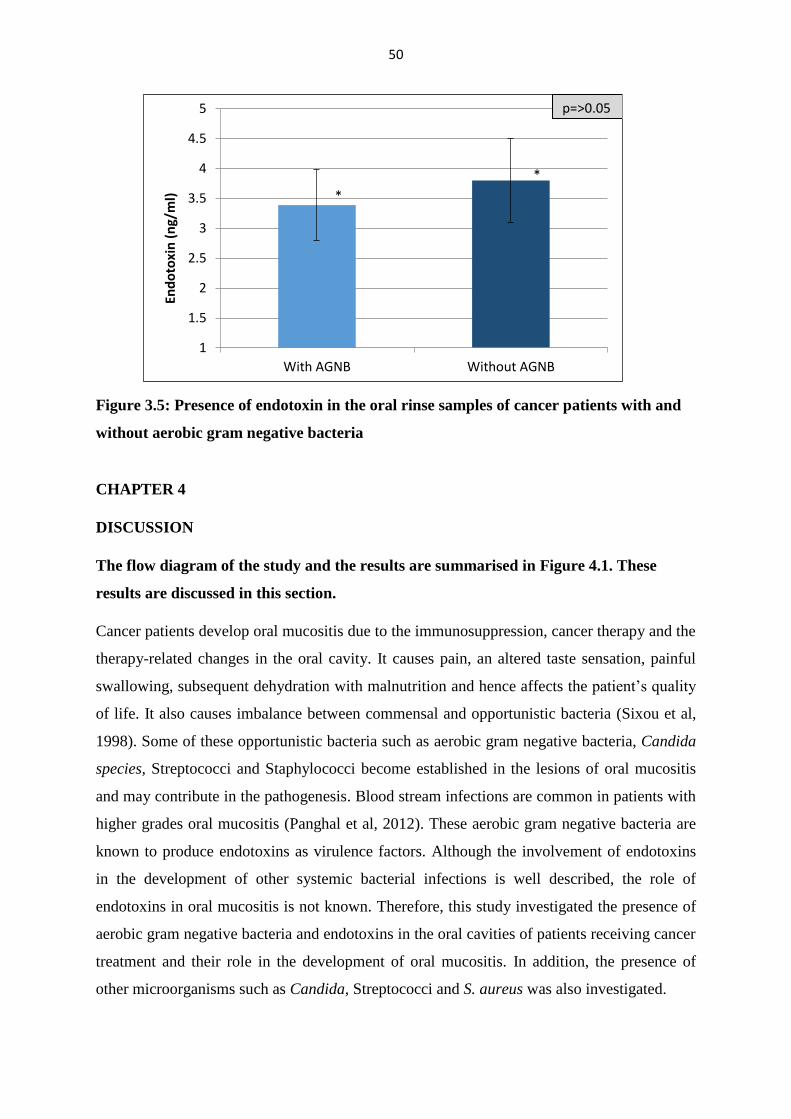
50
Figure 3.5: Presence of endotoxin in the oral rinse samples of cancer patients with and
without aerobic gram negative bacteria
CHAPTER 4
DISCUSSION
The flow diagram of the study and the results are summarised in Figure 4.1. These
results are discussed in this section.
Cancer patients develop oral mucositis due to the immunosuppression, cancer therapy and the
therapy-related changes in the oral cavity. It causes pain, an altered taste sensation, painful
swallowing, subsequent dehydration with malnutrition and hence affects the patient’s quality
of life. It also causes imbalance between commensal and opportunistic bacteria (Sixou et al,
1998). Some of these opportunistic bacteria such as aerobic gram negative bacteria, Candida
species, Streptococci and Staphylococci become established in the lesions of oral mucositis
and may contribute in the pathogenesis. Blood stream infections are common in patients with
higher grades oral mucositis (Panghal et al, 2012). These aerobic gram negative bacteria are
known to produce endotoxins as virulence factors. Although the involvement of endotoxins
in the development of other systemic bacterial infections is well described, the role of
endotoxins in oral mucositis is not known. Therefore, this study investigated the presence of
aerobic gram negative bacteria and endotoxins in the oral cavities of patients receiving cancer
treatment and their role in the development of oral mucositis. In addition, the presence of
other microorganisms such as Candida, Streptococci and S. aureus was also investigated.
1
1.5
2
2.5
3
3.5
4
4.5
5
With AGNB Without AGNB
End
oto
xin
(n
g/m
l)
*
*
p=>0.05

51
Figure 4.1 Flow diagram of the study and outcome
Oral rinse
samples -
100 cancer
patients &
50 healthy
individuals
Endotoxin
levels
AGNB
Prevalence
Demography, oral mucositis, type of cancer treatment etc.
Microbiological
analysis
Candida species
Prevalence &
counts
S. aureus
Prevalence &
counts
Streptococci
Prevalence &
counts
Endotoxin
levels
Endotoxin
levels
Endotoxin
levels
Cancer
patients &
healthy
compared
Cancer
patients:
With &
Without
oral
mucositis
compared
Cancer
patients &
healthy
compared
Cancer
patients:
With &
Without
oral
mucositis
compared
Cancer
patients:
With &
Without
AGNB
compared
Streptococci
Prevalence –no
difference
Counts – high
in cancer
patients
S. aureus
Prevalence &
Counts – no
difference
Candida spp.
Prevalence -
high in cancer
patients and in
patients with
oral mucositis
Counts– no
difference
AGNB
Prevalence– no
difference
No
difference
No
difference
No
difference
+

52
4.1 Streptococci and S. aureus
Streptococci and S. aureus
Oral Streptococci are the principle oral commensal bacteria of the oral cavity which usually
occur in the form of biofilm. They are found in health and disease; however, increased
numbers represent poor health and poor oral hygiene. In addition, high counts of Streptococci
particularly S. mutans suggests caries activity in the oral cavity. The results in this study
showed that healthy individuals (98%) as well as cancer patients (100%) carried Streptococci.
Complications of chemotherapy can illicit temporary impairment of the salivary gland
function, changes in the quantity and quality of saliva and suppress the oral host’s defence
against microorganisms, thus allowing oral infections to develop. Consequently, this favours
dental bacterial plaque accumulation, gingival inflammation and the abundance of cariogenic
bacteria such as S. mutans and lactobacilli in these patients (Pendersen, 2016). This was
similarly seen in the Streptococcal counts in cancer patients in this study, as they were
significantly high compared to healthy individuals.
Literature on the number of Streptococci and Staphylococci during cancer treatment is
controversial. Bergmann (1991) and Wahlin & Holm (1988) showed that during cancer
treatment there was no increase in Streptococci and S. aureus, which may be explained by the
concomitant use of antibiotics, antifungals and the use of chlorhexidine rinses during
chemotherapy, as well as the cytotoxic effects of chemotherapy itself (O’ Sullivan et al
1993). However, other studies have reported increases in Streptococci and S. aureus (Sixou et
al, 1998, Main et al, 1984, Almståhl et al, 2008). The increase in these bacteria occurs as a
result of hyposalivation and xerostomia and it can increase the risk of development of dental
caries (Hu et al, 2013, Su et al, 2011, Keene and Fleming, 1987). Similarly, the cancer
patients in this study were not on any topical or systemic antimicrobials and 88% of patients
complained of a dry mouth with 58% of patients presenting with caries, thus contributing to
the high counts of Streptococci in cancer patients. In addition, intergeneric co-aggregation
and other symbiotic relationships also play a role in the occurrence of these bacteria in the
oral cavity (Peterson et al, 1990).
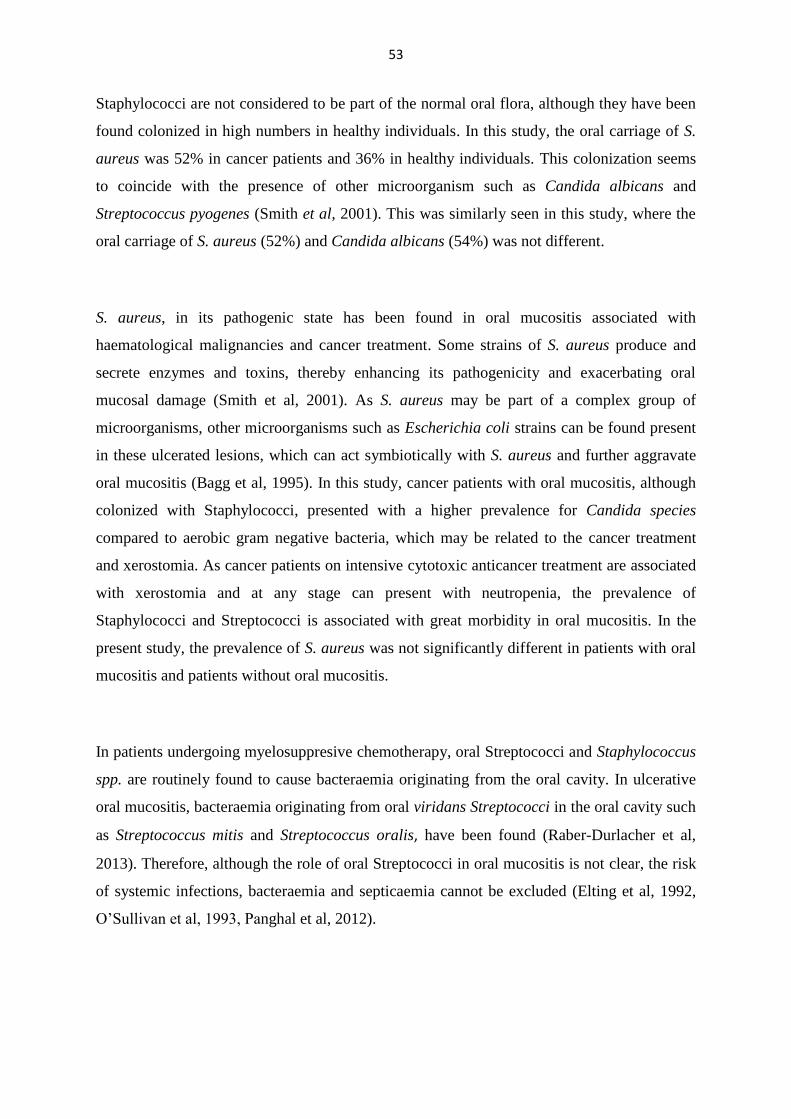
53
Staphylococci are not considered to be part of the normal oral flora, although they have been
found colonized in high numbers in healthy individuals. In this study, the oral carriage of S.
aureus was 52% in cancer patients and 36% in healthy individuals. This colonization seems
to coincide with the presence of other microorganism such as Candida albicans and
Streptococcus pyogenes (Smith et al, 2001). This was similarly seen in this study, where the
oral carriage of S. aureus (52%) and Candida albicans (54%) was not different.
S. aureus, in its pathogenic state has been found in oral mucositis associated with
haematological malignancies and cancer treatment. Some strains of S. aureus produce and
secrete enzymes and toxins, thereby enhancing its pathogenicity and exacerbating oral
mucosal damage (Smith et al, 2001). As S. aureus may be part of a complex group of
microorganisms, other microorganisms such as Escherichia coli strains can be found present
in these ulcerated lesions, which can act symbiotically with S. aureus and further aggravate
oral mucositis (Bagg et al, 1995). In this study, cancer patients with oral mucositis, although
colonized with Staphylococci, presented with a higher prevalence for Candida species
compared to aerobic gram negative bacteria, which may be related to the cancer treatment
and xerostomia. As cancer patients on intensive cytotoxic anticancer treatment are associated
with xerostomia and at any stage can present with neutropenia, the prevalence of
Staphylococci and Streptococci is associated with great morbidity in oral mucositis. In the
present study, the prevalence of S. aureus was not significantly different in patients with oral
mucositis and patients without oral mucositis.
In patients undergoing myelosuppresive chemotherapy, oral Streptococci and Staphylococcus
spp. are routinely found to cause bacteraemia originating from the oral cavity. In ulcerative
oral mucositis, bacteraemia originating from oral viridans Streptococci in the oral cavity such
as Streptococcus mitis and Streptococcus oralis, have been found (Raber-Durlacher et al,
2013). Therefore, although the role of oral Streptococci in oral mucositis is not clear, the risk
of systemic infections, bacteraemia and septicaemia cannot be excluded (Elting et al, 1992,
O’Sullivan et al, 1993, Panghal et al, 2012).

54
4.2 Candida species
Various species of Candida including C. albicans are known to cause oral candidiasis and
they have been found in high numbers in the cancer treatment-related oral ulcers and angular
chelitis (Wahlin & Holm, 1988).
In this study, C. albicans carriage was found to be 54% amongst patients undergoing radio-
and chemotherapy. Patients treated with chemotherapy were noted to have an overall greater
prevalence of C. albicans colonization, which may be due to the systemic nature of cytotoxic
chemotherapy treatment and xerostomia related to the drugs and radiation (Redding et al,
1999, Al-Abeid et al, 2004, Ramirez-Amador et al, 1997). There is no definite colony count
that has been established that allows for the difference between commensalism and disease.
However, higher counts may predict the possibility of the development of infection. In this
study it was shown that the prevalence of Candida carriage was high in patients undergoing
cancer treatment compared to healthy individuals and cancer patients with oral mucositis
compared to the cancer patients without oral mucositis. Therefore, the role of Candida in the
development of infection and exacerbation of oral mucositis cannot be excluded. Similar
results were reported by Gaetti-Jardim et al in 2011 where Candida was frequently noted in
patients with grade III and IV oral mucositis. Other reasons that may have contributed to the
Candida colonization would be from poor oral health care and the patient’s nutritional status
during cancer treatment, partly due to low socio-economic factors and poor education as seen
in less developed countries (Panghal et al, 2012).
Malignancies and related chemotherapy and radiation are known to compromise the cell
mediated host immunity which generally controls fungal infections. Both types of cancer
therapies are able to cause oral mucositis resulting from hyposalivation and xerostomia which
increases oral yeast proliferation, colonization and infection (Schelenz et al, 2011,
Samaranayake et al, 1984). Therefore, to prevent infection it is important to maintain low
counts of Candida in the oral cavity during cancer treatment.
The predominant species isolated was C. albicans. Nevertheless, the results showed that
Candida species other than C. albicans colonized the oral cavities of cancer patients. The

55
presence of non-albicans species may be due to immunosuppression and their reduced ability
to prevent colonization. Similar results have been reported by Gaetti-Jardim et al, 2011,
Laheij et al, 2012, Panghal et al, 2012 and Ramla et al, 2016. The second most frequently
isolated species was C. glabrata which is known to be found in patients undergoing cancer
therapy and consistent with other reports (Schelenz et al, 2011, Al-Abeid et al, 2004, Safdar
et al, 2001, Ramla et al, 2016). These results are important because many non-albicans
Candida species are known to be resistant to many commonly used antifungal drugs (Pfaller
and Diekema, 2012). In addition, these yeasts other than C. albicans are reported to cause
candidemia in patients with malignancies as a result of probably the haploid nature and the
ability to mutate rapidly (Hachem et al, 2008). Occurrence of more than one species of
Candida was also noted only in the oral cavities of cancer patients which is similar to
previous reports (Ramla et al, 2016, Davies et al, 2006). Management of infections in these
patients can be challenging because many of these species other than C. albicans are often
resistant to commonly used drugs (Schelenz et al, 2011). For example, 10-25% of C.
tropicalis, 35% of C. glabrata and 75% of C. krusei are found to be resistant to fluconazole
(Krcmery and Barnes, 2002).
Therefore, during cancer treatment, it is important to perform microbiological analysis of oral
cavity samples.
4.3 Aerobic gram negative bacteria
The human oral cavity harbours approximately 700 different types of bacteria as
commensals. However, aerobic gram negative bacteria (AGNB) particularly from the group
of Enterobacteriacae do not form part of this flora. Nevertheless, it is generally known that
during severe underlying disease, these bacteria are carried transiently into the oropharynx.
Due to unknown reasons, these bacteria are also carried by generally healthy people, as also
shown in this study. Denudement of the oral mucosa from the fibronectin exposes receptor
sites required for the attachment of AGNB which is responsible for the colonization of these
bacteria (Dal Nogare et al, 1987).
In literature, the prevalence rate of the carriage of AGNB is unclear. In this present study, the
carriage rate of AGNB in cancer patients was 24% and in the healthy individuals it was 14%,
which was not significantly different from one another. O’Sullivan et al, (1993) also found
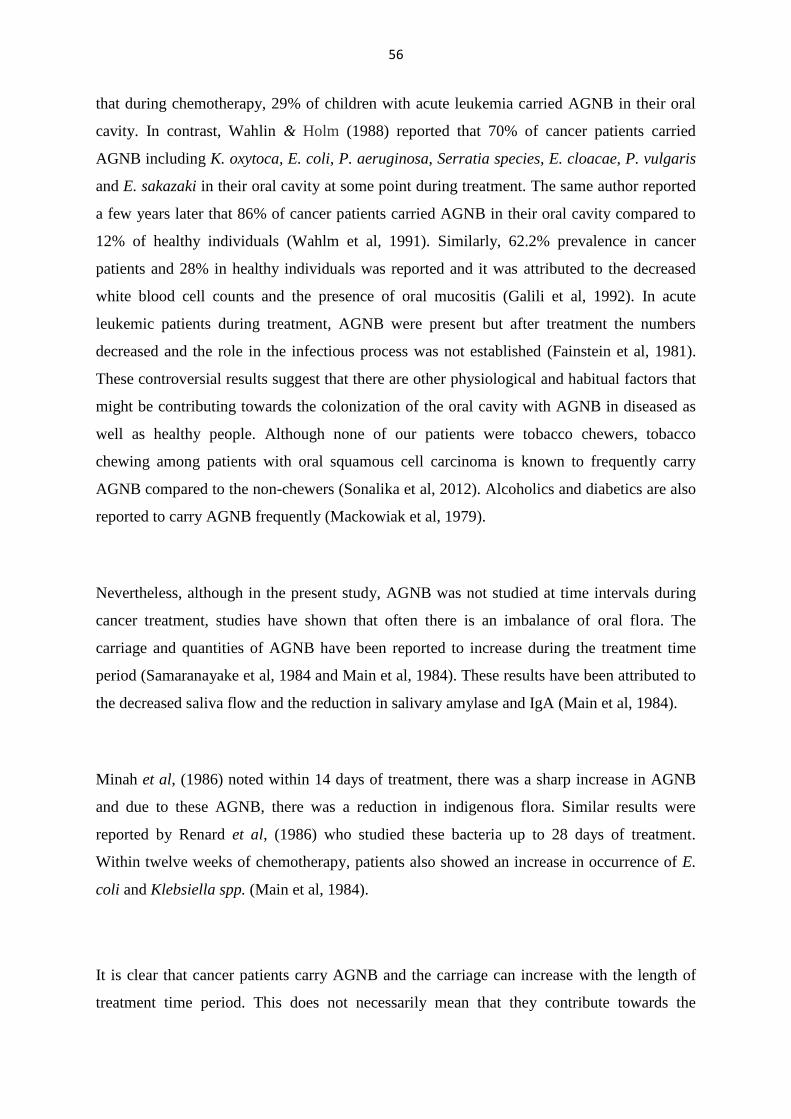
56
that during chemotherapy, 29% of children with acute leukemia carried AGNB in their oral
cavity. In contrast, Wahlin & Holm (1988) reported that 70% of cancer patients carried
AGNB including K. oxytoca, E. coli, P. aeruginosa, Serratia species, E. cloacae, P. vulgaris
and E. sakazaki in their oral cavity at some point during treatment. The same author reported
a few years later that 86% of cancer patients carried AGNB in their oral cavity compared to
12% of healthy individuals (Wahlm et al, 1991). Similarly, 62.2% prevalence in cancer
patients and 28% in healthy individuals was reported and it was attributed to the decreased
white blood cell counts and the presence of oral mucositis (Galili et al, 1992). In acute
leukemic patients during treatment, AGNB were present but after treatment the numbers
decreased and the role in the infectious process was not established (Fainstein et al, 1981).
These controversial results suggest that there are other physiological and habitual factors that
might be contributing towards the colonization of the oral cavity with AGNB in diseased as
well as healthy people. Although none of our patients were tobacco chewers, tobacco
chewing among patients with oral squamous cell carcinoma is known to frequently carry
AGNB compared to the non-chewers (Sonalika et al, 2012). Alcoholics and diabetics are also
reported to carry AGNB frequently (Mackowiak et al, 1979).
Nevertheless, although in the present study, AGNB was not studied at time intervals during
cancer treatment, studies have shown that often there is an imbalance of oral flora. The
carriage and quantities of AGNB have been reported to increase during the treatment time
period (Samaranayake et al, 1984 and Main et al, 1984). These results have been attributed to
the decreased saliva flow and the reduction in salivary amylase and IgA (Main et al, 1984).
Minah et al, (1986) noted within 14 days of treatment, there was a sharp increase in AGNB
and due to these AGNB, there was a reduction in indigenous flora. Similar results were
reported by Renard et al, (1986) who studied these bacteria up to 28 days of treatment.
Within twelve weeks of chemotherapy, patients also showed an increase in occurrence of E.
coli and Klebsiella spp. (Main et al, 1984).
It is clear that cancer patients carry AGNB and the carriage can increase with the length of
treatment time period. This does not necessarily mean that they contribute towards the

57
exacerbation of oral mucositis. In the present study, there was no difference in the prevalence
of AGNB between the cancer patients with and without oral mucositis. In contrast Gaetti-
Jardim et al, (2011) found that AGNB were frequently present in patients with of grade III
and IV oral mucositis. Similarly, Soares et al, (2011) found E. coli and K. pneumonia less
frequently in children with leukemia on treatment and in the children with oral mucositis. Up
to 58% of cancer patients particularly those with oral mucositis carried AGNB in their oral
cavity and the predominant species was K. pneumonia (Panghal et al, 2012), which suggest
that AGNB may play some role in the pathogenesis of oral mucositis.
Oral mucositis develops from mucosal changes that occur from the thinning of oral tissues to
ulceration (Redding, 2005). Even if AGNB may or may not cause any pathology, the mere
presence of ulceration can allow these bacteria to enter into the deep tissues and into the
blood stream. Therefore, the rate of blood stream infections due to AGNB in cancer patients
has been found to be high (Gudiol et al, 2013 and Panghal et al, 2012). Blood stream
infections are more common in patients with haematological malignancies compared to the
patients with solid tumors. Patients with oral mucositis are known to carry their oral flora in
their blood stream. For example 23% of leukemia patients carried AGNB in their oral cavity
out of which 18% carried these bacteria were found in their bloodstream (Anirudhan et al,
2008). This transmission was much higher with AGNB compared to the fungi and gram
positive bacteria (Anirudhan et al, 2008). Similarly 57% of blood cultures were positive for
AGNB in cancer patients with fever (Panghal et al, 2012).
The results in this study suggests that in cancer patients compared to the healthy individuals,
whether the carrier rate of AGNB is high or not, they are present and can increase with the
treatment time period and there is the likelihood of systemic and bloodstream infections, due
to the presence of these bacteria.
AGNB produce endotoxins which are known to interact with the host’s cells which produce
proinflammatory cytokines and cause pathology. Therefore, the presence of endotoxins in the
oral cavities of cancer patients and healthy individual was also studied.

58
4.4 Endotoxin
Endotoxins are lipopolysaccharide produced by aerobic gram negative and anaerobic bacilli.
In the oral cavity mostly anaerobic gram negative bacilli exist and are implicated in
periodontal diseases. Periodontal pathogens present are Porphyromonas gingivalis,
Prevotella intermedia, Fusobacterium nucleatum, Treponema denticola and many more.
These bacteria also produce endotoxins however, the endotoxicity is 1000 times lower than
the endotoxins produced by E. coli which is an aerobic gastrointestinal bacillus and generally
not found in the oral cavity. Endotoxin detection tests for the detection of anaerobic bacteria
are not available but the E. coli endotoxin kit-based tests have been developed and these are
commercially available. It is for this reason the chromogenic Limulus gelation assay test
which uses the E. coli endotoxin, was used.
In our study groups (60 cancer patients and 16 healthy individuals), the range of endotoxins
detected was 1.35ng/ml to 8.2ng/ml. In the oral rinse samples of cancer patients and healthy
individuals, a mean endotoxin concentration of 3.65ng/ml and 3.37ng/ml was found
respectively. The difference in the endotoxin between the two groups was not significant
(p=0.5). The Hycult Biotech Limulus Amebocyte Lysate (LAL) assay kit that was used in
this study is based on a similar kit that was used by Leenstra et al, (1996). Our endotoxin
levels were found to be lower than the endotoxins reported by Leenstra et al, (1996). In their
study, they measured endotoxin levels in oral rinse samples of 15 healthy individuals which
were found ranging between 3ng/ml and 30ng/ml with a mean oral endotoxin level of
20ng/ml. However, in their study group these healthy individuals did not carry AGNB,
therefore the results were multiplied by 1000 to adjust for the potency of anaerobic oral
bacteria. This means that our endotoxin levels were much higher than those reported by
Leenstra et al, (1996).
In Milln’s study, the endotoxin concentration range was between 5.8ng/ml and 36ng/ml with
a mean concentration of 19.1ng/ml for the paediatric cancer patients, which was similar to
Leenstra et al, (1996) findings in healthy individuals of 20ng/ml. The healthy paediatric
population had a mean endotoxin range of 3.1ng/ml and 20.7ng/ml with a mean salivary
endotoxin concentration of 12.75ng/ml. Millns et al, (1999) describes that the false positive
results in the leukemic patients were possible due to either bacterial clearance with the release
of endotoxins at the same time or due to the absence of routine neutralizing effects from

59
platelets, proteins and leucocytes on endotoxins especially in immunocompromised,
neutropenic patients or due to antibiotic-induced release of endotoxins (Goto and Nakamura
1980; Shenep et al, 1985 and Shenep and Mogan, 1984). Millns et al, (1999) findings showed
that salivary endotoxins were a poor predictor of sepsis and they did not correlate with the
ANGB carriage in the oropharynx, but rather that a relationship existed between neutropenia
and the raised salivary endotoxins. Similarly in the present study no correlation existed
between the carriage of AGNB and endotoxin levels.
In the present study, the range of endotoxins in cancer patients with oral mucositis was
1.35ng/ml to 8.2ng/ml with a mean value of 4.1ng/ml, where as in cancer patients without
oral mucositis, the range of endotoxins was 1.6ng/ml to 5.87ng/ml with a mean value of
3.53ng/ml. Although the endotoxin levels were slightly higher in patients with oral mucositis,
it was not significantly higher compared to the levels in patients without oral mucositis. Only
12 out of 100 cancer patients had oral mucositis. The sample size was too small for any
inferences to be made. Nevertheless, given the limitations, endotoxins may not have
contributed towards the pathogenesis of oral mucositis. This result could only be compared to
the studies done by Leenstra et al, (1996) and Millns et al, (1999), as there are no other
studies available on PUBMED.
These endotoxin levels, although not very high, raised the question of the origin of endotoxin.
Gram negative anaerobic oral bacteria also produce endotoxins but they are slightly different
in the composition and potency. The endotoxin from anaerobic bacterium lack two essential
structures i.e. 2-keto-3 deoxyoctonate and heptose (Johne and Bryn, 1986) and therefore
requires a concentration of a 1000 times higher to cause lethality in chick embryos and mice
(Kasper, 1976, John and Bryn, 1986). Endotoxins from oral bacteria such as Porphyromonas
gingivalis (previously called Bacteroides gingivalis), Prevotella melaninogenicus (previously
called Bacteroides melaninogenicus), Fusobacterium and Veillonella have been characterised
and tested against chick embryos, rabbits and mice (Sveen et al, 1977, Koga et al, 1985,
Hofstad and Sveen, 1979 and Grehn, 1980). The results showed that much higher
concentrations of endotoxins were required to cause lethality. This justifies the
commensalism of these anaerobic bacteria. In the present study, the detected endotoxins may
have been produced by aerobic or anaerobic oral bacteria and in those who were carriers of
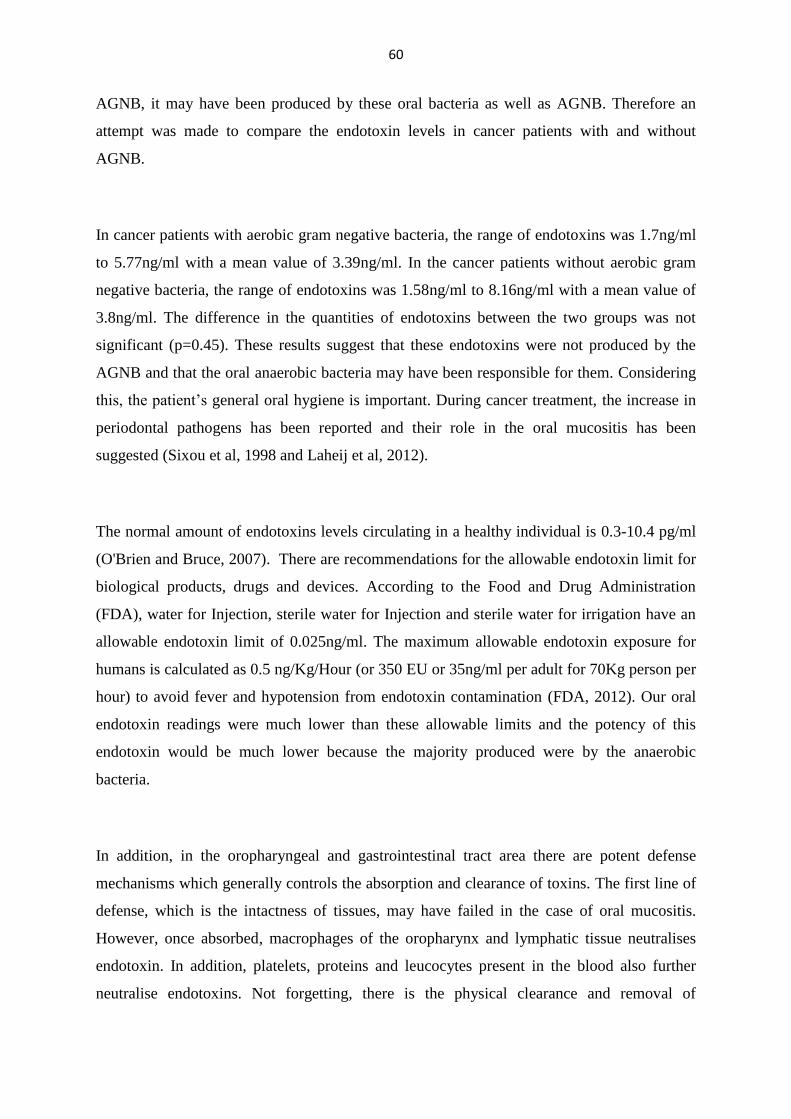
60
AGNB, it may have been produced by these oral bacteria as well as AGNB. Therefore an
attempt was made to compare the endotoxin levels in cancer patients with and without
AGNB.
In cancer patients with aerobic gram negative bacteria, the range of endotoxins was 1.7ng/ml
to 5.77ng/ml with a mean value of 3.39ng/ml. In the cancer patients without aerobic gram
negative bacteria, the range of endotoxins was 1.58ng/ml to 8.16ng/ml with a mean value of
3.8ng/ml. The difference in the quantities of endotoxins between the two groups was not
significant (p=0.45). These results suggest that these endotoxins were not produced by the
AGNB and that the oral anaerobic bacteria may have been responsible for them. Considering
this, the patient’s general oral hygiene is important. During cancer treatment, the increase in
periodontal pathogens has been reported and their role in the oral mucositis has been
suggested (Sixou et al, 1998 and Laheij et al, 2012).
The normal amount of endotoxins levels circulating in a healthy individual is 0.3-10.4 pg/ml
(O'Brien and Bruce, 2007). There are recommendations for the allowable endotoxin limit for
biological products, drugs and devices. According to the Food and Drug Administration
(FDA), water for Injection, sterile water for Injection and sterile water for irrigation have an
allowable endotoxin limit of 0.025ng/ml. The maximum allowable endotoxin exposure for
humans is calculated as 0.5 ng/Kg/Hour (or 350 EU or 35ng/ml per adult for 70Kg person per
hour) to avoid fever and hypotension from endotoxin contamination (FDA, 2012). Our oral
endotoxin readings were much lower than these allowable limits and the potency of this
endotoxin would be much lower because the majority produced were by the anaerobic
bacteria.
In addition, in the oropharyngeal and gastrointestinal tract area there are potent defense
mechanisms which generally controls the absorption and clearance of toxins. The first line of
defense, which is the intactness of tissues, may have failed in the case of oral mucositis.
However, once absorbed, macrophages of the oropharynx and lymphatic tissue neutralises
endotoxin. In addition, platelets, proteins and leucocytes present in the blood also further
neutralise endotoxins. Not forgetting, there is the physical clearance and removal of

61
endotoxins and AGNB via physical mechanisms of reflex, tongue movements and the
salivary flow. Salivary mucins are also known to neutralise endotoxin from the oral cavity
(Daly et al, 1980). Nevertheless, high counts of AGNB in the oral cavity may increase the
quantities of endotoxin and the sub-functioning oropharynx-associated lymphatic tissues in
the immunosuppressed patient may not cope with the natural clearance. In some of our
patients, AGNB was detected only after an enrichment technique meaning that the counts of
AGNB in the actual oral rinse were very low.
4.5 Prevention, treatment and recommendations
While a number of the adverse effects associated with cancer treatment are well managed,
oral mucositis remains an area for debate in the efficient management of this condition (De
Sanctisa et al, 2016). Although several approaches have been recommended for the treatment
of oral mucositis, no specific prophylactic agent or intervention has been devised for the
effective prevention and management of this condition (Köstler et al, 2001), also considering
that these patients already are taking multiple cancer drugs.
A systematic literature review was done in relation to the prophylaxis and management of
oral mucositis over the past 20 years and this was assessed by clinical experts and a
consensus by 40 different multidisciplinary experts such oncologists, infectious disease
physicians, nurses, nutritionists and oral health professionals. Their aim was to reach
consensus to the prophylaxis and management of the condition (De Sanctisa et al, 2016).
Although oral mucositis can develop as a complication of the cytotoxic therapy, patient risk
factors have been highlighted to influence the progression of oral mucositis, such as poor oral
hygiene, periodontal disease, alcohol, tobacco use and immunosuppression related to the
treatment or from other diseases such as diabetes mellitus (Meurman et al., 1997).
In this multidisciplinary approach, oral health professionals are recommended for the
maintenance of good oral hygiene, periodontal disease and dental disease during pre-
treatment, during treatment and post treatment of cancer (Lalla et al, 2008). The practice of
strict oral hygiene regimens, have been associated with lowering the incidence of oral

62
mucositis with the reduction in the colonization of opportunistic bacteria (Yoneda et al,
2007).
Numerous topical agents like barrier-protective agents which have been suggested to cover
the ulcerated region to reduce symptoms, have been recommended for the prevention and
treatment of oral mucositis, although these have been proven ineffective (De Sanctisa et al,
2016). Topical antibacterial mouthwashes such chlorhexidine gluconate have been proposed.
Many studies have been done to emphasize the positive effects of chlorhexidine to
significantly reduce the incidence and treat this pathology (Ferretti et al, 1990, McGaw and
Belch, 1985), but other randomised trials have proven them to be ineffective (Spijkervet et al,
1989c and Weisdorf et al, 1989). In the study by Ferretti et al, (1990), evidence of the
reduction of streptococci and yeasts were noted, although in the study by Spijkervet et al,
(1989c), colonization of Candida spp, Streptococci spp, Staphylococci and aerobic gram
negative bacteria were not reduced after five weeks of using chlorhexidine rinses compared
to a placebo rinse. Evidence of the presence of gram negative bacteria persisting despite the
use this oral rinse (Raybould et al, 1994) was found due to the low susceptibility of gram
negative bacilli to chlorhexidine, the discomfort and possible aggravation of the condition
associated with the mouthwash (Wahlin, 1989). It has also been found that the inefficacy of
certain antifungals such as nystatin in combination with chlorhexidine against C. albicans in
vitro, have been reported (Barkvoll and Attramadal, 1989). These and other antibacterial
agents have been recommended but none impacting on a better quality of life.
By selectively eliminating certain oral flora with antibiotic and antifungal lozenges
(containing polymixin, tobramycin and Amphotericin B; or bacitracin, clotrimoxazole and
gentamicin) in the hope that fewer patients would need a feeding tube and combat
malnutrition, this did not reduce the severity of oral mucositis (Stokman et al, 2003 and
Wijers et al. 2001). Polymyxin is used for the selective treatment for gram negative bacteria
and Tobramycin has a role in treating bacterial infections, particularly gram negative
infections. Amphotericin B is an antifungal used to treat systemic fungal infection (Saunders
et al, 2013). Clotrimazole and fluconazole have been shown to reduce the candida
colonization in patients with oropharyngeal candidiasis (Saunders et al, 2013), although
fluconazole did not reduce the incidence of oral mucositis. This suggested that bacteria might
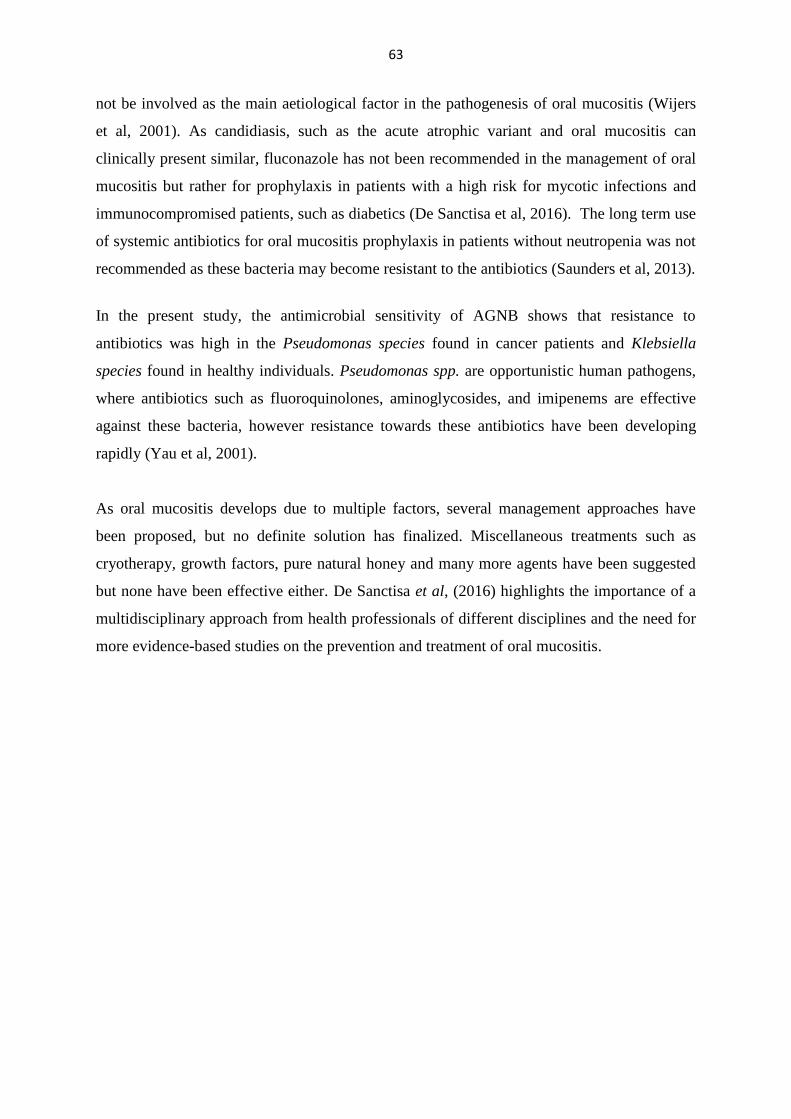
63
not be involved as the main aetiological factor in the pathogenesis of oral mucositis (Wijers
et al, 2001). As candidiasis, such as the acute atrophic variant and oral mucositis can
clinically present similar, fluconazole has not been recommended in the management of oral
mucositis but rather for prophylaxis in patients with a high risk for mycotic infections and
immunocompromised patients, such as diabetics (De Sanctisa et al, 2016). The long term use
of systemic antibiotics for oral mucositis prophylaxis in patients without neutropenia was not
recommended as these bacteria may become resistant to the antibiotics (Saunders et al, 2013).
In the present study, the antimicrobial sensitivity of AGNB shows that resistance to
antibiotics was high in the Pseudomonas species found in cancer patients and Klebsiella
species found in healthy individuals. Pseudomonas spp. are opportunistic human pathogens,
where antibiotics such as fluoroquinolones, aminoglycosides, and imipenems are effective
against these bacteria, however resistance towards these antibiotics have been developing
rapidly (Yau et al, 2001).
As oral mucositis develops due to multiple factors, several management approaches have
been proposed, but no definite solution has finalized. Miscellaneous treatments such as
cryotherapy, growth factors, pure natural honey and many more agents have been suggested
but none have been effective either. De Sanctisa et al, (2016) highlights the importance of a
multidisciplinary approach from health professionals of different disciplines and the need for
more evidence-based studies on the prevention and treatment of oral mucositis.

64
CHAPTER 5
CONCLUSIONS, LIMITATIONS AND FUTURE RESEARCH
5.1 Conclusions
The carriage of Candida species was found to be high in the oral cavities of cancer patients
on radio and/or chemotherapy compared to the healthy individuals. However, carriage of
Streptococci, S. aureus and aerobic gram negative bacteria was not different between the two
groups. Cancer patients on radio and/or chemotherapy carried high number of Streptococci in
their oral cavities compared to the healthy individuals. However, no difference in the counts
of S. aureus and C. albicans was noted. The prevalence of Candida was high in the cancer
patients with oral mucositis compared to the patients without oral mucositis. Cancer patients
also carried a variety of Candida species including C. albicans and C. glabrata, and multiple
species in their oral cavities compared to the healthy individuals. Cancer patients also carried
a variety of aerobic gram negative bacteria compared to healthy individuals. Enterobacter
cloacae and Klebsiella pneumonia were isolated from the oral cavities of both study groups.
The antimicrobial sensitivity test results showed that aerobic gram negative bacteria were
resistant to many antibiotics in cancer patients and healthy individuals.
Endotoxin test results showed no significant difference in the endotoxins present in the oral
rinses samples collected from cancer patients and healthy individuals, cancer patients with
and without oral mucositis and cancer patients with and without aerobic gram negative
bacteria.
These results suggest that although cancer patients carry aerobic gram negative bacteria and
endotoxins in their oral cavities, they may not contribute in the exacerbation of oral
mucositis. However, Candida species may contribute in the exacerbation of oral mucositis
and therefore, during cancer treatment, it is important to take preventative measures to
prevent colonization of Candida.

65
5.2 Limitations
It would have been ideal to have a larger sample size. Due to the time and financial
constraints only 100 cancer patients and 50 healthy individuals were included.
Thorough oral hygiene assessment was not possible as these cancer patients are often
too ill to comply. It may have assisted in the interpretation of the microbiology
results.
Endotoxin test was performed only on 76 oral rinse samples (60 cancer patients and
16 healthy individuals) in duplicate. The cost of the endotoxin test was R 345.96 per
sample and therefore more samples could not be tested. In addition, it is a kit based
test.
Unfortunately only 12/100 cancer patients had oral mucositis. Ideally, it would have
been better to have more patients with oral mucositis in order to have a reasonable
comparison.
5.3 Future research
A similar study can be undertaken with a larger sample size
Antifungal susceptibility tests can be performed on all the Candida isolates to
determine a resistance pattern in our population
Anaerobic gram negative bacteria which are generally dental plaque-associated
periodontal pathogens can be isolated and identified from this study population
Endotoxin testing can be performed more than twice per sample to eliminate any
errors.
Aerobic gram negative bacteria from faecal samples and oral rinse can be compared
in cancer patients to establish the origin of these bacteria as they do not form part of
true oral flora.

66
CHAPTER 6
References
Ahmed K. M., Talabani N. & Altaei T. (2013) Olive Leaf Extract as a New Topical
Experimental Animal Study and Clinical Trial. Pharmaceut Anal Acta 4(9):1-18.
Al-Abeid H.M., Abu-Elteen K.H., Elkarmi A.Z. & Hamad M.A. (2004). Isolation and
characterization of Candida spp. in Jordanian cancer patients: prevalence, pathogenic
determinants, and antifungal sensitivity. Jpn J Infect Dis 57(6):279-84.
Al-Dasooqi N., Sonis S.T., Bowen J.M., Bateman E., Blijleven N., Gibson R.J., Logan R.M.,
Nair R.G., Stringer A.M., Yazbeck R., Elad S. & Lalla R.V. (2013). Emerging evidence on
the pathobiology of mucositis. Supp Care Can 21:3233–3241.
Almståhl A., Wikström M. & Groenink J. (2001). Lactoferrin, amylase and mucin MUC5B
and their relation to the oral microflora in hyposalivation of different origins. Oral Microbiol
Immunol.16:345–352.
Almståhl A., Wikström M. & Fagerberg-Mohlinet B. (2008). Microflora in Oral Ecosystems
in Subjects With Radiation-Induced Hyposalivation.Oral Dis 14(6):541-549.
Alvarez P.B., García M.P.S., Iruegas M.E.P. & García-García A. (2015). Radiotherapy and
Chemotherapy Treatments in Head and Neck Cancer Patients — Protocol for Management
Before, During and After RTP, Updates on Cancer Treatment, Prof. Letícia Rangel (Ed.),
InTech, DOI: 10.5772/60397
American Cancer Society. Second cancers in Adults. Atlanta: American Cancer Society;
2014.

67
Anirudhan D., Bakhshi S., Xess I., Broor S. & Arya L.S. (2008). Etiology and Outcomes of
Oral Mucosal Lesions in Children on Chemotherapy for Acute Lymphoblastic Anaemia.
Indian Paed 45:47-51.
API® 20E System. Identification system for Enterobacteriaceae and other non-fastidious
Gram-negative rods. REF 20 100 / 20 160. http://www.biomerieux.com
Bagg J., Sweeney M.P., Wood K.H. & Wiggens A. (1995). Possible Role of Staphylococcus
aureus in Severe Oral Mucositis among Elderly Dehydrated Patients. Micro ecolog in health
dis. 8:5 1-56.
Barasch A., Elad S., Altman A., Damato K. & Epstein J. (2006). Antimicrobials, mucosal
coating agents, anesthetics, analgesics, and nutritional supplements for alimentary tract
mucositis. Sup Care Can 14(6): 528-532.
Barkvoll P. & Attramadal A. (1989). Effect of nystatin and chlorhexidine digluconate
on Candida albicans. Oral Surg Oral Med Oral Pathol. 67:279–281.
Baskar R., Lee K.A., Yeo R. & Yeoh K.W. (2012). Cancer and Radiation Therapy: Current
Advances and Future Directions. Int J Med Sci 9(3):193-199.
Baskaran N.D., Gan G.G., Adeeba K.& Sam I. (2007). Bacteremia in patients with febrile
neutropenia after chemotherapy at a university medical center in Malaysia. Int J Inf Dis
11:513-517.
Bergmann O.J. (1991). Alterations in the oral microflora and pathogenesis of acute oral
infections during remissions-induction therapy in patients with acute myeloid leukaemia.
Scan J Infect Dis 23: 355-66.

68
Beveridge T. (1999). Structures of Gram-Negative Cell Walls and Their Derived Membrane
Vesicles. J Bacteriol 181(16):4725–4733.
Brown L.R., Dreizen S., Handler S. & Johnston D.A.(1975). Effect of radiation-induced
xerostomia on human oral microflora. J Dent Res. 54:740-750.
Caballero M., Grau J.J., Casellas S., Bernal-Sprekelsen M. & Blanch J.L. (2009). 'The Role
of Chemotherapy in Advanced Oral Cavity Cancer'. Acta Otorrinolaringologica (English
Edition) 60(4):260-267.
Clinical and Laboratory Standards Institute. Performance standards for antimicrobial
susceptibility testing; Twenty sixth informational supplement. CLSI document M100S-26.
Wayne, PA: Clinical and Laboratory Standards Institute.2016.
Conti S., Dos Santos S.S.F., Koga-Ito C. Y. & Jorge A. O. C. (2009). Enterobacteriaceae and
Pseudomonadaceae on the dorsum of the human tongue. J Appl Oral Sci 17(5):375-80.
Crosbie E.J., Einstein M.H., Franceschi S.& Kitchener H.C. (2013). Human papillomavirus
and cervical cancer. Lancet 382:889–99.
Dal Nogare A.R., Toews G.B. & Pierce A.K. (1987). Increased salivary elastase precedes
gram-negative bacillary colonization in postoperative patients. Am. Rev. Respir. Dis.135:671-
675.
Daly C.G., Seymour G. J., Keiser J. B. (1980). Bacterial endotoxin: a role in chronic
inflammatory periodontal disease? J Oral Path 9:1-15.
Davies A.N., Brailsford S. & Beighton D. (2006). Oral candidosis in patients with advanced
cancer. Oral Oncol 42(7): 698–7.

69
De Ryck T., Duprez F., Van de Wiele T. & Vanhoeke B. (2015). Dynamic Shifts in the Oral
Microbiome during Radiotheraphy. Clin Res Infect Dis 2(1):1013.
De Sanctisa V., Bossib P., Sanguineti G., Trippad F., Ferrarie D., Bacigalupof A., Ripamonti
C.I., Buglione M., Pergolizzi S., Langendjik J.A., Murphy B.J., Russi E.G. & Lalla R.V.
(2016). Mucositis in head and neck cancer patients treated with radiotherapy and systemic
therapies: Literature review and consensus statements. Crit Rev in Oncol/Hemat 100:147–
166.
Dey N.C & Dey T.K. (1978). Medical Bacteriology, 9th
edition. Allied agency, Calcutta. Pg.
194-195.
Donnelly J.P., Bellm L.A., Epstein J.B., Sonis S.T.& Symonds R.P. (2003). Antimicrobial
therapy to prevent or treat oral mucositis. Lancet Infect. Dis. 3:405–412.
Eilers J. & Million R. (2011). Clinical update: prevention and management of oral mucositis
in patients with cancer. Semin. Oncol. Nurs. 27:e1–e16.
Elting L.S., Bodey G.P. & Keefe B.H. (1992). Septicemia and shock syndrome due to
viridans streptococci: a case-control study of predisposing factors. Clin Infect Dis.
14(6):1201-7.
Epstein J.B., Chin E.A., Jacobson J.J., Rishiraj B. & Le N. (1998). The relationships among
fluoride, cariogenic oral flora, and salivary flow rate during radiation therapy. Oral Surg Oral
Med Oral Pathol Oral Radiol Endod. 86:286–92.

70
Fainstein V., Rodriguez V., Turck M., Herman G., Rosenbaum B. & Bodey G.P. (1981).
Patterns of oropharyngeal and fecal flora in patients with acute leukemia. J Infect Dis
144(1):10-8.
FDA (2012). Guidance for Industry Pyrogen and Endotoxins Testing: Questions and
Answers, U.S. Department of Health and Human Services Food and Drug Administration:
Betheseda, MD, USA.
Ferretti G.A., Raybould T.P., Brown A.T., Macdonald J.S., Greenwood M., Maruyama
Y., Geil J., Lillich T.T. & Ash R.C. (1990). Chlorhexidine prophylaxis for chemotherapy and
radiotherapy-induced stomatitis: a randomized double-blind trial. Oral Surg Oral Med Oral
Pathol 69:331-338.
Franzén L., Funegård U., Ericson T. & Henriksson R. (1992). Parotid gland function during
and following radiotherapy of malignancies in the head and neck. A consecutive study of
salivary flow and patient discomfort. Eur J Cancer .28(2-3):457-62.
Fry D. (2013). Surgical infections, J.P. Medical Ltd, London. Pg. 4-5.
Gaetti-Jardim E.J., Ciesielski F.I.N., Nunes de Sousa F.R., Nwaokorie F., Schweitzer C.M. &
Avila-Camp M.J. (2011). Occurrence of Yeasts, Pseudomonads and Enteric bacteria in the
Oral Cavity of Patients Undergoing Head and Neck Radiotherapy. Br J Microbiol 42:1047-
1055.
Galili D., Donitza A., Garfunkel A. & Sela M.N. (1992). Gram negative enteric bacteria in
the oral cavity of leukemia patients. Oral Surgery, Oral Medicine, and Oral Pathology 74(4):
459-462.

71
GLOBOCAN 2012 v1.0, Cancer Incidence and Mortality Worldwide: IARC Cancer Base
No. 11. Lyon, France: International Agency for Research on Cancer. 2013.
Goto H. & Nakamura S. (1980). Liberation of endotoxin from Escherichia coli by addition of
antibiotics. Japanese J Experiment Med 50:35-53.
Grehn M. (1980). Endotoxins of gram-negative anaerobic bacteria. Infect 8 Suppl 2:S138-9.
Gudiol C., Bodro M., Simonetti A., Tubau F., González-Barca E., Cisnal M., Domingo-
Domenech E., Jiménez L. & Carratalà J. (2013). Changing aetiology, clinical features,
antimicrobial resistance and outcomes of bloodstream infection in neutropenic cancer
patients. Clin Microbiol Infect 19(5):474-479.
Gupta N., Pal M., Rawat S., Grewal M.S., Garg H., Chauhan D., Ahlawat P., Tandon S.,
Khurana R., Pahuja A.K., Mayank M. & Devnan B. (2015). Radiation-induced dental caries,
prevention and treatment - A systematic review. Natl J Maxillofac Surg. 6(2): 160–166.
Hachem R., Hanna H., Kontoyiannis D., Jiang Y. & Raad I. (2008). The changing
epidemiology of invasive candidiasis: Candida glabrata and Candida krusei as the leading
causes of candidemia in hematologic malignancy. Cancer 112(11): 2493–2499.
Hofstad T. & Sveen K. 1979. Endotoxins of anaerobic gram-negative rods. Scand. J. Infect.
Dis. Suppl. 19:42–45.
Hu Y.J., Shao Z.Y., Wang Q., Jiang Y.T., Ma R., Tang Z.S., Liu Z., Liang J.P. & Huang
Z.W. (2013). Exploring the Dynamic Core Microbiome of Plaque Microbiota during Head-
and-Neck Radiotherapy Using Pyrosequencing. PLoS ONE 8(2): e56343.

72
Jackson M.S., Bagg J., Gupta M.N. & Sturrock R.D. (1999). Oral carriage of staphylococci in
patients with rheumatoid arthritis. Rheumatology (Oxford) 38(6):572-5.
Jemal A., Bray F., Center M.M., Ferlay J., Ward E. & Forman D. (2010). Global cancer
statistics. CA Cancer J Clin 61:69-90.
Jham B.C. & Freire A.R.D.S. (2006). Oral complications of radiotherapy in the head and
neck. Rev Bras Otorrinolaringol 72(5):704-708.
Johne B. & Bryn K. (1986). Chemical composition and biological properties of a
lipopolysaccharide from Bacteroides intermedius, Acta Path. Microbiol. Immunol. Scand.
Sect. B, 94, 265.
Joiner M. & van der Kogel A. (2009). Basic clinical radiobiology, 4th
edition. Edward Arnold
Ltd, London. Pg. 1-258.
Jubelirer S.J. (2011). The Benefit of the Neutropenic Diet: Fact or Fiction? The Oncologist
16:704–707.
Kasettya S., Khana S., Shridhara S.U., Guptaa S., Tijarea M., Kallianpura S. & Ragavendra
R.T. (2012). Cancer Therapy: A Continuance of Health Burden. World J Oncol. 3(5):205-
209.
Kasper D. L. (1976). Chemical and biological characterization of lipopolysaccharide of
Bacreroides fragilis- subspecies fragilis. J Infec Dis 134:59 -66.
Keene H.J. & Fleming T.J. (1987). Prevalence of caries-associated microflora after
radiotherapy in patients . J Dent Res 66:693–8.

73
Khan N.R. & Khan A.N. (2015). Insight in to Squamous Cell Carcinoma of Head and Neck
Region: Current Statistics. J Dent App 2(6): 232-239.
Kielbassa A.M., Hinkelbein W., Hellwig E. & Meyer-Lückel H. (2006). Radiation-related
damage to dentition. Lancet Oncol. 7:326–35.
Khaw A., Logan R., Keefe D. & Bartold M. (2014). Radiation-induced oral mucositis and
periodontitis - proposal for an inter-relationship. Oral Dis. 20(3):e7-18.
Koga T., Nishihara T., Fujiwara T., Nisizawa T., Okahashi N., Noguchi T. & Hamada S.
(1985). Biochemical and Immunobiological Properties of Lipopolysaccharide (LPS) from
Bacteroides gingivalis and Comparison with LPS from Escherichia coli. Inf Immun
47(3):638-647.
Köstler W.J., Hejna M., Wenzel C. & Zielinski C.C. (2001). Chemotherapy and/or
Radiotherapy: Options for Prevention and Treatment. CA Cancer J Clin 51:290-315.
Kouloulias V., Thalassinou S. Platoni K., Zygogianni A., Kouvaris J., Antypas C.,
Efstathopoulos E & Nikolaos K. (2013). The Treatment Outcome and Radiation-Induced
Toxicity for Patients with Head and Neck Carcinoma in the IMRT Era: A Systematic Review
with Dosimetric and Clinical Parameters. Biomed Res Int. 2013:1-12.
Krcmery V. & Barnes A.J. (2002). Non-albicans Candida spp. causing fungaemia:
pathogenicity and antifungal resistance. J Hosp Infect. 50(4):243-60.
Laheij A.M.G.A., de Soet J.J., von dem Borne P.A., Kuijper E.J., Kraneveld E.A.,
van Loveren C. & Raber-Durlacher J. (2012). Oral bacteria and yeasts in relationship to oral
ulcerations in hematopoietic stem cell transplant recipients. Supp Care in Cancer
20(12):3231–3240.
Lalla R.V., Sonis S.T. & . Peterson D.E. (2008). Management of Oral Mucositis in Patients
with Cancer. Dent Clin North Am. 52(1):61–77.

74
Leenstra T.S., van Saene J.J.M., van Saene H.K.F. & Martin M.V. (1996). Oral endotoxin in
healthy adults. Oral Surg Oral Med Oral Pathol Oral Radiol Endod 82:637-43.
Limulus Amebocyte Chromogenic Endpoint Assay: Test for endotoxin detection- Product
information and manual. Manual HIT302 Edition 04-13 www.hycultbiotech.com
Lopez C., Carmen G. & Gracia S. (2011). Dental Treatment consideration in chemotherapy
patient. J Clin Exp Den 3(1):31-42.
Lovegrove J.M. (2004). Dental plaque revisited: bacteria associated with periodontal disease.
J N Z Soc Periodontol. (87):7-21.
Lundin J.I. & Checkoway H. (2009). Endotoxin and Cancer. Envir Health Perspec
117(9):1344-1350.
Mackowiak P.A., Martin R.M. & Smith J.W. (1979). Role of bacterial interference in the
increased prevalence of oropharyngeal Gram-negative bacilli among alcoholics and diabetics.
Amer Rev Respir Dis 120:589-593.
Main B.E., Calman K.C., Ferguson M.M., Kaye S.B., MacFarlane T.W., Mairs, R.J.
Samaranayake L.P., Willox J., Welsh J. (1984). The effect of cytotoxic therapy on saliva and
oral flora. Oral Surg. 58:545–548.
McGaw W.T. & Belch A. (1985). Oral complications of acute leukemia: prophylactic impact
of a chlorhexidine mouth rinse regimen. Oral Surg Oral Med Oral Pathol 60(3):275–80.
Meurman J.H., Pyrhönen S., Teerenhovi L. & Lindqvist, C. (1997). Oral sources of
septicaemia in patients with malignancies. Oral Oncol. 33:389–397.

75
Meurman J.H. & Grönroos L. (2010). Oral and dental health care of oral cancer patients:
hyposalivation, caries and infections. Oral Oncol. 46(6):464-7.
Millns B., Martin M.V. and Williams M.C. (1999). Raised salivary endotoxin concentration
as a predictor of infection in pediatric leukemia patients. Oral Surg Oral Med Oral Pathol
Oral Radiol Endod 88:50-5.
Minah G.E., Rednor J.L., Peterson D.E. & J B Suzuki J.B. (1986). Oral succession of Gram
negative bacilli in myelosuppressed cancer patients. J Clin Micro 24(2):210-3.
Naidu M.U.R, Ramana G.V., Rani P.U., Mohan I.K., Suman A. & Roy P. (2004).
Chemotherapy-Induced and/or Radiation Therapy-Induced Oral Mucositis-Complicating the
Treatment of Cancer. Neoplasia 6(5):423-431.
Napeñas J.J., Brennan M.T., Bahrani-Mougeot F.K., Fox P.C. & Lockhart P.B. (2007).
Relationshipbetween mucositis and changes in oral microflora during cancer chemotherapy.
Oral Surg Oral Med Oral Pathol Oral Radiol Endod. 103(1):48-59.
O'Brien P.J & Bruce W.R. (2010). Endogenous Toxins: Diet, Genetics, Disease and
Treatment, Volume 1. Wiley-VCH Verlag GmbH & Co. KgaA, Weinheim. Pg. 485-901.
O'Sullivan E.A., Duggal M.S., Bailey C.C., Curzon M.E. & Hart P. (1993). Changes in the
oral microflora during cytotoxic chemotherapy in children being treated for acute leukemia.
Oral Surg Oral Med Oral Pathol. 76(2):161-8.
Pai S.A. & Westra W.H. (2009). Molecular Pathology of Head and Neck Cancer:
Implications for Diagnosis, Prognosis, and Treatment for Diagnosis, Prognosis, and
Treatment. Annu Rev Pathol. 4:49-70.

76
Panghal M., Kaushal V., Kadayan S. & Yadav J.P. (2012). Incidence and risk factors for
infection in oral cancer patients undergoing different treatments protocols. BMC Oral Health
12(22):1-12.
Payne S. & Miles D. (2008). Scott-Brown’s Otorhinolaryngology: Head and Neck Surgery,
7th
edition. Edward Arnold Ltd, London. Pg. 34-46.
Pendersen A.M.L. (2016). Oral Infections and general health: From molecule to chairside.
Springer International Publishing, Switzerland. Pg. 79-96.
Peterson D.E., Minah G.E., Overholser C.D., Suzuki J.B., DePaola L.G., Stansbury D.M.,
Williams L.T. & Schimpff S.C. (1987). Microbiology of acute periodontal infection in
myelosuppressed cancer patients. J Clin Oncol 5:1461–1468.
Peterson D.E., Minah G.E., Reynolds M.A., Weikel D.S., Overholser C.D., DePaola
L.G., Wade J.C. & Suzuki J.B. (1990). Effect of granulocytopenia on oral microbial
relationships in patients with acute leukemia. Oral Surg Oral Med Oral Pathol. 70(6):720-3.
Peterson J.W. (1996). Bacterial Pathogenesis. In: Baron S, editor. Medical Microbiology. 4th
edition. Galveston (TX): University of Texas Medical Branch at Galveston; Chapter 7.
Pfaller
M.A. & Diekema D.J. (2012). Progress in Antifungal Susceptibility Testing
of Candida spp. by Use of Clinical and Laboratory Standards Institute Broth Microdilution
Methods, 2010 to 2012. J Clin Microbiol. 50(9):2846–2856.
Plummer M., de Martel C., Vignat J., Ferlay J., Bray F. & Franceschi S. (2016). Global
burden of cancers attributable to infections in 2012: a synthetic analysis. Lancet Glob Health
2016 4: e609–16.

77
Raber-Durlacher J.E., Laheij A.M.G.A., Epstein J.B., Epstein M., Geerligs G.M., Wolffe
G.N., Blijlevens N.M.A. & Donnelly J.P. (2013). Periodontal status and bacteremia with oral
viridans streptococci and coagulase negative staphylococci in allogeneic hematopoietic stem
cell transplantation recipients: a prospective observational study. Supp Care Can 21(6):1621-
1627.
Ramachandran G. (2014). Gram-positive and gram-negative bacterial toxins in sepsis. Virul
5(1):213-218.
Ramirez-Amador V., Silverman S. Jr., Mayer P., Tyler M. & Quivey J. (1997). Candidal
colonization and oral candidiasis in patients undergoing oral and pharyngeal radiation
therapy. Oral Surg Oral Med Oral Pathol Oral Radiol Endod. 84(2):149-53.
Ramla S., Sharma V. & Patel M. (2016). Influence of cancer treatment on the Candida
albicans isolated from the oral cavities of cancer patients. Support Care Cancer 24(6):2429-
36.
Redding S.W., Zellars R.C., Kirkpatrick W.R., McAtee R.K., Caceres M.A., Fothergill
A.W., Lopez-Ribot J.L., Bailey C.W., Rinaldi M.G. & Patterson T.F. (1999). Epidemiology
of Oropharyngeal Candida Colonization and Infection in Patients Receiving Radiation for
Head and Neck Cancer. J Clin Microbiol. 37(12): 3896–3900.
Redding S.W. (2005). Cancer therapy-related oral mucositis. J Dent Educ. 69(8):919-29.
Renard K.W., Marling-Cason M., Sheehan R.G. & Mackowiak P.A. (1986). Effects of
cancer chemotherapy on the human aerobic oropharyngeal flora. Infection. 14(5):237-242.

78
Renom F., Gomila M., Garau M., Gallegos M.dC., Guerrero D., Lalucat J. and Soriano J.B.
(2014). Respiratory infection by Corynebacterium striatum: epidemiological and clinical
determinants. New Microbes New Infect 2(4):106–114.
Safdar A., Chaturvedi V., Cross E.W., Park S., Bernard E.M., Armstrong D. & Peerlin D.S.,
(2001). Prospective study of Candida species in patients at a comprehensive cancer center.
Antimicrob Agents Chemother 45:2129-2133.
Sak K. (2012). Chemotherapy and Dietary Phytochemical Agents. Chemo Research in
Practice 2012:1-11.
Samaranayake L.P., Calman K.C., Ferguson M.M., Kaye S.B., MacFarlane T.W., Main B.,
Welsh J. & Willox J. (1984). The oral carriage of yeasts and coliforms in patients on
cytotoxic therapy. J Oral Pathol Med 13(4):390-393.
Shenep J.L. & Mogan KA. (1984). Kinetics of endotoxin release during antibiotic therapy for
experimental gram-negative bacterial sepsis. J Infect Dis 50:380-8.
Shenep J.L., Barton R.P. and Mogan K.A. (1985). Role of antibiotic class in the rate of
liberation of endotoxin during therapy for experimental gram-negative bacterial sepsis. J
Infect Dis 151:6:1012-8.
Sonalika W.G., Tayaar S.A., Bhat K.G., Patil B.R. & Muddapur M.V. (2012). Oral microbial
carriage in oral squamous cell carcinoma patients at the time of diagnosis and during
radiotherapy-A comparative study. Oral Oncol 48:881-6.
Sano H., Kobayashi R., Iguchi A., Suzuki D., Kishimoto K., Yasuda K. & Kobayashi K.
(2015). Risk factors for sepsis-related death in children and adolescents with hematologic and
malignant diseases. J Micro, Immonol and Inf xx: 1-7
http://dx.doi.org/10.1016/j.jmii.2015.04.002

79
Sartorius K., Sartorius B., Govender P.S., Sharma V. & Sheriff A. (2016). The future cost of
cancer in South Africa: An interdisciplinary cost management strategy. S Afr Med J
106(10):949-950.
Saunders D.P., Epstein B.J., Elad S., Allemano J., Bossi P., van de Wetering M.D., Rao G.,
Potting C., Cheng K.K., Freidank A., Brennan M.T., Bowen J. & Dennis K., Lalla R.V.
(2013). Systematic review of antimicrobials, mucosal coating agents, anesthetics, and
analgesics for the management of oral mucositis in cancer patients. Supp Care Can 21:3191–
3207.
Schelenz S., Abdallah S., Abdallah S. Gray G., Stubbings H., Gow I., Baker P. & Hunter P.R.
(2011). Epidemiology of oral yeast colonization and infection in patients with hematological
malignancies, head neck and solid tumors. J Oral Pathol Med 40:83–89.
Schoenfeld J.D. (2015). Immunity in Head and Neck Cancer. Canr Immunol Res. 3(1):12-17.
Sixou J.L. De Medeiros-Batista O., Gandemer V. & Bonnaure-Mallet M. (1998). The effect
of chemotherapy on the supragingival plaque of pediatric cancer patients. Oral
Oncol. 34:476–483.
Smith A.J, Jackson M.S. & Bagg J. (2001). The ecology of Staphylococcus species in the oral
cavity. J.Med Microbiol. 50:940-946.
Soares A.F., de Aquino A.R.L., de Carvalho C.H.P., Nonaka C.F.W., Almeida D. & Pinto
L.P. (2011). Frequency of Oral Mucositis and Microbiological Analysis in Children with
Acute Lymphoblastic Leukemia Treated with 0.12% Chlorhexidine Gluconate. Braz Dent J
22(4):312-316.

80
Sonis S.T., Elting L.S., Keefe D., Peterson D.E., Schubert M., Hauer-Jensen M., Bekele N.,
Raber-Durlacher J., Donnelly J.P. & Rubenstein E.B. (2004). Perspectives on Cancer
Therapy-Induced Mucosal Injury: Pathogenesis, Measurement, Epidemiology, and
Consequences for Patients. CANCER Supplement 100(9): 1995-2025.
Spijkervet F.K.L., Van Saene H.K.F., Panders A.K., Vermey A., Van Saene J.J.M., Mehta
D.M. and Fidler V. (1989c). Effect of chlorhexidine rinsing on the oropharyngeal ecology in
patients with head and neck cancer who have irradiation mucositis. Oral Surg Oral Med Oral
Pathol. 67:154–161.
Spijkervet F.K., van Saene H.K., van Saene J.J., Panders A.K., Vermey A. & Mehta D.M.,
(1990). Mucositis prevention by selective elimination of oral flora inirradiated head and neck
cancer patients. J. Oral. Pathol. Med. 19:486–489.
Stefan D.C., Elzawawy A.M., Khaled H.M., , Ntaganda F., Asiimwe A., Addai B.W., Wiafe
S. & Adewole I.F. (2013). Developing cancer control plans in Africa: Examples from five
countries. Lancet Oncol 2013;14(4):e189-e195.
Stokman M.A., Spijkervet F.K.L, Burlage F.R., Dijkstra P.U., Manson W.L., de Vries E.G.E.
& Roodenburg J.L.N. (2003). Oral mucositis and selective elimination of oral flora in head
and neck cancer patients receiving radiotherapy: a double-blind randomised clinical trial. Brit
J Cancer 88:1012 –1016.
Su N., Marek C. L., Ching V., & Grushka M. (2011). Caries prevention for patients with dry
mouth. J Canad Dent Ass 77(b85):1-8.

81
Sveen K., Hofstad T., & Milner K.C. (1977). Lethality for mice and chick embryos,
pyrogenicity in rabbits, and ability to gelate lysate from amoebocytes from Limulus
polyphemus by lipopolysaccharides from Bacteroides, Fusobacterium and Veillonella. Acta
Pathologica et Microbiologica Scandinavica Section B 85:388-396
Todar K., Mechanisms of bacterial pathogenicity: Endotoxins. (2002). University of
Wisconsin-Madison Department of Bacteriology, Online text book of Bacteriology.
Various grades of oral mucositis: Adapted from
http://www.prothelial.com/oral_mucositis/index.html
Vozza I., Caldarazzo V. & Ottolenghi L. (2015). Changes in microflora in dental plaque from
cancer patients undergoing chemotherapy and the relationship of these changes with
mucositis: A pilot study. Med Oral Patol Oral Cir Bucal 20(3):e259-66.
Wahlin, Y.B. & Holm A.K. (1988). Changes in the oral microflora in patients with acute
leukemia and related disorders during the period of induction therapy. Oral Surg Oral Med
Oral Pathol. 65:411–417.
Wahlin Y.B. (1989). Effects of chlorhexidine mouthrinse on oral health in patients with acute
leukemia. Oral Surg Oral Med Oral Pathol 68:279-287.
Wahlin Y.B., Granstrom S., Persson S. & Sjostrom M. (1991). Multivariate study of
enterobacteria and Pseudomonas in saliva of patients with acute leukemia. Oral Surgery Oral
Medicine Oral Pathology 72:300-308.
Weisdorf D.J., Bostrom B., Raether D., Mattingly M., Walker P., Pihlstrom B., Ferrieri P.,
Haake R., Goldman A. & Woods W. (1989). Oropharyngeal mucositis complicating bone
marrow transplantation: prognostic factors and the effect of chlorhexidine mouth rinse. Bone
Marrow Transplant 4:89-95.

82
Wijers O.B., Levendag P.C., Harms E.E., Gan-Teng A.M., Schmitz P.I.M., Hendriks
W.D.H., Wilms E.B. Van der Est H. & Visch L.L. (2001). Mucositis reduction by selective
elimination of oral flora in irradiated cancers of the head and neck: a placebo controlled
double blind randomized study. Int. J. Radiation Oncology Biol. Phys. 50(2):343-352.
World Health Organization. (WHO, 1979). Handbook for reporting results of cancer
treatment. Geneva: WHO; 1979. Pg. 15-22.
Yau Y.H, Ho B., Tan N.S., Ng M.L, & Ding J.L. (2001). High Therapeutic Index of Factor
C Sushi Peptides: Potent Antimicrobials against Pseudomonas aeruginosa. Antimicrob.
Agents Chemother 45(10):2820-2825.
Yoneda S., Imai S., Hanada N., Yamazaki T., Senpuku H., Ota Y. & Uematsu H. (2007).
Effects of oral care on the development of oral mucositis and microorganisms in patients with
Esophageal Cancer. Jpn J infect Dis 60:23-28.

83
CHAPTER 7
APPENDICES
Appendix A: Data collection sheets
Data Collection sheet – Cancer patients
Laboratory no. Age: Male: Female:
Type of Cancer: ____________________________
Type of Treatment: Chemotherapy and Radiation/ Chemotherapy
Length of treatment: ____________________________________________
Present Stage of treatment (weeks): ________________________________
Name of Chemotherapy Drugs: ____________________________________
Nausea and vomiting: Yes No
HIV status: positive Negative unknown
Diabetes: Yes No
Other medical conditions: ________________________________________
Smoker: Yes No
Dentures: Yes No
Antimicrobials: Yes No
Other medication: Yes No
Oral exam: Oral Mucositis: Yes No
Bleeding ulcers: Yes No
Degree of Pain: Mild Moderate Severe
Loss of appetite: Yes No
Difficulty to swallow: Yes No
Altered taste: Yes No
Grade of Oral Mucositis: 0 1 2 3 4
Oral Hygiene: Halitosis Yes No
Plaque: Yes No
Swollen gums: Yes No
Periodontitis: Yes No
Dry mouth: Yes No
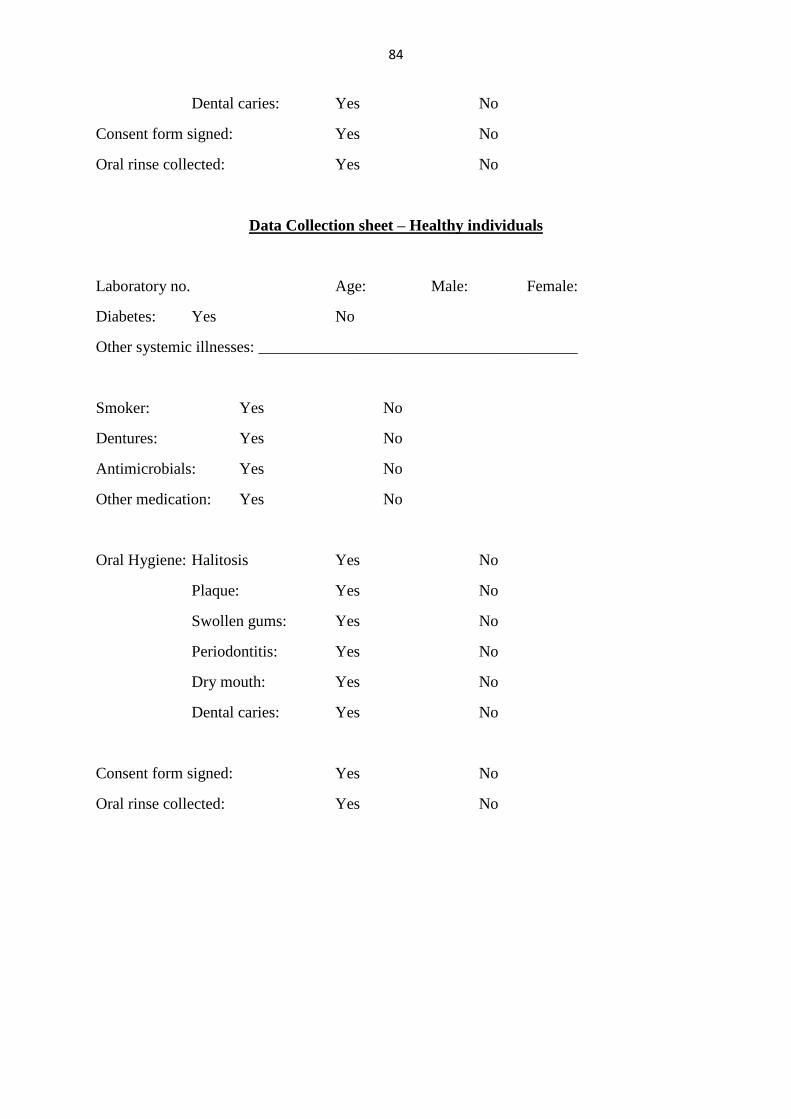
84
Dental caries: Yes No
Consent form signed: Yes No
Oral rinse collected: Yes No
Data Collection sheet – Healthy individuals
Laboratory no. Age: Male: Female:
Diabetes: Yes No
Other systemic illnesses: ________________________________________
Smoker: Yes No
Dentures: Yes No
Antimicrobials: Yes No
Other medication: Yes No
Oral Hygiene: Halitosis Yes No
Plaque: Yes No
Swollen gums: Yes No
Periodontitis: Yes No
Dry mouth: Yes No
Dental caries: Yes No
Consent form signed: Yes No
Oral rinse collected: Yes No

85
Appendix B: Consent form
University of the Witwatersrand, Faculty of Health Sciences, Johannesburg
Consent form
Good Day,
How are you? I am Dr Juliana Mathews from the Oral Microbiology at the Wits Dental
School. My colleagues and I are doing a study on germs that are found in our mouth. These
germs cause painful sores in our mouth especially in cancer patients who are under treatment.
These germs are bacteria and fungi and sometimes patients have to take tablets and
mouthwashes to cure it. Sometimes these medicines do not help to cure the sores in our
mouth. We would like to study these germs and the study will show us how powerful they are
in causing sores and whether the treatment will work or not.
In order to do this study, I will check your mouth to see if you have these sores and how
severe these sores are. We would like to collect a sample of oral rinse from your mouth. This
will not cause any pain or discomfort. All you have to do is take this clean sterile water, put it
in your mouth, rinse and collect it back into the jar given to you. It will not cause any harm.
The sample will be processed at a laboratory. I may need to look at your medical records to
see what cancer treatment you are on and how long you have been receiving it.
You may or may not participate and it is entirely up to you. What you decide will not affect
your treatment. If you agree to participate, you may withdraw from the study at any time
without affecting your treatment. The sample will be collected once only during your normal
visit. If we find germs that cause sores in your mouth, your doctor will be notified. He will
advise you on how to look after your mouth so that you don’t get sores. We will also know if
you have developed resistance to the medicines used to treat the sores in South Africa or not
and everybody will benefit from the knowledge.
Your sample will be given a number and will be processed under a number. Your name will
not appear anywhere on the results or on any publications. This study has been approved by
the University Ethics Committee. Should you have any problems or queries with regards to
ethics of this study, please contact Prof. P. Cleaton-Jones at 011 717 2301.
If you are 18 years old or older, not diabetic (sugar-disease), do not smoke, do not wear any
false teeth, are not taking antibiotics and are already on cancer treatment for at least two
weeks, you may take part in the study.
Patient’s name: Investigator’s name:
Signature: Signature:
Contact: Dr Juliana Mathews: cell no 083 799 2665, Prof M. Patel 011 717 2110

86
Appendix C: Ethics clearance certificate

87
Appendix D: Composition and preparation of Media
Mitis Salivarius Agar
90g Mitis Salivarius Agar
1000ml Sterile distilled water
0.25ml Potassium tellurite solution
Weigh 90g of Mitis Salivarius Agar. Suspend in 1000ml of sterilised distilled water. Boil
to dissolve. Dispense medium into 250ml Boston bottles. Sterilize at 15 lb, 121 ºC for 15
minutes in an autoclave. Cool the media to 50-55 ºC. Add 0.25ml Potassium tellurite
solution, mix and pour plates.
Chromagar Plates
47.7 g Chromagar™Agar
1000 ml Sterile distilled water
Weigh 47.7g of Chromagar™ Agar. Dissolve this into one litre of sterile distilled water.
Boil the media, with the temperature not being greater than 100ºC. Cool the media until it
reaches about 45ºC-50ºC and pour plates.
Sabouraud Agar
65g Sabouraud agar
1000 ml Distilled water
Suspend Sabouraud agar in half the distilled water. Heat half the water to boiling point.
Mix the two and heat to boiling point. Pour into large bottles and sterilize at 15lb, 121oC
for 15 minutes in an autoclave. Cool at 45oC and pour plates.
Phosphate Buffered Saline (PBS)
4.2 g Sodium chloride
0.078 g Sodium dihydrogen phosphate
0.64 g Sodium hydrogen phosphate
500 ml Distilled water

88
Suspend the solids and then autoclave at 15 lb, 121oC for 15 minutes and dispense.
MacConkey Agar
50.0 g medium
1000ml distilled water
Heat half the water to boiling point
Dissolve the powder in rest of the water and add to the boiling water. Pour into larger
bottles to sterilize at 15 1bs for 15 min in autoclave, cool at 45oC and pour plates.
Mueller Hinton Agar
2.0 g Beef extract
17.5 g Acid hydrolysate of casein
1.5 g Starch
17 g Agar
1000 ml Distilled water
Dissolve solids into distilled water, boil, adjust pH to 7.3, autoclave at 121oC, 15 lb for 15
minutes. Cool to 45oC and pour plates.
Baird Parker Agar
12.0g Glycine
10.0g Pancreatic Digest of Casein
10.0g Sodium Pyruvate
5.0g Beef Extract
5.0g Lithium Chloride
1.0g Yeast Extract
60.0ml Egg Yolk Tellurite Enrichment
20.0g Agar
Final pH 7.0 +/- 0.2 at 25ºC.
* Adjusted and/or supplemented as required to meet performance criteria.
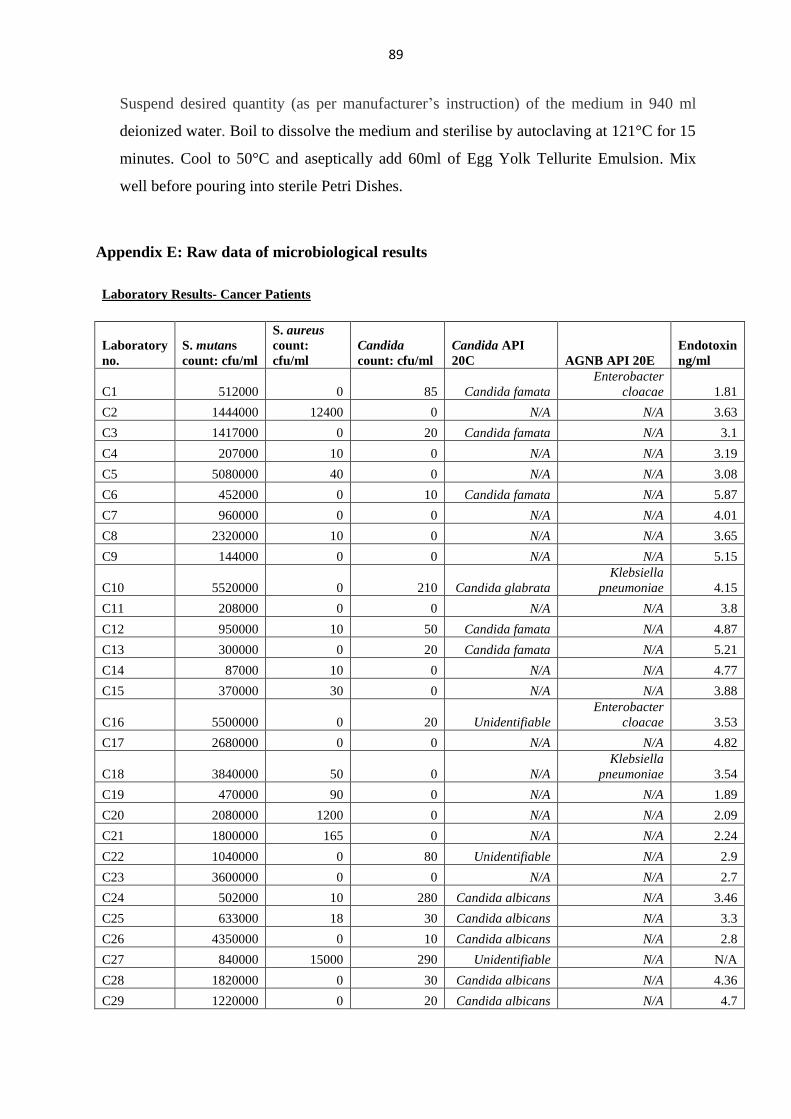
89
Suspend desired quantity (as per manufacturer’s instruction) of the medium in 940 ml
deionized water. Boil to dissolve the medium and sterilise by autoclaving at 121°C for 15
minutes. Cool to 50°C and aseptically add 60ml of Egg Yolk Tellurite Emulsion. Mix
well before pouring into sterile Petri Dishes.
Appendix E: Raw data of microbiological results
Laboratory Results- Cancer Patients
Laboratory
no.
S. mutans
count: cfu/ml
S. aureus
count:
cfu/ml
Candida
count: cfu/ml
Candida API
20C AGNB API 20E
Endotoxin
ng/ml
C1 512000 0 85 Candida famata
Enterobacter
cloacae 1.81
C2 1444000 12400 0 N/A N/A 3.63
C3 1417000 0 20 Candida famata N/A 3.1
C4 207000 10 0 N/A N/A 3.19
C5 5080000 40 0 N/A N/A 3.08
C6 452000 0 10 Candida famata N/A 5.87
C7 960000 0 0 N/A N/A 4.01
C8 2320000 10 0 N/A N/A 3.65
C9 144000 0 0 N/A N/A 5.15
C10 5520000 0 210 Candida glabrata
Klebsiella
pneumoniae 4.15
C11 208000 0 0 N/A N/A 3.8
C12 950000 10 50 Candida famata N/A 4.87
C13 300000 0 20 Candida famata N/A 5.21
C14 87000 10 0 N/A N/A 4.77
C15 370000 30 0 N/A N/A 3.88
C16 5500000 0 20 Unidentifiable
Enterobacter
cloacae 3.53
C17 2680000 0 0 N/A N/A 4.82
C18 3840000 50 0 N/A
Klebsiella
pneumoniae 3.54
C19 470000 90 0 N/A N/A 1.89
C20 2080000 1200 0 N/A N/A 2.09
C21 1800000 165 0 N/A N/A 2.24
C22 1040000 0 80 Unidentifiable N/A 2.9
C23 3600000 0 0 N/A N/A 2.7
C24 502000 10 280 Candida albicans N/A 3.46
C25 633000 18 30 Candida albicans N/A 3.3
C26 4350000 0 10 Candida albicans N/A 2.8
C27 840000 15000 290 Unidentifiable N/A N/A
C28 1820000 0 30 Candida albicans N/A 4.36
C29 1220000 0 20 Candida albicans N/A 4.7
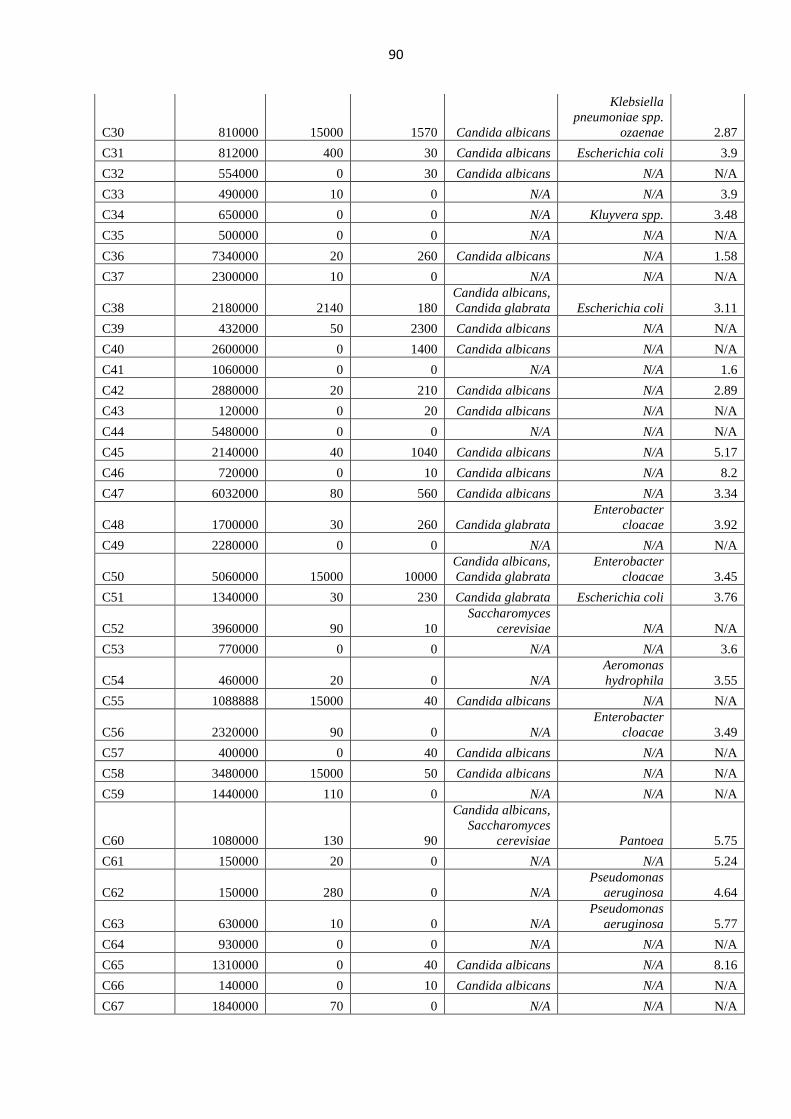
90
C30 810000 15000 1570 Candida albicans
Klebsiella
pneumoniae spp.
ozaenae 2.87
C31 812000 400 30 Candida albicans Escherichia coli 3.9
C32 554000 0 30 Candida albicans N/A N/A
C33 490000 10 0 N/A N/A 3.9
C34 650000 0 0 N/A Kluyvera spp. 3.48
C35 500000 0 0 N/A N/A N/A
C36 7340000 20 260 Candida albicans N/A 1.58
C37 2300000 10 0 N/A N/A N/A
C38 2180000 2140 180
Candida albicans,
Candida glabrata Escherichia coli 3.11
C39 432000 50 2300 Candida albicans N/A N/A
C40 2600000 0 1400 Candida albicans N/A N/A
C41 1060000 0 0 N/A N/A 1.6
C42 2880000 20 210 Candida albicans N/A 2.89
C43 120000 0 20 Candida albicans N/A N/A
C44 5480000 0 0 N/A N/A N/A
C45 2140000 40 1040 Candida albicans N/A 5.17
C46 720000 0 10 Candida albicans N/A 8.2
C47 6032000 80 560 Candida albicans N/A 3.34
C48 1700000 30 260 Candida glabrata
Enterobacter
cloacae 3.92
C49 2280000 0 0 N/A N/A N/A
C50 5060000 15000 10000
Candida albicans,
Candida glabrata
Enterobacter
cloacae 3.45
C51 1340000 30 230 Candida glabrata Escherichia coli 3.76
C52 3960000 90 10
Saccharomyces
cerevisiae N/A N/A
C53 770000 0 0 N/A N/A 3.6
C54 460000 20 0 N/A
Aeromonas
hydrophila 3.55
C55 1088888 15000 40 Candida albicans N/A N/A
C56 2320000 90 0 N/A
Enterobacter
cloacae 3.49
C57 400000 0 40 Candida albicans N/A N/A
C58 3480000 15000 50 Candida albicans N/A N/A
C59 1440000 110 0 N/A N/A N/A
C60 1080000 130 90
Candida albicans,
Saccharomyces
cerevisiae Pantoea 5.75
C61 150000 20 0 N/A N/A 5.24
C62 150000 280 0 N/A
Pseudomonas
aeruginosa 4.64
C63 630000 10 0 N/A
Pseudomonas
aeruginosa 5.77
C64 930000 0 0 N/A N/A N/A
C65 1310000 0 40 Candida albicans N/A 8.16
C66 140000 0 10 Candida albicans N/A N/A
C67 1840000 70 0 N/A N/A N/A

91
C68 440000 0 0 N/A N/A N/A
C69 9520000 730 0 N/A N/A 1.89
C70 1420000 0 3840 Candida albicans Escherichia coli 1.35
C71 1140000 10 3700
Candida albicans,
Candida glabrata
Pseudomonas
aeruginosa 4.48
C72 16720000 190 0 N/A N/A N/A
C73 24880000 130 1880 Candida albicans N/A N/A
C74 1820000 0 0 N/A N/A N/A
C75 960000 0 60 Candida albicans N/A 4.01
C76 2640000 0 0 N/A N/A N/A
C77 172000 0 20 Candida albicans N/A N/A
C78 180000 430 400
Candida albicans,
Candida glabrata Pantoea 1.7
C79 360000 0 20 Candida albicans N/A N/A
C80 281000 0 0 N/A N/A 1.77
C81 6360000 0 6770
Candida albicans,
Candida glabrata N/A N/A
C82 2100000 10 0 N/A N/A N/A
C83 515000 10 0 N/A N/A N/A
C84 107000 0 30 Candida albicans N/A N/A
C85 1280000 0 0 N/A N/A N/A
C86 1030000 0 0 N/A Serratia rubidaea 1.66
C87 2540000 30 30 Candida albicans
Enterobacter
cloacae 1.71
C88 2440000 0 50 Candida albicans N/A N/A
C89 860000 0 10 Candida albicans N/A N/A
C90 720000 60 20 Candida albicans
Pasteurella
pneumotropica 3.12
C91 1720000 0 1390
Candida albicans,
Candida glabrata N/A N/A
C92 130000 0 130 Candida albicans N/A N/A
C93 3920000 240 0 N/A Klebsiella oxytoca
C94 1280000 30 70 Candida albicans N/A N/A
C95 1280000 0 0 N/A N/A N/A
C96 3540000 10 180 Candida albicans N/A N/A
C97 4180000 0 20
Saccharomyces
cerevisiae N/A N/A
C98 740000 10 610 Candida albicans Citrobacter koseri 3.18
C99 854000 6240 0 N/A N/A N/A
C100 200000 0 20 Candida albicans N/A N/A

92
Lab Results- Healthy Individuals
Laboratory
no.
S. mutans
count: cfu/ml
S. aureus
count: cfu/ml
Candida
count: cfu/ml
Candida API
20C
AGNB API
20E Endotoxin
H1 1551000 0 0 N/A N/A N/A
H2 1040000 0 50 Candida albicans N/A 5.06
H3 1760000 0 0 N/A N/A 4.9
H4 830000 0 0 N/A N/A 4.65
H5 1440000 0 6000 Candida krusei Klebsiella
pneumoniae N/A
H6 11000 0 0 N/A N/A 4.51
H7 700000 100 10 Candida famata N/A 4.65
H8 253000 0 0 N/A Enterobacter
cloacae N/A
H9 696000 0 0 N/A N/A 3.32
H10 1136000 0 0 N/A Klebsiella
pneumoniae N/A
H11 3560000 0 0 N/A N/A 4.4
H12 150000 0 0 N/A N/A 4.51
H13 2280000 20 0 N/A N/A 4.69
H14 196000 0 0 N/A N/A 4.28
H15 292000 30 0 N/A Klebsiella
oxytoca N/A
H16 180000 10 10 Candida albicans N/A 3.18
H17 24000 0 0 N/A N/A N/A
H18 700000 10 5200 Candida albicans N/A 3
H19 3080000 110 0 N/A N/A 2.89
H20 1500000 0 0 N/A N/A 1.76
H21 1860000 10 0 N/A N/A N/A
H22 0 0 0 N/A N/A 1.92
H23 1200 0 40 Candida albicans N/A 2
H24 176000 0 0 N/A N/A N/A
H25 2000000 0 0 N/A N/A N/A
H26 270000 0 0 N/A N/A N/A
H27 1320000 0 0 N/A N/A N/A
H28 680000 70 0 N/A N/A N/A
H29 1580000 0 40 Candida albicans N/A N/A
H30 1060000 0 0 N/A N/A N/A
H31 570000 0 0 N/A N/A N/A
H32 2000000 90 50 Candida
dubliniesis N/A N/A
H33 1440000 0 0 N/A N/A N/A
H34 490000 0 0 N/A N/A N/A
H35 740000 20 0 N/A N/A N/A
H36 1720000 30 0 N/A N/A N/A
H37 360000 0 10 Candida albicans N/A N/A
H38 124000 0 0 N/A N/A N/A

93
H39 84000 0 0 N/A N/A N/A
H40 2040000 0 0 N/A N/A N/A
H41 560000 0 0 N/A Klebsiella
pneumoniae N/A
H42 900000 20 80 Candida albicans N/A N/A
H43 340000 0 0 N/A Enterobacter
cloacae N/A
H44 140000 30 0 N/A Enterobacter
cloacae N/A
H45 1480000 0 0 N/A N/A N/A
H46 3320000 20 N/A N/A N/A
H47 520000 40 0 N/A N/A N/A
H48 132000 2480 0 N/A N/A N/A
H49 4600000 4700 0 N/A N/A N/A
H50 4200000 10 0 N/A N/A N/A

94
Appendix F: Endotoxin Assay Results
Raw Data{Wavelength:415.0} Reading 1
1 2 3 4 5 6 7 8 9 10 11 12
A 0.601 0.555 0.58 0.572 0.586 0.554 0.535 0.57 0.628 0.637 0.568 0.566
B 0.583 0.549 0.561 0.552 0.573 0.528 0.543 0.523 0.595 0.608 0.552 0.557
C 0.56 0.54 0.555 0.557 0.585 0.544 0.543 0.55 0.532 0.498 0.586 0.541
D 0.526 0.506 0.524 0.551 0.546 0.51 0.533 0.537 0.593 0.619 0.591 0.46
E 0.435 0.43 0.558 0.539 0.566 0.513 0.542 0.54 0.583 0.594 0.598 0.546
F 0.298 0.307 0.566 0.54 0.56 0.546 0.505 0.531 0.588 0.592 0.589 0.565
G 0.232 0.193 0.532 0.538 0.55 0.518 0.513 0.533 0.607 0.595 0.572 0.598
H 0.038 0.04 0.484 0.511 0.521 0.518 0.511 0.515 0.589 0.597 0.564 0.57
Reading 2
1 2 3 4 5 6 7 8 9 10 11 12
A 0.605 0.557 0.582 0.576 0.591 0.556 0.538 0.571 0.635 0.644 0.583 0.589
B 0.587 0.552 0.562 0.555 0.576 0.531 0.544 0.524 0.601 0.615 0.578 0.582
C 0.564 0.544 0.557 0.56 0.585 0.544 0.544 0.551 0.594 0.597 0.613 0.559
D 0.548 0.528 0.533 0.552 0.551 0.524 0.535 0.541 0.597 0.624 0.596 0.46
E 0.52 0.511 0.558 0.54 0.565 0.511 0.543 0.54 0.586 0.597 0.603 0.548
F 0.455 0.451 0.564 0.541 0.561 0.546 0.506 0.531 0.592 0.595 0.592 0.568
G 0.382 0.317 0.531 0.538 0.551 0.519 0.513 0.532 0.61 0.598 0.576 0.6
H 0.037 0.038 0.493 0.51 0.521 0.517 0.522 0.513 0.593 0.601 0.567 0.573
EU Absorbance
0.04 0.382
0.1 0.455
0.26 0.52
0.64 0.548
1.6 0.564
4 0.587
10 0.605
Sample Repeat OD EU EU/sampleng/ml Mean Sample Repeat OD EU EU/sampleng/ml
C71 1 0.582 5.690544 45.52 4.55 4.48 C2 1 0.543 4.573066 36.58 3.66 3.63
2 0.576 5.518625 44.15 4.41 2 0.54 4.487106 35.90 3.59
C75 1 0.562 5.117479 40.94 4.09 4.01 C3 1 0.506 3.512894 28.10 2.81 3.1
2 0.555 4.916905 39.34 3.93 2 0.531 4.229226 33.83 3.38
C7 1 0.557 4.974212 39.79 3.98 4.01 C4 1 0.513 3.713467 29.71 2.97 3.19
2 0.56 5.060172 40.48 4.05 2 0.532 4.25788 34.06 3.41
C8 1 0.533 4.286533 34.29 3.43 3.65 C5 1 0.522 3.971347 31.77 3.18 3.08
2 0.552 4.830946 38.65 3.86 2 0.513 3.713467 29.71 2.97
C11 1 0.558 5.002865 40.02 4.00 3.8 C6 1 0.635 7.209169 57.67 5.77 5.87
2 0.54 4.487106 35.90 3.59 2 0.644 7.467049 59.74 5.97
C15 1 0.564 5.174785 41.40 4.14 3.88 C9 1 0.601 6.234957 49.88 4.99 5.15
2 0.541 4.515759 36.13 3.61 2 0.615 6.636103 53.09 5.31
C24 1 0.531 4.229226 33.83 3.38 3.46 C12 1 0.594 6.034384 48.28 4.83 4.87
2 0.538 4.429799 35.44 3.54 2 0.597 6.120344 48.96 4.90
C26 1 0.493 3.140401 25.12 2.51 2.71 C13 1 0.597 6.120344 48.96 4.90 5.21
2 0.51 3.627507 29.02 2.90 2 0.624 6.893983 55.15 5.52
C28 1 0.591 5.948424 47.59 4.76 4.36 C14 1 0.586 5.805158 46.44 4.64 4.77
2 0.556 4.945559 39.56 3.96 2 0.597 6.120344 48.96 4.90
C33 1 0.576 5.518625 44.15 4.41 3.9 C17 1 0.592 5.977077 47.82 4.78 4.82
2 0.531 4.229226 33.83 3.38 2 0.595 6.063037 48.50 4.85
C10 1 0.585 5.776504 46.21 4.62 4.15 H2 1 0.61 6.492837 51.94 5.19 5.06
2 0.544 4.601719 36.81 3.68 2 0.598 6.148997 49.19 4.92
C16 1 0.551 4.802292 38.42 3.84 3.53 H3 1 0.593 6.005731 48.05 4.80 4.9
2 0.524 4.028653 32.23 3.22 2 0.601 6.234957 49.88 4.99
C18 1 0.565 5.203438 41.63 4.16 3.54 H4 1 0.583 5.719198 45.75 4.58 4.65
2 0.511 3.65616 29.25 2.92 2 0.589 5.891117 47.13 4.71
C31 1 0.561 5.088825 40.71 4.07 3.9 H6 1 0.578 5.575931 44.61 4.46 4.51
2 0.546 4.659026 37.27 3.73 2 0.582 5.690544 45.52 4.55
C34 1 0.551 4.802292 38.42 3.84 3.48 H7 1 0.613 6.578797 52.63 5.26 4.65
2 0.519 3.885387 31.08 3.11 2 0.559 5.031519 40.25 4.03
C38 1 0.521 3.942693 31.54 3.15 3.11 H9 1 0.596 6.091691 48.73 4.87 3.32
2 0.517 3.82808 30.62 3.06 2 0.46 2.194842 17.56 1.76
C48 1 0.538 4.429799 35.44 3.54 3.92 H11 1 0.603 6.292264 50.34 5.03 4.4
2 0.571 5.375358 43.00 4.30 2 0.548 4.716332 37.73 3.77
C50 1 0.544 4.601719 36.81 3.68 3.45 H12 1 0.592 5.977077 47.82 4.78 4.51
2 0.524 4.028653 32.23 3.22 2 0.568 5.289398 42.32 4.23
C51 1 0.544 4.601719 36.81 3.68 3.76 H13 1 0.576 5.518625 44.15 4.41 4.69
2 0.551 4.802292 38.42 3.84 2 0.6 6.206304 49.65 4.97
C54 1 0.535 4.34384 34.75 3.48 3.55 H14 1 0.567 5.260745 42.09 4.21 4.28
2 0.541 4.515759 36.13 3.61 2 0.573 5.432665 43.46 4.35
y = 0.0349x + 0.3834R² = 0.9057
0.3
0.35
0.4
0.45
0.5
0.55
0.6
0.65
0.04 0.1 0.26 0.64 1.6 4 10

95
Raw Data{Wavelength:415.0} Second reading
1 2 3 4 5 6 7 8 9 10 11 12
A 0.658 0.386 0.316 0.323 0.31 0.936 0.571 0.389 0.329 0.328 0.335 0.58
B 0.593 0.334 0.352 0.305 0.295 0.567 0.621 0.395 0.264 0.28 0.34 0.587
C 0.542 0.342 0.314 0.385 0.318 0.324 0.606 0.387 0.297 0.317 0.344 0.583
D 0.577 0.37 0.336 0.394 0.348 0.243 1.062 0.404 0.313 0.304 0.321 0.569
E 0.486 0.406 0.366 0.502 0.329 0.267 0.881 0.478 0.317 0.315 0.293 0.574
F 0.303 0.321 0.421 0.405 0.479 0.388 0.701 0.532 0.308 0.3 0.316 0.313
G 0.099 0.079 0.574 0.379 0.446 0.898 0.844 0.626 0.314 0.305 0.301 0.361
H 0.039 0.043 0.54 0.309 1.044 0.937 1.131 0.84 0.364 0.336 0.33 0.349
Control
OD
0.099
0.303
0.486
0.542
0.577
0.593
0.658
Sample Repeat OD EU EU/sampleng/ml Mean Sample Repeat OD EU EU/sampleng/ml
C1 1 0.316 2.216925 17.7354 1.77354 1.81 C61 1 0.881 8.951132 71.60906 7.160906 5.24
2 0.323 2.300358 18.40286 1.840286 2 0.478 4.147795 33.18236 3.318236
C19 1 0.352 2.646007 21.16806 2.116806 1.89 C62 1 0.701 6.805721 54.44577 5.444577 4.64
2 0.305 2.085816 16.68653 1.668653 2 0.532 4.791418 38.33135 3.833135
C20 1 0.314 2.193087 17.5447 1.75447 2.09 C63 1 0.844 8.510131 68.08105 6.808105 5.77
2 0.385 3.039333 24.31466 2.431466 2 0.626 5.9118 47.2944 4.72944
C21 1 0.336 2.455304 19.64243 1.964243 2.24 C65 1 1.131 11.93087 95.44696 9.544696 8.16
2 0.394 3.146603 25.17282 2.517282 2 0.84 8.462455 67.69964 6.769964
C22 1 0.366 2.812872 22.50298 2.250298 2.9 C69 1 0.329 2.371871 18.97497 1.897497 1.89
2 0.502 4.43385 35.4708 3.54708 2 0.328 2.359952 18.87962 1.887962
C23 1 0.421 3.468415 27.74732 2.774732 2.7 C70 1 0.264 1.597139 12.77712 1.277712 1.35
2 0.405 3.277712 26.22169 2.622169 2 0.28 1.787843 14.30274 1.430274
C25 1 0.574 5.292014 42.33611 4.233611 3.3 C71 1 0.297 1.990465 15.92372 1.592372 1.69
2 0.379 2.967819 23.74255 2.374255 2 0.317 2.228844 17.83075 1.783075
C27 1 0.54 4.88677 39.09416 3.909416 2.8 C78 1 0.313 2.181168 17.44934 1.744934 1.7
2 0.309 2.133492 17.06794 1.706794 2 0.304 2.073897 16.59118 1.659118
C29 1 0.31 2.145411 17.16329 1.716329 4.7 C80 1 0.317 2.228844 17.83075 1.783075 1.77
2 0.936 9.606675 76.8534 7.68534 2 0.315 2.205006 17.64005 1.764005
C30 1 0.295 1.966627 15.73302 1.573302 2.87 C86 1 0.308 2.121573 16.97259 1.697259 1.66
2 0.567 5.208582 41.66865 4.166865 2 0.3 2.026222 16.20977 1.620977
C34 1 0.318 2.240763 17.9261 1.79261 1.82 C87 1 0.314 2.193087 17.5447 1.75447 1.71
2 0.324 2.312277 18.49821 1.849821 2 0.305 2.085816 16.68653 1.668653
C36 1 0.348 2.598331 20.78665 2.078665 1.58 C89 1 0.364 2.789035 22.31228 2.231228 2.1
2 0.243 1.346841 10.77473 1.077473 2 0.336 2.455304 19.64243 1.964243
C41 1 0.329 2.371871 18.97497 1.897497 1.6 C90 1 0.335 2.443385 19.54708 1.954708 3.12
2 0.267 1.632896 13.06317 1.306317 2 0.58 5.363528 42.90822 4.290822
C42 1 0.479 4.159714 33.27771 3.327771 2.89 C98 1 0.34 2.50298 20.02384 2.002384 3.18
2 0.388 3.075089 24.60072 2.460072 2 0.587 5.446961 43.57569 4.357569
C45 1 0.446 3.766389 30.13111 3.013111 5.17 H16 1 0.344 2.550656 20.40524 2.040524 3.18
2 0.898 9.153754 73.23004 7.323004 2 0.583 5.399285 43.19428 4.319428
C46 1 1.044 10.89392 87.15137 8.715137 8.2 H18 1 0.321 2.27652 18.21216 1.821216 3
2 0.937 9.618594 76.94875 7.694875 2 0.569 5.23242 41.85936 4.185936
C47 1 0.571 5.256257 42.05006 4.205006 3.34 H19 1 0.293 1.942789 15.54231 1.554231 2.89
2 0.389 3.087008 24.69607 2.469607 2 0.574 5.292014 42.33611 4.233611
C53 1 0.621 5.852205 46.81764 4.681764 3.6 H20 1 0.316 2.216925 17.7354 1.77354 1.76
2 0.395 3.158522 25.26818 2.526818 2 0.313 2.181168 17.44934 1.744934
C56 1 0.606 5.673421 45.38737 4.538737 3.49 H22 1 0.301 2.038141 16.30513 1.630513 1.92
2 0.387 3.06317 24.50536 2.450536 2 0.361 2.753278 22.02622 2.202622
C60 1 1.062 11.10846 88.8677 8.88677 5.75 H23 1 0.33 2.38379 19.07032 1.907032 2
2 0.404 3.265793 26.12634 2.612634 2 0.349 2.61025 20.882 2.0882
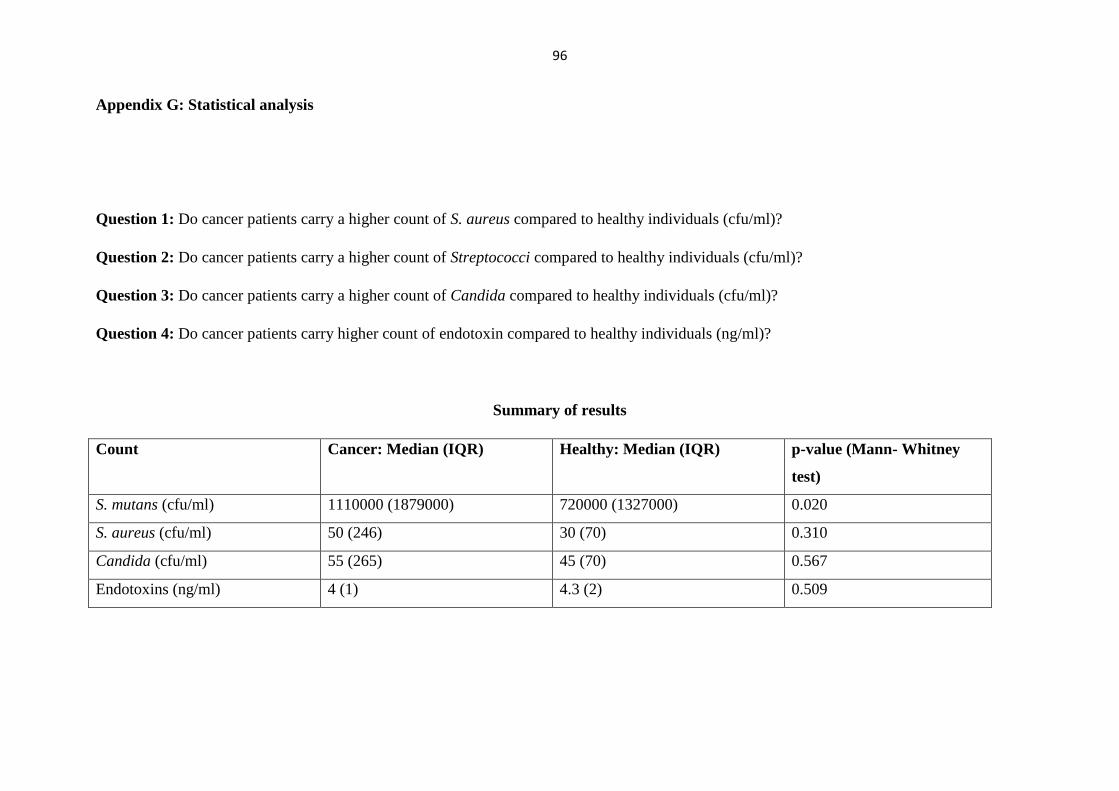
96
Appendix G: Statistical analysis
Question 1: Do cancer patients carry a higher count of S. aureus compared to healthy individuals (cfu/ml)?
Question 2: Do cancer patients carry a higher count of Streptococci compared to healthy individuals (cfu/ml)?
Question 3: Do cancer patients carry a higher count of Candida compared to healthy individuals (cfu/ml)?
Question 4: Do cancer patients carry higher count of endotoxin compared to healthy individuals (ng/ml)?
Summary of results
Count Cancer: Median (IQR) Healthy: Median (IQR) p-value (Mann- Whitney
test)
S. mutans (cfu/ml) 1110000 (1879000) 720000 (1327000) 0.020
S. aureus (cfu/ml) 50 (246) 30 (70) 0.310
Candida (cfu/ml) 55 (265) 45 (70) 0.567
Endotoxins (ng/ml) 4 (1) 4.3 (2) 0.509
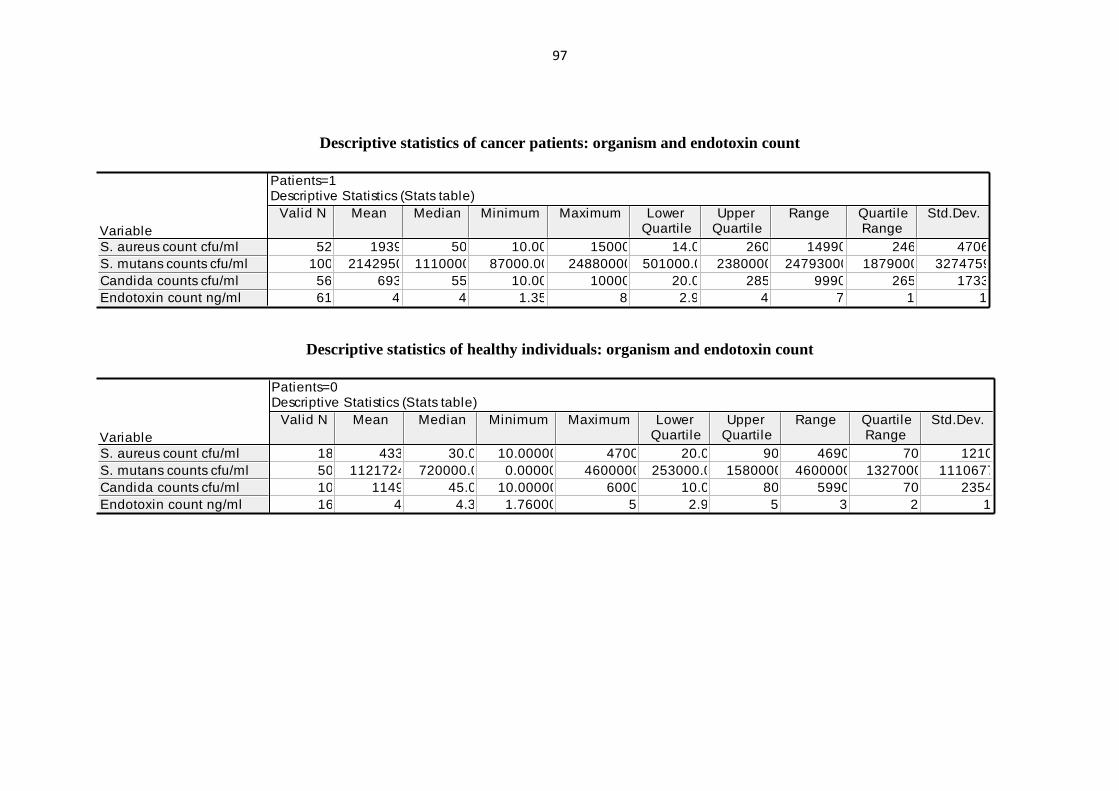
97
Descriptive statistics of cancer patients: organism and endotoxin count
Patients=1Descriptive Statistics (Stats table)
Variable
Valid N Mean Median Minimum Maximum LowerQuartile
UpperQuartile
Range QuartileRange
Std.Dev.
S. aureus count cfu/ml
S. mutans counts cfu/ml
Candida counts cfu/ml
Endotoxin count ng/ml
52 1939 50 10.00 15000 14.0 260 14990 246 4706
100 2142950 1110000 87000.00 24880000 501000.0 2380000 24793000 1879000 3274759
56 693 55 10.00 10000 20.0 285 9990 265 1733
61 4 4 1.35 8 2.9 4 7 1 1
Descriptive statistics of healthy individuals: organism and endotoxin count
Patients=0Descriptive Statistics (Stats table)
Variable
Valid N Mean Median Minimum Maximum LowerQuartile
UpperQuartile
Range QuartileRange
Std.Dev.
S. aureus count cfu/ml
S. mutans counts cfu/ml
Candida counts cfu/ml
Endotoxin count ng/ml
18 433 30.0 10.00000 4700 20.0 90 4690 70 1210
50 1121724 720000.0 0.00000 4600000 253000.0 1580000 4600000 1327000 1110677
10 1149 45.0 10.00000 6000 10.0 80 5990 70 2354
16 4 4.3 1.76000 5 2.9 5 3 2 1

98
Mann-Whitney test for cancer patients and healthy individuals: organism and endotoxin count
Mann-Whitney U Test (w/ continuity correction) (Stats table)By variable PatientsMarked tests are significant at p <.05000
variable
Rank SumGroup 1
Rank SumGroup 2
U Z p-value Zadjusted
p-value Valid NGroup 1
Valid NGroup 2
2*1sidedexact p
S. aureus count cfu/ml
S. mutans counts cfu/ml
Candida counts cfu/ml
Endotoxin count ng/ml
1922.000 563.000 392.000 1.014543 0.310324 1.023737 0.305960 52 18 0.313273
8131.500 3193.500 1918.500 2.316292 0.020543 2.316350 0.020540 100 50
1908.500 302.500 247.500 0.572281 0.567132 0.574467 0.565652 56 10 0.566541
2326.000 677.000 435.000 -0.659140 0.509806 -0.659170 0.509787 61 16 0.513435
Question 5: Do cancer patients with gram negative bacteria (GNB) have a higher count of endotoxin compared to cancer patients without GNB
(ng/ml)?
Summary of results
Count GNB: Yes- Median (IQR) GNB: No- Median (IQR) p-value (Mann-Witney test)
Cancer Patients: Endotoxin
(ng/ml)
3.490000 (1.050000) 3.615000 (1.970000) 0.456

99
Descriptive statistics of endotoxin count (ng/ml): cancer patients with GNB
GNB/no GNB=1Descriptive Statistics (Stats table)Include condition: v2=1
Variable
Valid N Mean Median Minimum Maximum LowerQuartile
UpperQuartile
Range QuartileRange
Std.Dev.
Endotoxin count ng/ml 23 3.387826 3.490000 1.350000 5.770000 2.870000 3.920000 4.420000 1.050000 1.189434
Descriptive statistics of endotoxin count (ng/ml): cancer patients without GNB
GNB/no GNB=0
Descriptive Statistics (Stats table)
Include condition: v2=1
Variable
Valid N Mean Median Minimum Maximum Lower
Quarti le
Upper
Quarti le
Range Quarti le
Range
Std.Dev.
Endotoxin count ng/ml 38 3.761053 3.615000 1.580000 8.200000 2.800000 4.770000 6.620000 1.970000 1.559996
The Mann-Witney test for endotoxin count (ng/ml): cancer patients with and without GNB
Mann-Whitney U Test (w/ continuity correction) (Stats table)
By variable GNB/no GNB
Marked tests are significant at p <.05000
Include condition: v2=1
variable
Rank Sum
Group 1
Rank Sum
Group 2
U Z p-value Z
adjusted
p-value Valid N
Group 1
Valid N
Group 2
2*1sided
exact p
Endotoxin count ng/ml 662.5000 1228.500 386.5000 -0.744062 0.456840 -0.744091 0.456822 23 38 0.455335

100
Question 6: Do cancer patients with oral mucositis have a higher count of endotoxin compared to healthy individuals (ng/ml)?
Summary of results
Count Cancer: Mucositis Median
(IQR)
Healthy: Median (IQR) p-value (Mann- Whitney test)
Endotoxin (ng/ml) 4 (3) 4.3 (2) 0.889
Descriptive statistics of endotoxin count (ng/ml): cancer patients with oral mucositis
Patients=1Descriptive Statistics (Stats table)Exclude condition: v9=0 and v2=1
Variable
Valid N Mean Median Minimum Maximum LowerQuartile
UpperQuartile
Range QuartileRange
Std.Dev.
S. aureus count cfu/ml
S. mutans counts cfu/ml
Candida counts cfu/ml
Endotoxin count ng/ml
7 160 20 10.0 730 18.0 280 720 262 269
12 2405250 1225000 150000.0 9520000 685000.0 2510000 9370000 1825000 2943020
9 1021 210 10.0 3840 40.0 1040 3830 1000 1591
12 4 4 1.4 8 2.4 5 7 3 2

101
Descriptive statistics of endotoxin count (ng/ml): healthy individuals
Patients=0Descriptive Statistics (Stats table)Exclude condition: v9=0 and v2=1
Variable
Valid N Mean Median Minimum Maximum LowerQuartile
UpperQuartile
Range QuartileRange
Std.Dev.
S. aureus count cfu/ml
S. mutans counts cfu/ml
Candida counts cfu/ml
Endotoxin count ng/ml
18 433 30.0 10.00000 4700 20.0 90 4690 70 1210
50 1121724 720000.0 0.00000 4600000 253000.0 1580000 4600000 1327000 1110677
10 1149 45.0 10.00000 6000 10.0 80 5990 70 2354
16 4 4.3 1.76000 5 2.9 5 3 2 1
Mann-Whitney test for endotoxin count (ng/ml): cancer patients with oral mucositis and healthy individuals
Mann-Whitney U Test (w/ continuity correction) (Stats table)
By variable Patients
Marked tests are significant at p <.05000
Exclude condition: v9=0 and v2=1
variable
Rank Sum
Group 1
Rank Sum
Group 2
U Z p-value Z
adjusted
p-value Valid N
Group 1
Valid N
Group 2
2*1sided
exact p
Endotoxin count ng/ml 170.5000 235.5000 92.50000 -0.139272 0.889236 -0.139329 0.889190 12 16 0.873052

102
Question 7: Do cancer patients with oral mucositis have a higher count of endotoxin compared to cancer patients without oral mucositis
(ng/ml)?
Summary of results
Count Cancer: Oral mucositis:
Median (IQR)
Cancer: No oral mucositis:
Median (IQR)
p-value (Mann- Whitney test)
Endotoxin (ng/ml) 3.745 (2.515) 3.53 (1.14) 0.6501
Question 8: Do cancer patients have a higher carrier rate of S. aureus compared to healthy individuals (%)?
Summary of results
Population S. aureus (%)- Present S. aureus (%)- Not Present p- value (chi-squared test)
Cancer Patients 52 48 P=0.064
Healthy Individuals 36 64

103
Frequency tables: S. aureus in cancer patients and healthy individuals
Summary Frequency Table (Stats table)Marked cells have counts > 10(Marginal summaries are not marked)
Patients S. aureus0
S. aureus1
RowTotals
Count
Row Percent
Count
Row Percent
Count
0 32 18 50
64.00% 36.00%
1 48 52 100
48.00% 52.00%
All Grps 80 70 150
Question 9: Do cancer patients have a higher carrier rate of Candida compared to healthy individuals (%)?
Summary of results
Population Candida (%)- Present Candida (%)- Not Present p- value (chi-squared test)
Cancer Patients 56 44 P=0.000
Healthy Individuals 20 80

104
Frequency tables for Candida in cancer patients and healthy individuals
Summary Frequency Table (Stats table)Marked cells have counts > 10(Marginal summaries are not marked)
Patients Candida0
Candida1
RowTotals
Count
Row Percent
Count
Row Percent
Count
0 40 10 50
80.00% 20.00%
1 44 56 100
44.00% 56.00%
All Grps 84 66 150
Question 10: Do cancer patients have a higher carrier rate of GNB compared to healthy individuals (%)?
Summary of results
Population GNB (%)- Present GNB (%)- Not Present p- value (chi-squared test)
Cancer Patients 24 76 P=0.154
Healthy Individuals 14 86

105