Embed Size (px)
Citation preview
DETECTION OF AEROBIC BACTERIAL ENDOSPORES: FROM AIR SAMPLING, STERILIZATION VALIDATION TO ASTROBIOLOGY
Thesis by
Pun To (Douglas) Yung
In Partial Fulfillment of the Requirements
for the Degree of
Doctor of Philosophy
California Institute of Technology
Pasadena, California
2008
(Defended May 9, 2008)

ii
© 2008
Pun To (Douglas) Yung
All Rights Reserved
iii
Acknowledgment
I would like to express my deepest gratitude to my thesis adviser, Dr. Adrian Ponce,
for his guidance and support. It is due to his scholastic guidance and encouragement that
ultimately made this work possible. I appreciate the time and attention of my committee
members: Professor Morteza Gharib, Professor Scott Fraser, and Professor Changhuei
Yang. Given their busy schedules, it has been kind of them to play a role in my course of
study.
I owe my gratitude to all members of the Ponce Group who have made this
dissertation possible, and because of them my graduate experience has been one that I
will cherish forever. Elizabeth Lester has kindly introduced me to techniques in
microbiology. Alan Fung has taught me principles in mechanical engineering and
instrument design. I have enjoyed working with Elizabeth Lester, Alan Fung, Morgan
Cable, Hannah Shafaat and Wanwan Yang. I would like express thanks to my summer
undergraduate mentees, Wilson Sung, Christine Tarleton, and William Fan, who have
contributed important pieces to my thesis work. I would like to acknowledge the other
individuals who have contributed to the completion of this thesis: Dr. James Kirby, Dr.
Xenia Amashukeli, Dr. Christine Pelletier, Raymond Lam, Dr. Michael Kempf, Michael
Lee, Dr. Fei Chen, Dr. Anita Fisher, Dr. Steve Monacos, Dr. Stephanie Connon, and Dr.
Donald Obenhuber.
I appreciate the support from the many reliable staff members working at JPL and
Caltech, including Stacey Klinger, Robert Downer, Icy Ma, Steve Gould, Lillian Kremar,
Joe Drew, Cora Carriedo, and Carlos Hernandez. Last but not least, I have to thank Linda
Scott for being the most efficient professional in bioengineering. I would like to thank

iv
Ray Pini, Amir Ettehdieh and Universal Detection Technology for helpful discussions. I
thank Fei Chen for her help in a preliminary vaporized hydrogen peroxide experiment
and access to the spacecraft assembly clean room. I thank Steris Corporation for
preparing vaporized hydrogen peroxide treated-endospore strips.
I am also indebted to my friends and family for their continuous support, love and
patience. Particularly, I would like to express my heartfelt gratitude to Jerry Ruiz and
Karen Chan. I warmly appreciate the encouragement from Dr. Stephen Shum and Dr.
James Tong from high school, college, to graduate school.

v
“The most beautiful and most profound emotion we can experience is the sensation
of the mystical. It is the source of all true science. He to whom the emotion is a
stranger, who can no longer wonder and stand rapt in awe, is as good as dead.”
Albert Einstein
vi
Abstract
Bacterial endospores are formed in genera such as Bacillus and Clostridium in times
of incipient stresses. Derivative of their remarkable resistance and ubiquity, endospores
are delivery vehicles for anthrax attack, biological indicators for checking sterilization
efficacy, and candidates for Panspermia and potential extraterrestrial life, thereby
underscoring the significance of their rapid detection. In this thesis project, spectroscopy
and microscopy methods are studied to measure the release of a unique constituent,
dipicolinic acid (DPA), via germination as a proxy for endospore viability. In particular, a
luminescence time-gated microscopy technique (called microscopy endospore viability
assay, acronym: µEVA) has been developed to enumerate germination-capable aerobic
endospores rapidly based on energy transfer from DPA to terbium ions doped on a solid
matrix upon UV excitation. The distinctive emission and millisecond lifetime enable
time-resolved imaging to achieve a sensitivity of one endospore.
Effective air sampling of endospores is crucial in view of the potential catastrophe
caused by the dissemination of airborne anthrax endospores. Based on time-gated
spectroscopy of terbium-DPA luminescence, the Anthrax Smoke Detector has been built
to provide real-time surveillance of air quality for timely mitigation and decontamination.
This technology also finds application in the monitoring of airborne endospore bioburden
as an indicator of total biomass in a closed spacecraft system in order to safeguard the
health of astronauts.
Sterilization validation is of prime concern in the medical field and planetary
protection to prevent cross-contaminations among patients and planets. µEVA has yielded
faster and comparable results compared with the culture-based NASA standard assay in

vii
assessing surface endospore bioburden on spacecraft materials and clean rooms surfaces.
The current analysis time has been expedited from 3 days to within an hour in
compliance with planetary protection requirements imposed on landers and probes
designed for life detection missions.
From the perspective of astrobiology, endospores are time capsules preserving
geological history and may exist as dormant lives in analogous extraterrestrial
environments. µEVA has successfully recovered ancient endospores in cold biospheres
(Greenland ice core, Antarctic Lake Vida, polar permafrost) and hyper-arid biospheres
(Atacama Desert) on Earth as templates for determining life longevity and the search of
extinct or extant life on Mars and other icy celestial bodies. Result authenticity has been
validated by a comprehensive suite of experiments encompassing culture-based and
culture-independent techniques such as epifluorescence microscopy, flow cytometry,
fluorometry, bioluminescence and 16s rRNA analysis. In conclusion, µEVA is a sensitive
analytical tool that opens a new realm in microbiology to provide insights into air
sampling, sterility assessment and exobiology.
viii
Table of contents
ACKNOWLEDGMENT………………………………………………………………………………………iii
ABSTRACT ..................................................................................................................................................vi TABLE OF CONTENTS ............................................................................................................................... viii LIST OF FIGURES ........................................................................................................................................ xv LIST OF TABLES ...................................................................................................................................... xviii
CHAPTER 1: INTRODUCTION ....................................................................................... 1
1.1 INTRODUCTION ...................................................................................................................................... 1 1.2 LIFE CYCLE OF AN SPORE-FORMING BACTERIA ....................................................................................... 5 1.3 DPA-TRIGGERED TERBIUM PHOTOLUMINESCENCE ASSAY ...................................................................... 7 1.4 OUTLINE OF THESIS .............................................................................................................................. 10 1.5 REFERENCES ........................................................................................................................................ 16
CHAPTER 2: REVIEW OF ENDOSPORE DETECTION TECHNOLOGY ................. 21
2.1 ABSTRACT ........................................................................................................................................... 21 2.2 INTRODUCTION .................................................................................................................................... 21 2.3 BIOMARKER METHODS ......................................................................................................................... 24
2.3.1 Calcium dipicolinate ................................................................................................................... 25 2.3.2 Dipicolinic acid ........................................................................................................................... 27 2.3.3 DNA ............................................................................................................................................. 31
2.4 OPTICAL PROPERTY AND STAINABILITY ............................................................................................... 34 2.4.1 Direct epifluorescent filtration technique .................................................................................... 34 2.4.2 Coulter counter ........................................................................................................................... 35 2.4.3 Method of Schaeffer and Fulton .................................................................................................. 35 2.4.4 Phase contrast microscopy .......................................................................................................... 36 2.4.5 Electron microscopy .................................................................................................................... 38 2.4.6 Flow cytometry ............................................................................................................................ 38
2.5 METABOLISM ....................................................................................................................................... 39 2.5.1 Impedance measurement ............................................................................................................. 39 2.5.2 Microcalorimetry ......................................................................................................................... 40 2.5.3 ATP firefly luciferin-luciferase assay .......................................................................................... 40
2.6 BIOCHEMICAL TESTS ............................................................................................................................ 44 2.7 COLONY FORMATION ........................................................................................................................... 46
2.7.1 Culturing (plate count and most probable number) .................................................................... 47 2.7.2 Turbidity measurement ................................................................................................................ 47
ix
2.8 SPORE COAT ......................................................................................................................................... 48 2.8.1 Immunoassay + Flow cytometry ................................................................................................. 49 2.8.2 Immunofluorescence resonance energy transfer ......................................................................... 49
2.9 SPORE DETECTION INSTRUMENTS ........................................................................................................ 50 2.10 CONCLUSION ..................................................................................................................................... 54 2.11 REFERENCES ...................................................................................................................................... 55
CHAPTER 3: AN AUTOMATED FRONT-END MONITOR FOR ANTHRAX
SURVEILLANCE SYSTEMS BASED ON THE RAPID DETECTION OF AIRBORNE
ENDOSPORES ................................................................................................................. 61
3.1 ABSTRACT ........................................................................................................................................... 61 3.2 INTRODUCTION .................................................................................................................................... 62 3.3 MATERIALS AND METHODS ................................................................................................................. 64
3.3.1 Chemicals .................................................................................................................................... 64 3.3.2 Biological samples ...................................................................................................................... 65 3.3.3 Anthrax Smoke Detector .............................................................................................................. 65 3.3.4 Spectrometry ................................................................................................................................ 66 3.3.5 Simulated anthrax attack ............................................................................................................. 67
3.4 RESULTS .............................................................................................................................................. 68 3.4.1 Spectrometer time-gated performance ........................................................................................ 69 3.4.2 Quantification of DPA and spores in water ................................................................................. 69 3.4.3 ASD response to simulated anthrax attack .................................................................................. 70
3.5 DISCUSSION ......................................................................................................................................... 71 3.6 CONCLUSION ....................................................................................................................................... 73 3.7 REFERENCES ........................................................................................................................................ 74
CHAPTER 4: AIRBORNE ENDOSPORE BIOBURDEN AS AN INDICATOR OF
SPACECRAFT CLEANLINESS ...................................................................................... 82
4.1 ABSTRACT ........................................................................................................................................... 82 4.2 INTRODUCTION .................................................................................................................................... 82 4.3 METHODS AND PROCEDURE ................................................................................................................. 85
4.3.1 Chemicals .................................................................................................................................... 85 4.3.2 Microbiological samples ............................................................................................................. 85 4.3.3Microbial Event Monitor .............................................................................................................. 86 4.3.4 Air Sample Collection ................................................................................................................. 87 4.3.5 Determination of total biomass ................................................................................................... 88
x
4.3.6 Correlating airborne and total biomass in a laboratory controlled environment ....................... 90 4.3.7 Correlating airborne and total biomass in indoor and outdoor environemnts ............................ 91 4.3.8 Comparison of biofilm-forming environmental isolate with lab-strain B. subtilis ...................... 92 4.3.9 Data Analysis .............................................................................................................................. 93
4.4 RESULTS .............................................................................................................................................. 94 4.4.1 Comparison test of 3 different air samplers ................................................................................ 94 4.4.2 Aerosolized biofilm endospore testing in the laboratory ............................................................. 94 4.4.3 Correlation of airborne and surface endospores in a closed laboratory environment ................ 95 4.4.4 Correlation of AEB and total biomass in indoor environments ................................................... 96 4.4.5 Correlation of AEB and total biomass in outdoor environments ................................................. 97 4.4.6 Comparison of biofilm-forming environmental-strain B. subtilis and lab-strain B. subtilis
endospores ............................................................................................................................................ 98 4.5 DISCUSSION ......................................................................................................................................... 98 4.6 CONCLUSION ..................................................................................................................................... 102 4.7 REFERENCES ...................................................................................................................................... 103
CHAPTER 5: RAPID STERILIZATION ASSESSMENT BY MONITORING
INACTIVATION OF GERMINABLE BACILLUS ENDOSPORES ............................. 114
5.1 ABSTRACT ......................................................................................................................................... 114 5.2 INTRODUCTION .................................................................................................................................. 114 5.3 METHODS .......................................................................................................................................... 117
5.3.1 Chemicals .................................................................................................................................. 117 5.3.2 Preparation of endospore stock suspension .............................................................................. 117 5.3.3 Sample Preparation for µEVA experiments ............................................................................... 118 5.3.4 The µEVA instrument................................................................................................................. 119 5.3.5 Endospore germination and germinable endospore assignment ............................................... 119 5.3.6 Phase contrast microscopy for measuring total endospore concentration ................................ 120 5.3.7 Inactivation experiments ........................................................................................................... 120 5.3.8 Statistical analysis ..................................................................................................................... 121 5.3.9 Spectroscopy .............................................................................................................................. 122
5.4 RESULTS ............................................................................................................................................ 123 5.4.1 Monitoring single endospore germination dynamics ................................................................ 123 5.4.2 Sensitivity, dynamic range, and false positive rate .................................................................... 124 5.4.3 Monitoring thermal and UV sterilization of Bacillus atrophaeus endospores .......................... 125
5.5 DISCUSSION ....................................................................................................................................... 126 5.6 REFERENCES ...................................................................................................................................... 129
xi
CHAPTER 6: TIME-GATED LUMINESCENCE MICROSCOPY OF SURFACE
BACTERIAL SPORES AS A RAPID BIOBURDEN ASSESSMENT OF SPACECRAFT
HARDWARE AND ASSEMBLY ENVIRONMENTS .................................................. 140
6.1 ABSTRACT ......................................................................................................................................... 140 6.2 INTRODUCTION .................................................................................................................................. 141 6.3 METHODS .......................................................................................................................................... 143
6.3.1 Chemicals .................................................................................................................................. 143 6.3.2 Preparation of endospore stock suspension .............................................................................. 144 6.3.3 Coupon cleaning and inoculation ............................................................................................. 144 6.3.4 Swab-rinse method .................................................................................................................... 145 6.3.5 NASA Standard Assay ................................................................................................................ 147 6.3.6 Sample preparation for µEVA experiments ............................................................................... 147 6.3.7 The µEVA instrument................................................................................................................. 148 6.3.8 Endospore germination and assignment ................................................................................... 149 6.3.9 Viability ratio ............................................................................................................................. 150 6.3.10 Surface sampling and NASA standard assay ........................................................................... 150 6.3.11 Vaporized hydrogen peroxide inactivation ............................................................................... 151 6.3.12 Oxygen plasma inactivation study ........................................................................................... 152 6.3.13 Clean room sampling .............................................................................................................. 152 6.3.14 Statistical analysis ................................................................................................................... 152
6.4 RESULTS ............................................................................................................................................ 153 6.4.1 Surface sampling of pure spore suspension on metal coupons .................................................. 154 6.4.2 Surface sampling of endospores in a spacecraft assembly cleanroom ...................................... 155 6.4.3 Monitoring of endospore inactivation to vaporized hydrogen peroxide .................................... 155 6.4.4 Monitoring of endospore inactivation to oxygen plasma .......................................................... 156
6.5 DISCUSSION AND CONCLUSION .......................................................................................................... 156 6.6 REFERENCES ...................................................................................................................................... 160
CHAPTER 7: METHOD DEVELOPMENT FOR ASTROBIOLOGIAL EXPLORATION
......................................................................................................................................... 168
7.1 ABSTRACT ......................................................................................................................................... 168 7.2 SPORULATION OF PSYCHROPHILIC ENDOSPORES ................................................................................ 168
7.2.1 Introduction ............................................................................................................................... 169 7.2.2 Methods ..................................................................................................................................... 171 7.2.3 Results ....................................................................................................................................... 177 7.2.4 Discussion ................................................................................................................................. 180
xii
7.2.5 Conclusion................................................................................................................................. 183 7.3 MICRO- AND MACRO-GERMINATION KINETICS ................................................................................... 183
7.3.1 Introduction ............................................................................................................................... 184 7.3.2 Methods ..................................................................................................................................... 187 7.3.3 Results ....................................................................................................................................... 195 7.3.4 Conclusion................................................................................................................................. 198
7.4 METHODS TO INCREASE CULTURABILITY ........................................................................................... 199 7.4.1 Introduction ............................................................................................................................... 199 7.4.2 Methods ..................................................................................................................................... 201 7.4.3 Results ....................................................................................................................................... 204 7.4.4 Discussion ................................................................................................................................. 206
7.5 REFERENCES ...................................................................................................................................... 208
CHAPTER 8: ENDOSPORES IN COLD BIOSPHERE................................................ 222
8.1 ABSTRACT ......................................................................................................................................... 222 8.2 INTRODUCTION .................................................................................................................................. 223 8.3 MATERIALS AND METHODS ............................................................................................................... 230
8.3.1 Materials ................................................................................................................................... 230 8.3.2 Validation of ice core decontamination protocol ....................................................................... 231 8.3.3 GISP2 ice core handling ........................................................................................................... 231 8.3.4 Permafrost handling .................................................................................................................. 234 8.3.5 Ice core analysis using spectroEVA ........................................................................................... 235 8.3.6 Ice core analysis using µEVA .................................................................................................... 237 8.3.7 Ice core cultivation .................................................................................................................... 239 8.3.8 Lake Vida Cultivation ................................................................................................................ 241 8.3.9 Permafrost cultivation ............................................................................................................... 242 8.3.10 Permafrost metabolic study ..................................................................................................... 243 8.3.11 Fluorescence microscopy ......................................................................................................... 245 8.3.12 Phase contrast microscopy ...................................................................................................... 247 8.3.13 Method of Schaeffer and Fulton .............................................................................................. 248 8.3.14 Flow cytometry ........................................................................................................................ 249
8.4 RESULTS ............................................................................................................................................ 250 8.4.1 Validation of ice core decontamination protocol ....................................................................... 251 8.4.2 Ice core SpectroEVA .................................................................................................................. 251 8.4.3 Ice core µEVA ............................................................................................................................ 255 8.4.4 Ice core microscopy and flow cytometry ................................................................................... 256 8.4.5 Ice core cultivation .................................................................................................................... 257
xiii
8.4.6 Lake Vida analysis ..................................................................................................................... 258 8.4.7 Permafrost analysis ................................................................................................................... 260
8.5 DISCUSSION ....................................................................................................................................... 264 8.5.1 Comparison of spectroEVA and µEVA at 295-m depth ............................................................. 266 8.5.2 Viability assessment at 295-m depth .......................................................................................... 266 8.5.3 Towards endospore longevity experiments ................................................................................ 268 8.5.4 Our results in the context of literature reports .......................................................................... 276 8.5.5 Insights from Lake Vida analysis ............................................................................................... 277 8.5.6 Insights from permafrost analysis ............................................................................................. 278
8.6. CONCLUSION .................................................................................................................................... 280 8.7 REFERENCES ...................................................................................................................................... 282
CHAPTER 9: ENDOSPORES IN HYPER-ARID BIOSPHERE .................................. 309
9.1 ABSTRACT ......................................................................................................................................... 309 9.2 INTRODUCTION .................................................................................................................................. 310 9.3 METHODS .......................................................................................................................................... 315
9.3.1 Materials ................................................................................................................................... 315 9.3.2 Soil sampling ............................................................................................................................. 315 9.3.3 Air sampling .............................................................................................................................. 316 9.3.4 Resistance experiment ............................................................................................................... 317 9.3.5 Water augmentation experiment ................................................................................................ 317 9.3.6 Measure of soil water activity, pH, EH, eC and temperature in field ......................................... 318 9.3.7 Anion exchange chromatography .............................................................................................. 319 9.3.8 Total organic carbon (TOC) measurement ................................................................................ 319 9.3.9 Phospholipid fatty acid (PLFA) analysis ................................................................................... 319 9.3.10 Radioactive carbon dating ...................................................................................................... 319 9.3.11 Cell extraction from soils ......................................................................................................... 320 9.3.12 Cultivation ............................................................................................................................... 321 9.3.13 µEVA ....................................................................................................................................... 324 9.3.14 SpectroEVA .............................................................................................................................. 325 9.3.15 Extraction of DPA .................................................................................................................... 327 9.3.16 ATP measurement .................................................................................................................... 328 9.3.17 Microscopic enumeration ........................................................................................................ 329 9.3.18 Ecology study and strain identification ................................................................................... 330 9.3.19 Sporulation .............................................................................................................................. 331 9.3.20 Spore size measurement ........................................................................................................... 332 9.3.21 Hydrophobicity ........................................................................................................................ 332
xiv
9.3.22 Germination ............................................................................................................................ 333 9.3.23 UV inactivation ....................................................................................................................... 334
9.4 RESULTS & DISCUSSION .................................................................................................................... 335 9.4.1 Spatial and temporal heterogeneity in Site A and Site E ........................................................... 336 9.4.2 Water augmentation .................................................................................................................. 340 9.4.3 Air sampling .............................................................................................................................. 342 9.4.4 Depth profile ............................................................................................................................. 343 9.4.5 Determination of DPA by terbium dipicolinate fluorescence assay ........................................... 345 9.4.6 Other interesting sampling locations ........................................................................................ 345 9.4.7 Ecological Study ........................................................................................................................ 347 9.4.8 Germination model .................................................................................................................... 348 9.4.9 Germinability and culturability between lab strains and environmental strains ...................... 350 9.4.10 Role of DPA on spore resistance .............................................................................................. 352 9.4.11 Inheritance of properties in spores .......................................................................................... 353
9.5 CONCLUSION ..................................................................................................................................... 354 9.6 REFERENCES ...................................................................................................................................... 358
CHAPTER 10: CONCLUSION ..................................................................................... 389
10.1 DEVELOPMENT OF AUTOMATED BACILLUS SPORE VIABILITY INSTRUMENTATION FOR STERILIZATION
VALIDATION, BIODEFENSE AND ASTROBIOLOGY ...................................................................................... 390 10.1.1 Statement of problem ............................................................................................................... 391 10.1.2 Background and relevancy to previous work ........................................................................... 393 10.1.3 General methodology and procedures to be followed ............................................................. 395 10.1.4 Proposed work ......................................................................................................................... 396 10.1.5 Expected results ....................................................................................................................... 402 10.1.6 Significance and application ................................................................................................... 402
10.2 DEVELOPMENT OF A RAPID ENDOSPORE DETECTOR ........................................................................ 405 10.2.1 Statement of problem ............................................................................................................... 406 10.2.2 Background ............................................................................................................................. 407 10.2.3 General methodology .............................................................................................................. 410 10.2.4 Expected results ....................................................................................................................... 418 10.2.5 Conclusion ............................................................................................................................... 421
10.3 REFERENCES .................................................................................................................................... 422
xv
List of figures
Figure 1.1 Images of endospores .......................................................................................................... 18
Figure 1.2 Life cycle of an endospore-forming bacterium .................................................................... 19
Figure 1.3 Photochemistry of Tb-DPA luminescence assay .................................................................. 20
Figure 2.1 Energy transition of the metal-to-ligand charge transfer between DPA and Fe2+ ............... 59
Figure 2.2 Comparison of Anthrax Smoke Detector and PCR detection system ................................... 60
Figure 3.1 Energy transfer and Stokes shift of Tb-DPA luminescence assay ........................................ 76
Figure 3.2 Instrument prototype of the Anthrax Smoke Detector (ASD) ............................................... 77
Figure 3.3 Filter set transmittance spectra of the ASD time-gated spectrometer ................................. 78
Figure 3.4 Dose response of the ASD spectrometer to pure DPA .......................................................... 79
Figure 3.5 Comparison of the ASD spectrometer performance on pure DPA and heat-treated
endospores .......................................................................................................................... 80
Figure 3.6 ASD measurement of a simulated anthrax attack ................................................................ 81
Figure 4.1 Operating principles of different air samplers .................................................................. 105
Figure 4.2 Bioefficiency comparison of different air samplers ........................................................... 106
Figure 4.3 Correlation of airborne and surface endospores in a laboratory-controlled closed
system ............................................................................................................................... 107
Figure 4.4 Correlation of airborne and surface endospores in everyday environments ..................... 108
Figure 4.5 Air sampling measurement as a timecourse of resident activity tested in the Marshall
Space Flight Center .......................................................................................................... 109
Figure 4.6 Air sampling in the Atacama Desert, Chile ....................................................................... 110
Figure 4.7 Phase contrast micrograph of the sporulating culture of a biofilm-forming
spore-former isolated from Mojave Desert, CA ................................................................ 111
Figure 4.8 A 2-compartmental model describing the dynamics between airborne and total
biomass in a closed system ............................................................................................... 112
Figure 5.1 Instrument prototype and principle of µEVA ..................................................................... 131
Figure 5.2 Germination timecourses monitored by refractility loss and DPA release ........................ 133
Figure 5.3 Comparison of the detection of low concentration of endospores (< 50 cfu mL-1) using
µEVA and a culture-based method ................................................................................... 134
Figure 5.4 Monitoring of the culturability and germinability loss of during heat inactivation and
UV irradiation experiments .............................................................................................. 135
Figure 5.5 Single endospore germination of lab-strain and environmental endospores ..................... 136
Figure 5.6 Excitation spectrum of pure DPA and germinating spores measured at front face
configuration on an agarose substrate ............................................................................. 137
xvi
Figure 5.7 Comparison of µEVA and TSA plating at high endospore concentration regimes ............ 138
Figure 5.8 Comparison of spectroEVA and µEVA .............................................................................. 139
Figure 6.1 Spectral overlap of Tb-DPA luminescence spectra with the experimnetal filter set in the
ASD spectrometer ............................................................................................................. 162
Figure 6.2 Flowchart illustration of the NASA standard assay procedure ......................................... 163
Figure 6.3 Recovery of endospores from coupons surface .................................................................. 164
Figure 7.1 Phase contrast images of psychrophilic endospore-forming bacteria ............................... 212
Figure 7.2 Recovery of endospores from coupon surface ................................................................... 213
Figure 7.3 Determination of optimal heat-shock temperature for screening mesophilic and
psychrophilic endospores from a mixed endospore population ........................................ 214
Figure 7.4 Thermal inactivation curves of typical mesophilic and psychrophilic endospores ............ 215
Figure 7.5 Single endospore germination of B. subtilis fitted to a model based on a rectangular
pulse approximation ......................................................................................................... 216
Figure 7.6 Characterization of the microgermination model parameters of lab-strain and
environmental-strain endospores ..................................................................................... 217
Figure 7.7 Effectiveness of a stochastic model in modeling macrogermination kinetics .................... 218
Figure 7.8 Effect of germinant incubation in the enhancement of endospore culturability ................ 219
Figure 8.1 Validation of ice core decontamination protocol using a fabricated ice core ................... 287
Figure 8.2 Ice core decontamination and handling procedure ........................................................... 288
Figure 8.3 Permafrost decontamination procedure ............................................................................ 289
Figure 8.4 SpectroEVA results on ice cores (age = 295 yr) ................................................................ 290
Figure 8.5 SpectroEVA results on ice cores (age = 20,000 yr) ........................................................... 291
Figure 8.6 µEVA image and endospore germination timecourse in an ice core sample (age = 295
yr) ..................................................................................................................................... 292
Figure 8.7 Microscopy and flow cytometry analyses on ice cores ...................................................... 293
Figure 8.8 SpectroEVA results on Lake Vida brine water ................................................................... 294
Figure 8.9 Phase contrast micrograph of an aerobic subculture of Lake Vida sample – presence of
two endospores in one mother cell ................................................................................... 295
Figure 8.10 Size distribution of endospores observed in Lake Vida .................................................... 296
Figure 8.11 Germination timecourse and µEVA time-lapse images of endospores found in
permafrost ......................................................................................................................... 297
Figure 8.12 Epifluorescence microscopy images of microorganisms found in permafrost ................. 298
Figure 8.13 Use of tetrazolium chloride to detect metabolic activities in a permafrost sample ......... 299
Figure 8.14 Monitoring of ATP and DPA levels of a permafrost sample over 7 days upon exposure
to nutrients ........................................................................................................................ 300
xvii
Figure 8.15 Viability Venn diagram .................................................................................................... 301
Figure 8.16 Viability plots of 12 ice cores along a depth transect (from 295 yr to 110,000 yr) .......... 302
Figure 9.1 Comparison of microbial abundance of sites A & E based on heterotrophic cell counts
in the Atacama Desert ...................................................................................................... 372
Figure 9.2 Measurement of in situ microbial response to water augmentation in the Atacama
Desert ............................................................................................................................... 373
Figure 9.3 Measurement of microbial response to water augmentation under simulated laboratory
conditions ......................................................................................................................... 374
Figure 9.4 Weather monitoring and air sampling in the Atacama Desert .......................................... 375
Figure 9.5 Culture-based, µEVA, TOC and PLFA analyses on 6 samples along a depth transect in
a soil pit in the Atacama Desert ....................................................................................... 376
Figure 9.6 Determination of germination-capable endospores in the Atacama Desert by µEVA ....... 377
Figure 9.7 Qualitative determination of DPA from Atacama soil samples using spectroEVA ............ 378
Figure 9.8 Comparison of spread plating and µEVA results across 30 different heat shocked
Atacama Desert soil samples ............................................................................................ 379
Figure 9.9 Hydrophobicity of lab-strain and environmental-strain endospores ................................. 384
Figure 9.10 Kinetics of L-alanine-induced germination on lab-strain and environmental-strain
endospores isolated from the Atacama Desert ................................................................. 385
Figure 9.11 DPA density vs. spore volume across thermophilic, mesophilic and psychrophilic lab
strains and environmental strains .................................................................................... 386
Figure 9.12 UV and heat inactivation plots of endospore isolated from the Atacama Desert ............ 387
Figure 9.13 Correlation of DPA density to thermal resistance and UV resistance across
thermophilic, mesophilic and psychrophilic lab strains and environmental strains ........ 388
Figure 10.1 Photochemistry of Tb-DPA assay and µEVA instrumentation ......................................... 425
Figure 10.2 Prototype design of a portable µEVA instrument ............................................................ 426
Figure 10.3 Germination timecourse of single B. atrophaeus endospores monitored by DPA
release and refractility change ......................................................................................... 427
Figure 10.4 Design of a high throughout biological indicator module ............................................... 428
Figure 10.5 96-well filtration unit ....................................................................................................... 429
Figure 10.6 Prototype design of a microfluidic chip encompassing different microbial detection
assays ............................................................................................................................... 430
Figure 10.7 Microfluidic implementation of the ATP luciferin-luciferase assay................................. 431
xix
List of tables
Table 3.1 Bioefficiency comparison between different air samplers ................................................... 113
Table 6.1 µEVA and NASA standard assay sampling results in a class 100 clean room facility ......... 167
Table 7.1 Properties of laboratory-strain and environmental-strain psychrophilic endospores ......... 220
Table 7.2 Germination parameters of laboratory-strain and environmental-strain psychrophilic
endospores .......................................................................................................................... 221
Table 8.1 Summary of permafrost microbiological analysis data ....................................................... 304
Table 8.2 Summary of GISP2 ice core, Lake Vida and permafrost analysis data ............................... 305
Table 8.3 Summary of the viability ratios of GISP2, Lake Vida and permafrost samples ................... 307
Table 9.1 Physical measurements of the samples collected in the 2007 Atacama Desert
expedition ........................................................................................................................... 364
Table 9.2 Microbiological results on the Atacama Desert samples..................................................... 368
Table 9.3 Species list of endospores used in the ecology study ........................................................... 380
Table 9.4 DPA content, resistance and germination properties of different endospores ..................... 382
1
CHAPTER 1: INTRODUCTION
1.1 Introduction
Bacterial spore (i.e., endospore), discovered in 1876 by Cohn1, Koch2,3 and Tyndall4
independently, is one of the hardiest dormant life forms on earth5 formed during the
resting stage in the life cycle of spore-forming genera such as Bacillus, Clostridium,
Sporosarcina and others (Figure 1.1). They are formed within vegetative cells during
sporulation, which is frequently triggered in response to adverse environmental
changes. Spores are renowned for their resistance against deleterious agents and
stresses, such as freezing, boiling, pressure, desiccation and attack by a wide variety
of toxic molecules6,7. Spore DNA is protected from the environment by a surrounding
spore coat comprised of calcium ions, dipicolinic acid and protein layers8-10. DPA
(dipicolinic acid, 2,6-pyridinedicarboxylic acid) is a unique chemical found only in
bacterial spores and can be released from the core into the surrounding by inducing
germination (e.g., with L-alanine11,12) or physical lysing (e.g., autoclaving,
microwaving13). With no detectable metabolism, bacterial spores can remain viable
for many years14. Some controversial reports claim that spores entombed in a bee
trapped in amber 25-40 million years ago have been revived14, and an even more
spectacular claim details the recovery of spores from 250-million-year-old halite
2
crystals15. The extreme resistance of bacterial spores has even been exploited to check
the performance of autoclaves16,17. Once favorable conditions return, spores undergo
germination and outgrowth to become vegetative cells that cause contaminations,
food spoilage, diseases, etc. Owing to their high resistance to physical extremes,
spores are ubiquitous and can be recovered from almost all extreme environments on
Earth.
In this thesis, I will focus on the study of Bacillus, which is a genus of rod-
shaped and Gram-positive bacteria under the Firmicutes division, with C + G values
ranging from 32% - 62%. A majority of the Bacillus species are strict aerobes or
facultative anaerobes producing endospores in the presence of oxygen. Several
species, e.g., B. infernus and B. arseniciselenatis, are found to be strictly
anaerobic18,19. A recent taxonomic reclassification has broken Bacillus into
Geobacillus, Paenibacillus, Lactobacillus, etc. Most of the species are mesophilic
with some psychrophiles and thermophiles. Bacillus species can be divided into three
groups based on morphology of the sporangia.
Group I encompasses ellipsoidal or cylindrical endospores situated centrally to
terminally in the progenitor mother cell with non-swollen sporangia. It contains most
of the human pathogenic species including B. anthracis, the causative agent of
anthrax, and B. cereus, causing food poisoning with symptoms similar to
3
staphylococcal food poisoning. A lot of benign soilborne endospores such as B.
subtilis and B. pumilis are also found in this group. Group II is composed of
ellipsoidal endospores situated centrally to terminally in a swollen sporangium. This
group is mainly characterized by insect pathogens such as B. larvae and B.
lentimorbus causing American foulbrood in honeybees and milky disease in Japanese
beetle, respectively. Group III consists of spherical endospores situated sub-terminally
to terminally in sporangia. Some of the psychrophilic Bacillus species are found in
this group, notably B. psychrophiles and B. longisporus.
Spores are interesting subjects to study from both a scientific and application
perspective. They are the ideal model for dormancy, resistance and survivability in the
nature. They account for a large majority of the microbial flora on Earth and take up
unique roles in homeland security, sterilization validation, and astrobiology.
Detection of pathogenic endospores has been an increasingly important issue
in the safety and security of each country. Most of the Bacillus species are harmless
soil-borne microorganisms. The most virulent species is Bacillus anthracis. Upon
contact with animals, it can cause either cutaneous anthrax, inhalational anthrax or
gastro-intestinal anthrax. Inhalational anthrax draws the most attention because of
convenient airborne spore delivery and high lethal rate. The lethal dose at which 50%
of an untreated exposed population would die (LD50) from inhalational anthrax is

4
believed to be between 2,000 and 55,000 spores, with a nominal value of 8,000 to
10,000 spores. Accidental release of anthrax from a military compound in Chkalovsky,
Russia in 1979 has led to the death of at least 70 people20. B. anthracis is undoubtedly
the notorious bacteria causing national upheavals during the anthrax attack. In 2001 B.
anthracis endospores have been weaponized in US postal offices to cause 22
inhalational anthrax cases, of which 5 people died. Spores entering lungs are carried
by macrophages to the mediastinal lymph where they germinate, outgrow and produce
lethal toxins. The incubation time (the time from the bioweapon exposure to the onset
of the first symptom and disease) is 2 to 3 days for anthrax. Real-time detection of
bioweapon release grants time and resources for emergency management to mitigate
possible consequences, such as by appropriate medical care, limiting the spread of
infection and timely decontamination.
Bacillus species are of great interests in sterilization control. B. cereus and B.
sphericus survive and pasteurization and are the cause of milk coagulates. B.
thuringiensis are natural insecticides. Residual endospores on spacecraft hardware
surfaces after disinfection post potential jeopardy to the data collected from other
planets. Understanding properties of endospores is important in preventing food
spoilage and aids in NASA’s objective in planetary protection.
5
Endospores are highly resilient dormant structures that can return to vegetative
cells when favorable conditions are restored after exposure to radiation or temperature.
Study of the viable number in endospores entombed in polar ices, suspended in frozen
lakes and embedded in permafrost provides clues for determining long-term viability.
1.2 Life cycle of a spore-forming bacteria
Endospores can lay dormant for long periods and remain viable, even while exposed
to harsh environmental conditions. When more favorable conditions are signaled by
the presence of water, nutrients, and germinants, endospores may break dormancy and
germinate to become metabolically active and multiply. Figure 1.2 outlines the life
cycle of an endospore-forming bacterium. As an endospore proceeds through
germination toward cell division, there are various stages, including spore activation,
stage I germination (during which DPA is released and water rehydrates the spore),
stage II germination (during which cortex hydrolysis occurs and metabolism begins),
and finally outgrowth (during which cell division occurs)21. Each of these stages in
the life cycle of endospore-forming organisms can be observed with the experimental
techniques described below. Certainly outgrowth, manifested as visible colonies on
growth media, is the most direct measurement of endospore viability. However,
colony formation requires approximately 20 cycles of replication over several days of
6
incubation before the colony becomes visible, and is therefore not amenable for rapid
endospore viability analysis. In contrast, observation of water influx with phase
contrast microscopy, DPA release with Tb-DPA luminescence assays, and ATP
production with the luciferin-luciferase bioluminescence assays provide rapid
measures of endospore viability, since these events occur much earlier in the
germination to outgrowth pathway.
The life cycle of endospore-forming bacteria comprises 3 different processes:
vegetative growth, sporulation and germination. Vegetative growth occurs when
nutrients are available and is characterized by cells growing logarithmically by
symmetric fission. When nutrients become limiting, these bacteria might initiate the
sporulation process. However, sporulation is not the only developmental option for
the vegetative cell that can also follow diverse routes, expressing genes needed for
general adaptation to adverse conditions, or genes needed to scavenge alternative
nutrients and to increase competitiveness against other species that are using the same
scarce energy resources. In such conditions various proteases and degradative
enzymes (amylases, xylanases, cellulases, etc.), alternate chemotaxis pathways,
different antibiotics and transport functions are expressed and/or activated. Some cells
become competent for uptake of exogenous DNA, which is introduced into the

7
recipient’s chromosome and may confer selective advantages to future generations
living under adverse conditions.
1.3 DPA-triggered terbium photoluminescence assay
DPA-triggered terbium photoluminescence assay forms the basis of spore detection in
my research. Tb3+ is a lanthanide ion, which is characterized by sharp and narrow
emission bands, as well as a millisecond-long excited state lifetime (Figure 1.3). The
native luminescence of Tb3+ is very weak attributed to its low oscillatory strength (≈
10-6) of the excitation bands22. The binding of a chelate, such as DPA, to Tb3+, when
excited with UV light, can transfer energy to the emissive state of Tb3+, leading to
great emission intensity enhancement (> 20,000 times)23. The original Tb3+ excitation
spectrum (λex = 270 nm) will be changed to a characteristic dual-peak spectrum (λex =
273, 279 nm) upon complexation with DPA.
The valence 4f electrons of Tb3+ are rarely involved in bonding because they
are shielded by the outer core 5s and 5p electrons. When Tb3+ absorbs a photon or is
otherwise supplied with a sufficient quantum of energy, it reaches an electronically
excited state. The low ligand-field splitting of the Tb3+ f electrons results in poor
nonradiative electronic transitions generally. The only significant nonradiative
deactivation of the emissive state of Tb3+ is through the O-H vibrations of coordinated

8
water molecules. This also explains why the lesser number of water molecules
coordinated the higher the lifetime Tb3+ or terbium chelate can attain. Energy lose via
radiative transition, with the emission of a photon as the electron transfer back into its
lower energy orbital, is known as fluorescence. These f-f transitions are, nevertheless,
Laporte forbidden because there is no change in parity. This results in Tb3+ absorption
and emission spectra being consisting of sharp and narrow bands, low molar
absorption coefficients in the near-UV and visible ranges (ε typically between 0.01
and 3 M-1 cm-1), as well as a millisecond-long luminescence lifetime. Therefore, Tb3+
exhibits a very weak emission upon direct near-UV excitation.
Absorption of photons, optimally in the UV range, promotes DPA from
ground state to a vibrationally excited singlet state. This excited singlet can lose its
excess energy by both radiative and nonradiative decay. Upon complexation with
DPA, the photophysical properties of Tb3+ are slightly perturbed owing to the well-
shielded 4f electrons. Sensitized luminescence can be observed due to energy transfer
from the lowest-lying DPA triplet excited state to the emissive 5D4 state of Tb3+. DPA
acts as a light harvesting antenna to receive UV excitation and then transfers the
energy to Tb3+. Because the energy gap between the Tb3+ ground state and emissive
states is very large (20,500 cm-1), the luminescence enhancement is very significant
according to the energy gap law.

9
DPA is thermodynamically and kinetically stable, thereby avoiding high
energy oscillator in the first coordination sphere. It also has a matched electronic
transition levels with Tb3+, in which an efficient intersystem crossing is possible due
to ΔE(1π π* - 3π π*) ≈ 5000 cm-1, demonstrating a large conjugated π electron system.
In additional to this, the energy difference, ΔE(3π π* - 5DJ) ≈ 2500 - 3500 cm-1, is well
above the 5D4 state of Tb3+ so that back transfer onto DPA triplet state is not possible.
Another favorable feature of Tb3+ is its retention in atomic properties upon
ligand binding due to its well-shielded 4f electrons. Only minimal changes are
observed in the emission spectra of Tb3+. Therefore, sensitized luminescence turn-on
can readily be observed by an up shift in the fluorescence spectra. Besides, excitation
spectrum of the sensitized terbium luminescence will mimic the excitation spectrum
of DPA energy donor moieties. This provides a basis for the distinctive identification
of the ligand responsible for the sensitization. In the case of DPA, a characteristic split
in the excitation spectrum is observed.
Background and autofluorescence signals are usually rapidly decaying
processes with lifetimes on the timescale of 1 – 100 nanoseconds24. Terbium
dipicolinate has a lifetime in the range of milliseconds25,26. Therefore, when excited
by UV, the emitted Tb-DPA intensity can be observed without interference from
autofluorescence and scattering light, resulting in a substantial increase in detection
10
sensitivity. Delayed luminescence intensity can thus be measured with a pulsed UV
excitation, xenon flashlamp or laser, with minimal background interference.
1.4 Outline of thesis
Brooks et al. defined indicators as “measures, variables, or indices that represent or mimic
either the structure or function of ecological processes and systems across a disturbance
gradient27.” In this thesis work, I evaluate the effectiveness of bacterial endospore as a
biological indicator to characterize, track and predict changes in indoor air quality, spacecraft
bioburden level, and extreme ecosystems on Earth. Specifically, this goal is achieved via:
(1) development of new spectroscopy and microscopy methods to detect aerobic
endospores; (2) application of culture-based and culture-independent methods to
study endospores under various habitats. Chapter 2 is a literature review of
endospore detection methods, with a general introduction to culture-based and
culture-independent techniques. I have emphasized on detection tools that are relevant
to subsequent chapters. The rest of this thesis can be divided into 3 modules, namely,
air sampling, sterilization validation and astrobiology.
The first module is devoted to the detection of airborne endospores. A good
biological indicator has to be able to indicate impending changes and provide
continuous assessment over a system. Chapter 3 presents the implementation of an
11
autonomous air sampler, known as the Anthrax Smoke Detector (ASD), to quantify
airborne endospores. The ASD is intended to serve as a cost-effective front-end monitor
for anthrax surveillance systems. The principle of operation is based on measuring
airborne endospore concentrations, where a sharp concentration increase signals an
anthrax attack. The combination of time-gated spectroscopy and the unique
photoproperties of terbium dipicolinate results in a sensitive and low detection limit.
The ASD-technology can also be extended to the development of a miniature air
sampling system to monitor indoor airborne endospore level in a closed system such
as spacecrafts and life-support space stations as an indicator of the general hygiene
level. Microbiological monitoring in confined spacecraft and space station environments
during long-duration manned missions is instrumental to guaranteeing the health, safety
and productivity of astronauts and crew members. Chapter 4 tests the hypothesis that
airborne endospore bioburden is an effective indicator of total biomass in a closed
system. A correlation characterized by a two-compartmental model has been
formulated from a laboratory controlled enclosure to everyday life examples such as
offices and laboratories. Future work will follow to miniaturize the current prototype
for a terminal integration with the life-support system.
The second module applies to the validation of sterilization. We focus on
developing rapid and sensitive methods to detect endospores as surrogates for the
12
measurement of total biomass on a surface in the context of planetary protection. A
microscopy version of the Tb-DPA luminescence assay, known as the microscopic
endospore viability assay (acronym: µEVA) has been introduced in Chapter 5, fully
validated with cultivation and phase contrast microscopy on enumerating pure
endospore suspension and monitoring the thermal and UV inactivation of endospores.
We have demonstrated a single endospore resolution with a linear measurement at
low inocula. The application of µEVA on assessing endospores on surfaces is
illustrated in Chapter 6, with an emphasis on the bioburden evaluation according to
planetary protection regulations. Side-by-side comparison tests have been conducted
using µEVA and the culture-based NASA standard assays in monitoring the surface
hygiene level based on endospore concentration on coupons made of spacecraft
materials and the Class 100 clean room in the Spacecraft Assembly Facility at JPL.
This method is expected to be deployed as a new bioburden assessment standard in
NASA for ensuring the cleanliness of spacecraft and associated facilities.
Chapters 7 through 9 cover the endospores analysis on environmental samples
in extreme environments. Essentially all the methods delineated in previous chapters
are developed again and tailored made for specific environmental samples. The goal
is to use endospores as the indicator microbe in the study of different ecological
systems to shed light on astrobiology questions. Chapter 7 describes a wide variety
13
of experiments involving method development, instrument building and model
formulation to prepare for the study of endospores under different extreme
environments on Earth as models for the eventual exobiological search of life in other
planets. So far, most of the assays are developed based on model laboratory
endospore strains, such as B. atrophaeus and B. subtilis. Instruments are developed
and modified to adapt to field analysis in desert and ice environments. New protocols
and calibration curves are obtained with various endospore viability assays in working
with environmental samples. Robustness of the assay has been improved by extending
the analysis from mesophilic to thermophilic and psychrophilic endospores. Novel
sporulation protocols have been developed to prepare pure and clean psychrophilic
endospores for preliminary experiments towards detection of endospores in the ice
biospheres. Microgermination and macrogermination models are formulated to give
us insights into more complex environmental endospores based on simple and
controlled model strains.
Chapter 8 describes the application of a combination of culture-based and
culture-independent assays on endospores in extreme cold biospheres on Earth,
including GISP2 (Green Ice Sheet Project 2) ice cores, Antarctic underground frozen
brine Lake Vida, and polar permafrost. The decontamination, sample handling and
analyses for each of these samples are depicted in detail in this chapter. Apart from
14
the Tb-DPA luminescence assays, many of other methods such as metabolic dyes,
bioluminescence and flow cytometry are explored to determine the viability of
resident microbes. 4 different viability ratios have been obtained independently based
on different measurables in terms of culturability, germinability and total microscopy
counts to characterize the microbial abundance and viability in each of these cold
habitats. In particular, a transect of 12 depths extending from 295 to 110,000 years old
have been analyzed to shed light on the longevity of the most resistant life form, i.e.
endospores, in the best storage repository on Earth.
Chapter 9 examines another terrestrial model to Mars – a hyper-arid
environment totally devoid of water. The Atacama Desert in Chile serves as the model
system because it is the driest desert on Earth. Previous studies have reported a near-
sterile state in the soils. My research group has been on a sampling expedition to the
Atacama Desert for 10 days in September 2007 to carry out a series of in situ and
sample return analyses with the goal to study the microbial diversity, abundance and
the response of the effect of water on the native microbes. New culture-independent
methods, such as phospholipid fatty acid and total organic carbon analyses were
performed on the desert soils along with Tb-DPA based assays. Significant
differences in culturability and germinability were obtained along a depth profile in a
soil pit corresponding to ages approximately equal to 25,000 and 35,000 years ago
15
based on radioactive carbon dating. A spike in microbial response was also observed
when sterile water was added into otherwise-sterile desert soils. Endospore isolates
obtained from the Atacama Desert were compared with laboratory strains and other
environmental isolates as an effort to investigate the long-debated ecological role of
endospores in a particular environment. In particular, we assess the feasibility of using
the abundance and viability of endospore as proxies to study the ecosystem in
Atacama.
Chapter 10 concludes the thesis by by proposing two future projects built on
the developed assays and tools. One of the projects aims to build a miniaturized
µEVA instrument for portable field deployment. As science evolves into a high-
throughput technology for the study of bacteria, new demands are continually being
placed upon analysis time and turnaround efficiency in quantitative methods. Chief
among these are increased detection sensitivity, portability, broad dynamic range and
compatibility with other methods and portability into spacecraft mission. In this future
work section, some of the current µEVA limitations, such as serial processing,
bulkiness and manual operation, are interfaced with automated microfluidic chip,
robotic high-throughput processing and a miniaturized design. The goal of the other
project is to incorporate several synergistic and complementary microbial detection
16
assays onto a microfluidic chip. It is expected that both deliverables will be integrated
into the life-detection system for future space explorations in due course.
1.5 References
1. Cohn, F. Untersuchungen uber Bacterien. IV. Beitrage zur Biologie der Bacillen. Beitr. Biol.
Pflanz. 2, 249-276 (1876).
2. Koch, R. Untersuchungen uber Bakterien V. Die Atiologie der Milzbrandkrankheit, begrundet auf
die Entwicklungsgeschichte des Bacillus anthracis. Beitr. Biol. Pflanz. 2, 277-310 (1876).
3. Koch, R. Untersuchungen uber Bakterien VI. Verfahren zur Untersuchung, zum Conservieren und
Photographieren. Beitr. Biol. Pflanz. 2, 399-434 (1877).
4. Tyndall, J. Further researches on the department and vital persitence of putrefactive and infective
organisms froma a physical point of view. Phil. Trans. Royal Soc. 167, 149-206 (1877).
5. Roberts, T.A., Hitchins, A. D. Resistance of spores. The Bacterial Spore ed. Gould, G. W. and
Hurst, A, 611-670 (1969).
6. Aronson, A.I. and Fitz-James, P. Structure and morphogenesis of the bacterial spore coat.
Bacteriological Reviews 40, 360-402 (1976).
7. Driks, A. and Setlow, P., Prokaryotic Development. (American Society of Microbiology,
Washington, D.C., 2000).
8. Church, B.D. and Halvorson, H. Dependence of the heat resistance of bacterial endospores on
their dipicolinic acid content. Nature 183, 124-125 (1959).
9. Byrne, A.F., Burton, T.H., and Koch, R.B. Relation of dipicolinic acid content of anaerobic
bacterial endospores to their heat resistance. Journal of Bacteriology 80, 139-140 (1960).
10. Berg, P.E. and Grecz, N. Relationship of dipicolinic acid content in spores of Bacillus cereus to
ultraviolet and gamma radiation resistance. Journal of Bacteriology 103, 517-519 (1970).
11. Foster, S.J. and Johnstone, K. Pulling the trigger: The mechanism of bacterial spore germination.
Molecular Microbiology 4, 137-141 (1990).
12. Johnstone, K. The trigger mechanism of spore germination. Journal of Applied Bacteriology 76,
17S-24S (1994).
13. Vaid, A. and Bishop, A.H. The destruction by microwave radiation of bacterial endospores and
amplification of the released DNA. Journal of Applied Microbiology 85, 115-122 (1998).
14. Nicholson, W.L., Munakata, N., Horneck, G., Melosh, H.J., and Setlow, P. Resistance of Bacillus
endospores to extreme terrestrial and extraterrestrial environments. Microbiology and Molecular
Biology Reviews 64, 548-572 (2000).
17
15. Cano, R.J. and Borucki, M.K. Revival and identification of bacterial spores in 25-million-year-old
to 40-million-year-old Dominican amber. Science 268, 1060-1064 (1995).
16. Vreeland, R.H., Rosenzweig, W.D., and Powers, D.W. Isolation of a 250 million-year-old
halotolerant bacterium from a primary salt crystal. Nature 407, 897-900 (2000).
17. Dart, R.K., Microbiology for the Analytical Chemist. (The Royal Society of Chemistry,
Cambridge, UK, 1996).
18. Switzer Blum, J., Burns Bindi, A., Buzzelli, J., Stolz, J.F., and Oremland, R.S. Bacillus
arsenicoselenatis, sp. nov., and Bacillus selenitireducens, sp. nov.: two haloalkaliphiles from
Mono Lake, California that respire oxyanions of selenium and arsenic. Archives of Microbiology
171, 19-30 (1998).
19. Boone, D.R. et al. Bacillus infernus sp. nov., an Fe (III)-and Mn (IV)-reducing anaerobe from the
deep terrestrial subsurface. International Journal of Systematic and Evolutionary Microbiology 45,
441-448 (1995).
20. Meselson, M. et al, (1994), Vol. 266, pp. 1202-1208.
21. Setlow, P. Spore germination. Current Opinion in Microbiology 6, 550-556 (2003).
22. Richardson, F.S. Terbium(III) and europium(III) ions as luminescent probes and stains for
biomolecular systems. Chemical Reviews 82, 541-552 (1982).
23. Hindle, A.A., Hall, E. A. H. Dipicolinic acid (DPA) assay revisited and appraised for spore
detection. Analyst 124, 1599-1604 (1999).
24. Lakowicz, J.R., Principles of Fluorescence Spectroscopy. (Plenum, New York, 1983).
25. Jones, G. and Vullev, V.I. Medium effects on the photophysical properties of terbium(III)
complexes with pyridine-2,6-dicarboxylate (supporting information). Journal of Physical
Chemistry A 106, 8213-8222 (2002).
26. Jones, G. and Vullev, V.I. Medium effects on the stability of terbium(III) complexes with
pyridine-2,6-dicarboxylate. Journal of Physical Chemistry A 106, 8213-8222 (2002).
27. Brooks, R.P., O'Connell, T.J., Wardrop, D.H., and Jackson, L.E. Towards a regional index of
biological integrity: the example of forested riparian ecosystems. Environmental Monitoring and
Assessment 51, 131-143 (1998).

18
Figure 1.1 | (a) Transmission electron micrograph of a bacterial spore embedded
within a Clostridium perfringens vegetative cell. Scale bar = 0.3 μm. (b) Bacterial
spores appear phase-bright observed under a phase contrast microscope and are
readily distinguished from the phase-dark rod-shaped vegetative mother cell. Scale
bar = 2 μm. (c) Cross section of a TEM of an endospore of Geobacillus
stearothermophilus. Scale bar = 0.2 µm. (d) Schematic representation of the internal
structure of a typical bacterial spore, reproduced from Foster and Johnstone (1990).
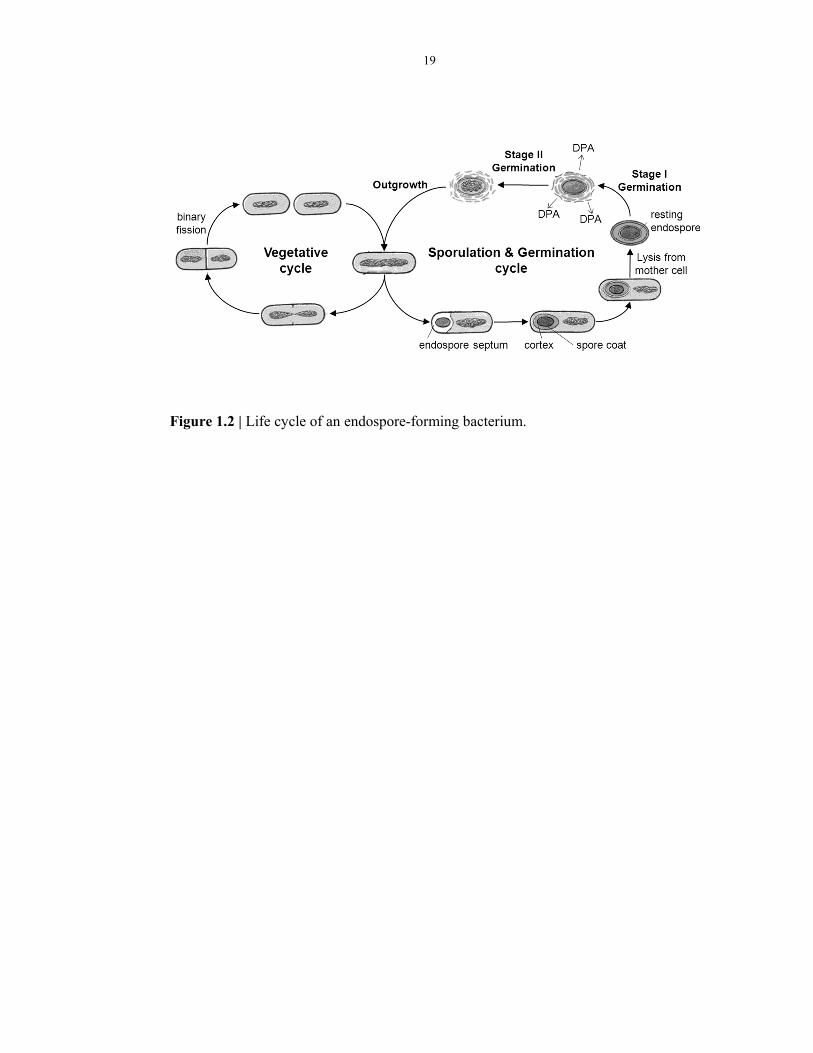
19
Figure 1.2 | Life cycle of an endospore-forming bacterium.
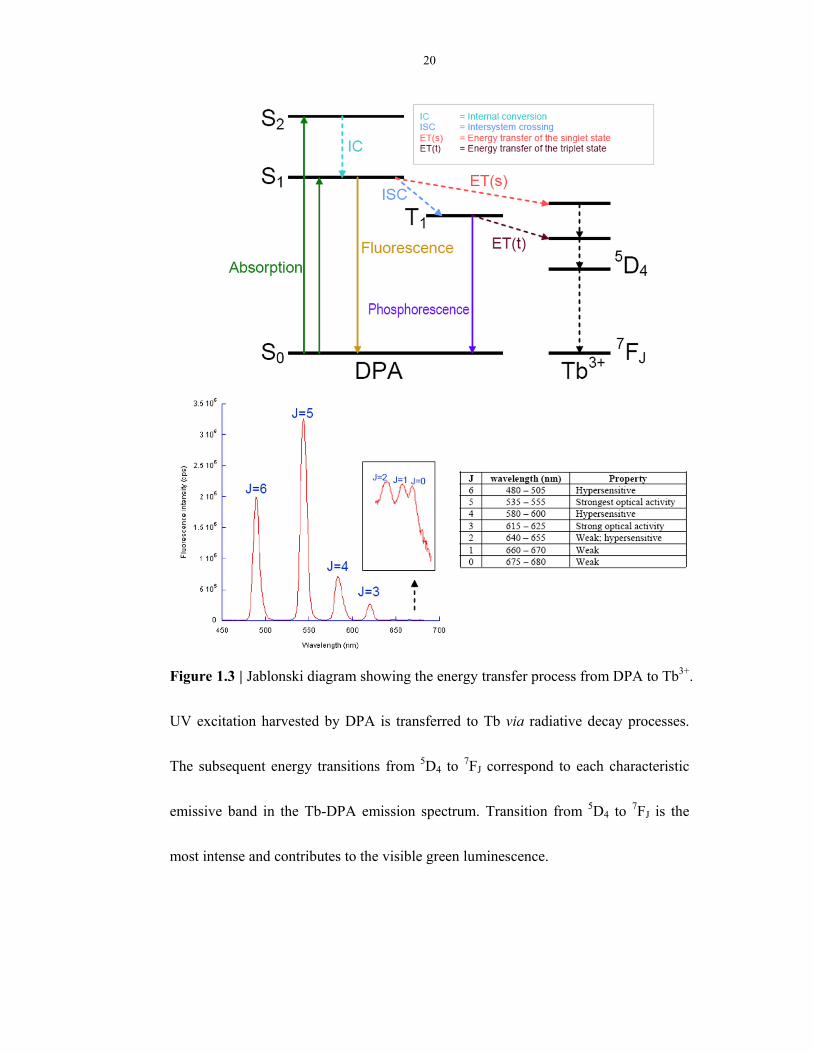
20
Figure 1.3 | Jablonski diagram showing the energy transfer process from DPA to Tb3+.
UV excitation harvested by DPA is transferred to Tb via radiative decay processes.
The subsequent energy transitions from 5D4 to 7FJ correspond to each characteristic
emissive band in the Tb-DPA emission spectrum. Transition from 5D4 to 7FJ is the
most intense and contributes to the visible green luminescence.
21
CHAPTER 2: REVIEW OF ENDOSPORE DETECTION TECHNOLOGY
2.1 Abstract
Rapid monitoring of bacterial endospores is of key importance in addressing homeland
security and astrobiology questions. Apart from the traditional culture-based techniques,
unique constituents and distinctive physiological processes associated with endospores
were targets for assessing their number and viability. A lot of new biomarker-based
chemical, spectroscopic and molecular biological assays have been developed to exploit
dipicolinic acid, sporulation gene and the germination process as proxy for enumerating
endospores and assigning their viability. This review describes the history and recent
advances of endospore methods, as well as the applicability and efficacy of these assays
under different contexts. Each of the methods tested in this study has its advantages, and
integration of two or more of these techniques provides complementary information to
increase the degree of confidence.
2.2 Introduction
What defines microbiology is that everything is in micrometer scale. Microorganisms are
not visible to naked eyes unless they form colonies or are observed under a microscope.
Microorganisms are everywhere but determination of the number of diversity of viable
microbes from an environmental sample is by no means easy. The detection scheme
generally falls into two big categories. One is to amplify the bacteria or any chemical
marker inherent in the bacteria, e.g., agar-based techniques, turbidity and PCR. The other
is to use sensitive instruments such as microscope and flow cytometer to provide
22
resolution for examination of individual bacterium. Pre-treatment usually entails staining
or tagging with antibodies and indicator molecules. Culturing is the classical gold
standard to determine the cell number and biomass, but is susceptible to underestimation
because of the presence of viable-but-not-culturable microbes. Microscopy is feasible
method for microbial enumeration but suffers from obscurity when handling highly
complex environmental samples. Alternative methods that detect cellular components
such as DNA and RNA have been an important tool to identify a much wider variety of
microbes with high sensitivity and accuracy despite its high cost and labor intensive
operation.
Detection of viable endospores presents an even greater challenge due to the
impermeable spore coat, extreme resistance to lysis, and undetectable metabolic activities.
Many current diagnostic techniques fail on the detection of endospores. The impermeable
spore coat prevents endospores from staining and therefore invalidates most of the
microscopy and flow cytometry techniques. Extreme resistance to lysis makes already
genetic materials inaccessible by conventional DNA extraction protocols. In addition,
endospores are packaged with a minimal amount of genetic materials, which poses extra
difficulties for molecular biology methods. The absence of measurable metabolic rates
exhibited by endospores helps them escape from respiration and microcalorimetry assays.
Last but not least, separating and identifying the endospore subpopulation from a
microbial community is an added challenge due to their dormancy, which nullifies the
credibility of many other techniques, e.g., plate counts, ELISA, cell sorting,
optical/electron microscopy, which require cell outgrowth to produce sufficient quantities
for detection.
23
Fortunately, some of the unique cell components in endospores, such as
dipicolinic acid (DPA, diaminopimelic acid (DAP)1 and sporulation genes, present as
signature biomarkers for various chemical assays. Recent advances on methodologies
such as Tb-DPA assays, micro-mass spectrometry, microelectromechanical systems,
microfluidics and optoelectronics offers novel technological possibilities for rapid,
automated and portable endospore detection with high sensitivity. Germination is a
process whereby endospores transition from a dormant state into a metabolically active
reproducing bacterial cell. Some methods take advantage of this fact by examining the
physiological changes in a sample upon introduction of endospore-specific dormancy-
breaking signals.
The intentional release of Bacillus anthracis spores via mail in 2001 has led to 22
cases of life-threatening anthrax infections. The potential catastrophe caused by
bioweapon disseminated by bacterial spores (hereinafter referred to as “spores”)
underscores the need for rapid and sensitive spore detection assays. The call for long-
term Mars missions by President Bush in 2004 is likely to tighten the stringency on
microbial monitoring in a closed-loop life support system and interplanetary spacecraft
bioburden reduction. Rapid spore detection technology will increase the confidence in
life detection data for Mars return missions and reduce the probability of contaminating
the Martian surface. The best spore detection instrument should be able to detect and
identify spores rapidly in complex matrix. The instrument should be portable, sensitive,
robust and amenable to a wide applicability with a minimum of false positives. The
advent of new fluorimetric and molecular biological methods, there has been a revival of
interest in spore research in recent years.

24
Currently, there is a new wave of research endeavor employing a comprehensive
suite of traditional and new methods to assess the viability of bacterial spores. Previous
review articles review microbial detection technologies with respect to specific detection
methods. The integration of endospore detection techniques, however, obscures the
differentiation among different approaches. Researchers often use a suite of different
analysis techniques to study spore behavior and properties. For instance, spores stained
by DNA-intercalating dyes can be assayed and observed by fluorimetric, cytometric and
microscopic methods. Therefore, instead of outlining each individual technique one by
one, emphasis will be put on the detection of physical constituent, morphology and
physiological processes associated with a single endospore. This review chapter
summarizes important advances in the detection of endospores organized in a way
following distinct biomarkers and physiological processes in the life cycle of a spore-
forming bacterium, from sporulation, activation, germination, to outgrowth and
vegetative phase. This placement is to highlight the contrast between culture-based and
culture-independent techniques.
2.3 Biomarker methods
Sporulation is a unicellular differentiation involving drastic morphological changes
associated with active biosynthesis and degradation. While the sporulation process has
been covered in Chapter 1, I will shed light on the unique chemical composition and
morphology of endospores as a means for detection. The detection methods outlined in
this section are direct observation of endospores morphology chemical assays on specific
biomarkers.
25
2.3.1 Calcium dipicolinate
The chemical composition and morphology of endospores differ from their progenitor
vegetative cells in many ways, highlighted by unique substances such as DPA and 1000-
fold concentration of calcium depot.
2.3.1.1 Intrinsic fluorescence
DPA and calcium always exist in a ratio of 1:1 in the spore protoplast with DPA
constituting 5% – 15% and calcium 1% – 3% of the dry weight, but Ca-DPA is otherwise
rare in nature2-4. Spores can be identified via the intrinsic fluorescence of Ca-DPA5. This
method does not rely heavily upon growth or metabolism of the organisms, but measure
intrinsic properties of the spores.
Alimova et al. have noted a change in fluorescence of Bacillus subtilis spores
over a period of 7 days with respect to the non-sporeforming bacteria Staphylococcus
aureus6. They hypothesize this is due to the emergence of the DPA fluorescence peak (λex
= 345 nm, λem = 410 nm) over the usual tryptophan. They also identified another
fluorescing species found only in spores, which was deduced to be a type of siderophore.
Clearly et al. have developed a method and prototype device for the detection of
spores on surfaces7. It uses multiple intrinsic fluorescence markers, including Ca-DPA,
and has a sensitivity of about 100 cells cm-2 on glass surface. Upon UV irradiation at 254
nm, Ca-DPA emits a characteristic spectrum at 406 nm8. Intrinsic fluorescence enables
non-intrusive determination of the analyte, which is a very desirable property in
environmental microbiology because one can detect the microbial content without
disturbing the microenvironment in which microbes reside. It also has a short detection
26
time and a large dynamic range contingent on the intensity of the excitation source.
Major drawbacks, however, include discrimination from the background fluorescence
and specificity. Ca-DPA can be extracted from spores via lysis or induction of
germination.
2.3.1.2 Surface-enhanced Raman spectroscopy
Ca-DPA can also be detected using surface-enhanced Raman spectroscopy on stable
silver films over nanosphere (AgFON) substrates where which the intensity of the Raman
vibration transitions of DPA is enhanced by several orders of magnitude. An UV
excitation enhances the bands due to the aromatic DPA molecule. The strongest peak of
Ca-DPA at 1020 cm-1 is used to correlate the surface-enhanced Raman intensity and
spore concentration. A limit of detection (LOD) of about 2.6 × 10³ spores with a data
acquisition period of 1 minute and a laser power of 50 mW was obtained. In another
publication, a portable surface-enhanced Raman spectroscopy device has yielded a
spectrum from 104 spores in 5 seconds, the first report result that utilizes a compact
vibrational spectrometer for the detection of Bacillus spores. The LOD is highly
contingent on the binding affinity of the silver surface and DPA. This method, however,
requires highly skilled personnel and the materials are relatively expensive and short-
lived because the silver nanosphere substrate has a limited shelf life.
2.3.1.3 Anti-Stokes Raman spectroscopy
Femtosecond adaptive spectroscopic techniques for coherent anti-Stokes Raman
spectroscopy (FAST CARS) can specifically target at DPA and the divalent cation
27
chelated with DPA. This method increases the resonant Roman signal strength of DPA by
maximizing the ground-state quantum coherence via matching laser pulses in the
femtosecond range9. Therefore, the coherence between two vibrational states of a
molecule is prepared with one set of laser pulse, and then probed with a higher frequency
in a coherent Raman configuration, making this assay orders of magnitude more sensitive
than incoherent Raman spectroscopy.
2.3.2 Dipicolinic acid
2.3.2.1 DPA extraction
DPA can be extracted by an acidified ethyl acetate phase separation method. A
suspension of endospores is boiled in 20 mL 3 N H2S04 for 15 minutes to release bound
DPA. An aliquot of about 3 mL of the suspension is transferred to a 125 mL separatory
funnel, with 15 volumes of ethyl ether added, and the whole flask is shaken for efficient
extraction. The partition coefficient between ether and water was found to be 0.46. The
ether phase containing the DPA is aliquoted out and the ethyl phase is allowed to
evaporate under room temperature. A small volume of water is added to the residue to
obtain a relatively pure concentrated DPA extract from endospores for further analysis.
On the other hand, high temperature, high pressure and physical rupture with glass beads
can also extract DPA from endospores.
2.3.2.2 DPA release via germination
DPA is released during the early stage of germination from endospores. Both chemical
and physical induction of germination has indicated the release of DPA. For instance,
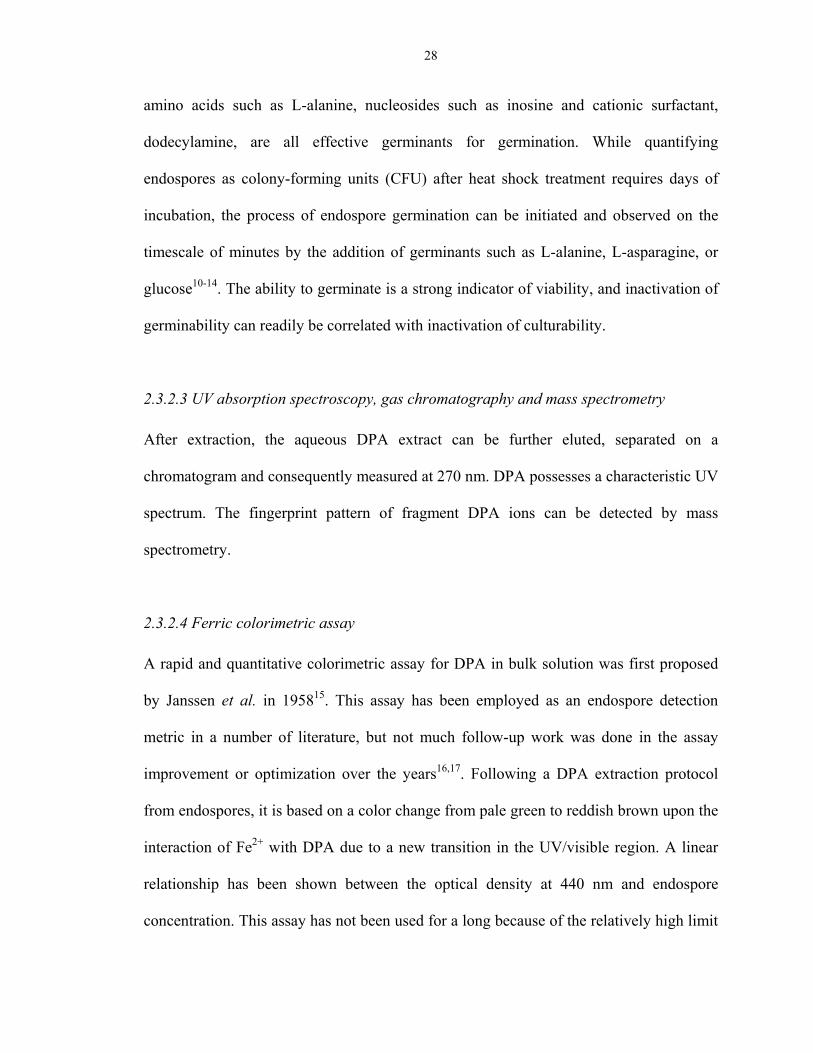
28
amino acids such as L-alanine, nucleosides such as inosine and cationic surfactant,
dodecylamine, are all effective germinants for germination. While quantifying
endospores as colony-forming units (CFU) after heat shock treatment requires days of
incubation, the process of endospore germination can be initiated and observed on the
timescale of minutes by the addition of germinants such as L-alanine, L-asparagine, or
glucose10-14. The ability to germinate is a strong indicator of viability, and inactivation of
germinability can readily be correlated with inactivation of culturability.
2.3.2.3 UV absorption spectroscopy, gas chromatography and mass spectrometry
After extraction, the aqueous DPA extract can be further eluted, separated on a
chromatogram and consequently measured at 270 nm. DPA possesses a characteristic UV
spectrum. The fingerprint pattern of fragment DPA ions can be detected by mass
spectrometry.
2.3.2.4 Ferric colorimetric assay
A rapid and quantitative colorimetric assay for DPA in bulk solution was first proposed
by Janssen et al. in 195815. This assay has been employed as an endospore detection
metric in a number of literature, but not much follow-up work was done in the assay
improvement or optimization over the years16,17. Following a DPA extraction protocol
from endospores, it is based on a color change from pale green to reddish brown upon the
interaction of Fe2+ with DPA due to a new transition in the UV/visible region. A linear
relationship has been shown between the optical density at 440 nm and endospore
concentration. This assay has not been used for a long because of the relatively high limit

29
of detection (around 1.8 mM) and the ferric dipicolinate complex is unstable unless with
the addition of a reducing agent such as ascorbic acid.
Metal-to-ligand charge transfer (MLCT) is a type of electronic transition
responsible for the intense color of many transition metal complexes. Divalent ferrous ion
is electron-rich and has a low oxidation state; DPA is a good π-acceptor ligand with low-
lying π* orbitals, which collectively favor an electron transition from the d orbitals of
Fe2+ to the empty π* orbitals of DPA (Figure 2.1). Charge transfer transitions are both
spin allowed and Laporte allowed, and therefore they are often thousand times much
intense than d-d transitions bands. A transfer of charge from Fe2+ to the aromatic DPA
resembles an internal redox reaction in which Fe2+ is oxidized to Fe3+. The original light
green Fe2+ will be changed to reddish brown upon charge redistribution with DPA, with a
large molar extinction coefficient 1000 to 50000 dm3 mol-1 cm-1.
2.3.2.5 Spectroscopy of Tb-DPA luminescence
The DPA release during germination can be observed with a spectroscopic analysis of
endospore viability based on Tb-DPA luminescence (i.e., spectroEVA). The Tb-DPA
luminescence assay was further optimized in 1999 by Hindle and Hall18 , who were able
to obtain a detection limit of 2 nM DPA and 104 Bacillus subtilis spores mL-1 with the
use of 1 M sodium acetate buffer (pH 5.6) with a concentration of 10 μM terbium
chloride. The pH of 5.6 was found to be most desirable, allowing for the highest
fluorescence intensity and longest fluorescence lifetime of the Tb(DPA)+ complex, while
still maintaining a balance between deprotonation of the DPA2- species and solubility of
the Tb3+ species. SpectroEVA is a spectroscopy-based endospore viability assay that
30
measures the germinable endospore concentrations in bulk suspension with Tb-DPA
luminescence intensities19 tabulated against a calibration curve using B. atrophaeus
spores, which contain an average 108 DPA molecules per spore. The total endospore
concentration may also be determined with spectroEVA by forcing DPA release by
physical lysis of the total endospore population (e.g., with autoclaving), which enables
the percentage of germinable endospores in a sample to be calculated. This was recently
demonstrated and validated in comparison to phase contrast microscopy results, and
successfully applied to environmental ice core samples from Greenland20, which
contained 295 ± 19 germinable spores mL-1 and 369 ± 36 total spores mL-1 (i.e., the
percentage of germination-capable endospores is 79.9% ± 9.3%). Results from side-by-
side comparison experiments using spectroEVA, phase contrast microscopy, and
traditional heterotrophic plate counts on B. atrophaeus suspensions showed that of the
total spore population, 49% ± 4% germinated as per spectroEVA, 54% ± 4% germinated
as per phase-bright to phase-dark transition, and 28% ± 7% produced visible colonies.
SpectroEVA was also applied to rapidly measure loss of spore germinability as a function
of UV exposure to determine the lethal dosage, and correlated this to loss in culturability.
These results show that spectroEVA can be used as a rapid alternative over standard
culture-based methods for monitoring the efficacy of sterilization processes.
2.3.2.6 Time-gated microscopy of Tb-DPA luminescence
The DPA release during germination can be observed with a direct microscopic analysis
of endospore viability based on Tb-DPA luminescence (i.e., microEVA or µEVA)20.
Rather than requiring full outgrowth before enumeration, we probe for viability much
31
earlier—during stage I germination when DPA is released and water begins to enter the
core. In µEVA experiments, individual germinable spores are counted in a microscope
field of view after germinant addition. As the spores germinate, 108 molecules of DPA
are released into the immediate area surrounding the spore. DPA combines with Tb3+ in
the matrix to form the Tb3+-DPA luminescence halos under UV excitation, and are
enumerated in a microscope field of view. The germinating spores manifest as bright
spots in the field of view that grow in intensity over a period of three to five minutes.
DPA release during germination resulted in bright luminescent spots due to Tb-DPA
complex formation with the Tb3+ that was present in the surrounding agarose medium.
Bacillus endospores are in standard use as biological indicators for evaluating the
effectiveness of sterilization processes. μEVA has been applied to monitor inactivation to
sterility of initial 5×10⁶ CFU endospore populations in aqueous suspension as a function
of thermal (95°C) and UV (254 nm, 22 μW cm-2) dosage. μEVA and culturing yielded
similar D-values for both inactivation methods; thermal inactivation D-values were 4.74
min and 4.80 min, respectively, while UV inactivation D-values were 30.52 minutes and
30.43 minutes, respectively.
2.3.3 DNA
Nucleic acids, the building blocks of DNA and RNA, are universally present in all living
cells and may be used as a general indicator of microbial biomass21. A disadvantage is
that viability cannot be determined.
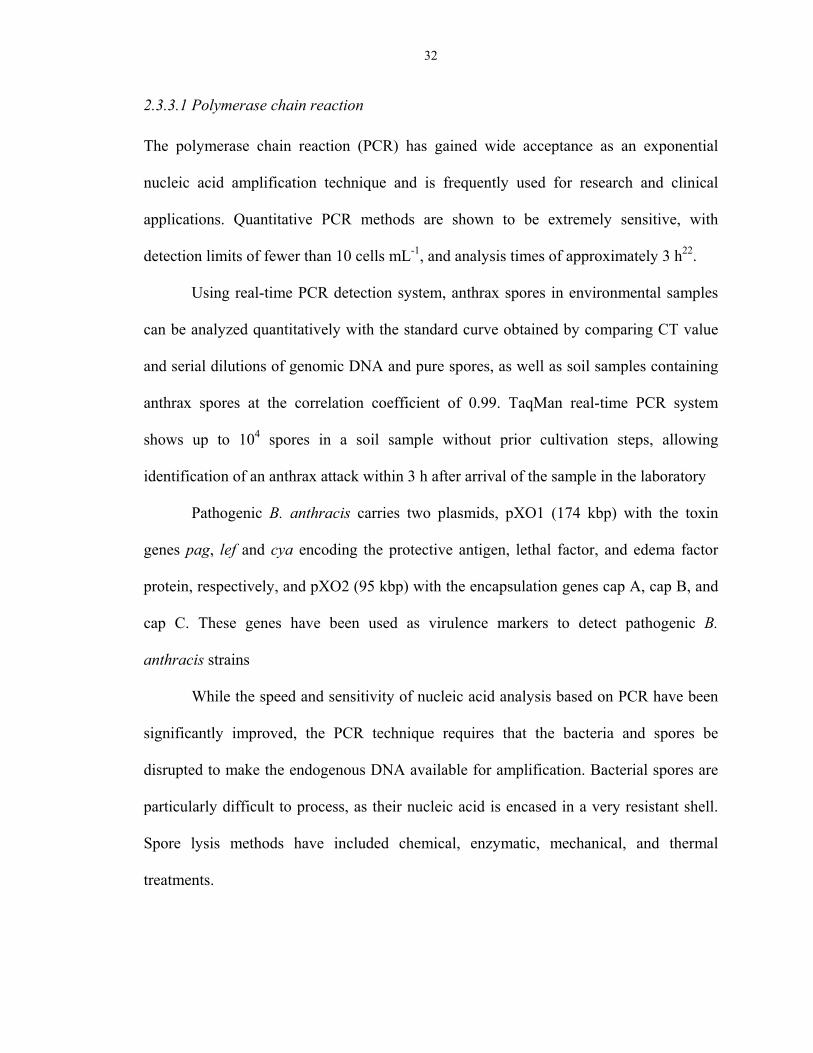
32
2.3.3.1 Polymerase chain reaction
The polymerase chain reaction (PCR) has gained wide acceptance as an exponential
nucleic acid amplification technique and is frequently used for research and clinical
applications. Quantitative PCR methods are shown to be extremely sensitive, with
detection limits of fewer than 10 cells mL-1, and analysis times of approximately 3 h22.
Using real-time PCR detection system, anthrax spores in environmental samples
can be analyzed quantitatively with the standard curve obtained by comparing CT value
and serial dilutions of genomic DNA and pure spores, as well as soil samples containing
anthrax spores at the correlation coefficient of 0.99. TaqMan real-time PCR system
shows up to 104 spores in a soil sample without prior cultivation steps, allowing
identification of an anthrax attack within 3 h after arrival of the sample in the laboratory
Pathogenic B. anthracis carries two plasmids, pXO1 (174 kbp) with the toxin
genes pag, lef and cya encoding the protective antigen, lethal factor, and edema factor
protein, respectively, and pXO2 (95 kbp) with the encapsulation genes cap A, cap B, and
cap C. These genes have been used as virulence markers to detect pathogenic B.
anthracis strains
While the speed and sensitivity of nucleic acid analysis based on PCR have been
significantly improved, the PCR technique requires that the bacteria and spores be
disrupted to make the endogenous DNA available for amplification. Bacterial spores are
particularly difficult to process, as their nucleic acid is encased in a very resistant shell.
Spore lysis methods have included chemical, enzymatic, mechanical, and thermal
treatments.

33
Lawrence Livermore National Laboratory scientists have also developed a four-
chamber, battery powered, handheld instrument referred to as the Handheld Advanced
Nucleic Acid Analyzer (HANAA)23. The HANAA is an instrument capable of rapid
detection and identification of biowarfare and bioterrorism agents in the field using a
TaqMan-based PCR assay. It is a highly automated device, able to automatically prepare
samples, then simultaneously test up to four different samples for two different DNA
sequences each, and report the results in about 30 min. The HANAA system could, in
principle, detect as few as 10 individual bacteria including B. anthracis. The total time of
spore disruption and detection using the minisonicator and the Advanced Nucleic Acid
Analyzer (ANAA) was less than 15 min.
2.3.3.2 Fluorescence coupled with peptide nucleic acid probes
A fast and ultrasensitive method has been developed by Castro and Okinaka24, and deals
with the detection of spore-specific nucleic acids and sequences. Two fluorescent probes
are used, each labeled with a different fluorescent tag specific to complimentary nucleic
acid base sequences of bacterial or viral origin in a sample. The sequence can be either
DNA or RNA, and can pertain to either a certain taxonomic group or a physiological
function of the target organism. Highly specific hybridization of the combined
fluorescent probes occurs in the presence of the target, leading to high sensitivity and low
background for simultaneous detection of both signals. This method was able to detect B.
anthracis in the presence of B. globigii with a low signal-to-noise ratio after 200 seconds,
and without a need for PCR.
34
2.4 Optical property and Stainability
2.4.1 Direct epifluorescent filtration technique
The principle of the direct epifluorescent filtration technique (DEFT) is that viable
microorganisms fluoresce (orange-red) when stained with acridine orange, whereas non-
viable cells do not25. Thus, examination and counting of cells under a fluorescent
microscope can provide a quantitative assessment of the number of viable cells present.
In practice, the liquid to be tested is filtered through a membrane filter, which is then
stained with acridine orange and examines microscopically26.
The method has been used on microbiological quality control, for the rapid
estimation of microbial counts in foods, beverages, poultry and for detecting organisms in
urine and in intravenous fluids. Couto & Hogg, due to problems with acridine orange,
used two fluorescers (a commercially available) – SYTO 9 and propidium iodide, as a
rapid detection method for bacteria in wine27. Using both the traditional plating methods
and the DEFT technique, inactivation’s kinetics were shown to be similar – i.e. not
method dependent. Decker, who compared several dye systems, also used SYTO 9 and
propidium iodide to examine the state of viability of Streptococcus sanguinis and
Strepcococcus mutans28.
In another study, the fluorochrome (acridine orange or diamidino-2-phenylindole)
is added to the filtered sample for a contact time of a few minutes and then filtered
through a polycarbonate membrane. The membrane is rinsed with a volume of distilled
equal to the original sample volume. The microorganisms are finally counted using
epifluorescence microscopy. Under UV light, acridine orange stains deoxyribonucleic
acid (DNA) green, and ribonucleic acid (RNA) is stained orange. Actively growing
35
bacteria can therefore be distinguished from inactive bacteria on the basis of their higher
RNA contents, monitoring germination of single Bacillus endospores in soil using direct
fluorescence microscopy acridine orange is used to stain the bacteria immobilized in the
sandwiches direct microscopy of endospore germination in vitro environments and in
complex soil microcosms.
2.4.2 Coulter counter
The Coulter counter manufactured by Coulter Electronics Inc. (Canada) has been widely
used to count endospores. A suspension of cells is passed through a small orifice that has
two electrodes suspended on either side. Resistance caused by the orifice is measured by
passing current between the electrodes. The pulse generated by each cell is amplified and
recorded electronically, giving a count of the number of cells flowing through the
aperture. Cells can be counted in the medium in which they are growing. Cell
concentrations must be kept low for accurate results since high cell densities limit the
accuracy by coincidence counts when more than one cell occupies the counting orifice.
This problem can be solved by diluting the cell suspension, taking care to avoid
shrinkage of cells due to osmotic stress. Endospore appear as phase bright bodies.
2.4.3 Method of Schaeffer and Fulton
The Schaeffer and Fulton method in staining endospores involves an acid pre-
treatment29,30. A smear of air dried sample was heat fixed on a microscope slide, covered
with a piece of blotting paper soaked with malachite green, and then placed over a boiling
water bath for 5 min. The overlying blotting paper is kept most by constant introduction
36
of malachite. The slide is then cooled down and washed with deionized water until no
residual green stain is left. Placed in a staining jar with safranin for 2 min, the slide is
rinsed until no residual red stain is left. The smear is examined using a 100× oil
immersion objective. Endospores are green-stained oval/round bodies and vegetative cell
will be stained red. This method is not quantitative due to unknown number of cells being
washed out during the staining procedure. If successfully stained, green endospores are
clearly apparent and compelling evidence for the presence of spores although, in practice,
this method has proved unreliable.
2.4.4 Phase contrast microscopy
The easiest and quickest way to demonstrating endospores in a culture in by phase
contrast microscopy using an oil-immersion objective with 60× or 100× magnification. In
simple native preparations highly refractile spores are easily seen as bright bodies within
or outside dark contrasted cells. Lipid globules or air bubbles which might be present
may have a somewhat similar appearance but are easily distinguished with some
experience. For better viewing (and for micro-photometry), it is sometimes useful to
immobilize cells and to keep them in focus by using agar coated microscope slides31.
This helps to better interpret shape and size of cells, sporangia and spores. This technique
also avoids tumbling motions of the cell, which can often result in vertically positioned
rod shaped cells which can then, then viewed “end-on,” resemble spores. Another
interesting method is the “acid popping” of spores32-34 where a fixed microscopic mount
is viewed while a strong acid is passed through the preparation. On contact with the acid,
37
spores will rehydrate and lose their high refractility and turn immediately from bright to
dark.
During the first stage of germination, water uptake and DPA release occurs
concurrently14,35,36. The water uptake can be observed by phase contrast microscopy as
the phase-bright endospores transition into phase-dark germinated spores. Endospores are
highly refractile round or oval structures formed within bacterial cells. During
germination spores change from bright to dark as viewed under a phase contrast
microscope37,38. Loss of refractility is due to the influx of water, swelling of cell and
excretion of dry matter from the germinating spore39,40. Phase contrast microscopy can be
carried out on a normal microscope slide-cover slip setup or on solidified agar covered
with a cover slip under an oil immersion objective. This technique has been applied to
observe germination of both Bacillus and Clostridium spores41-43.
The degree of spore refractility can be correlated to the course of germination,
which follows a biphasic kinetics44,45. In the first phase, spores change into partial phase
dark and lose part of the heat resistance. The proteinaceous coat becomes more porous,
leading to the hydrolysis of water and removal of calcium dipicolinate from the spore
core. The second phase marks the complete hydration of the spore core and degradation
of the spore cortex, which render the spore phase dark. Duration of germination depends
on a number of factors, such as species, inoculum size, germinants, temperature and the
optics used for observation. The reported phase transition for individual bacterial spores
ranges from 75 seconds to approximately an hour46,47. An inverse relationship has been
reported between the spore inoculum size and germination time48.
38
There are, however, some limitations inherent with this technique. For example,
lipid inclusions may be mistakenly assigned as spores because they are phase bright and
are about micron size. It is impossible to observe spores in environmental samples such
as soils without a rigorous separation process. Nevertheless, phase transition observed
under the microscope provides a strong evidence for spore germination. When used in
conjunction with other spore detection assays, phase contrast microscopy proves to be a
very useful validation test and provides total and germinable counts of spore
suspensions19.
2.4.5 Electron microscopy
The specialized technique involves the use of an electron microscope, the resolution of
which made it superior to the light microscope for the estimation of bacterial size. The
use of scanning electron microscopy for counting bacteria on membrane filters has been
reported previously. However, the use of electron microscopic techniques as a low-cost
rapid method for biomass estimation is unlikely to be realized due to the high cost of
instrumentation, the high operator skill required as well as the difficulty in producing
quantitative preparations.
2.4.6 Flow cytometry
Several reviews have appeared that discuss the principles of flow cytometry49,50. The
method has been used to evaluate antibacterial and antoprotozoal activity. In a typical
flow cytometry, individual particles pass through an illumination zone at the rate of
several thousand cells per second; appropriate detectors measure the magnitude of a pulse
39
representing the extent of light scattered. By ‘labeling’ the cells with fluorescent
molecules, e.g., an appropriate dye, that have high specificity to one particular cellular
constituent, it is possible to measure the content of that constituent51. Flow cytometry can
be used to detect viable and dead bacterial cells, and has been employed to assess the
lethal effects of biguanides and other biocides on spores.
2.5 Metabolism
All living cells respire and produce metabolites, each possessing unique intrinsic
fluorescence property. Although endospores elicit a non detectable level of metabolism,
metabolites such as reduced pyridine nucleotides, oxidized flavoproteins and ATP can
readily be detected during the later phase of germination and outgrowth. ATP can be
detected using a firefly luciferin/luciferase bioluminescence system. Other metabolites
can be detected based on their intrinsic fluorescence using microspectrofluorometry,
epifluorescence techniques. Multi wavelength intrinsic fluorescence detection enables
pattern recognition algorithms for microbial fingerprinting. Intrinsic fluorescence
markers
2.5.1 Impedance measurement
When bacteria grow, they produce metabolites which alter the conductivity of the
medium, a property first observed in 1898. With the use of modern electrical measuring
equipment, this nineteenth-century observation has been put to use as a rapid impedance
microbiology technique52. However, use of charged antimicrobials, such as silver ions or
cationic surfactant biocides, can lead to interpretive problems.

40
2.5.2 Microcalorimetry
Microcalorimetry, as a rapid analytical method for biocide testing, is based upon the
principle that bacteria and other microorganisms produce heat when they metabolize.
Microcalorimeters can detect the small amount of heat produced53. Any surviving cells,
following an inimical treatment, will, during subsequent incubation, metabolize and
produce heat. Morgan et al. used microcalorimetry to examine the effect of
antomicrobials on Streptococcus mutans and suggested that the data obtained by this
technique gave a “better indication of antimicrobial efficacy than merely determining
concentrations at which an antimicrobial agent is bacteriostatic or bactericidal”54.
The overall metabolic capacity, as measured by the heat released by cells, the
number of cells of a sample is dependent on the number of cells present and can be
measured using a microcalorimeter such as the Thermal Activity Monitor. Spores, after
induced to germinate, start actively metabolizing and produce heat which can be
measured using microcalorimetry.
2.5.3 ATP firefly luciferin-luciferase assay
Adenosine 5’triphosphate (ATP) is the primary source of chemical energy and a
ubiquitous energy currency in all living organisms. The use of a firefly (Photuris pyralis)
enzyme to quantify ATP in biological systems was first proposed by McElroy and
Strehler in the 1940s55,56. The detection is based on the conversion of chemical energy to
light energy during the breakdown of ATP. Firefly luciferase catalyzes the ATP-
dependent oxidative decarboxylation of luciferin in the presence of oxygen and

41
magnesium ions into AMP and light. One photon of light is produced per molecule of
ATP hydrolyzed when ATP is the limiting component in the reaction57. Measurement of
ATP is a direct indication of cellular metabolism and is often reckoned as a metric for
viability58,59.
First, nonmicrobial ATP is eliminated from the sample using a somatic cell
releasing agent and a subsequent incubation in apyrase or ATPase. Bacterial cells are
then disrupted using chemicals such as benzalkonium chloride. The ATP released is
quantified using the luciferin-luciferase reaction. A differential filtration procedure is also
reported to separate somatic from microbial cells60. Several different ATP reagents are
available commercially and the protocol has been optimized over the years. For instance,
a mutant luciferase resistant to benzalkonium chloride has been isolated to achieve
maximum extraction of intracellular ATP from microbes and inactivation of the ATP-
eliminating enzymes for removal of extracellular ATP61. Hattori et al. achieved a
detection limit of 7.7 cfu mL-1 using vegetative cells of B. subtilis, while Promega
Corporation reports a detection limit of 10 cfu mL-1 of vegetative cells of B. cereus.
Challenges are encountered in the detection of endospores using the
luciferin/luciferase system. While a vegetative bacterium contains approximately 10-17
mole of ATP per cell62, dormant spores of a number of Bacillus species have no
detectable biosynthetic or metabolic activity and contain low levels of ATP63-65. Kodaka
et al. reported that an endospore contains about 10-21 mole ATP per cell, four orders of
magnitude lower than that of a vegetative bacterium66. In addition, ATP cannot be
sufficiently extracted from endospores, unlike their vegetative counterparts, due to a
nonporous and hardy proteinaceous spore coat67-69. Theoretically speaking, if the current
42
luminometers can detect approximately ten vegetative bacilli cells per milliliter, the limit
of detection for endospores will be 105 endospores mL-1.
There are several approaches for endospore detection using the firefly luciferase
assay. One method is the screening for endospores by heat shock at 80°C for 15 minutes
allowing only spores to survive, followed by incubation and detection of ATP in the
subsequent outgrowth of vegetative cells. In this manner, bacterial outgrowth from
endospores on test strips was measured after five hours of incubation to validate the
sterilization efficiency of autoclaves70. This method is relatively faster than the traditional
cultivation method, but can only provide semi-quantitative counts of the original
endospore population.
Other approaches take advantage of the production of ATP from endospores
during germination. Less than 1% of the adenine nucleotide pool in spores is ATP, but it
accounts for 80% in vegetative cells. Most of the nucleotides in endospores are stored in
the form of 3-phosphoglyceric acid64. Nevertheless, within the first minute of
germination, the large depot of 3-phosphoglyceric acid is catabolized into ATP71. In
addition, coat porosity increases after the onset of germination, which permits easy
extraction of intracellular ATP72. Fujunami et al. measured a large increase in light
intensity of B. subtilis spores after 30 minutes of incubation in nutrient broth
supplemented with L-alanine in the presence of various white powders73. Rapid
accumulation of ATP upon nutrient induced germination also held true for anaerobic
Clostridium spores74.
Pressured-induced germination of B. subtilis at 100 MPa resulted in a rapid
production of ATP, but no ATP was formed during germination at 600 MPa75, while
43
hydrogen peroxide-treated spores can germinate, but accumulate very little ATP. The
mechanism of ATP accumulation during germination is still not very clear. Further study
may shed light on the subject of endospore viability and the phenomenon of germinable-
but-not-culturable.
Direct extraction of ATP from endospores is also another feasible method for
detection. Venkateswaran used ATP as a biomarker of viable microorganisms in clean-
room facilities. The use of benzalkonium chloride (Kikkoman International, Inc.)
completely lyzed vegetative cells and endospores in surface swab samples to release ATP
for detection. A low ATP-CFU ratio has been associated with endospores, ranging from
10-18 to 10-20 moles ATP per CFU76.
Compared with other endospore detection techniques, ATP bioluminescence
measurements offer many advantages, such as high sensitivity, large dynamic range, high
specificity, and rapidity. The luciferase assay can easily be automated for high throughput
processing. The instruments tend to be inexpensive, portable and can detect viable
bacteria in relatively complex media, such as powder and milk. False positives are rare
because the enzyme is highly specific for ATP, and ATP is lost rapidly upon cell death.
Nevertheless, the assay suffers from drawbacks such as a low level of ATP in endospores
and interference from extracellular and somatic ATP. Also the assay is not species-
specific and some food samples have been shown to contain inhibitory substances that
interfere with luciferase activity77.
At present, the ATP assay is mainly used to detect and enumerate vegetative cells
of pathogenic bacteria for food quality control and hygiene testing78. It has been used to
detect as few as 104 cfu mL-1 of bacteria in milk in five to ten minutes79, a bacterial
44
population of 105 cfu mL-1 in fruit juice80 and 5 × 10⁴ cfu g-1 in meat81. The application of
the ATP assay on endospore detection in foodstuffs is still in its initial phase. Because
endospores are the likely candidates for surviving pasteurization, steaming, and vacuum
processes, the ATP assay could be expected to play a bigger role in the detection of
pathogenic foodborne endospores in the future.
More recently, the ATP luciferase assay has shown promising results in detecting
anthrax spores. The lysin plyG, isolated from a phage that infects B. anthracis was used
to specifically target and lyse germinating B. anthracis spores causing a pronounced
release of intracellular ATP. ATP could be detected within 60 minutes of the addition of
germinants from as few as 100 spores using a phage sensitive B. cereus as a surrogate for
B. anthracis82. The ATP assay was also used to detect airborne bacterial spores. A
detection limit of 105 cfu mL-1 was reported using aerosolized B. globigii spores—a
surrogate for B. anthracis83. In a nutshell, the luciferin-luciferase reaction could
potentially be used for the detection of anthrax spores and validation of decontamination
regimes after an anthrax attack.
2.6 Biochemical tests
Biochemical tests are also among traditional microbiological methods for spore
identification and detection. Identification protocols have been developed for target
microbes. For instance, the following table outlines a series of biochemical and
cultivation tests to test the presence of B. anthracis. Based on the differential metabolic
requirement and cultivation requirement, spores can be detected and identified manually
or automatically.
45
Microbes interact with their environment; they metabolize nutrients in the media
and excrete waste products. An alternative to enumeration is to directly measure,
biochemically, the alterations in the microbial environment or microbial metabolism
following an inimical process. Quastel & Whetham studies the action of antimicrobials
on the dehydrogenases of E. coil84. The principle of triphenyltetrazolium chloride
reduction by bacteria was utilized by Hurwitz & McCarthy in developing a rapid test for
evaluating biocidal activity against E. coli. In essence, cells exposed to a biocide are
removed by filtrate, excess biocide quenched and the filter transferred to a growth
medium containing TTC85. During subsequent incubation at 37°C, formazan is extracted
and color development measured spectrophotometrically. The method permits a 2-3 log10
reduction cycle to be followed and inactivation kinetics to be calculated. The incubation
period takes about 4-5 h to provide a minimum detection level of 105 cfu mL-1.
MicroLog has developed BioLog plates to identify microorganisms based on
metabolism on 96 wells of various pre-dried carbon sources and nutrients. Positive
growth will turn the tetrazolium violet redox dye purple. A fingerprint of color change
across the 96 wells reflect the bacteria’s metabolic needs on various substrates and
susceptibility to antimicrobial agents. More than 8000 bacterial species can readily be
identified, including many of the Bacillus genus. Custom-made substrates can also be
prepared to identify specific species. Drawback of this method is that and long incubation
time is often necessary anaerobic species may present practical problems in oxygen
exclusion, and bacterial isolate has to be obtained a priori. A microbial identification
system developed by BioMérieuxhas shown success in identifying B. anthracis spores.
46
Fatty acid profiles from pure culture of spores serves as another biochemical test
for detection. Cellular fatty acids are first converted to fatty acid methyl esters, and
subsequently separated and identified using a gas chromatography. Bacillus spores can be
identified by this method86.
Each of these cultivation and biochemical tests are inherently time consuming,
depending on self amplification of the biological sample via growing and metabolism.
With the introduction of automation and miniaturization, detection time and technician
time are all greatly shortened.
2.7 Colony formation
Evaluation of spore count is based upon the ability of spores to grow in either a liquid
broth media or an agar gelled media or on the surface of a membrane filter after heat-
shock treatment. Viable count methods may be further divided into spread plate count,
membrane filter method and the most probable number (MPN) method. In the plate count
method, serial dilutions of the cell sample are spread onto agar plates which are
subsequently incubated at an appropriate growth temperature. The number of colonies is
counted and multiplied by the dilution factor to obtain viable count in terms of cfu mL-1
in the original sample. When counting anaerobic sporeformers it may be necessary to
treat diluents to remove dissolved air prior to use. The main disadvantage of the plate
count method is the long incubation period (typically 24-72 h and may be longer for
environmental species) and the difficulty of aseptic processing in the field.
47
2.7.1 Culturing (plate count and most probable number)
First of all, the inoculum will be heat shocked at 80°C for 15 minutes to select for
endospores. Enumeration of spore count is based upon the ability of spores to grow into a
visible colony on agar plates or turn turbid in liquid culture media. Advantage of viable
count is that it gives actual cell number and diversity of the sample under analysis.
Nevertheless, this method is very labor and material intensive and requires long elapse
time for completion. When analyzing environmental samples, the culturability may be as
low as 0.1% or 0.01%, known as the viable but not culturable (VBNC) phenomenon. So,
using cultivation-based methods tends to underestimate the total spore counts. Although
automatic plating is made possible, such as Petrifoss, the entire process may still take 24
hours to weeks, or maybe months for the growth of extremophilic spores. Depending on
the specific technique, membrane filter and most probable number methods, conventional
cultivation yields a limit of detection of around 10 viable cells per milliliter.
Recently, a miniaturized and multiplexed micro-cultivation method, coupled with
fluorescence microscopy, has been developed87. Micro-colony formation can be observed
in as short as 2 hours. 336 mini-compartments are etched on an aluminum oxide filter at a
density of 200/cm2, resting on top of nutrient agar, supports individual cell to grow.
2.7.2 Turbidity measurement
Turbidity is another widely used method for the estimation of cells in suspension. The
turbidity of a spore suspension can be determined using spectrophotometry by measuring
the light lost from the beam by scattering and absorption. The relationship used is Beer's
law but the term extinction coefficient is replaced by a constant called the turbidity
48
coefficient. A standard calibration curve of log Io/I against either the total count or the
dry weight is used. Transferring cells from one medium to another or washing the cells
can disturb the osmotic potential across the cell membrane. This may change the cell
surface area/volume ratio and refractive index and hence the turbidity, without altering
the cell count or total mass. The calibration curve applies only to a particular
microorganism grown under a particular set of growth conditions. If any change in the
growth conditions occurs a new curve must be prepared. In addition, cells grown in high
carbohydrate or fat media frequently have a high turbidity. This method is, however, not
compatible for determining number of spores in environmental samples.
2.8 Spore coat
Philips and Martin showed that it is possible to detect Bacillus spores with specificity
using fluorescent-conjugated polyclonal antibodies directed towards the spore coat, based
on the interaction between antibodies and bacterial spore cell surface antigens88-90.
Limitations of the technique are due to the test being specific to the particular
microorganism and serotype. In order to broaden the spectrum of the technique,
antibodies which are complementary to a range of microorganisms and different
serotypes need to be raised.
Cardosi et al. described a sensitive two-site, enzyme-linked immunoassay for
Clostridium perfringens phospholipase C (atoxin). The approach incorporated an
electrochemical detection step based on thin-layer hydrodynamic voltammetry coupled
with fast liquid chromatography with electrochemical analysis (LCEC).
49
2.8.1 Immunoassay and Flow cytometry
Stopa was able to obtain a detection limit of approximately 103 colony-forming units
cfu mL-1 for B. anthracis using flow cytometry in conjunction with a rapid
immunoassay91. The advantages of using flow cytometry include: (1) combination of
scatter signal and fluorescence intensity to enhance selectivity and distinguish between
related strains, reducing false positives, and (2) limiting detection to a certain
fluorescence intensity allows for further constraints to be placed on samples ordinarily
labeled as positive, resulting in higher specificity. For instance, B. anthracis could be
distinguished from B. subtilis var. niger, though B. megaterium and B. thuringensis were
not resolvable.
2.8.2 Immunofluorescence resonance energy transfer
Bruno et al. reports new immunofluorescence resonance energy transfer (immuno-FRET)
assays for the detection of B. cereus spores and E. coli vegetative cells. Both utilize dual
labels – one fluorescent and one quencher – such that the fluorescence of the former is
quenched by the latter when both are bound to the spore or cell. Limits of detection for
both spores and cells were in the 105 spores/cells mL-1 range, with a detection time of less
than 30 minutes.
Zahavy et al. have also adapted FRET to an immunofluorescence method to
detect bacterial spores92. Coupling FRET to an immunoassay minimizes the potential for
false positives, as two different reporter molecules are required to label the antigen
surface. The system was tested with B. anthracis spores, and selectivity was improved by
a factor of 10 with respect to B. thuringiensis subsp. Istraelensis and 100 with respect to
50
B. subtilis. It is mentioned that using multiple labeled polyclonal antibody molecules
against different determinants of the spore may enhance selectivity further.
2.9 Spore detection instruments
Yung et al. have developed a fully automated anthrax smoke detector (ASD)93-95. The
ASD is intended to serve as a cost-effective front-end monitor for anthrax surveillance
systems. The principle of operation is based on measuring airborne endospore
concentrations, where a sharp concentration increase signals an anthrax attack. The ASD
features an air sampler, a thermal lysis unit, a syringe pump, a time-gated spectrometer,
and endospore detection chemistry comprised of dipicolinic acid (DPA)-triggered
terbium ion (Tb3+) luminescence. Anthrax attacks were simulated using aerosolized B.
atrophaeus spores in fumed silica, and corresponding Tb-DPA intensities were monitored
as a function of time and correlated to the number of airborne endospores collected. A
concentration dependence of 102-106 spores mg-1 of fumed silica yielded a dynamic range
of 4 orders of magnitude and a limit of detection of 16 spores L-1 when 250 L of air were
sampled. Simulated attacks were detected in less than 15 minutes. A comparison between
ASD and PCR-based detectors performance has been summarized in Figure 2.2.
Eversole et al. have demonstrated a prototype single particle fluorescence analyzer
(SPFA) to simultaneously monitor ambient concentrations of both biological and
nonbiological aerosols96. The instrument pulls air through a nozzle at approx. 300 liters
per minute and monitors particles between 1 and 10 µm in diameter in situ using laser-
induced excitation and detection of two specific bands: UV (300–400 nm) and visible
(400–600 nm). Discrimination between biological and nonbiological aerosols is effected
51
through comparison of these emission intensities to a calibrated reference. The latest
outdoor field testing of the instrument resulted in a detection probability of 87% for the
target aerosols ova albumin, MS-2 phage, Erwinia herbicola vegetative cells and B.
subtilis spores, with airborne concentrations of 5 particles per liter. Further, the absolute
quantitative detection efficiencies for individual biological aerosols all averaged over
70%, with the measurement response time proportional to the particle measurement rate.
Agranovski et al. have devised an instrument for real-time continuous monitoring of
bioaerosols called the Ultraviolet Aerodynamic Particle Size Spectrometer (UVAPS)97.
The instrument is capable of providing time-of-flight, light scattering and fluorescence
measurements for particles ranging from 0.5 to 15 µm in diameter. Aerosolized spores
(Bacillus subtilis), vegetative cells (B. subtilis, Pseudomonas fluorescens) and non-
bacterial elements (NaCl, latex, peptone water, nutrient agar) were all used to test the
selectivity, sensitivity, efficiency and limit of detection of the instrument. Results
indicated that the UVAPS was able to detect bacterial spores with limited capability, and
only the B. subtilis vegetative cells produced a strong fluorescent signal, with a limit of
detection of approximately 107 particles m-3. Further, strong false positives from
nonbacterial elements were also observed. Particle counting efficiency depends on
particle concentration, and has a “saturation” level of 106 particles m-3.
Another instrument designed and tested by McBride et al., called the fully
autonomous pathogen detection system (APDS), is capable of continuous monitoring for
bioaerosols98. The instrument is composed of an aerosol collector, a fluidics module for
sample preparation and immunoassay detection using a flow cytometer. The
immunoassay uses a sandwich format, where antigen-specific antibodies immobilized on
52
beads bind the analyte, which is then detected using secondary fluorescently labeled
antibodies. This analysis requires 60 s to complete. The system was tested with release of
B. anthracis and Yersinia pestis, both of which it was able to detect with no false
positives. Plus, with a collection interval of 30 to 60 min and a capability of continuous
unattended operation for 8 days, the system can be easily integrated into a central security
network. The system will ultimately utilize an orthogonal detection approach including
antibody-based (immunoassays) and nucleic acid-based (PCR) assays to reduce false
positives.
An instrument developed by Cheng et al., is used to aerosolize bacterial spores to
improve fluorescence detection of aerosols99. As opposed to using only single-excitation
wavelength approaches, the authors utilize multiple wavelengths of excitation and
fluorescence detection. The system, including an aerosol generator, chamber, aerosol
monitoring instrumentation and laser-induced fluorescence detection system, was able to
obtain fluorescence measurements on Escherichia coli, Staphylococcus aureus, Bacillus
subtilis var. niger, and Bacillus thuringiensis, but was not able to distinguish between
them.
Brosseau et al., utilize the autofluorescent chemicals naturally found in bacteria
(spore and vegetative cells) and fungi, such as riboflavin, nicotinamide adenine
dinucleotide phosphate (NADPH) and tryptophan, to detect biological aerosols100.
Nebulized spores and bacterial cells of Bacillus subtilis subsp. niger, as well as various
other bacteria and even fungal spores were evaluated using an Ultraviolet Aerodynamic
Particle Sizer (UV-APS). It was found that fluorescence appears to be species-dependent,
but identification of bioaerosols was made difficult due to high variability.
53
Scientists at Lawrence Livermore National Laboratory have also invented a stand-
alone system for rapid, continuous monitoring of multiple airborne biological threat
agents in the environment. This system, the autonomous pathogen detection system
(APDS), acts as a biological “smoke alarm” and is targeted for domestic applications in
which the public is at high risk of exposure to covert releases of bioagent (such as mass
transit, office complexes, and convention centers), and as part of a monitoring network
for urban areas and major gatherings.
The APDS is completely automated, offering aerosol sampling, in-line sample
preparation fluidics, multiplex flow cytometer detection and identification assays, and
orthogonal, flow-through PCR (nucleic acid) amplification and detection. For the flow-
cytometry subsystem, small “capture” beads 5 µm in diameter are coated with antibodies
specific to the target pathogens. The beads are color-coded according to which antibodies
they hold. Once the pathogens attach to their respective antibodies, more antibodies
(labeled with a fluorescent dye), are added to the mixture. A labeled antibody will stick to
its respective pathogen, creating a sort of bead sandwich—antibody, pathogen, and
labeled antibody. The beads flow one by one through a flow cytometer, which illuminates
each bead in turn with a laser beam. Any bead with labeled antibodies will fluoresce. The
system can then identify which agents are present, depending on the color of the capture
bead.
Advantages include:(1) the ability to measure up to 100 different agents and controls
in a single sample; (2) the flexibility and ease with which new bead-based assays can be
developed and integrated into the system; (3) low false-positive and false-negative
detection due to the presence of two orthogonal detection methods; (4) the ability to use
54
the same basic system components for multiple deployment architectures; (v) the
relatively low cost per assay and minimal consumables.
2.10 Conclusion
Endospores have been the focus of intense research for decades and their detection
technique can be summarized as a 3-pronged approach. Pasteurization is firstly used to
prove the existence of and select for endospores from a sample. Direct recognition and
demonstrate of endospore morphology and cellular components can be achieved, with
delicate heat or acid pretreatment, using microscopic, fluorimetric and cytometric
methods. Analyses of the physiological changes associated with a pasteurized microbial
population as responses to dormancy-breaking and germinative signals are good metrics
to assess endospore viability. In general, individual methods suffer from various
disadvantages that include a lengthy analysis time; high cost of instrumentation; lack of
sensitivity; and lack of amenability to the online monitoring and interfering
characteristics of environmental samples. Despite the significant improvements that have
been made, there is still no ideal biosensor for the detection of endospores. However,
determination of DPA has promising results in recent years and can be a potential
keynote endospore detection method in the future. True in other scientific fields, a
combination of the aforementioned methods is usually entailed to increase our degree of
confidence. In conclusion, this chapter reviews the detection technology of the spore-
forming members of Bacillus and related genera, which are capable of producing a
resting cell structure called endospores to survive extremes of time and environment.
55
2.11 References
1. Fahmy, F., Mayer, F., and Claus, D. Endospores of Sporosarcina halophila: characteristics and ultrastructure. Archives of Microbiology 140, 338-342 (1985).
2. Powell, J.F. and Strange, R.E. Biochemical changes occurring during sporulation in Bacillus species. Journal of Biochemistry 63, 661-668 (1956).
3. Murrell, W.G., in The Bacterial Spore, edited by G. W. Gould (Academic Press, New York, 1969), pp. 245-270. 4. Thompson, R.S. and Leadbetter, E.R. On the isolation of dipicolinic acid form endospores of Sarcina ureae.
Archives of Microbiology 45, 27-32 (1963). 5. Sarasanandarajah, S., Kunnil, J., Bronk, B.V., and Reinisch, L. Two-dimensional multiwavelength fluorescence
spectra of dipicolinic acid and calcium dipicolinate. Applied Optics 44, 1182-1187 (2005). 6. Alimova, A. et al. Native fluorescence and excitation spectroscopic changes in Bacillus subtilis and
Staphylococcus aureus bacteria subjected to conditions of starvation. Applied Optics 42, 4080-4087 (2003). 7. Cleary, F.C., Lloyd, C.R., and Powers, L., presented at the Molecular, Cellular and Tissue Engineering, 2002.
Proceedings of the IEEE-EMBS Special Topic Conference on, 2002 (unpublished). 8. Nudelman, R., Bronk, B. V., Efrima, S. Fluorescence emission derived from dipicolinic acid, its sodium, and its
calcium salts. Applied Spectroscopy 54, 445-449 (2000). 9. Scully, M.O. et al. FAST CARS: Engineering a laser spectroscopic technique for rapid identification of bacterial
spores. Proceedings of the National Academy of Sciences of the United States of America 99, 10994-11001 (2002). 10. Hills, G.M. Chemical factors in the germination of spore-bearing aerobes - the effect of yeast extract on the
germination of Bacillus anthracis and its replacement by adenosine. Biochemical Journal 45, 353-362 (1949). 11. Hills, G.M. Chemical factors in the germination of spore-bearing aerobes - the effects of amino acids on the
germination of Bacillus anthracis, with some observations on the relation of optical form to biological activity. Biochemical Journal 45, 363-370 (1949).
12. Hills, G.M. Chemical factors in the germination of spore-bearing aerobes - observations on the influence of species, strain and conditions of growth. Journal of General Microbiology 4, 38-47 (1950).
13. Setlow, P. Germination and outgrowth. The Bacterial Spore, vol. II, G. W. Gould and A. Hurst (ed.), 211-254 (1983).
14. Gould, G.W. and Hurst, A., The Bacterial Spore. (Academic Press, New York, 1969). 15. Janssen, F.W., Lund, A.J., and Anderson, L.E. Colorimetric assay for dipicolinic acid in bacterial spores. Science
127, 26-27 (1958). 16. Morimoto, I. and Tanaka, S. Spectrophotometric determination of iron with 2,6-pyridinedicarboxylic acid and
2,4,6-pyridinecarboxylic acid. Analytical Chemistry 35, 141-144 (1963). 17. Rotman, Y. and Fields, M.L. Chemical composition and heat resistance of Bacillus strearothermophilus spores.
Journal of Food Science 34, 345 (1969). 18. Hindle, A.A., Hall, E. A. H. Dipicolinic acid (DPA) assay revisited and appraised for spore detection. Analyst 124,
1599-1604 (1999). 19. Shafaat, H.S. and Ponce, A. Applications of a rapid endospore viability assay for monitoring UV inactivation and
characterizing Arctic ice cores. Applied and Environmental Microbiology 72, 6808-6814 (2006). 20. Yung, P.T., Shafaat, H.S., Connon, S.A., and Ponce, A. Quantification of viable endospores from a Greenland ice
core. FEMS Microbiology Ecology 59, 300-306 (2007). 21. Singh, A., Kuhad, R.C., Sahai, V., and Ghosh, P. Evaluation of biomass. Advances in biochemical
engineering/biotechnology. 51, 47-70 (1994). 22. Heid, C.A., Stevens, J., Livak, K.J., and Williams, P.M. Real time quantitative PCR. Genome Research 6, 986
(1996). 23. Higgins, J.A. et al. A handheld real time thermal cycler for bacterial pathogen detection. Biosensors &
Bioelectronics 18, 1115-1123 (2003). 24. Castro, A. and Okinaka, R.T. Ultrasensitive, direct detection of a specific DNA sequence of Bacillus anthracis in
solution. Analyst 125, 9-11 (1999). 25. Pettipher, G.L. and Rodrigues, U.M. Rapid enumeration of bacteria in heat-treated milk and milk products using a
membrane filtration-epifluorescent microscopy technique. Journal of Applied Microbiology 50, 157-166 (1981). 26. Pettipher, G.L. Review: The direct epifluorescent filter technique. International Journal of Food Science and
Technology 21, 535-546 (1986). 27. Couto, J.A. and Hogg, T. Evaluation of a commercial fluorochromic system for the rapid detection and estimation
of wine lactic acid bacteria by DEFT. Letters in Applied Microbiology 28, 23-26 (1999). 28. Decker, E.M. The ability of direct fluorescence-based, two-colour assays to detect different physiological states of
oral streptococci. Letters in Applied Microbiology 33, 188-192 (2001). 29. Schaeffer, A.B. and Fulton, M.D. A simplified method of staining endospores. Science 77, 194-194 (1933). 30. Bartholomew, J.W. and Mittwer, T. A simplified bacterial spore stain. Biotechnic and Histochemistry 25, 153-156
(1950).
56
31. Claus, D. and Berkeley, R.C.W., in Bergey's Manual of Systematic Bacteriology, edited by P. H. A. Sneath, N. S. Mair, M. E. Sharpe et al. (The Williams & Wilkins Co., Baltimore, 1986), Vol. 2, pp. 1105-1139.
32. Warth, A.D. Liquid chromatographic determination of dipicolinic acid from bacterial spores. Applied and Environmental Microbiology 38, 1029-1033 (1979).
33. Fitz-James, P.C., Robinow, C.F., and Bergold, G.H. Acid hydrolysis of the spores of B. cereus; a correlation of chemical and cytological findings. Biochimica et Biophysica Acta 14, 346-355 (1954).
34. Robinow, C.F. Observations on the structure of Bacillus spores. Journal of General Microbiology 5, 439-457 (1951).
35. Woese, C. and Morowitz, H.J. Kinetics of the release of dipicolinic acid from spores of Bacillus subtilis. Journal of Bacteriology 76, 81-83 (1958).
36. Sacks, L.E. Chemical germination of native and cation-exchanged bacterial spores with trifluoperazine. Applied and Environmental Microbiology 56, 1185-1187 (1990).
37. Powell, E. The appearance of bacterial spores under phase-contrast illumination. Journal of Applied Bacteriology 3, 342-348 (1957).
38. Pulvertaft, R.J.V. and Haynes, J.A. Adenosine and spore germination: phase contrast studies. Journal of General Microbiology 5, 657-663 (1951).
39. Lewis, J.C., Snell, N.S., and Burr, H.K. Water permeability of bacterial spores and the concept of a contratile cortex. Science 132, 544-545 (1960).
40. Ross, K.F.A. and Billing, E. Journal of General Microbiology 13, 119 (1957). 41. Rowley, D.B. and Feeherry, F. Conditions affecting germination of Clostridium botulinum 62A spores in a
chemically defined medium. Journal of Applied Bacteriology 104, 1151-1157 (1970). 42. Levinson, H.S. and Hyatt, M.T. Sequence of events during Bacillus megaterium spore germination. Journal of
Bacteriology 91, 1811-1818 (1966). 43. Hitchins, A.D., Kahn, A.J., and Slepecky, R.A. Interference contrast and phase contrast microscopy of sporulation
and germination of Bacillus megaterium. Journal of Bacteriology 96, 1811-1817 (1968). 44. Vary, J.C. and Halvorson, H.O. Kinetics of germination of Bacillus spores. Journal of Bacteriology 89, 1340-
1347 (1965). 45. Hashimoto, T., Frieben, W.R., and Conti, S.F. Microgermination of Bacillus cereus spores. Journal of
Bacteriology 100, 1385-1392 (1969). 46. Hashimoto, T., Frieben, W.R., and Conti, S.F. Germination of single bacterial spores. Journal of Bacteriology 98,
1011-1020 (1969). 47. Leuschner, R.G.K. and Lillford, P.J. Effects of temperature and heat activation on germination of individual
spores of Bacillus subtilis. Letters in Applied Microbiology 29, 228-232 (1999). 48. Caipo, M., Duffy, S., Zhao, L., and D., S. Bacillus megaterium spore germination is influenced by inoculum size.
Journal of Applied Microbiology 92, 879-884 (2002). 49. Lloyd, D., Flow Cytometry in Microbiology. (Springer-Verlag, New York, 1993). 50. Davey, H.M. and Kell, D.B. Flow cytometry and cell sorting of heterogeneous microbial populations: the
importance of single-cell analyses. Microbiology and Molecular Biology Reviews 60, 641 (1996). 51. Shapiro, H.M., in Flow Cytometry for Biotechnology, edited by L. A. Sklar (Oxford University Press, 2005). 52. Silley, P. and Forsythe, S. Impedance microbiology - a rapid change for microbiologists. Journal of Applied
Microbiology 80, 233-243 (1996). 53. Beezer, A.E., Biological Microcalorimetry. (New York: Academic Press, London, 1980). 54. Morgan, T.D., Beezer, A.E., Mitchell, J.C., and Bunch, A.W. A microcalorimetric comparison of the anti-
Streptococcus mutans efficacy of plant extracts and antimicrobial agents in oral hygiene formulations. Journal of Applied Microbiology 90, 53-58 (2001).
55. McElroy, W.D. The energy source for bioluminescence in an isolated system. PNAS 33, 342-345 (1947). 56. McElroy, W.D. Factors influencing the response of the bioluminescent reaction to ATP. Archives of Biochemistry
22, 420 (1949). 57. Karl, D.D.M. Cellular nucleotide measurements and applications in microbial ecology. Microbiological reviews
44, 739-796 (1980). 58. Chappelle, E.W. and Levin, G.V. Use of the firefly bioluminescence reaction for rapid detection and counting of
bacteria. Biochem. Med 2, 41-52 (1968). 59. Thore, A.A., Ansehn, S.S., Lundin, A.A., and Bergman, S.S. Detection of bacteriuria by luciferase assay of
adenosine triphosphate. Journal of clinical microbiology 1, 1-8 (1975). 60. Cross, J. Harnessing the firefly. Food Manufacture 67, 25 (1992). 61. Hattori, N.N. et al. Enhanced microbial biomass assay using mutant luciferase resistant to benzalkonium chloride.
Analytical biochemistry 319, 287-295 (2003). 62. Philip, E.S. A review of bioluminescent ATP techniques in rapid microbiology. Journal of Bioluminescence and
Chemiluminescence 4, 375-380 (1989). 63. Church, B.D. and Halvorson, H. Intermediate metabolism of aerobic spores: I. Activation of glucose oxidation in
spores of Bacillus cereus var terminalis. Journal of Bacteriology 73, 470-476 (1957).

57
64. Setlow, P. and Kornberg, A. Biochemical studies of bacterial sporulation and germination. XXII. Energy metabolism in early stages of germination of Bacillus megaterium spores. Journal of Biological Chemistry 245, 3637-3644 (1970).
65. Setlow, P. and Kornberg, A. Biochemical studies of bacterial sporulation and germination. XXIII. Nucleotide metabolism during spore germination. Journal of Biological Chemistry 245, 3645-3652 (1970).
66. Kodaka, H., Fukuda, K., Mizuochi, S., and Horigome, K. Adenosine triphosphate content of microorganisms related with food spoilage. Japanese Journal of Food Microbiology 13, 29-34 (1996).
67. Jenkinson, H.F., Kay, D., and Mandelstam, J. Temporal dissociation of late events in Bacillus subtilis sporulation from expression of genes that determine them. J. Bacteriol. 141, 793-805 (1980).
68. Makino, S., Ito, N., Inoue, T., Miyata, S., and Moriyama, R. A spore-lytic enzyme released from Bacillus cereus spores during germination. Microbiology 140, 1403-1410 (1994).
69. Henriques, A.O. and Moran, C.P. Structure and assembly of the bacterial endospore coat. Methods: A Companion to Methods in Enzymology 20, 95-110 (2000).
70. Webster, J.J., Walker, B.G., Ford, S.R., and Leach, F.R. Determination of sterilization effectiveness by measuring bacterial growth in a biological indicator through firefly luciferase determination of ATP. Journal of Bioluminescence and Chemiluminescence 2, 129-133 (1998).
71. Singh, R.P., Setlow, B., and Setlow, P. Levels of small molecules and enzymes in the mother cell compartment and the forespore of sporulating Bacillus megaterium. Journal of Bacteriology 130, 1130-1138 (1977).
72. Santo, L.Y. and Doi, R.H. Ultrastructural analysis during germination and outgrowth of Bacillus subtilis spores. Journal of Bacteriology 120, 475-481 (1974).
73. Fujinami, Y. et al. Sensitive detection of bacteria and spores using a portable bioluminescence ATP measurement assay system distinguishing from white powder materials Journal of Health Science 50, 126-132 (2004).
74. Hausenbauer, J.M., Waites, W.M., and Setlow, P. Biochemical properties of Clostridium bifermentans spores. Journal of Bacteriology 129, 1148-1150 (1977).
75. Wuytack, E.Y., Boven, S., and Michiels, C.W. Comparative study of pressure-induced germination of Bacillus subtilis spores at low and high pressures. Applied and Environmental Microbiology 64, 3220-3224 (1998).
76. Venkateswaran, K., Hattori, N., La Duc, M.T., and Kern, R. ATP as a biomarker of viable microorganisms in clean-room facilities. Journal of Microbiological Methods 52, 367-377 (2003).
77. Leach, F.R. and Webster, J.J. Commercially available firefly luciferase reagents. Methods in Enzymology 133, 51-70 (1986).
78. Griffiths, M.W. The role of ATP bioluminescence in the food industry: New light on old problems. . Food Technology 50, 64-66 (1996).
79. Griffiths, M.W. Applications of bioluminescence in the dairy industry. Journal of Dairy Science 76, 3118-3125 (1993).
80. Ugarova, N.N., Brovko, Y.L., and Kutuzova, G.D. Bioluminescence and bioluminescent analysis: recent development in the field. Biokhimiya 58, 1351-1372 (1993).
81. Basol, M.S. and Gogus, U. Methods of antibiotic applications related to microbiological quality of lamb by PCA and bioluminescence. Journal of Food Science 61, 348-349 (1996).
82. Schuch, R., Nelson, D., and Fischetti, V.A. A bacteriolytic agent that detects and kills Bacillus anthracis. Nature 418, 884-889 (2002).
83. Stopa, P.J., Tieman, D., Coon, P.A., Milton, M.M., and Paterno, D. Detection of biological aerosols by luminescence techniques. Field Analytical Chemistry & Technology 3, 283-290 (1999).
84. Quastel, J.H. and Whetham, M.D. Dehydrogenations produced by resting Bacteria. I. Biochem. J 19, 520 (1925). 85. Hurwitz, S.J. and McCarthy, T.J. 2, 3, 5-Triphenyltetrazolium chloride as a novel tool in germicide dynamics.
Journal of Pharmaceutical Sciences 75, 912-916 (1986). 86. Song, J.M., Culha, M., Kasili, P.M., Griffin, G.D., and Vo-Dinh, T. A compact CMOS biochip immunosensor
towards the detection of a single bacteria. Biosens Bioelectron 20, 2203-2209 (2005). 87. Jago, P.H. et al. An evaluation of the performance of ten commercial luminometers. Journal of Bioluminescence
and Chemiluminescence 3, 131-145 (1989). 88. Phillips, A.P. and Martin, K.L. Immunofluorescence analysis of Bacillus spores and vegetative cells by flow
cytometry. Cytometry 4, 123-131 (1983). 89. Phillips, A.P. and Martin, K.L. Dual-par arnet er scatter-flow immunofluorescence analysis of Bacillus spores.
Cytometry 6, 124-129 (1985). 90. Phillips, A.P. and Martin, K.L. Investigation of spore surface antigens in the genus Bacillus by the use of
polyclonal antibodies in immunofluorescence tests. Journal of Applied Microbiology 64, 47-55 (1988). 91. Stopa, P.J. The flow cytometry of Bacillus anthracis spores revisited. Cytometry 41, 237-244 (2000). 92. Zahavy, E., Fisher, M., Bromberg, A., and Olshevsky, U. Detection of frequency resonance energy transfer pair
on double-labeled microsphere and Bacillus anthracis spores by flow cytometry. Applied and Environmental Microbiology 69, 2330-2339 (2003).
93. Lester, E.D. and Ponce, A. An anthrax "smoke" detector: Online monitoring of aerosolized bacterial spores. IEEE Engineering in Medicine and Biology Magazine 21, 38-42 (2002).
58
94. Yung, P.T., Lester, E.D., Bearman, G., and Ponce, A. An automated front-end monitor for anthrax surveillance systems based on the rapid detection of airborne endospores. Biotechnology and Bioengineering 98, 864-871 (2007).
95. Lester, E.D., Gregory, B., and Ponce, A. A second-generation anthrax "smoke detector". IEEE Engineering in Medicine and Biology Magazine 23, 130-135 (2004).
96. Eversole, J.D. Continuous bioaerosol monitoring using UV excitation fluorescence: Outdoor test results. Field Analytical Chemistry and Technology 5, 205-212 (2001).
97. Agranovski, V., Ristovski, Z., Hargreaves, M., Blackall, P. J., Morawska, L. Performance evaluation of the UVAPS: influence of physiological age of airborne bacteria and bacterial stress. Journal of Aerosol Science 34, 1711-1727 (2003).
98. McBride, M.T. et al. Autonomous detection of aerosolized Bacillus anthracis and Yersinia pestis. Analytical Chemistry 75, 5293-5299 (2003).
99. Cheng, Y.S. Detection of bioaerosols using multiwavelength UV fluorescence spectroscopy. Aerosol Science and Technology 30, 186-201 (1999).
100. Brosseau, L.M. Differences in detected fluorescence among several bacterial species measured with a direct-reading particle sizer and fluorescence detector. Aerosol Science and Technology 32, 545-558 (2000).
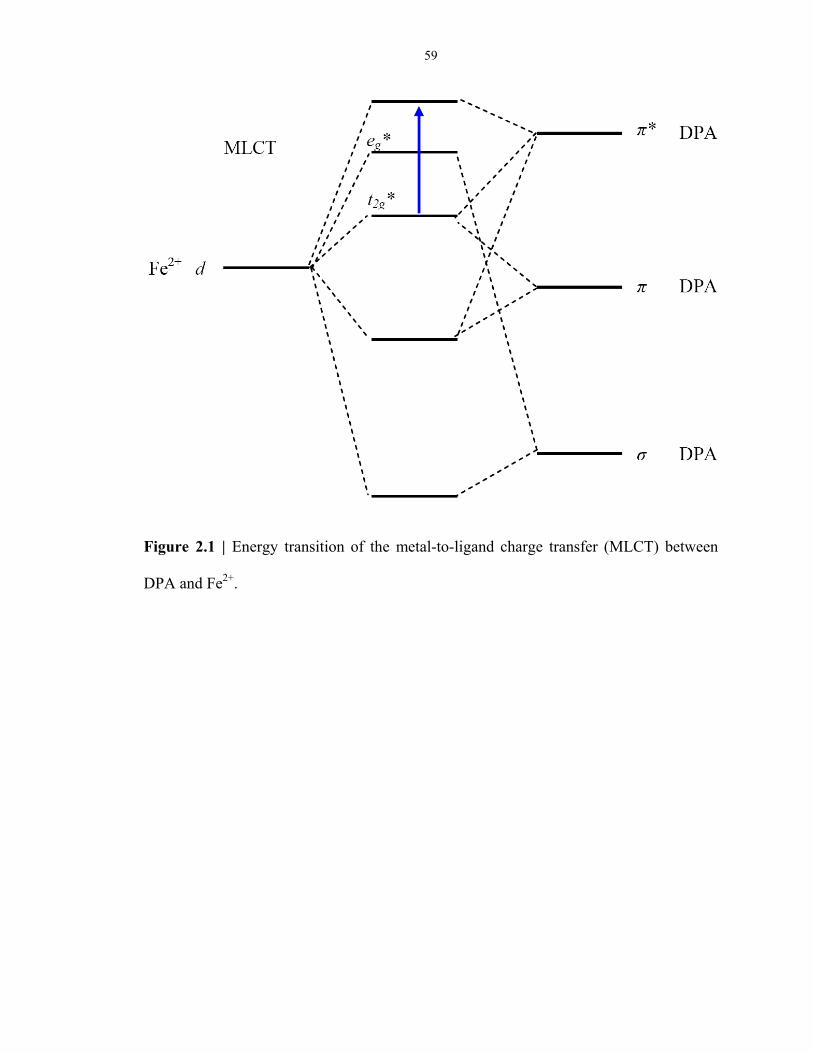
59
Figure 2.1 | Energy transition of the metal-to-ligand charge transfer (MLCT) between
DPA and Fe2+.
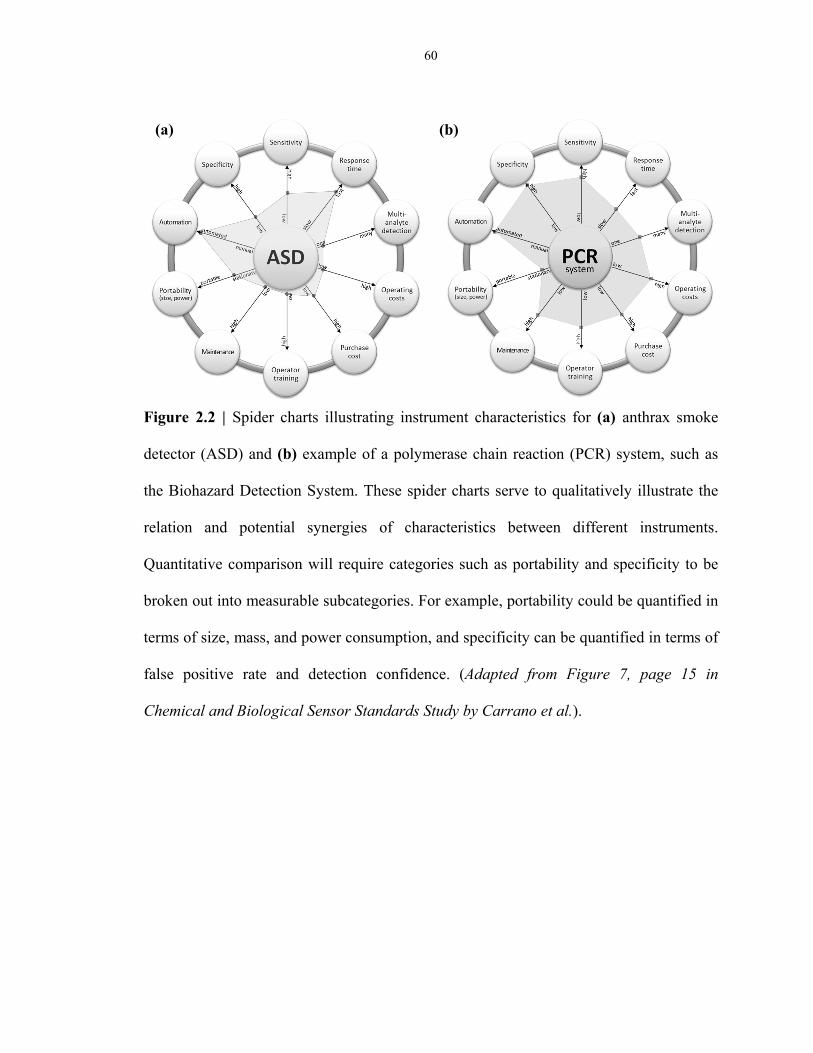
60
Figure 2.2 | Spider charts illustrating instrument characteristics for (a) anthrax smoke
detector (ASD) and (b) example of a polymerase chain reaction (PCR) system, such as
the Biohazard Detection System. These spider charts serve to qualitatively illustrate the
relation and potential synergies of characteristics between different instruments.
Quantitative comparison will require categories such as portability and specificity to be
broken out into measurable subcategories. For example, portability could be quantified in
terms of size, mass, and power consumption, and specificity can be quantified in terms of
false positive rate and detection confidence. (Adapted from Figure 7, page 15 in
Chemical and Biological Sensor Standards Study by Carrano et al.).
(a) (b)
61
CHAPTER 3: AN AUTOMATED FRONT-END MONITOR FOR ANTHRAX
SURVEILLANCE SYSTEMS BASED ON THE RAPID DETECTION OF
AIRBORNE ENDOSPORES†
3.1 Abstract
A fully automated anthrax smoke detector (ASD) has been developed and tested. The
ASD is intended to serve as a cost-effective front-end monitor for anthrax surveillance
systems. The principle of operation is based on measuring airborne endospore
concentrations, where a sharp concentration increase signals an anthrax attack. The ASD
features an air sampler, a thermal lysis unit, a syringe pump, a time-gated spectrometer,
and endospore detection chemistry comprised of dipicolinic acid (DPA)-triggered
terbium ion (Tb3+) luminescence. Anthrax attacks were simulated using aerosolized
Bacillus atrophaeus spores in fumed silica, and corresponding Tb-DPA intensities were
monitored as a function of time and correlated to the number of airborne endospores
collected. A concentration dependence of 102-106 spores/mg of fumed silica yielded a
dynamic range of 4 orders of magnitude and a limit of detection of 16 spores/L when 250
L of air were sampled. Simulated attacks were detected in less than 15 minutes.
† Reprinted with permission from Biotechnology and Bioengineering 2007, 98 (4), 864-871 Pun To Yung1, Elizabeth D. Lester1, Greg Bearman2 & Adrian Ponce1,2 1 California Institute of Technology, Pasadena, CA 91125 2 Jet Propulsion Laboratory, Pasadena, CA 91101

62
3.2 Introduction
While the 2001 anthrax attack led to 22 cases of life-threatening infections, including 5
deaths1, it also taught us that even massive exposures to Bacillus anthracis spores can be
effectively treated with a simple antibiotic regimen2. However, for treatment to be
effective it must be initiated soon after exposure. Anthrax progresses over 1-6 days with
initial flu like symptoms and leads to high mortality rates within 36 hours after the onset
of respiratory distress3,4. In the case of an attack, rapid “detect-to-treat” technologies are
critical for identifying exposed victims for prompt treatment. Considering the health and
economic impacts of an anthrax attack, the need for a rapid, cost effective, and automated
anthrax surveillance system remains high but unfulfilled. This need is further amplified
by the possibility of a scaled-up attack, where for example, it has been estimated that a
100 kg release of B. anthracis spores in Washington, D.C. would result in up to 3 million
deaths 5.
In general, an anthrax surveillance system requires a method of bioaerosol
sampling6-9 coupled with an analysis method with high specificity and sensitivity for
detecting B. anthracis spores. Rapid analysis methods based on nucleic acid or antigen
detection are under intense investigation for this application, and have been reviewed in
detail 10,11. In one of the most promising examples, the U.S. Postal Service has employed
an anthrax surveillance system, named the Biohazard Detection System, which is based
on real-time PCR with fully automated microfluidic sample handling developed by
Cepheid12. However, the cost of continuous operation due to reagent consumption and
maintenance is exceedingly high given the number of postal facilities in need of
monitoring13. In an effort to reduce the operation costs of an anthrax surveillance system
63
by approximately two orders of magnitude, we have developed and tested an automated
anthrax smoke detector (ASD) that measures airborne bacterial spores using an air
sampler coupled to a simple, robust, and inexpensive chemical test. The ASD is intended
to serve as a front-end monitor for species-specific anthrax surveillance systems, where
in the case of a bacterial spore event, the ASD triggers the expensive-to-operate
validation technology to confirm the result.
The ASD employs a rapid chemical test for the detection of bacterial spores based
on dipicolinic acid (DPA)-triggered terbium ion (Tb3+) luminescence14-18, which is
closely related to a colorimetric assay first developed in 195819. DPA is present in high
concentrations (up to 1 molar, ~15% of dry weight) in the core of bacterial spores20. For
all known life forms, DPA is unique to bacterial spores and can thus be used as an
indicator molecule for the presence of bacterial spores21. Thermal lysis (i.e., rupture) of
spores via dry heat or autoclaving efficiently releases DPA into the surrounding
matrix19,22, which enables DPA to bind to terbium ions with high affinity. Under UV
excitation, the Tb-DPA complex formation triggers intense green luminescence14-17,23
(Figure 3.1), signaling the presence of bacterial spores. Luminescence intensities can
then be correlated to bacterial spore concentrations24.
The ASD implementation of the terbium luminescence assay in conjunction with an
aerosol capture device, thermal induced bacterial spore lysis, and a miniature time-gated
spectrometer enables inexpensive and fully automated measurement of airborne bacterial
spores every 15 minutes. While in operation, the ASD samples 16.7 L of air per minute
and collects micron-sized particles, including airborne bacterial spores if present, onto a
meshed quartz fiber tape. After collection, the sample is automatically processed with
64
the thermal lysis unit at ~250˚C to release DPA from any captured spores. Addition of
the TbCl3 reagent solution via syringe pump forms the luminescent Tb-DPA complex.
Finally, the Tb-DPA luminescence intensity is measured under pulsed UV excitation
using the time-gated spectrometer. A sharp increase in airborne bacterial spore
concentration is a strong signature of an anthrax attack, because (1) bacterial spores,
rather than the vegetative cells are capable of surviving in the atmosphere25 and are thus
excellent vehicles for B. anthracis dispersal, and (2) natural background concentrations
are very low, varying between 0.01 and 1 spore/L 26.
Here we report the first fully automated application of the ASD 23,27 for monitoring
aerosolized bacterial spore concentrations during a simulated anthrax attack with
surrogate B. atrophaeus spore powders.
3.3 Materials and Methods
3.3.1 Chemicals
Pyridine-2,6-dicarboxylic acid (99%), terbium (III) chloride hexahydrate, 99.999%,
fluorescein and fumed silica were purchased from Aldrich (St. Louis, MO) and were used
as received. 1 M sodium acetate buffer was prepared and an equal concentration of acetic
acid was added until pH 5.8 was obtained. Tb-DPA solutions were prepared in 3.5-ml
disposable methacrylate cuvettes (Perfector Scientific, Atascadero, CA) for fluorimetric
measurement. All solutions were freshly prepared and used within one week using 0.2-
µm filter sterilized 18.2 MΩ-cm deionized water (Water Pro Plus, Labconco, Kansas City,
MO).
65
3.3.2 Biological samples
An endospore suspension of B. atrophaeus ATCC 9372 was purchased from Raven
Biological Laboratory, Inc. (Omaha, Nebraska). Stock suspension used in this study
contained 3.1×10¹⁰ ± 4.5×10⁹ spores/ml counted with a hemocytometer (Hausser
Scientific, Horsham, PA) under phase contrast microscopy, as well as 1.4×10¹⁰ ± 8.9×10⁸
CFU/ml counted by tryptic soy agar spread plating. Spores, maintained in 40% ethanol at
4°C before use, were purified from vegetative cells fragments and free DPA in the
suspension by centrifuging at 13,200 rpm for 10 minutes, washing and resuspending in
deionized water twice. Pure spore suspension was sterilized in an autoclave (Tuttnauer
2540E, Brinkmann Instruments, Inc., Westbury, NY) at 124°C for 15 minutes to release
DPA. The suspension was cooled and acidified with 1 N hydrochloric acid to reach pH
1.0. Cell debris was removed via filtering through a 0.2-μm filter. The filtrate was
subsequently neutralized with 1 N sodium hydroxide and represented the autoclaved
spore sample.
3.3.3 Anthrax Smoke Detector
The ASD is operated in full automation with a software interface implemented in
LabVIEWTM 7. Figure 3.2 shows a schematic of the ASD system, which consists of 5
components:
Spooling mechanism (Metone, Grants Pass, OR). A roll of quartz tape (Whatman,
Florham Park, NJ) installed on the spool was advanced through five sample collection
and processing stages in series. In the first position, air samples were collected onto a
66
spot on the filter tape. The tape was then advanced to the second position for thermal
lysis of the collected spores. In the third position, a drop of TbCl3 solution was added.
Finally, in the fourth position, spore concentration was quantified using Tb-DPA
luminescence assay with the time-gated spectrometer. When this sequence of monitoring
is completed, used tape would be wound up in another roll to serve as a physical history
of the sampling record that can be retrieved at a later point in time.
Air sampler (Metone, Grants Pass, OR). The impaction air sampler applied
suction to draw air through the tape at a rate of 16.7 liters per minute. Duration of air
sampling is adjustable to suit different purposes. Aerosol was collected onto a circular
spot (~7 mm) on the tape.
Thermal spore lysis unit. A soldering iron with a 1-cm diameter cylindrical tip
was motor-driven to press against the filter tape. The iron contact time with the sample on
the tape was 10 seconds at 250C (operated at 30W).
Reagent (TbCl3) addition pump. A syringe pump (PSD/4, Hamilton, Reno, NV)
supplied 20 µl of TbCl3 through a delivery nozzle onto the sample spot.
Time-gated spectrometer. Samples impregnated on the tape were analyzed by the
spectrometer, with details as follows:
3.3.4 Spectrometry
The spectrometer consists of a 24 W pulsed xenon flashlamp (FWHM ~5 µs and tailing
out to ~50 µs), a photomultiplier tube (Hamamatsu R6353P, Bridgewater, NJ), 2 concave
aluminum mirrors and 2 bandpass filters (Figure 3.3). Pulsed excitation light at 10Hz was
focused on samples with a concave aluminum turning mirror and band-limited by an
67
interference filter (50% pass bandwidth 255–280 nm, 23% maximum transmittance).
Luminescence from the sample traversed through a bandpass filter (50% pass bandwidth
538–553 nm, 70% maximum transmittance) and another concave aluminum mirror to
enter the PMT. The filter set was chosen to overlap with the excitation and emission
spectra of Tb-DPA (Figure 3.3). Time gating was achieved by a delayed detection of the
sample luminescence after each flash, according to a chosen delay time. Throughout all
measurements in this study, the PMT was operated at 950 V, photocathode aperture set to
be 15 mm × 10 mm, delay and integration time was 100 µs and 2 ms, respectively. The
entire assembly was shielded from ambient light using a black anodized aluminum
enclosure. The spectrometer was custom constructed by Jobin Yvon, Edison NJ.
Cuvettes and tape matrix were measured at a distance of 15 mm from the spectrometer.
Each cuvette had a final concentration of 10 µM TbCl3 with DPA (125 nM to 30.5 pM)
or autoclaved spores (4.4×10⁵ to 1.0×10² spores mL-1) in 1 M sodium acetate buffer at pH
5.8. 20 µL of the aqueous sample was pipetted onto quartz tape, forming a 7-mm spot, for
luminescence measurement. Spectrometer reading was taken while the spot remained
translucent (i.e., before the solvent evaporated).
3.3.5 Simulated anthrax attack
2.0 × 10⁶ B. atrophaeus spores, as counted using a hemocytometer, were suspended in
100% methanol and then inoculated to 20 mg of fumed silica. The slurry was allowed to
dry overnight under room temperature with constant shaking. The flocculent powder thus
formed was used for spore aerosolization experiment. Aerosolization of bioaerosol was
simulated by holding a spatula with 20 mg spore-spiked fumed silica near the air sampler

68
intake while the pump was on. The air sampler was operated for 1 minute to collect silica
onto the quartz filter. Spectrometer reading was taken following thermal lysis and TbCl3
addition. Samples were run in ascending order of concentration to minimize
contamination.
3.4 Results
The ASD consists of (1) an air sampler using an air filtration tape made of quartz fiber
mesh, (2) a thermal lysis unit that presses a hot element onto the tape to release DPA
from captured spores, (3) TbCl3 reagent addition pump, and (4) a time-gated spectrometer
for measuring Tb-DPA luminescence intensity. In an effort to characterize ASD
performance, the time-gated functionality of the spectrometer was evaluated against a
challenging, highly fluorescent background. Then a series of concentration dependence
experiments with pure DPA solutions and autoclaved spore suspensions were performed
to determine limits of detection under ideal conditions (Figure 3.5). Next we integrated
the spectrometer into the ASD system, and measured a calibration curve using known
concentrations of B. atrophaeus spores doped into fumed silica (i.e., anthrax powder
surrogate) that were manually added to the quartz fiber air filtration tape to determine
dynamic range and limits of detection under operating conditions. Finally the ASD was
activated in automatic mode to monitor airborne spore concentrations. At time zero,
simulated anthrax powders, consisting of B. atrophaeus in fumed silica, were aerosolized
and detected with the ASD (Figure 3.6).
69
3.4.1 Spectrometer time-gated performance
Short excitation pulses followed by delayed luminescence detection effectively rejects
short-lived background fluorescence, which enables the ASD to successfully operate in
realistic environments laden with varying concentrations of fluorescent interferents. In
an effort to test the time-gated performance of the spectrometer (delay = 100 µs,
integration = 2000 µs), the average (n = 5) emission intensities of solutions containing
both 250 µM fluorescein (τem = 4 ns, λex = 485 nm, λem = 530 nm) and 10 µM TbCl3 (τem
= 0.6 – 2.0 ms, λex = 278 nm, λem = 543 nm) were analyzed as a function of DPA
concentration = 10 nM to 100 µM) in gated and ungated modes. In the ungated mode,
the fluorescein emission intensity masks the Tb-DPA emission, while in the gated mode
the Tb-DPA emission follows Beer’s law over 4 orders of DPA concentration, thus
clearly demonstrating the near complete discrimination of fluorescein emission from that
of Tb-DPA.
3.4.2 Quantification of DPA and spores in water
Performance of the time-gated spectrometer in response to pure DPA (Aldrich)
and spores as a function of concentration in 10 µM TbCl3 aqueous solution was assessed.
Luminescence intensities were measured with a delay of 100 µs. The DPA standard curve
was best fit to a linear power fit (R2 = 0.998) over 3 orders of magnitude (Figure 3.6).
Limit of detection (LOD) was calculated as 0.4 nm DPA, based on a 3-σ value
corresponding to a confidence level of 90%28. The limit of quantitation (LOQ) was
calculated as 1.2 nm DPA, based upon 10 times the noise level of the background. The
70
endospore standard curve was also best fit to a linear power fit (R2 = 0.998) over 3 orders
of magnitude yielding LOD and LOQ as 1.0 × 10³ and 2.8 × 10³ spores/ml, respectively
(Figure 3.6).
For autoclaved spore suspensions in water, the concentration of DPA present in
solution is proportional to spore concentration. The luminescence intensity of autoclaved
spore samples was compared to the DPA standard curve (Figure 3.5), from which we
obtained a spore-DPA ratio of 0.343 fmol DPA per B. atrophaeus spore that is in good
agreement with the reported 0.365 fmol DPA per B. subtilis spore17. B. atrophaeus,
formerly known as B. subtilis var. niger or B. globigii29, is a strain of B. subtilis.
Performance of the spectrometer with pure DPA solutions and autoclaved spore
suspensions is comparable to that of a conventional bench-top fluorimeter.
3.4.3 ASD response to simulated anthrax attack
Figure 3.6 shows the spectrometer standard curve for spore-spiked fumed silica manually
added to the ASD quartz filter tape. After thermal lysis and reagent addition,
luminescence intensities are linearly correlated to the inoculated spore population in
fumed silica (R2 = 0.999). Based on this standard curve, the LOD and LOQ was
calculated as 4.0 × 10³ and 1.1 × 10⁴ total spore population collected, respectively. Given
that air is sampled at a rate of 16.7 L/min for 15 minutes, the theoretical LOD and LOD
of the instrument is approximately 16 spores/L and 44 spores/L of air, respectively.
Longer sampling times would yield correspondingly improved LOD and LOQ. Figure
3.6 shows the timecourse of an automated operation of the ASD. A simulated anthrax
attack consisting of 2.0 × 10⁶ B. atrophaeus spores in 20 mg fumed silica was initiated at
71
time t = 0. A real-time Tb-DPA luminescence intensity spike was noticed, corresponding
to 1.3 × 10⁶ total spores collected as determined by comparison to the standard curve
(figure 3.5).
3.5 Discussion
The ASD is an integrated and automated air sampling, sample processing, and detection
system for airborne bacterial spores, and is intended as an inexpensive front-end monitor
for anthrax surveillance systems. The principle of operation is based on the fact that, in
an attack, Bacillus anthracis is dispersed in bacterial spore form, since vegetative cells
cannot survive the desiccation during aerosolization. Therefore, a large increase of
airborne bacterial spore concentration is a strong signature of an anthrax attack. In the
case of an ASD measurement of a bacterial spore event, confirmatory testing by the
anthrax surveillance system (e.g., DNA analysis via real-time PCR) would be triggered to
validate the ASD result. The combination of the ASD as a front-end monitor with an
anthrax surveillance system would drastically cut operating costs (~100-fold) while
maintaining low false positive rates of species-specific detection methods.
The ASD employs time-gated detection of long-lived terbium dipicolinate
luminescence, which is a sensitive assay for the detection of trace amounts of endospores
in real world environments, such as office buildings, subway stations, and post offices.
Such environments are filled with a plethora of fluorescent compounds that can confound
fluorescence-based assays. Time-gated detection, however, essentially eliminates
background fluorescence by taking advantage of the fact that fluorescent compounds
72
have lifetimes in the nanosecond regime30, whereas terbium complexes have lifetimes in
the millisecond regime31.
The false positive rate for the ASD is expected to be very low, because false
positives due to fluorescent interferents is essentially eliminated with time-gated
detection, and false positives due to natural bacterial spore concentration fluctuations (i.e.,
0.01-1 bacterial spores per liter of air) are unlikely because they are below the limit of
detection. Nonetheless, false positives due to concentrated non-B. anthracis spore
samples remain possible (e.g., hoax using other species, or B. thuringiensis spores used in
agriculture), but again these events would be rapidly identified during confirmatory
testing by a given anthrax surveillance system.
False negatives due to masking of B. anthracis spores by confounding agents are
expected to be lower for bacterial spore detection vs. species-specific detection, because
DPA is required for spore survival32,33 while antigen or DNA targets can be modified
with molecular biology methods to the extent that detection is compromised but virulence
is maintained. Since approximately 108 molecules of DPA are present in each bacterial
spore, as compared to a few copies of DNA for example, no expensive sample
amplification schemes are required which lowers the complexity of the instrument and
corresponding costs.
The detection threshold (i.e., LOD) for DPA in aqueous solution when using the
Tb-DPA luminescence assay can be limited by instrumentation, such as excitation source
(e.g., Xe-flash lamp versus UV LED34) or type of detector (e.g., PMT versus CCD), but is
ultimately governed by the binding constant between Tb3+ and DPA (Ka = 108.7)35-37.
Indeed, below nanomolar concentration (i.e., ~103 spores/mL), the percentage of DPA
73
molecules bound to Tb3+ approaches nil. Since binding is required to trigger the
luminescence turn-on, detection below those concentrations is not possible regardless of
the excitation source or detection system. We have shown that DPA and spore
concentration dependence experiments using a bench-top fluorimeter (Jobin-Yvon
Fluorolog-3). The performance by both instruments is comparable, albeit the fluorimeter
is equipped with a higher intensity xenon lamp source and double monchromators,
suggesting that a simple xenon flashlamp in conjunction with a PMT suffices to obtain
the binding constant constrained limit of detection.
The ability to detect 16 spores/L in 15 minutes with full automation and
inexpensive operation costs qualifies the ASD as a rapid front-end monitor for anthrax
surveillance systems. We contend that bacterial spore is the ideal detection target for a
front-end anthrax monitor, because (1) it enables low operating costs, (2) it is going to be
the vehicle for anthrax delivery, and (3) false positives due to natural fluctuations are
expected to be very rare, and verifiable when coupled with species-specific detection
technology. We envision that the ASD will serve as a front-end instrument for anthrax
surveillance systems, capable of long-term, cost-effective, unattended monitoring of
airborne bacterial spores.
3.6 Conclusion
In conclusion, we have demonstrated quantification of aerosolized bacterial spores with a
response time of 15 minutes, a detection limit of 16 spores per liter of air, and a dynamic
range of 4 orders of magnitude using a bioaerosol sampler, thermal spore lysis, and a
74
time-gated spectrometer, which promises tremendous reduction in operating costs for
anthrax monitoring.
3.7 References
1. Jernigan, D.B. et al. Investigation of bioterrorism-related anthrax, United States, 2001: epidemiologic findings. Emerging Infectious Diseases 8, 1019-1028 (2002).
2. Tahernia, A.C. Treatment of anthrax in children. Archives of disease in childhood 42, 181-182 (1967).
3. Meselson, M. et al. The Sverdlovsk anthrax outbreak of 1979. Science 266, 1202-1208 (1994).
4. Weyant, R., Ezzell, J., and Popovic, T. Basic laboratory protocols for the presumptive identification of Bacillus anthracis. Center for Disease Control (2001).
5. Office of Technology Assessment, U.C. Proliferation of Weapons of Mass Destruction. Washington DC: US Government Printing Office, 53-55. Publication OTA-ISC-559 (1993).
6. Cox, C.S. and Wathes, C.M., Bioaerosols Handbook. (Lewis Publishers, Inc., 1995). 7. Griffiths, W.D. and Decosemo, G.A.L. The assessment of bioaerosols: a critical review.
Journal of Aerosol Science 25, 1425-1458 (1994). 8. Griffiths, W.D., Stewart, I.W., Futter, S.J., Upton, S.L., and Mark, D. The development of
sampling methods for the assessment of indoor bioaerosols. Journal of Aerosol Science 28, 437-457 (1997).
9. Baron, P.A. and Willeke, K., Aerosol measurement: principles, techniques, and applications. (Wiley, New York, 2001).
10. Katie, A.E., Harriet, A.C., and Antje, J.B. Bacillus anthracis: toxicology, epidemiology and current rapid detection methods. Analytical and Bioanalytical Chemistry 384, 73-84 (2006).
11. Levine, S.M., Tang, Y.-W., and Pei, Z. Recent advances in the rapid detection of Bacillus anthracis. Reviews in Medical Microbiology 16, 125-133 (2005).
12. Ulrich, M.P. et al. Evaluation of the Cepheid GeneXpert® system for detecting Bacillus anthracis. Journal of Applied Microbiology 100, 1011-1016 (2006).
13. Knight, J. US postal service puts anthrax detectors to the test. Nature 417, 579-579 (2002). 14. Pellegrino, P.M., Fell, N.F., and Gillespie, J.B. Enhanced spore detection using dipicolinate
extraction techniques. Analytica Chimica Acta 455, 167-177 (2002). 15. Rosen, D.L. Bacterial endospore detection using photoluminescence from terbium
dipicolinate. Reviews in Analytical Chemistry 18, 1-21 (1999). 16. Sacks, L.E. Chemical germination of native and cation-exchanged bacterial spores with
trifluoperazine. Applied and Environmental Microbiology 56, 1185-1187 (1990). 17. Hindle, A.A. and Hall, E.A.H. Dipicolinic acid (DPA) assay revisited and appraised for
spore detection. Analyst 124, 1599-1604 (1999). 18. Rosen, D.L. Airborne bacterial endospores detected by use of an impinger containing
aqueous terbium chloride. Applied Optics 45, 3152-3157 (2006). 19. Janssen, F.W., Lund, A.J., and Anderson, L.E. Colorimetric assay for dipicolinic acid in
bacterial spores. Science 127, 26-27 (1958). 20. Gould, G. and Hurst, A., The Bacterial Spore. (Academic Press, New York, 1969). 21. Slepecky, R. and Foster, J.W. Alterations in metal content of spores of Bacillus megaterium
and the effect on some spore properties. Journal of Bacteriology 78, 117-123 (1959).
A B C
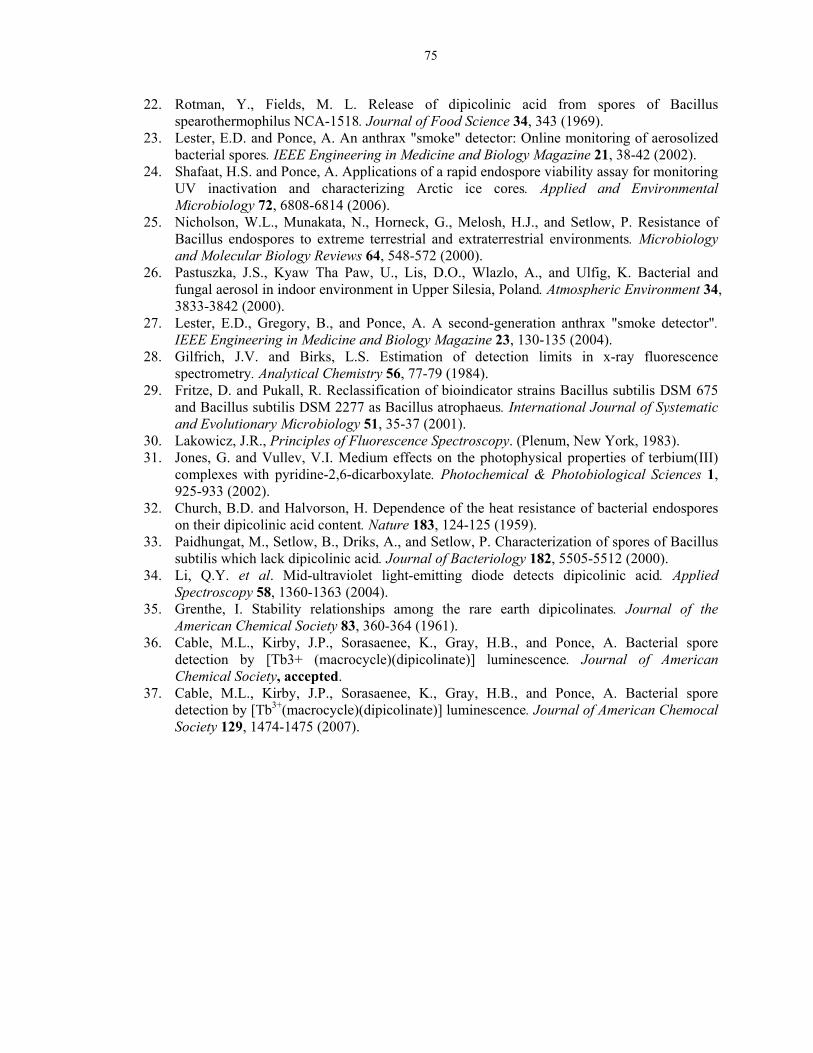
75
22. Rotman, Y., Fields, M. L. Release of dipicolinic acid from spores of Bacillus spearothermophilus NCA-1518. Journal of Food Science 34, 343 (1969).
23. Lester, E.D. and Ponce, A. An anthrax "smoke" detector: Online monitoring of aerosolized bacterial spores. IEEE Engineering in Medicine and Biology Magazine 21, 38-42 (2002).
24. Shafaat, H.S. and Ponce, A. Applications of a rapid endospore viability assay for monitoring UV inactivation and characterizing Arctic ice cores. Applied and Environmental Microbiology 72, 6808-6814 (2006).
25. Nicholson, W.L., Munakata, N., Horneck, G., Melosh, H.J., and Setlow, P. Resistance of Bacillus endospores to extreme terrestrial and extraterrestrial environments. Microbiology and Molecular Biology Reviews 64, 548-572 (2000).
26. Pastuszka, J.S., Kyaw Tha Paw, U., Lis, D.O., Wlazlo, A., and Ulfig, K. Bacterial and fungal aerosol in indoor environment in Upper Silesia, Poland. Atmospheric Environment 34, 3833-3842 (2000).
27. Lester, E.D., Gregory, B., and Ponce, A. A second-generation anthrax "smoke detector". IEEE Engineering in Medicine and Biology Magazine 23, 130-135 (2004).
28. Gilfrich, J.V. and Birks, L.S. Estimation of detection limits in x-ray fluorescence spectrometry. Analytical Chemistry 56, 77-79 (1984).
29. Fritze, D. and Pukall, R. Reclassification of bioindicator strains Bacillus subtilis DSM 675 and Bacillus subtilis DSM 2277 as Bacillus atrophaeus. International Journal of Systematic and Evolutionary Microbiology 51, 35-37 (2001).
30. Lakowicz, J.R., Principles of Fluorescence Spectroscopy. (Plenum, New York, 1983). 31. Jones, G. and Vullev, V.I. Medium effects on the photophysical properties of terbium(III)
complexes with pyridine-2,6-dicarboxylate. Photochemical & Photobiological Sciences 1, 925-933 (2002).
32. Church, B.D. and Halvorson, H. Dependence of the heat resistance of bacterial endospores on their dipicolinic acid content. Nature 183, 124-125 (1959).
33. Paidhungat, M., Setlow, B., Driks, A., and Setlow, P. Characterization of spores of Bacillus subtilis which lack dipicolinic acid. Journal of Bacteriology 182, 5505-5512 (2000).
34. Li, Q.Y. et al. Mid-ultraviolet light-emitting diode detects dipicolinic acid. Applied Spectroscopy 58, 1360-1363 (2004).
35. Grenthe, I. Stability relationships among the rare earth dipicolinates. Journal of the American Chemical Society 83, 360-364 (1961).
36. Cable, M.L., Kirby, J.P., Sorasaenee, K., Gray, H.B., and Ponce, A. Bacterial spore detection by [Tb3+ (macrocycle)(dipicolinate)] luminescence. Journal of American Chemical Society, accepted.
37. Cable, M.L., Kirby, J.P., Sorasaenee, K., Gray, H.B., and Ponce, A. Bacterial spore detection by [Tb3+(macrocycle)(dipicolinate)] luminescence. Journal of American Chemocal Society 129, 1474-1475 (2007).
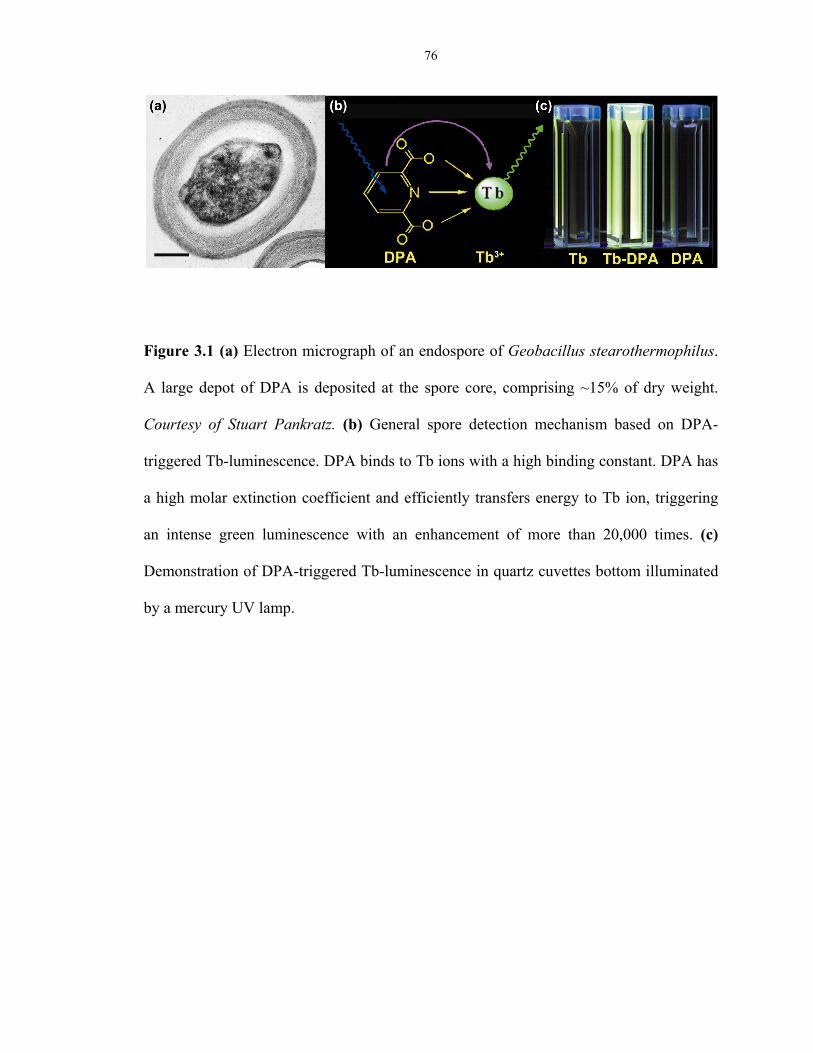
76
Figure 3.1 (a) Electron micrograph of an endospore of Geobacillus stearothermophilus.
A large depot of DPA is deposited at the spore core, comprising ~15% of dry weight.
Courtesy of Stuart Pankratz. (b) General spore detection mechanism based on DPA-
triggered Tb-luminescence. DPA binds to Tb ions with a high binding constant. DPA has
a high molar extinction coefficient and efficiently transfers energy to Tb ion, triggering
an intense green luminescence with an enhancement of more than 20,000 times. (c)
Demonstration of DPA-triggered Tb-luminescence in quartz cuvettes bottom illuminated
by a mercury UV lamp.
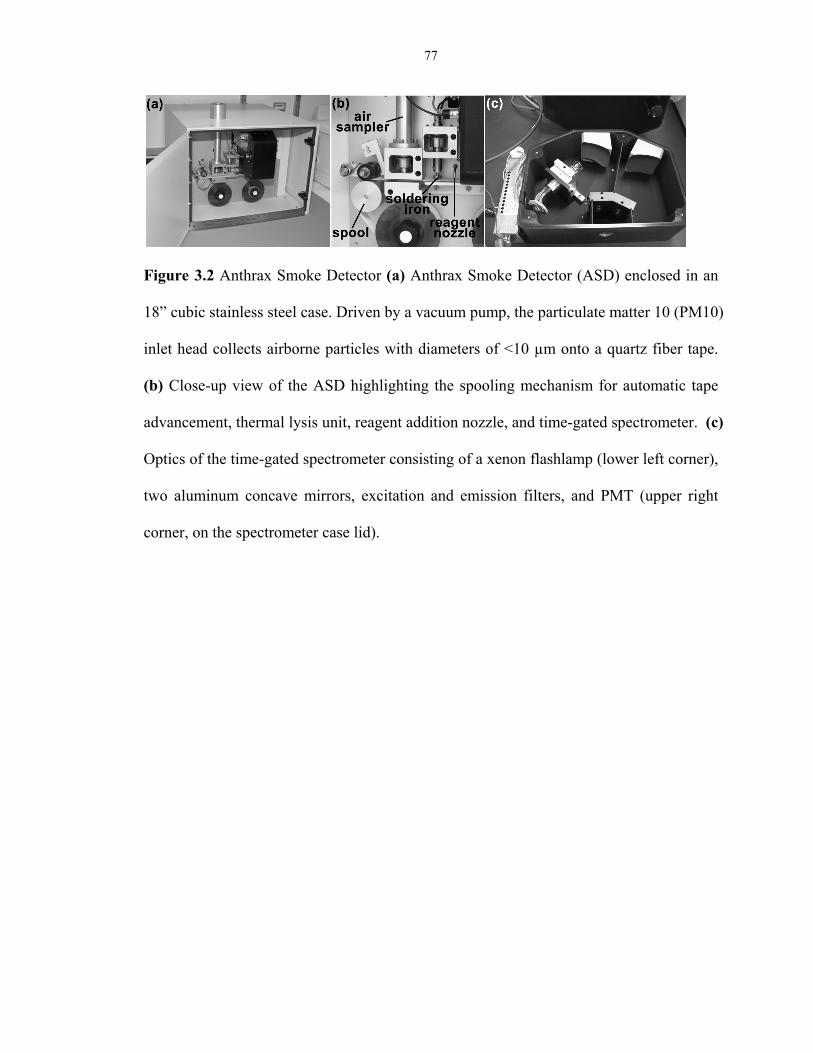
77
Figure 3.2 Anthrax Smoke Detector (a) Anthrax Smoke Detector (ASD) enclosed in an
18” cubic stainless steel case. Driven by a vacuum pump, the particulate matter 10 (PM10)
inlet head collects airborne particles with diameters of <10 µm onto a quartz fiber tape.
(b) Close-up view of the ASD highlighting the spooling mechanism for automatic tape
advancement, thermal lysis unit, reagent addition nozzle, and time-gated spectrometer. (c)
Optics of the time-gated spectrometer consisting of a xenon flashlamp (lower left corner),
two aluminum concave mirrors, excitation and emission filters, and PMT (upper right
corner, on the spectrometer case lid).

78
Figure 3.3 Spectral bandpass of emission and excitation filters compared to excitation
and emission spectra of terbium dipicolinate. The excitation spectrum of terbium
dipicolinate (λem = 544 nm, 100 μM TbCl3 + 10 μM DPA in 1 M sodium acetate buffer at
pH 5.8), and corresponding emission spectrum (λem = 278 nm) are shown in thin dashed
and solid lines, respectively. The transmittance spectra of the excitation and emission
interference filters are shown in thick dashed and solid lines, respectively.

79
Figure 3.4 DPA concentration dependence of 250 µM fluorescein and 10 µM TbCl3 with
(solid line) and without (dashed line) time gating (λex = 280 ± 5 nm, λem = 530 – 550 nm).
80
Figure 3.5 Time-gated detection (100 µs delay) of (a) DPA and (b) spores in 10 µM
TbCl3 buffered in 1 M sodium acetate at pH 5.8 (n=5). (a) Log-log plot of intensity with
DPA concentration. The line represents a power fit, equivalent to a linear fit on a linear
scale plot, of the standard curve (R2 = 0.998). (b) Log-log plot of intensity with spore
population. The line represents a power fit, equivalent to a linear fit on a linear scale plot,
of the standard curve (R2 = 0.998).
81
Figure 3.6 Simulated anthrax attack (n=5). (a) Standard curve of surrogate B. atrophaeus
spores aerosolized in fumed silica measured with the ASD. (b) An anthrax attack was
simulated at time 0 using fumed silica spiked with B. atrophaeus. Real-time intensity
spike indicates a large increase in airborne spores, corresponding to a total of 1.3 x 10⁶
spores being collected.
82
CHAPTER 4: AIRBORNE ENDOSPORE BIOBURDEN AS AN INDICATOR OF
SPACECRAFT CLEANLINESS
4.1 Abstract
Microbiological monitoring in confined spacecraft and space station environments during
long-duration manned missions is instrumental to guaranteeing the health, safety and
productivity of astronauts and crew members. An autonomous air sampling detector
provides early detection of a microbial event for timely decontamination and mitigation.
The success of air sampling in a closed-loop habitat will be enhanced if the correlation
underlying airborne endospore bioburden (AEB) and total biomass is better understood.
In this study, we conduct controlled experiments and investigate the relationship between
AEB and total biomass using a two-compartmental model in simulated closed
environments. A combination of culture-dependent and culture-independent methods is
used. AEB is found to correlate the total biomass in a controlled enclosure under
laboratory condition. A positive, but less obvious, correlation was found between AEB
and total biomass in daily closed environments. AEB can therefore be used as an
indicator of spacecraft cleanliness and bioburden level that the flight crew can tolerate
without compromising their health.
4.2 Introduction
Environmental monitoring in closed-loop life support systems has become one of
NASA’s top priorities since President Bush unveiled that Unites States Space Exploration
83
Policy in January 2004, which calls for long-term missions to moon and Mars. Microbial
monitoring is essential to avoid crew health problems and biodegradation of spacecraft
components1. A rapid change in microbial concentration indicates a breakdown of
environmental control either by allowing conditions that foster microbial growth (e.g.,
rapid biofilm formation due to temperature, humidity, and nutrient availability) or by a
breakdown of environmental control/treatment hardware2. These failure modes need to be
detected as early as possible. A biosensor instrument is required to investigate the
environmental conditions associated with living and working in a spacecraft and how do
these measurables affect astronauts’ health and well-being. The NASA Advanced
Environmental Monitoring and Control Program (AEMC) document for technology
development requirements3 states that (i) “the frequency of microbial monitoring should
be once in two days and must not put additional workload on the crew;” (ii) “instrument
response time of approximately two hours after collection is a good goal for future
technology development;” and (iii) “present methods take days. The long term goal may
be set at monitoring the bioparticles on a continuous basis.”
Maintaining health in a confined space system over extended periods of time is a
challenging microbiological task4,5. A general tendency toward increased cell growth,
biomass production, and growth rate has been observed with the length of spacecraft6,
accompanied with a significant increase in the airborne microbial counts during flight7,8.
A decrease in T lymphocytes have been reported on the human immune system9,10. In
addition there are reports indicating that space flight decreases certain gamma globulins
(IgA, IgG) and β-2-glycoprotein fraction11. Such findings suggest that the stress of space
flight may be accompanied by a transient impairment in functioning at the cellular and
84
hormonal immune system, which may result in an increased risk of infectious disease
during flight12. In fact, some of the early missions reported a high incidence of infectious
diseases, in some cases over 50%. The most common were gastroenteritis and respiratory,
urinary tract, and skin infections. Since that time, comprehensive preflight examinations
have decreased the incidence of infections.
NASA’s planetary protection program currently uses bacterial spores as indicator
species in their surface bioburden reduction analysis required prior to launch of
interplanetary spacecraft. Bacterial spores are ideal indicator species to validate
bioburden reduction on surfaces, because they are the most resistant life forms towards
sterilization regimens and are frequently found on barren spacecraft hardware surfaces13-
15. Thus, validation of bacterial spore reduction to a certain concentration threshold
guarantees that other, less resistant microorganisms are reduced to lower concentrations.
In particular, crew members are expected to be exposed continuously to bioaerosol for
long periods of time in an enclosed life-support system. Pathogenic endospores are
considered more contagious and dangerous than vegetative bacteria because endospores
can survive and be transported through air in a dormant yet viable state, anthrax being the
most typical example. A question arises here – can airborne endospore bioburden (AEB)
be used as an indicator for total biomass in an enclosed system?
Towards these ends, the first prototype Microbial Event Monitor (MEM) has been
developed as a rapid and automated airborne endospore monitoring system which
consists of an air sampler, a spore lysis system, an endospore-specific fluorescent
indicator, and a photon detector. In this study, we will fully characterize the correlation of
AEB and total biomass in a laboratory controlled closed environment using novel air
85
sampler and endospore viability assays. The derived model will be extended to daily
indoor environments such as laboratories and offices, and compared with previously
results obtained in the Environmental Control and Life Support System (ECLSS) at
Marshall Space Flight Center. The correlation has also been testified in the Atacama
Desert, the most arid desert and closest Mars analog on Earth. B. atrophaeus has long
been employed as the model endospores to study aerosolization and dispersal issues. We
propose the use of an endospore-forming species, isolated from local Mojave Desert,
which possesses delicate aerial colony projections for airborne dispersal of endospores as
a new model organism for aerosolization studies.
4.3 Methods and Procedure
4.3.1 Chemicals
Terbium (III) chloride hexahydrate, 99.999%, L-alanine and other salts were purchased
from Sigma (St. Louis, MO) and were used as received. UltrapureTM agarose (> 90%)
was purchased from Invitrogen (Carlbad, CA). Tryptic soy agar (TSA), nutrient broth and
agar were obtained from Becton, Dicksinon and Company, (Sparks, MD).
4.3.2 Microbiological samples
B. atrophaeus (ATCC 9372) spores were purchased from Raven Biological Laboratories.
B. subtilis, an environmental isolate from Mojave Desert subsurface soil, vegetative cells
were grown on TSA and inoculated onto a sporulation medium after reaching exponential
growth phase. The sporulation medium contained 1.6% nutrient broth, 1.6% agar, 0.2%
86
KCl, 0.05% MgSO4, 1 mM Ca(NO3)2, 100 µM MnCl2·4H2O, 1 µM FeSO4 and 0.1%
glucose (pH 7.0). After incubation at 37°C for 1 week, cells were suspended into sterile
deionized water. 95% of the cells have formed spores free of sporangia. Spores were
harvested and separated from vegetative cells and debris by centrifugation at 6,300 g,
washing 10 times and sonication (25 kHz) for 5 min. The spore suspension was incubated
in lysozyme (0.2 mg mL-1) and trypsin (0.1 mg mL-1) at 30°C with constant stirring
overnight to lyse and degrade vegetative cells. Spores were purified by 8 cycles of
centrifugation (6,300 g) and washed with sterile deionized water until > 99.9% of the
cells were fully refractile with no noticeable cellular debris. Spore suspensions were
stored at 4°C in the dark before use. Total spore concentrations were determined using a
Petroff-Hausser hemocytometer and CFU concentrations were determined using TSA
spread plating in triplicate measurements.
4.3.3 Microbial Event Monitor
The MEM is composed of (1) an air sampler that captures airborne spores, (2) a spore
lysis component to release the unique chemical marker (dipicolinic acid, DPA) from the
spores, and (3) a photon detector that measures the DPA triggered terbium (Tb)
luminescence intensity, where the intensity of the luminescence correlates to the
concentration of bacterial spores in the sample. The MEM is based on previous work
from the development of the Anthrax Smoke Detector (ASD) for bioterrorism
countermeasures16-18, which is based on the same general principles as those described
above. The MEM, however, needs to be more sensitive than the ASD, because ambient
background concentrations for microbial monitoring range from 0.1 - 1 spores per liter of
87
air19, which is much lower than the large changes in spore concentration associated with
an anthrax attack. Detailed instrumentation and operating principle of the ASD have been
reported previously.
4.3.4 Air Sample Collection
Three air samplers were used in this study, abbreviated as the SAS, MEM and E-BAM
(Figure 4.1). The SAS (Surface Air Systems) twin head duo 360 air sampler (Bioscience
International, Rockville, MD) uses a standard impaction method to capture airborne
particulate on the agar surface of a Petri dish. It is set to sample at a rate of 125 L min-1 in
this study. The MEM stands for Microbial Event Monitor, which is an all-in-one sensor
to measure the airborne endospore concentration as a first prototype to be incorporated in
future spacecrafts. It consists of a PM10 air inlet that collects airborne particles with an
aerodynamic dynamic less than or equal to 10 µm. The sampling rate is 16.7 L min-1 in
this experiment. The E-BAM (Met One Instruments, Rowlett, Texas) consists of a PM10
air inlet and β-attenuation gauge. The radioactive beta source C14 is less than 75
microcurie and a half life of 5,730 years. A sampling rate of 16.7 L min-1 is used, which
is approximately the inhalation rate for human aeroallergens and aeropathogens should
collect the same size fraction and concentration as are inhaled and collected by the human
respiratory system.
Bioefficiency of the air sampling unit of the 3 air samplers, MEM, SAS and E-
BAM, were compared to see if the culturable results were reproducible. The three
samplers were operated simultaneously, each sampling 5000 L of air for various amounts
of time in an indoor environment. Both the MEM and E-BAM sampled 5 hours onto a

88
filter tape matrix. Microorganism collected on the filter would be extracted by a 5-min
vortexing and 2-min sonication in PBS buffer supplemented with 50 mM sodium
pyrophosphate and 0.1% Tween-80. The suspension would be heat treated in an 80°C
water bath for 15 min to inactivate vegetative cells and select for endospores before
plating on tryptic soy agar (TSA) in triplicate. The SAS collected samples directly onto
TSA plates for 30 min in duplicate. From previous experiments, the plates were
subsequently dry heated in an oven at 80°C for 120 min in order to kill all vegetative
cells, thereby selecting for endospores. Petri dishes were incubated for 72 hours at 37°C.
The colonies on each Petri dish were recorded in CFU (colony forming unit), and
converted to CFU per liter of air (cfu L-1) subsequently.
Different media may be used depending on the target microorganisms. For
instance, R2A would be used to culture environmental microorganisms. Cycloheximide
(50 µg mL-1) would be supplemented to the agar to inhibit fungal growth. R2A would
usually be incubated at room temperature. Rose bengal agar (RBA) would be used to
select for fungal growth at room temperature. Endospores could be screened via heat
shock of suspension would be carried out in an 80°C water bath for 15 min or of agar
plates would be carried out in an 80°C dry oven for 120 min. Malt extract agar
supplemented with rose bengal and fluid thioglycollate broth to test for the proportion of
aerobic, microaerophilic and anaerobic bacteria in a sample.
4.3.5 Determination of total biomass
Surface swab samples were collected by following the NASA standard procedures for the
microbial examination of space hardware20. The samples were collected using the swab-
89
rinse method. Autoclaved cotton swabs and water were used in surface sampling. The
swabbed surface areas are not greater than 26 cm2. The solutions of 5 mL were divided
2.5 mL each into heat shocked and non-heat shocked and cultured on R2A plates. Each
room was swabbed twice, and each swab was re-suspended into water, vortexed,
sonicated, and plated onto culture media. Heat shock and non-heat shock samples were
used to compare the vegetative cells and spore formers. The plates were incubated at
37oC for 3 days. The colonies on each Petri dish were recorded in CFU, and converted to
CFU per square centimeter surface (cfu cm-2) subsequently.
Phase-contrast and epi-fluorescence microscopy were applied to assess the total
biomass as well. The slides were examined using a Nikon Eclipse microscope equipped
with a cooled CCD camera. Acridine orange (0.04% w/v) was used to stain the bacteria.
The later were placed on the surface of the staining solution for 2 min. Excess stain was
removed by rinsing twice in sterile water for 2 min. The filters were then dried for 10 min
before mounting on microscope slides. The microscope used was a Nikon Eclipse
epifluorescence microscope equipped with a 100 W xenon lamp. For microscopy, a filter
with an excitation wavelength of 450-490 nm was used. Cells were counted with a Nikon
Eclipse microscope at 1000× magnification (lamp: xenon, Ex: 450-490, FT 510, LP 515).
The filtration volume of 500 µL yielded 20-60 stained cells in the counting grid (125 ×
125 nm). A minimum of 400 cells (10-20 fields of view) were enumerated. Images were
analyzed using IP-Lab software.
To improve the quality of phase contrast images, the suspension to be tested was
diluted approximately to a suitable concentration and several drops (20 µL) were placed
individually on marked areas on two or three dried plates of the agarose medium. The
90
inoculated plates were covered with a glass coverslip. The preparation was examined by
light-field phase-contrast illumination under a 60 × oil-immersion objective lens.
4.3.6 Correlating airborne and total biomass in a laboratory-controlled environment
The experiment was carried out inside an enclosed inflatable polyethylene chamber with
built-in gloves (27 × 30 in AtmosBag, Sigma). It was a totally isolated environment with
temperature ranging from 20.5 - 22.5°C. The interior was disinfected by wiping with full
strength bleach (ultra-Chlorox, 6.25% sodium hypochlorite) and thorough rinsing with
0.2-µm filtered water 3 times. The AtmosBag was dried at 70°C in an oven before in
AtmosBag was filled up with atmospheric gas with inlet connected to a 0.2-µm filter to a
final operating volume of 12 L.
A known number of endospores were suspended in 100% ethanol and dispersed
as aerosols by a Lovelace nebulizer (model 01-400) and a vibrating stream generator
inside the AtmosBag. The nebulizer was operated at 15 psi. Endospores were allowed to
settle down for 30 min after aerosolization. After all, the SAS air sampler was deployed
to measure the airborne endospore concentration at a flow rate of 16.7 L min-1. Surface
total biomass was evaluated by µEVA, culturing, phase-contrast and epifluorescence
microscopies. In addition, passive air sampling was evaluated by placing fallout plates
inside the AtmosBag in triplicates, 3 facing upward and 3 mounted upside down.
In order to quantify the representative PM10 values inside the enclosure, active
and passive air sampling were carried out at least 10 in away from the fan to avoid hot
spots with high traffic volume. Placement of air sampler and Petri dishes is mapped using
91
conventional geostatistical methods such as construction of a variogram to model the
correlation that exists as a function of distance between sampling spots21,22.
4.3.7 Correlating airborne and total biomass in indoor and outdoor environemnts
The same air and surface total biomass sampling procedure as described above carried
out in the following indoor environments: Jet Propulsion Laboratory (JPL) buildings 300-
114, 302-336, 302-337, 302-332, 202-101. The 6 sampling sites include: new and old
chemistry/microbiology labs, new and old offices, ductless fume hoods, and bio-hood.
The air samples are collected using SAS air sampler, and the surface samples are
collected using a deviation of NASA standard assay. Each sample is collected four times
with one negative control. The error bars are standard error. The heat-shocked data are
too low in counts to do any significant statistical analysis, while the non-heat shocked
data have higher counts. The data presented will all be from the non-heat shock results.
A second experiment was conducted to validate the hypothesis, that bacterial
spore concentration represents total microbial contamination, on which the microbial
event monitor is based. Samples were taken of the microbial content of the air and
surfaces in a spacecraft relevant environment (MSFC simulated cabin) including airborne
bacterial spores. Sampling began one day prior to occupation, with chamber sealed for 24
hours to allow for equilibration. Sampling continued on days 1, 6, 9 and 14 of occupation.
In addition, a one-day time course of sampling was conducted on day 6, at 5:00, 5:30,
6:00, 8:00, 10:00, 12:00, 14:00, 16:00, 18:00, 18:30 and 19:00 during normal operation of
the facility. All sampling was conducted at the rear right section of the cabin.
92
Outdoor environments include Yungay in Atacama Desert, Chile (S 24° 04.941'
W 069° 55.167', elevation 959 m). The E-BAM machine was not used in outside air
sampling because of its bulkiness. The SAS sampler was positioned 1 foot above the
ground and in a specific orientation such that the left sampling head always faced the
windward side and the right sampling head always faced the leeward side. Outdoor air
samples were collected at different times of day over a 5-day period. Minimal activity
occurred during sample collection. Weather station was used to track the environmental
physical changes. Fallout plates were prepared in the form of PDMS
(polydimethylsiloxane) film inside Petri dishes and left exposed in the desert for 12 hours
day or night. PDMS is a hydrophobic and highly adhesive silicone-based polymer used as
a collection substrate for fallout bacteria. After collection, PDMS films were peeled and
plated directly onto R2A plates with sterile tweezers.
4.3.8 Comparison of biofilm-forming environmental isolate with lab-strain B. subtilis
The environmental-strain B. subtilis formed dark brown fruiting bodies on full strength
TSA incubated at 37°C in 3 day, whereas the lab-strain B. subtilis formed smooth milky
colonies. Both laboratory and environmental strains were induced to germinate in a
defined medium. Determination of size, hydrophobicity, wet density, DPA content and
germination kinetics were reported earlier.

93
4.3.9 Data Analysis
The number of bacterial colony forming units (CFU) on each plate was adjusted for
multiple impaction using a positive hole conversion table as needed. Data were converted
to CFU per liter of air. The F test (two-way analysis of variance) was used to determine
whether significant differences in the number of CFU per liter per sampling session
existed among the sampling devices and sampling locations. The Student-Newman-Keuls
(SNK) multiple comparison test was used to make pairwise comparisons to determine
more specifically which sampling devices or locations differed from one another. The
data analyses were performed using Matlab.
The plate count result in this experiment follows two different distributions
depending on the mean count per plate. When mean count is < 10, it follows a Poisson
distribution; otherwise, it is a normal distribution. In a Poisson distribution, 95%
confidence interval can be obtained from a statistical table. In a normal distribution, 95%
confidence interval is calculated using the well-defined mean and standard deviation.
The positive-hole correction method determines a statistical probability count of
colony-forming units23. It represents a count of the jets that delivered the endospores to
the agar plates and the conversion of the jet number to a particle count by using the
“positive hole” conversion formula.
Pr N ∑N
,
where Pr is the expected number of viable particulates to produce r positive holes and N
is the total number of holes per stage. This formula is based on the principle that as the
number of viable particles being impinged on a given plate increases, the probability of
the next particle going into an unpenetrated hole decreases. Thus, when 9 of 10 of the

94
holes have each received 1 or more particles, the next particle has but 1 chance in 10 of
going into an unpenetrated hole. Therefore, on average, 10 additional particles would be
required to increase the number of positive holes by 1.
4.4 Results
4.4.1 Comparison test of 3 different air samplers
The mean concentrations of airborne culturable endospores for each sampler are listed in
Table 4.1. The bioefficiency differences in among the three air samplers were not
significant (p = 0.384). Statistically significant differences were noted at different indoor
office sites (p < 0.0001). In Figure 4.2, the data for all airborne bacterial concentration
and the 3 samplers are shown as box plots. The data were shown to be normally
distributed using Jarque-Bera test. The 3 air samplers demonstrate similar bioefficiency
and therefore in the subsequent study, SAS will be used because it has the smallest
standard error (Table 4.1).
4.4.2 Aerosolized biofilm endospore testing in the laboratory
Bacterial endospores that were grown in surface biofilm on microbial growth media were
demonstrated to undergo airborne transport as a result of mild air turbulence under
ambient conditions. Cultures of bacterial endospores (Bacillus subtilis 3160) were grown
on tryptic soy Agar (TSA) bacterial growth medium. Two weeks after the culture was
initiated, to allow time for the formation of bacterial endospores on the surface of the
biofilm, an SAS air sampler was used to measure the concentration of spores which could
95
easily be transported by moderate air flow over the surface of the biofilm. It was
determined that greater that 200 bacterial endospores could be recovered from 1000L of
air passed over the biofilm. This finding demonstrated that under laboratory conditions,
surface microbial biofilm can release bacterial endospores that can be transported through
the air, resulting in the airborne spread of potentially dangerous microorganisms from
surfaces.
4.4.3 Correlation of airborne and surface endospores in a closed laboratory environment
A total of 105 cfu of B. subtilis endospores were dispersed and aerosolized using a
nebulizer inside a 12 L AtmosBag with a surface area of 68.6 cm × 76.2 cm. A computer
exhaust fan was installed the AtmosBag to emulate natural air turbulence. Air and surface
sampling were carried out to assess the airborne and total surface biomass after 30, 120,
240 min and then on a daily basis after 4 days (Figure 4.3). Immediately after
aerosolization, ~30% of the initial bacterial endospore inoculum were suspended in air
and only 30% were deposited on surfaces. After 1 day of settlement, we have observed a
ratio of airborne to surface endospores to be ~1:4, with 8% airborne and 33% on the
surface. Passive air sampling was evaluated by placing fallout plates inside the
AtmosBag in triplicates at various point of time for an hour, 3 facing upward and 3
mounted 10 cm upside down. The rate of passive endospore infall was measured to be
0.632 cfu/cm2 hr and up-rise rate was measured to be 0.106 cfu/cm2 hr.
96
4.4.4 Correlation of AEB and total biomass in indoor environments
In Figure 4.4, the bacterial counts represent the heterotrophic vegetative portion because
the endospore population in most of the cases was extremely low. The data show a weak
positive correlation between airborne and surface bacteria. We can see that most of the
data points align diagonally, showing an airborne to surface bacteria ratio of around 10 to
100. Heavily used and lightly used laboratories demonstrated a significant difference in
terms of airborne and surface bacteria (p < 0.01). Laboratories also exhibit a higher
bacterial counts then offices (p < 0.0001). Inhabited and uninhabited offices do not show
a statistically significant difference (p = 0.1239). The level I biohazard cabinet shows
extremely low concentration as expected, because the purpose of a bio-hood is to keep
the air inside free from contamination. The ductless fume hood does not have low
concentrations because it is designed to keep harmful chemical vapor inside the hood
filter and is not a sterile environment. The data from different locations form distinct
clusters, especially the distinction between labs, offices and the biohazard cabinet. The
ductless fume hood showed a greater variation because its function is to protect the
operator by drawing ambient air inside the hood. In the lab where anaerobic endospores
research was executed, there is corresponding increase in airborne and surface proportion
of anaerobic bacteria from the fluid thioglycollate cultures.
Preliminary indoor sampling showed a week correlation between human activity
and airborne/surface bacterial concentration. To further testify this hypothesis, we
compared these with the results of sampling in the Environmental Control and Life
Support System Module at Marshall Space Flight Center support the hypothesis that
bacterial spore bioburden can represent the total microbial content of an environmental
97
system. Time-course data indicated an increase in total microbial counts during the time
of occupation and a decrease after the cabin was not in use. Data obtained from three
different types of bacterial growth media (R2A, RBA and TSA) did not show any
significant trends related to the type of media used for either the one day time course (day
6) or the 15 day time course of sampling. RBA and R2A counts showed slight increases
with a single peak in each at 14:00 on day 6. Sampling data demonstrated a significant
difference in the total CFUs obtained from each of the methods used. Fallout plate data
shows no immediate trend across the plate types but with a significant increase over time.
Surface sampling done by RODAC plating collected data on the total CFU on a surface
the approximate area of a 100mm diameter circle. Surface testing indicates a general
increase in surface microbial content from an average of 3 cfu plate-1 to 19 cfu plate-1.
Spore content of the air samples was indicative of the total microbial bioburden (Figure
4.5).
4.4.5 Correlation of AEB and total biomass in outdoor environments
Figure 4.6 shows the microbiological sampling results with SAS in the Atacama Desert
and corresponding weather conditions measured by a portable weather station. Diurnal
variation in the number of culturable bacteria was observed, positively correlated with
relative humidity and wind speed, and inversely correlated with the air temperature and
UV irradiation. Fallout plates made of PDMS were used. No CFU was recovered during
the 12 hours of daytime. 4 ± 2 CFU plate-1 were obtained during the 12 hours at night.
The intense UV irradiation can be the cause for the inactivation of airborne bacteria
during the day.
98
4.4.6 Comparison of biofilm-forming environmental-strain B. subtilis and lab-strain B.
subtilis endospores
The ability to form fruiting bodies could be passed on over 3 generations with
intermittent sporulation, germination and outgrowth. Cultures of bacterial endospores (B.
subtilis 3160) were grown on TSA bacterial growth medium. Two weeks after the
culture was initiated, to allow time for the formation of bacterial endospores on the
surface of the biofilm, an SAS air sampler was used to measure the concentration of
spores which could easily be transported by moderate air flow over the surface of the
biofilm. It was determined that approximately 100 endospores could be recovered from
1000 L of air passed over the biofilm. A strain of B. subtilis that form biofilm and
delicate aerial structure was isolated from Mojave Desert (Figure 4.7). Two weeks after
colony formation on TSA, approximately 1000 endospores were recovered when 1000 L
of air passed over the culture. This finding demonstrated that under laboratory conditions,
surface microbial biofilm can release bacterial endospores that can be transported through
the air, resulting in the airborne spread of potentially dangerous microorganisms from
surfaces. No significant differences were observed in the unit DPA content and
germination properties between these endospores.
4.5 Discussion
Maintaining human health in confinement presents a unique challenge, which is significantly
exacerbated in space flight by the effects of microgravity, the duration of the mission, and the
possible interaction with contaminants in the spacecraft24. To manage the risk, we have
previously described the development of MEM as a real-time autonomous air monitor in a
99
spacecraft enclosed habitat, capable to detect as low as 100 endospores L-1 of air when 500 L of
air were sampled in 15 min. Apart from technological development, one must fully understand
the correlation between AEB level with the total biomass in an enclosed system with no outside
ventilation in order to help promulgation of exposure limits and safety levels, as well as
maximum allowable concentrations for airborne bacterial spores.
Suspended particulate matter of a diameter less than 10 µm (PM10) was used as a
measure of air quality in this study. It was well establish that sustained exposure to
elevated PM10 values was associated with a variety of health problems25. Regulatory
limits for PM10 values have therefore been imposed26,27. In this study, we have
employed the PM10 value, log transformed, as the variable of interest.
In this study, we have measured AEB and total biomass in a closed system under
laboratory controlled conditions and everyday indoor environemnts. A quantitative
correlation and mathematical model has been established under ideal conditions, such as
volume, air flow, turbulence and the number of microbes. The principal components of
each AEB and surface bacterial abundance is subjected to the analysis of variance (two-
way ANOVA) followed by a pairwise multiple comparisons. Principal component
analysis of the pairwise AEB and total biomass in indoor closed environments, such as
laboratory, offices, laminar flow hoods, produced two factors that accounts for 49%
(eigenvalue = 3.5) and 19% (eigenvalue = 1.5) of the total variance in the data set.
Clustering of component scores indicates an apparent tendency to form separate cluster
assignments under different environments. It is noticed the ratio of AEB and total
biomass can be projected with high accuracy using our model system when minimal
human activities are involved. As human activities and environmental factors play a
bigger role in the system, a positive correlation can still be observed between AEB and

100
total biomass, but these systems are difficult to model due to increased complexities as
shown in separate studies. A more comprehensive study on the effect of PM10 values due
to temporal and spatial behaviors is expected in future studies.
We used a three-pronged approach to testify the hypothesis. First, we
demonstrated a reproducible bioefficiency among three air samplers (SAS, MEM, E-
BAM) to validate the use of SAS in subsequent studies because of its compactness and
portability. Second, we performed air and surface sampling inside an AtmosBag under
controlled conditions. A two-compartmental mathematical model has been developed to
characterize the transport of airborne and surface endospores in this 12-L enclosure. The
model was extended to analyze a number of indoor areas, including laminar flow hoods,
laboratory and office spaces. Third, we studied the effect of human activities and
environmental factors in the correlation of airborne and total biomass in a system.
We describe the system as a two compartment system such that there is exchange
of materials between them. q1 and q2 are defined as state variables describing the number
of airborne endospores and the number of endospores on the surface. Exchange occur by
endospores transgressing some physical barrier, characterized by two rate constants, k12,
is the number of endospores transferred from air to surface per unit time and k21
represents the number of endospores aerosolized from surface into the air per unit time.
The basic assumption for the compartmental model is that endospores are distributed
homogenously in the entire system. The 2-compartment model structure is given as
followed. The model dynamics with state variables can be described in Figure 4.8, where
u1 and u2 in this system are delta function inputs. The two rate constants can be measured
by fallout plates (n = 10). The number of airborne endospore depositing on surfaces was
101
20.1 ± 7.2 cfu h-1 and the number of endospores being aerosolized was 2.0 ± 1.4 cfu h-1.
Therefore, k12 and k21 were calculated to be 0.0193 cfu min-1 cm-2 and 0.4109 cfu min-1
cm-2, respectively after unit conversion. Solving the system of differential equations, we
have obtained plots very close to actual results under ideal situation. While this is a very
simplistic model assuming well-controlled condition (especially air turbulence), it truly
reflects the environment inside a spacecraft. We then showed qualitatively that the
number of total endospores in a closed system was positively correlated with the degree
of human activity in Marshall Space Flight Center. Moreover the time course in a
spacecraft relevant environment (i.e., the MSFC simulated cabin) of airborne bacterial
spores shows a trend that is highly correlated to the time course of the environment,
human commensal, and fungal spore concentrations. This implies that a change in
airborne bacterial spore concentration can be used to indicate a corresponding change in
total microbial content in the cabin.
Air sampling has been carried out in the Atacama Desert to verify the model that
we have developed. The results high depend on the environmental factor, such as wind,
relative humidity and UV irradiation. PDMS was used as collection substrate for fallout
plates. During the day, the air was devoid of culturable microorganisms and fallout plate
also indicated zero counts. At night, counts were observed in both air sampling and
fallout plates. This shows that there exists an exchange of airborne and surface microbes
in the absence of UV irradiation. In addition, the wind speed was 5 times greater than that
in the daytime, reaching a peak velocity of 25 km h-1, which may be another reason for
the presence of aerosolization and deposition of microbes via wind as an agent. In
conclusion, in an outdoor environment, lots of other factors are dominating the airborne
102
bacterial concentration. In addition, surface bacteria are difficult to extract due to (1)
extreme radiation and temperature of the surface, (2) complex soil matrix and (3) sources
of contaminations from human and animal activities.
The MEM monitors the concentration of airborne bacterial spores in cabin air as
an indicator for total microbial concentration. Spore-forming bacteria of the genus
Bacillus are frequently among the most abundant genera in aerobic biofilms, and are
likewise among the most abundant genera found in the air and on surfaces. As a biofilm
grows, the population of the ever-present sporeforming bacteria and their endospores
increase proportionally. In fact, recent reports demonstrate that spore-forming species in
environmental biofilms form fruiting bodies, filled with bacterial spores that rise above
the biofilm to facilitate their release into the air. Thus, the airborne bacterial spore
concentration can be correlated to total microbial concentrations. In this experiment, we
also examined the aerosolization properties of a biofilm-forming endospore-forming
species isolated from the Mojave Desert. Although it has been reported that properties of
endospores depend largely on the sporulation condition, this environmental species still
retained its biofilm colony morphology after 3 generations. As expected, these biofilm-
forming endospores were 5 times more susceptible to aerosolization than laboratory
strain B. atrophaeus endospores that do not form biofilms. Nevertheless, the DPA content,
hydrophobicity and germination characteristics of this environmental strain are all similar
to B. atrophaeus endospores.
4.6 Conclusion
In conclusion, we have determined a quantitative relationship between airborne
103
endospores and total biomass in an enclosed environment. Airborne endospore bioburden
has the potential to be used in monitoring surface bioburden to anticipate buildup on
critical spacecraft hardware and expedite remediation. We propose the use the MEM as
an autonomous biosensor to monitor ARB in spacecrafts and space stations coupled with
a measurement of the two-way microbial transfer (deposition and aerosolization) by
simple fallout plate methodology achieved by convenient and compact culturing assays
such as the Petri-films. Work continues in instrument miniaturization and model
optimization. Future applications of the MEM is space habitat or in planetary exploration
will depend on NASA’s needs, but eventual deployment of the MEM as one part of a
fully automated environmental monitoring and control system is envisioned.
4.7 References
1. Rodgers, E.B., Seale, E.B., Boraas, M.E., and Sommer, C.V., in 19th Intersociety Conference on Environmental Systems (Volume IV-Appendix G Task 7 Report Advanced Instrumentation: Technology Database Enhancement, San Diego, CA, 1989).
2. Branda, S.S., Gonzalez-Pastor, J.E., Ben-Yehuda, S., Losick, R., and Kolter, R. Fruiting body formation by Bacillus subtilis. Proceedings of the National Academy of Sciences of the United States of America 98, 11621-11626 (2001).
3. Jan, D. AEMC Technology Development Requirements. (1998). 4. Nicogossian, A.E., Huntoon, C.L., and Pool, S.L., Space Physiology and Medicine. (Lea &
Febiger, Philadelphia, PA, 1994). 5. Gardner, D.E., in Toxicology of the Lung, edited by D. E. Gardner, J. D. Crapo, and R. O.
McClekkan (CRC Press, 1999). 6. Mennigmann, H.D. and Lange, M. Growth and differentiation of Bacillus subtilis under
microgravitiy. Naturwissenschaften 73, 415-417 (1986). 7. Pierson, D.L. Microbial contamination of spacecraft. Gravitational and Space Biology
Bulletin 14, 1-6 (2001). 8. Novikova, N. et al. Survey of environmental biocontamination on board the International
Space Station. Research in Microbiology 157, 5-12 (2006). 9. Taylor, G.R. Overview of spaceflight immunology studies. J Leukoc Biol 54, 179-188
(1993). 10. Sonnenfeld, G. The immune system in space, including Earth-based benefits of space-based
research. Curr Pharm Biotechnol 6, 343-349 (2005). 11. Smith, S.M. Red blood cell and iron metabolism during space flight. Nutrition 18, 864-866
(2002).
B CA
104
12. Konstantinova, I.V., Rykova, M.P., Lesnyak, A.T., and Antropova, E.A. Immune changes during long-duration missions. Journal of Leukocyte Biology 54, 189 (1993).
13. Venkateswaran, K., Chung, S., Allton, J., and Kern, R. Evaluation of various cleaning methods to remove bacillus spores from spacecraft hardware materials. Astrobiology 4, 377-390 (2004).
14. La Duc, M.T., Satomi, M., and Venkateswaran, K. Bacillus odysseyi sp. nov., a round-spore-forming bacillus isolated from the Mars Odyssey spacecraft. International Journal of Systematic and Evolutionary Microbiology 54, 195-201 (2004).
15. Venkateswaran, K. et al. Molecular microbial diversity of a spacecraft assembly facility. Systematic and Applied Microbiology 24, 311-320 (2001).
16. Lester, E.D. and Ponce, A. An anthrax "smoke" detector: Online monitoring of aerosolized bacterial spores. IEEE Engineering in Medicine and Biology Magazine 21, 38-42 (2002).
17. Lester, E.D., Gregory, B., and Ponce, A. A second-generation anthrax "smoke detector". IEEE Engineering in Medicine and Biology Magazine 23, 130-135 (2004).
18. Yung, P.T., Lester, E.D., Bearman, G., and Ponce, A. An automated front-end monitor for anthrax surveillance systems based on the rapid detection of airborne endospores. Biotechnology and Bioengineering 98, 864-871 (2007).
19. Pastuszka, J.S., Paw, U.K.T., Lis, D.O., Wlazlo, A., and Ulfig, K. Bacterial and fungal aerosol in indoor environment in Upper Silesia, Poland. Atmospheric Environment 34, 3833-3842 (2000).
20. Anonymous. NASA standard procedures for the microbiological examination of space hardware, NHB 5340.1D. Jet Propulsion Laboratory Communication, National Aeronautics and Space Administration (1980).
21. Lin, Y.P., in Environmental Monitoring, edited by G. B. Wiersma (CRC Press, Boca Raton, FL, 2004).
22. Cressie, N.A.C., Statistics for Spatial Data. (John Wiley, Hoboken, NJ, New York, 1993). 23. Macher, J.M. Positive-hole correction of multiple-jet impactors for collecting viable
microorganisms. American Industrial Hygiene Association journal 50, 561-568 (1989). 24. Taylor, G.R. Space microbiology. Annual Reviews in Microbiology 28, 121-137 (1974). 25. Sun, L.I., Zidek, J.V., Le, N.D., and Ozkaynak, H. Interpolating Vancouver's daily ambient
PM10 field. Environmetrics 11, 651-663 (2000). 26. Cox, C.S. and Wathes, C.M., Bioaerosols Handbook. (Lewis Publishers, Inc., 1995). 27. Cox, L.H. Statistical issues in the study of air pollution involving airborne particulate matter.
Environmetrics 11, 611-626 (2000).

105
Figure 4.1 | (a) The Microbial Event Monitor (MEM) is a derivative product of the
Anthrax Smoke Detector. (b) The E-BAM consists of a PM10 air inlet and β-attenuation
gauge for air sampling. (c) Spooling mechanism for continuous air sampling of E-BAM.
(d) Air samples of MEM and E-BAM are collected onto a 9-mm spot on filter tape. (e)
The “duo sas-super 360” air sampler, abbreviated as SAS, consists of two independent
aspirating heads for impaction air sampling
(a) (b)(b) (c)
(d) (e)
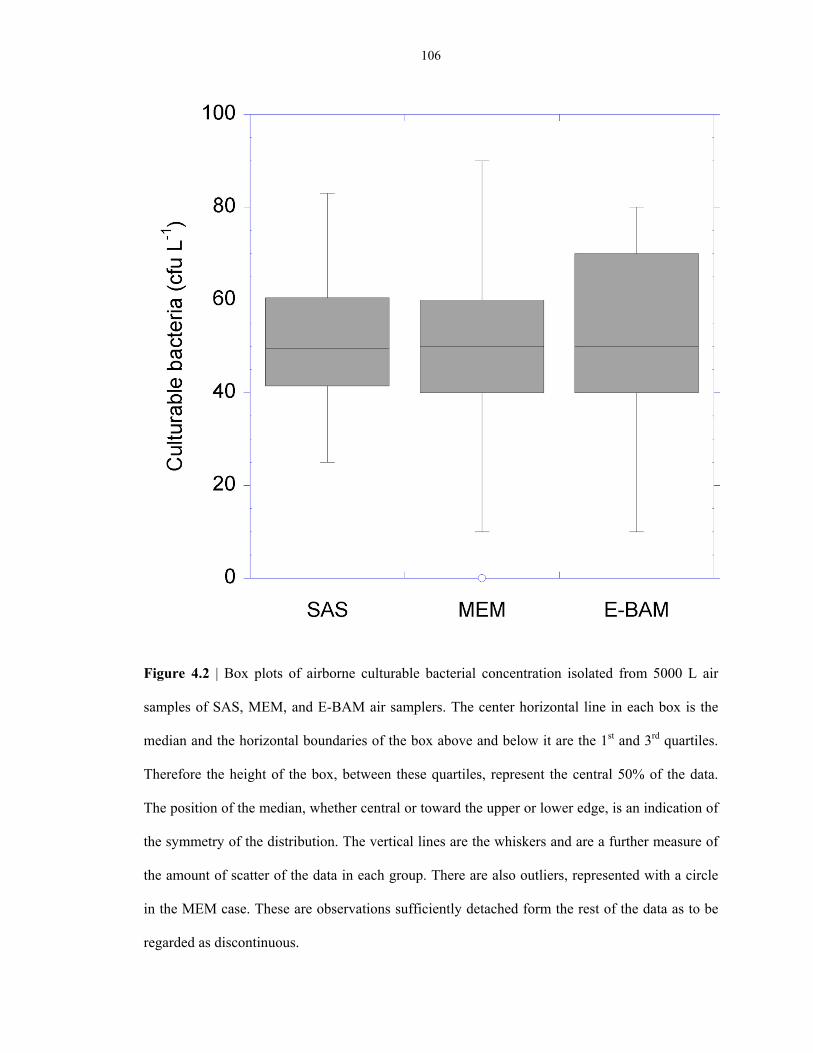
106
Figure 4.2 | Box plots of airborne culturable bacterial concentration isolated from 5000 L air
samples of SAS, MEM, and E-BAM air samplers. The center horizontal line in each box is the
median and the horizontal boundaries of the box above and below it are the 1st and 3rd quartiles.
Therefore the height of the box, between these quartiles, represent the central 50% of the data.
The position of the median, whether central or toward the upper or lower edge, is an indication of
the symmetry of the distribution. The vertical lines are the whiskers and are a further measure of
the amount of scatter of the data in each group. There are also outliers, represented with a circle
in the MEM case. These are observations sufficiently detached form the rest of the data as to be
regarded as discontinuous.
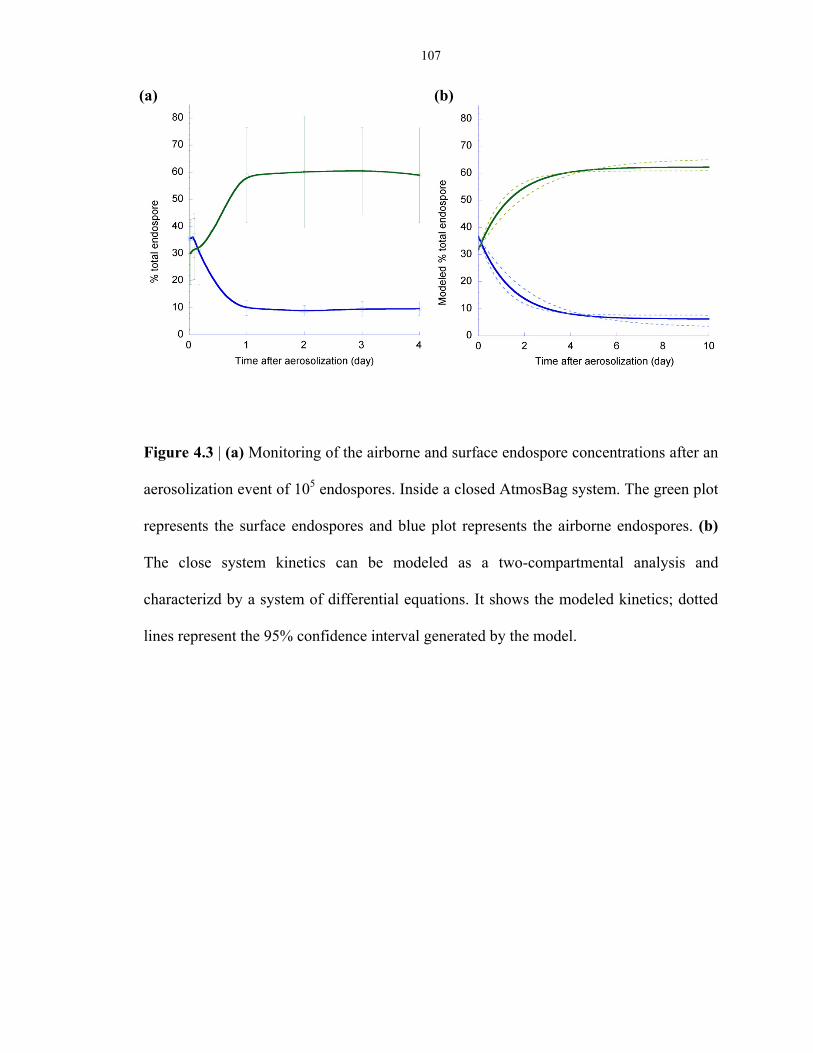
107
Figure 4.3 | (a) Monitoring of the airborne and surface endospore concentrations after an
aerosolization event of 105 endospores. Inside a closed AtmosBag system. The green plot
represents the surface endospores and blue plot represents the airborne endospores. (b)
The close system kinetics can be modeled as a two-compartmental analysis and
characterizd by a system of differential equations. It shows the modeled kinetics; dotted
lines represent the 95% confidence interval generated by the model.
(a) (b)
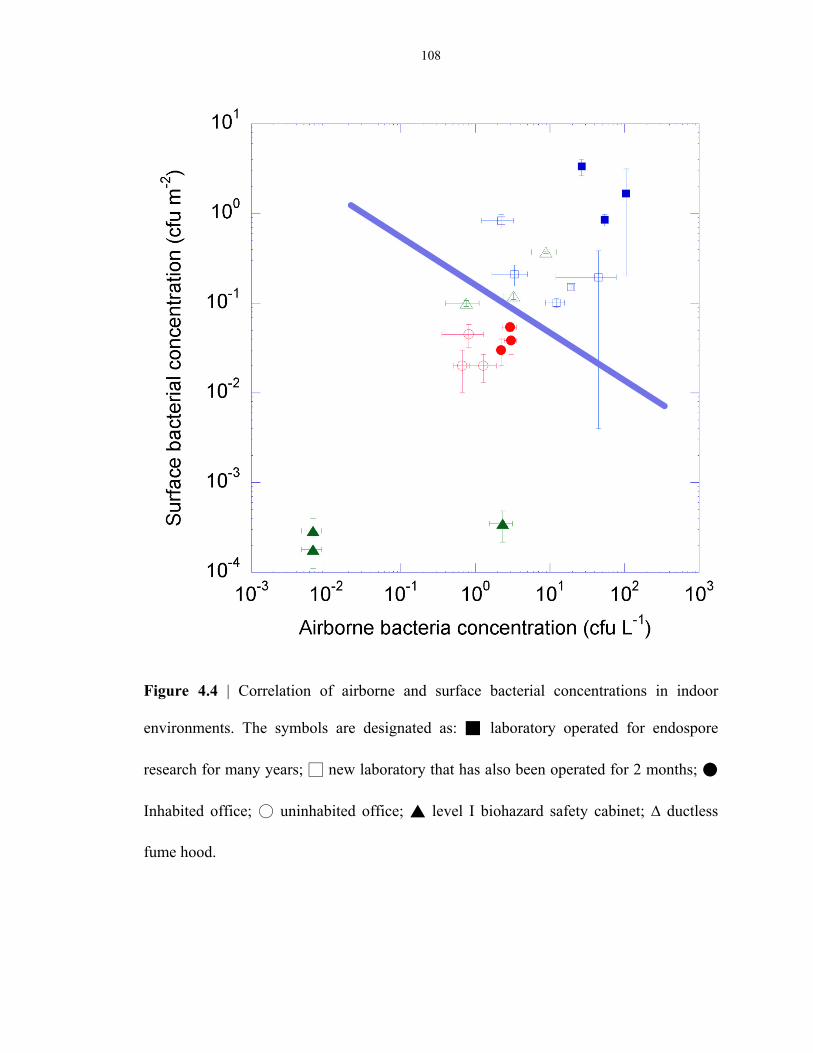
108
Figure 4.4 | Correlation of airborne and surface bacterial concentrations in indoor
environments. The symbols are designated as: laboratory operated for endospore
research for many years; new laboratory that has also been operated for 2 months;
Inhabited office; uninhabited office; level I biohazard safety cabinet; ∆ ductless
fume hood.
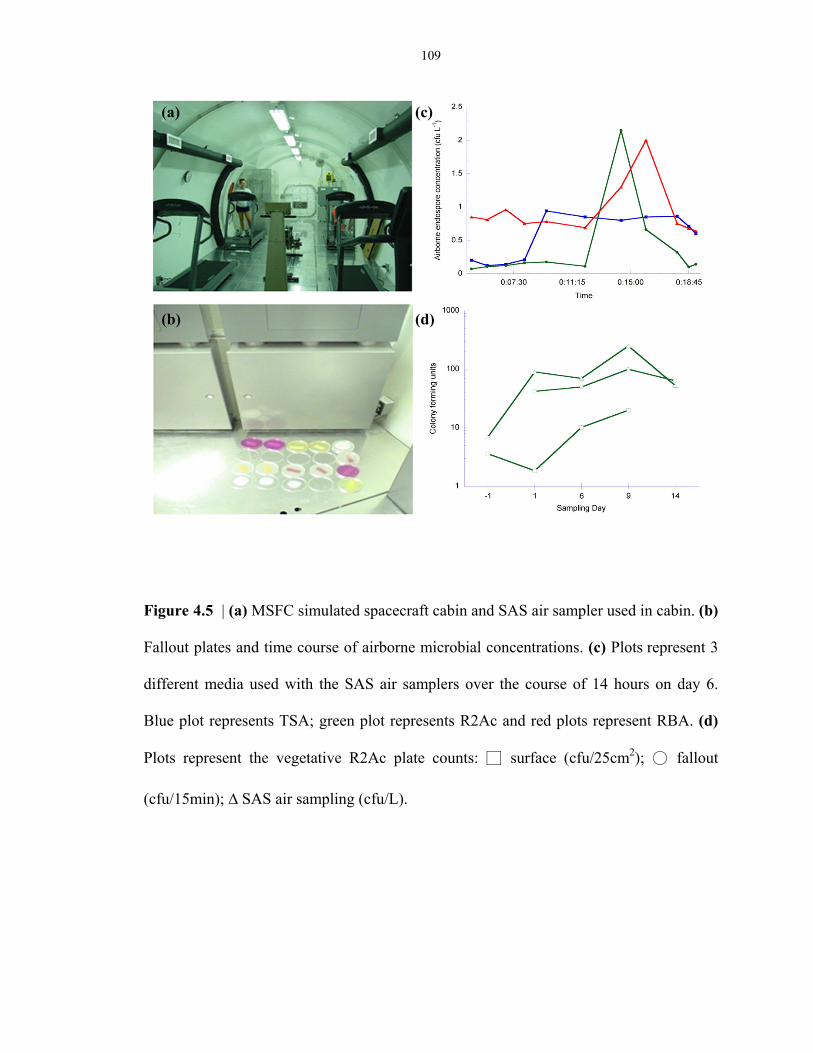
109
Figure 4.5 | (a) MSFC simulated spacecraft cabin and SAS air sampler used in cabin. (b)
Fallout plates and time course of airborne microbial concentrations. (c) Plots represent 3
different media used with the SAS air samplers over the course of 14 hours on day 6.
Blue plot represents TSA; green plot represents R2Ac and red plots represent RBA. (d)
Plots represent the vegetative R2Ac plate counts: surface (cfu/25cm2); fallout
(cfu/15min); ∆ SAS air sampling (cfu/L).
(a)
(b)
(c)
(d)

110
Figure 4.6 | Air sampling at the Atacama Desert.
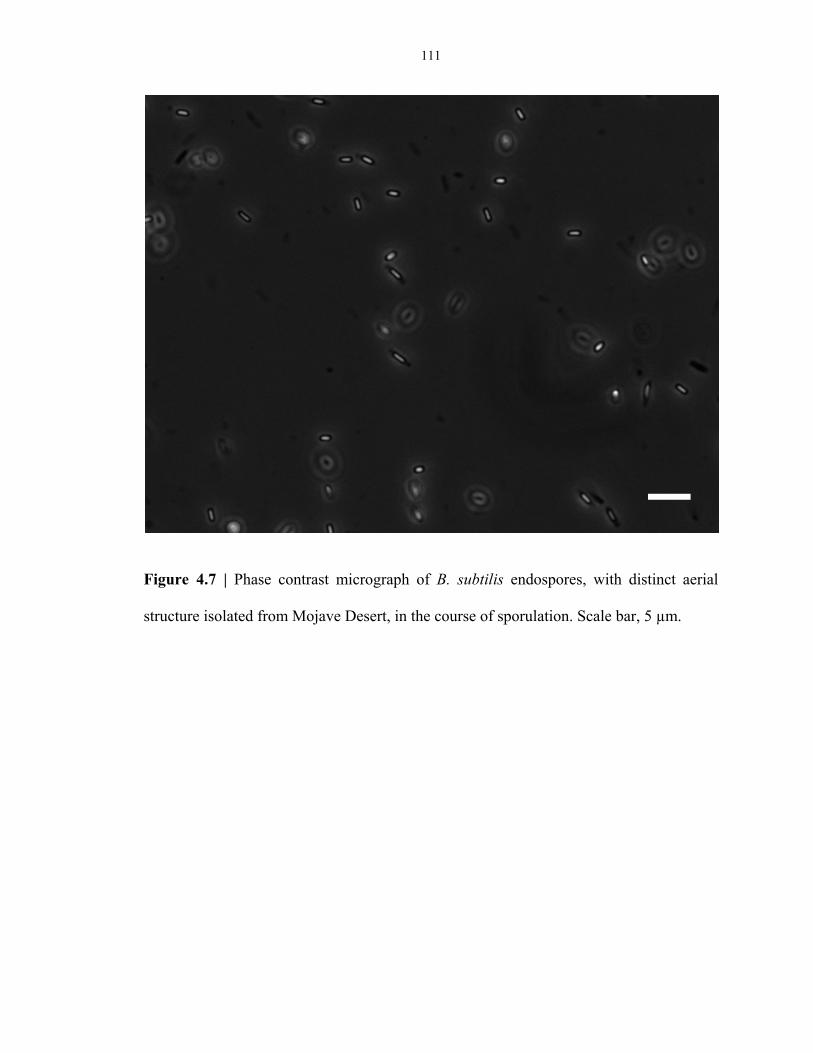
111
Figure 4.7 | Phase contrast micrograph of B. subtilis endospores, with distinct aerial
structure isolated from Mojave Desert, in the course of sporulation. Scale bar, 5 µm.
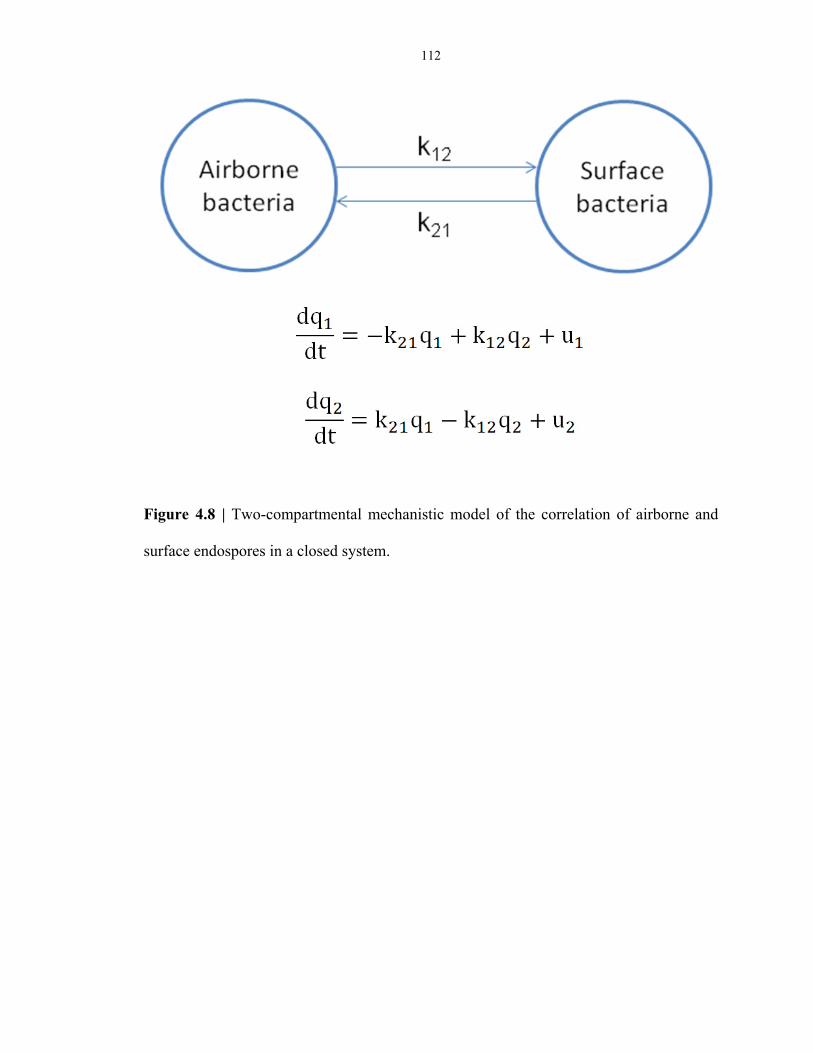
112
Figure 4.8 | Two-compartmental mechanistic model of the correlation of airborne and
surface endospores in a closed system.
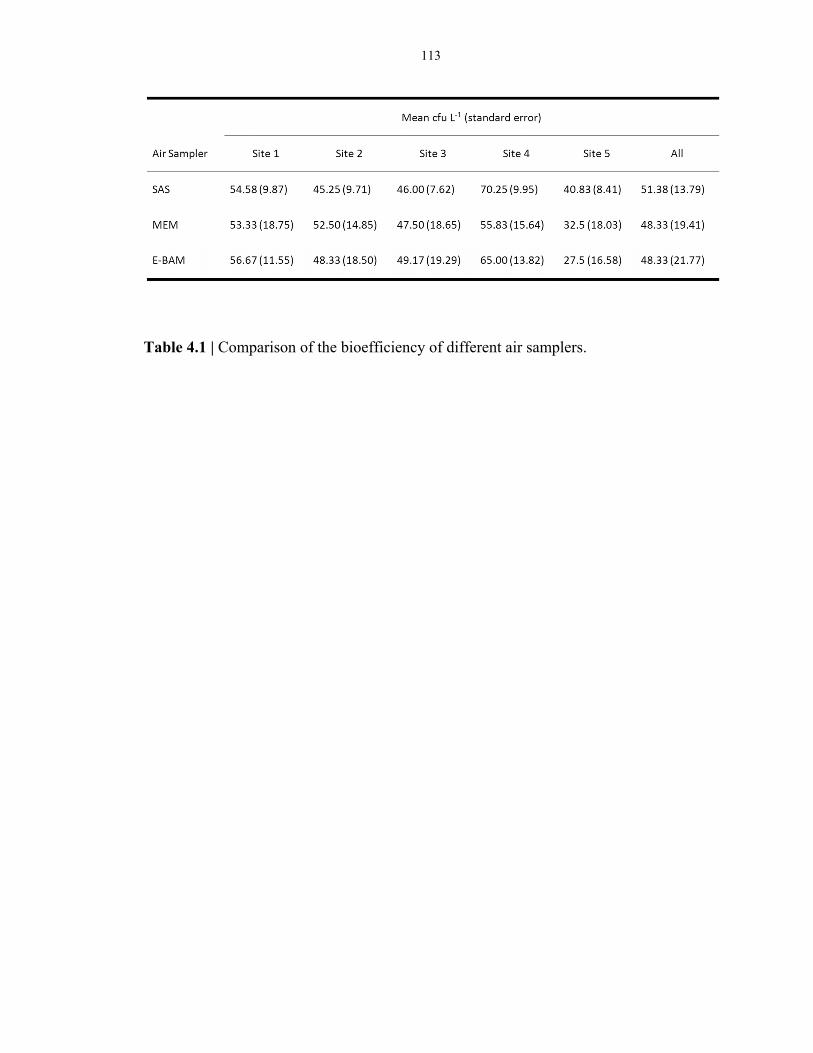
113
Table 4.1 | Comparison of the bioefficiency of different air samplers.

114
CHAPTER 5: RAPID STERILIZATION ASSESSMENT BY MONITORING
INACTIVATION OF GERMINABLE BACILLUS ENDOSPORES
5.1 Abstract
Bacillus endospores are in standard use as biological indicators for evaluating the
effectiveness of sterilization processes. We describe a rapid endospore viability assay
(EVA) capable of enumerating germinable endospores in 10-15 min. Germinating
endospores release ~108 molecules of dipicolinic acid (DPA) when immobilized onto
terbium ion (Tb3+)/L-alanine-doped agarose, which enables enumeration under UV
excitation of resultant green luminescent spots with time-gated Tb-DPA luminescence
microscopy (i.e., μEVA). The intensity timecourses of the luminescent spots were
characteristic of the stage I germination dynamics. μEVA was applied to monitor
inactivation of initial 5 × 10⁶ CFU endospore populations to sterility as a function of
thermal (95 °C) and UV (254 nm, 22 μW/cm2) dosage in aqueous suspension. μEVA and
culturing yielded nearly identical decimal reduction (D)-values for both inactivation
methods, thus validating μEVA as a rapid alternative for monitoring sterilization
processes.
5.2 Introduction
The era of modern microbiology began in the 1870s when the lifecycle of an endospore-
forming pathogen, Bacillus anthracis, was elucidated using new methods for isolating
pure cultures from single cell clones on solid growth media. Bacterial endospores are

115
dormant microbial structures that are highly resistant to chemical, physical, and radiation
sterilization processes1,2. In fact, Bacillus subtilis endospores have survived for six years
in space while exposed to high vacuum, temperature extremes, and intense solar and
galactic radiation3,4.
Since bacterial endospores are the last to remain viable during sterilization
processes that readily kill vegetative bacteria, they are routinely employed as biological
indicators (i.e., biodosimeters) to validate and monitor the effectiveness of sterilization
methods, such as those employed in the medical device, pharmaceutical, health care, food
preparation, and wastewater remediation industries5. Moreover, the rise of drug resistant
pathogens (e.g., MRSA6), especially in hospitals, has further increased the importance of
hygiene verification and validation of sterilization methods7. Even more ominous has
been the usage of biological weapons such as the B. anthracis laden letters in 20018,9.
After the attack, biological indicators were deployed to evaluate the effectiveness of
decontamination and restoration of postal facilities and the Senate building10.
The effectiveness of sterilization processes are measured and reported in terms of
sterility assurance levels (SALs), which are defined as the expected probability that a
product remains contaminated with viable microorganisms after exposure to a validated
sterilization process. A sterilization process that yields predictable SALs is considered to
be validated. Confidence in achieving a required SAL is obtained by the use of
biological indicators that present a considerably greater population and resistance
challenge than the expected bioburden11, and the most effective way to test the efficiency
of a sterilization process is to place biological indicators within and on test products of
interest.
116
Currently, endospore inactivation is quantified by measuring the log reduction in
colony forming units (CFU). This method, however, requires several days of incubation,
during which 20 cycles of cell replication ultimately yield visible colonies can then be
enumerated. In contrast, endospore germination can be initiated and monitored on a
timescale of minutes. Germination of Bacillus endospores can be triggered by simple
biomolecules such as L-alanine, L-asparagine, or glucose12,13, which causes the release of
approximately 108 molecules of dipicolinic acid (DPA) from the core of the endospore
during the first stage of germination. DPA exists in all bacterial endospores as 5%-15%
of the cellular dry weight, and is a unique, defining constituent of endospores cellular dry
weight14,15.
Here we report details of a rapid endospore viability assay (EVA) in which B.
atrophaeus endospores were immobilized on terbium ion (Tb3+)/L-alanine-doped agarose
(Figure 5.1). The L-alanine serves to trigger germination, during which DPA is released
from endospores. The Tb3+ subsequently binds DPA, resulting in green luminescent
spots under UV excitation in a microscope field-of-view, which were enumerated as
germinable endospores using time-gated Tb-DPA luminescence microscopy (i.e., μEVA).
Here we validate µEVA against culturing as a method for rapid endospore viability
assessment, and evaluate its application for monitoring endospore inactivation by thermal
and UV sterilization regimens.
117
5.3 Methods
5.3.1 Chemicals
Terbium (III) chloride hexahydrate, 99.999%, L-alanine and other salts were purchased
from Sigma (St. Louis, MO) and were used as received. UltrapureTM agarose (>90%) was
purchased from Invitrogen (Carlsbad, CA). Tryptic soy agar (TSA), nutrient broth and
agar were obtained from Becton, Dicksinon and Company (Sparks, MD).
5.3.2 Preparation of endospore stock suspension
B. atrophaeus (ATCC 9372) endospores were purchased from Raven Biological
Laboratories. B. subtilis (ATCC 27370) vegetative cells were grown on TSA and
inoculated onto a sporulation medium after reaching exponential growth phase. The
sporulation medium contained 1.6% nutrient broth, 1.6% agar, 0.2% KCl, 0.05% MgSO4,
1 mM Ca(NO3)2, 100 µM MnCl2·4H2O, 1 µM FeSO4 and 0.1% glucose (pH 7.0)16. After
incubation at 37 °C for 1 week, cells were suspended into sterile deionized water. With
phase contrast microscopy, 95% of the cells formed endospores free of sporangia.
Endospores were harvested and separated from vegetative cells and debris by
centrifugation at 6,300 g, washing 10 times and sonication (25 kHz) for 5 min. The
endospore suspension was incubated in lysozyme (0.2 mg/mL) and trypsin (0.1 mg/mL)
at 30 °C with constant stirring overnight to lyse and degrade vegetative cells. Endospores
were purified by 8 cycles of centrifugation (6,300 g) and washed with sterile deionized
water until >99.9% of the cells were fully refractile with no noticeable cellular debris.
Endospore suspensions were stored at 4 °C in the dark before use. Total endospore
118
concentrations were determined using a Petroff-Hausser hemocytometer and CFU
concentrations were determined using TSA spread plating in triplicate measurements.
5.3.3 Sample Preparation for µEVA experiments
Endospore suspensions were filtered onto 0.2 µm polycarbonate membrane filters
(Whatman, Florham Park, NJ) using filtration manifolds of different diameters depending
on the desired concentration factor such that there were less than 300 endospores per
microscopic field of view. To ensure that the endospore surface density was optimal for a
given initial endospore concentration, suspensions of >106 sp mL-1 were filtered onto 25
mm diameter spots using glass filtration funnels, and suspensions of <106 sp mL-1 were
filtered onto 1.5-mm2 spots using a 96-well micro-sample filtration manifold (Schleicher
& Schuell, Keene, NH). Endospores concentrated on the filter were transferred to a ~0.5
mm thick, 9 mm diameter slab of 1.5% agarose substrate containing 100 µM TbCl3 and
20 mM L-alanine mounted in a silicone isolator (Molecular Probes, Eugene, OR) on a
quartz microscope slide. After endospore transfer, the agarose surface was covered with a
piece of 0.2-mm-thick polydimethylsiloxane (PDMS).
Polydimethylsiloxane (PDMS) was prepared by mixing the polymer base and
curing agent (Sylgard, Dow Corning) in 10 to 1 ratio. After degassing, the mixture was
cast over a 0.2-mm thick stainless steel mold and cured in an oven for 2 hours at 65 °C.
Agarose, silicone isolator and PDMS were autoclaved at 121 °C for 15 min before use.
A piece of PDMS was peeled off and attached on top of an endospore-laden agarose
surface for sealing.
119
5.3.4 The µEVA instrument
The instrument consists of a time-gated camera (Photonics Research Systems, Salford,
UK) mounted on a Nikon SMZ800 stereoscopic microscope (large working distance for
xenon lamp), a xenon flashlamp (Perkin-Elmer, Waltham, MA) mounted at 45 degrees
with respect to the sample, and a temperature controlled microscope slide holder
(Thermal). The slide holder enabled endospores to germinate at 37 °C. The CCD camera
has a resolution of 752 × 582 pixels at 14 bits with a chip size of 2/3 inch. The camera
has 50% sensitivity between 430-730 nm, with peak sensitivity at 550 nm. It was Peltier-
cooled to 40 °C below ambient temperature and was synchronized to the xenon lamp via
TTL pulses (300 Hz with tail time up to 50 µs). A highpass filter (03FCG067, Melles
Griot) centered at 500 nm was placed along the light path on the emission side before
reaching the microscope objective. We collected time stacks of time-gated images by
real-time streaming with a delay of 100 µs and exposure time of 5 s in each frame.
5.3.5 Endospore germination and germinable endospore assignment
Endospore germination on agarose surface followed the reported micro-germination
dynamics17. DPA released from single B. atrophaeus and B. subtilis endospores
manifested as individual bright spots in 15 minutes under time-gated microscopy due to
local formation of Tb-DPA. We performed image analysis in Matlab to obtain
background-subtracted stack of time-gated images. Assignment of germinable
endospores was made based on intensity and size. Adaptive thresholding was applied to
segment pixels that were 3 times brighter than the background with a characteristic rising
intensity. Each bright spot must exhibit a continuous rising intensity over the course of
120
germination in order to register an endospore count. This criterion eliminated false
positives by not counting sporadic bright spots and long-lived luminescent interference.
The 8-connected adjacent pixels were analyzed to screen for endospore clumps. The
number of endospores present was calculated by dividing the squared sum of neighboring
pixel brightness by the mean brightness of an individual endospore determined
empirically. This was done in a recursive way until all of the pixels were counted and
marked. Germinable endospore units would be reported as too numerous to count if they
exceeded 300 in a field of view. Further dilution would be carried out in those cases.
5.3.6 Phase contrast microscopy for measuring total endospore concentration
Total number of endospores was determined by direct enumeration using a
hemocytometer counting chamber under phase contrast microscopy. At high
concentrations (i.e., >106 sp mL-1), populations were calculated based on average of 10
random microscopic fields of view. At low concentrations (i.e., <106 sp mL-1), an air-
dried smear of known volume of endospore suspension was imaged. The entire area of
the smear would be counted due to low numbers and uneven spatial distribution.
Motorized stage and automatic counting algorithm expedited the capturing and analysis
of more than 100 images per sample.
5.3.7 Inactivation experiments
Heat resistance and UV resistance were measured by germinability (DPA release) and
culturability (colony formation on TSA) of water-suspended endospores. In the heat
121
inactivation experiment, 2 mL of B. atrophaeus endospores in sealed glass vials were
heat treated in a water bath at 95 °C. Vials were removed and placed in ice at different
time intervals for µEVA and CFU enumeration. Lethality of the process includes only
the holding period at 95 °C. In the UV inactivation experiment, 2-mL aliquot of B.
atrophaeus endospores contained in a 6 cm diameter glass Petri dish was exposed to 254
nm UV from a mercury lamp (UVP, Upland, CA), coupled with a 0.7 neutral density
filter. Uniform UV exposure was achieved by agitating the Petri dish on an orbital shaker
(60 rpm). The area of aliquot spread on the dish, and therefore the amount of energy
delivered in joules was determined to be 22.9 µW/cm2. After varying lengths of
irradiation, endospore suspensions were transferred into vials under ice for subsequent
µEVA and CFU enumeration.
5.3.8 Statistical analysis
In this study, bacterial counts could be categorized into 2 regimes of distribution. High
count regimes were defined as containing >10 counts per field of view for µEVA, and
>10 counts per growth plate for culturing experiments, which followed Gaussian
distribution. A square root transformation was performed on some of the data to
homogenize the variance and normalize the negative skewness. Normality was tested
using the Shapiro-Wilk test by looking at skewness and kurtosis of the distribution.
Parametric analyses such as Student t-test was used to determine the confidence interval
and F-test was used to examine differences between the sample variances. Low count
regimes were defined as containing <10 counts per field of view for µEVA, and <10
counts per growth plate for culturing experiments followed Poisson distribution. Non-

122
parametric analyses, such as Wilcoxon test, were used to determine the confidence
interval, and Kruskal-Wallis test was used for variance analysis. We reported the 95%
confidence interval based on 1.96 standard deviation of the normally distributed datasets.
Data falling within 5% and 95% percentile ranking constituted the reported 95%
confidence interval for the Poisson distributed datasets.
5.3.9 Spectroscopy
Spectroscopy was performed on endospore suspensions prepared to a final volume of 3
mL and contained 100 mM L-alanine and 10 µM TbCl3, unbuffered, at pH 6.2 in
disposable methacrylate cuvettes (Perfector Scientific). All solutions were freshly
prepared using 0.2-µm filter sterilized 18.2 MΩ-cm deionized water and used within one
week. Tb-DPA luminescence excitation spectrum (λex= 250–360 nm, λem = 544 nm) and
emission spectrum (λex = 278 nm, λem = 515–580 nm) were recorded at room temperature
with a Fluorolog 3 fluorimeter (Jobin Yvon) with double monochromators. Emission
intensities were quantified by integrating the area under the 544-nm peak with baseline
subtraction, and translated into endospore concentration by comparing to a calibration
curve determined. Endospore suspension in cuvettes was measured at a right-angled
configuration. Endospores immobilized on agarose were measured in front face. A 500-
nm highpass filter (Omega Filters) was placed at the entrance of the emission
monochromator to prevent second-order diffraction.
123
5.4 Results
We validated μEVA for analysis of germinable endospores in water suspension using a
three-pronged approach. First, we confirmed the assignment that μEVA luminescent
spots are germinable endospores by comparing single endospore germination dynamics
observed with phase contrast microscopy and μEVA. Second, we evaluated μEVA
sensitivity, dynamic range, and false positive rate in comparison to standard TSA
culturing. Third, we applied μEVA versus TSA culturing to monitor thermal and UV
inactivation of B. atrophaeus.
5.4.1 Monitoring single endospore germination dynamics
A comparison of phase contrast microscopy and μEVA time-lapse images are shown in
Figure 5.2. After a brief microlag period, DPA release, followed by water influx, takes
place during the first stage of germination12,18. DPA release was observed with μEVA
via DPA complexation with the Tb3+-doped into the agarose matrix. The water uptake
can be observed with phase contrast microscopy as phase bright endospores transition
into phase dark germinated endospores. The timecourse data clearly show the
coincidence of DPA release and water uptake going to completion in approximately 15
min, which is consistent with stage I germination17. The microlag time reported by
µEVA and phase contrast microscopy was 3 and 8 min, respectively, which is also
consistent with the sequence of germination13. In addition, time-lapse excitation spectra
observed during germination show characteristic Tb-DPA excitation spectra (λmax = 271
and 279 nm, Figure 5.6) confirming the release of DPA under μEVA conditions. In
combination, these data establish that μEVA observables are germinating endospores.
124
5.4.2 Sensitivity, dynamic range, and false positive rate
To further validate μEVA, we performed parallel germination and culturing experiments
over seven orders of magnitude in endospore concentration. Figure 5.3 shows the
germinable endospore concentrations measured with μEVA, and culturable endospore
concentrations measured with TSA plate counting plotted against total endospore
concentrations as determined with phase contrast microscopy in the trace concentration
regime of 0 - 52 spores mL-1. Sterile samples did not yield false positive counts, which
enabled us to achieve the ultimate sensitivity of one germinable endospore per μEVA
field of view. Of the total endospore concentrations, μEVA revealed that 56.7% ± 4.4%
were germinable endospores and TSA culturing determined that 38.4% ± 3.5% were
culturable endospores. The ratio of germinable/culturable was 1.48, which is consistent
with the fact that a subset of the total endospore population is germinable-but-not-
culturable. Similar to plate counting, where dilution factors are applied until the
concentration yields 30-300 cfu plate-1, μEVA requires concentrations that are less than
200 germinable endospores per field of view. Figure 5.7 shows μEVA versus TSA plate
counting results after application of appropriate dilution factors to samples in the 101 -
106 endospores mL-1 concentration range.
5.4.3 Monitoring thermal and UV sterilization of Bacillus atrophaeus endospores
The inactivation of B. atrophaeus endospores using thermal treatment at 95 °C and UV
irradiation at 254 nm with a power of 22.9 µW/cm2 was monitored from an initial
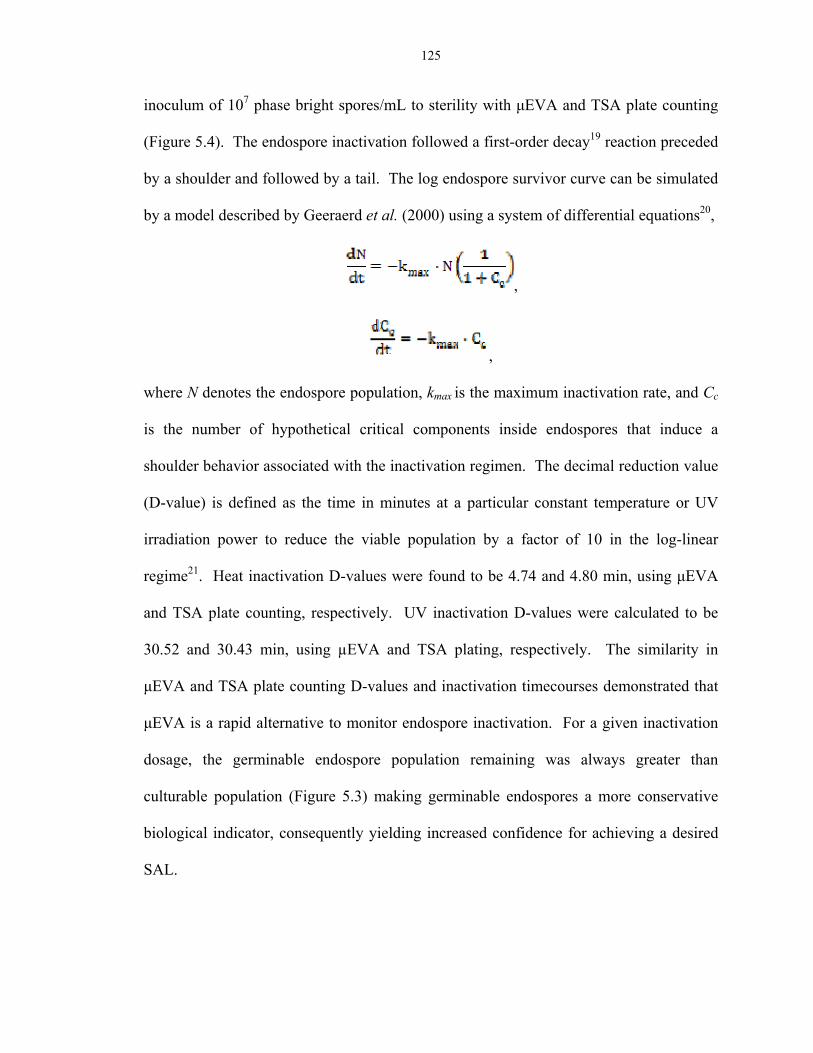
125
inoculum of 107 phase bright spores/mL to sterility with μEVA and TSA plate counting
(Figure 5.4). The endospore inactivation followed a first-order decay19 reaction preceded
by a shoulder and followed by a tail. The log endospore survivor curve can be simulated
by a model described by Geeraerd et al. (2000) using a system of differential equations20,
,
,
where N denotes the endospore population, kmax is the maximum inactivation rate, and Cc
is the number of hypothetical critical components inside endospores that induce a
shoulder behavior associated with the inactivation regimen. The decimal reduction value
(D-value) is defined as the time in minutes at a particular constant temperature or UV
irradiation power to reduce the viable population by a factor of 10 in the log-linear
regime21. Heat inactivation D-values were found to be 4.74 and 4.80 min, using μEVA
and TSA plate counting, respectively. UV inactivation D-values were calculated to be
30.52 and 30.43 min, using µEVA and TSA plating, respectively. The similarity in
μEVA and TSA plate counting D-values and inactivation timecourses demonstrated that
μEVA is a rapid alternative to monitor endospore inactivation. For a given inactivation
dosage, the germinable endospore population remaining was always greater than
culturable population (Figure 5.3) making germinable endospores a more conservative
biological indicator, consequently yielding increased confidence for achieving a desired
SAL.
126
5.5 Discussion
Since Koch identified endospore-forming pathogens from diseased animals in 1876,
endospores became the gold standard for sterilization validation. The definition for
viability had originally been synonymous with culturability22 until the discovery that
viable-but-not(yet)-culturable (VBNC) populations comprise more than 99% of
environmental microorganisms23. For laboratory strains, including biological indicator
species, colony formation is certainly the most direct measurement for viability. This,
however, requires approximately 20 cycles of replication over several days of incubation
before colonies become visible, and is therefore not amenable for either rapid or
automated endospore viability assessment.
Rapid endospore viability assessment is achieved by measurement of early
observables in the germination-replication pathway. In particular, DPA release with
subsequent water uptake can be observed during stage I germination, which occurs within
minutes of germinant addition. A shorter microlag time was observed using µEVA
because DPA release takes place earlier than water influx. In our investigation, we have
demonstrated that individual germinable endospores can be enumerated on a timescale of
10 min via Tb-DPA luminescence with μEVA. We validated μEVA for monitoring
sterilization processes with reproducible correlation to heterotrophic plate counts. The
thermal and UV inactivation experiments monitored by μEVA and heterotrophic plate
counts show that germination is an excellent indicator of viability, and that inactivation of
germinability and culturability are correlated as evidenced by the reproducible
inactivation curves and corresponding D-values.
127
In μEVA experiments, individual germinable endospores are counted in a
microscope field-of-view after germinant addition. As endospores germinate, ~108 DPA
molecules are released into the immediate area surrounding the endospore. DPA then
combines with Tb3+ in the agarose matrix to form the Tb-DPA luminescence halos under
UV excitation24. The germinating endospores manifest as bright spots that grow in
intensity over a period of 3-5 min., and are enumerated in a microscope field of view.
The characteristic germination timecourse allows unambiguous assignments of
germinating endospores. The duration of germination depends on a number of factors,
such as species, inoculum size, germinants, and temperature. The reported phase
transition for individual bacterial endospores ranges from 75 seconds to approximately an
hour17. This is manifested in the observed µEVA time course overlays for different
species with germination times ranging from 7 to 22 min (Figure 5.5).
Previously, we reported on a related method where germinating endospores were
enumerated in bulk suspension by luminescence spectroscopy (i.e., SpectroEVA), where
Tb-DPA luminescence intensities were tabulated against a B. atrophaeus endospore
calibration curve25. Results obtained by a comparison of µEVA and spectroEVA showed
that the two methods are in good agreement (Figure 5.8). The μEVA approach is
superior to spectroEVA because μEVA is capable of enumerating single endospores
while the limit of detection of spectroEVA is 1,000 spores mL-1. This advantage is
gained because in μEVA experiments the mM DPA halos surrounding single germinated
endospores are readily imaged with high contrast, whereas germination of single
endospores in bulk suspension (~1 mL) gives rise to mere fM DPA concentrations, which
are far below LOD for spectroEVA.

128
The unique photophysical and chemical characteristics of the Tb-DPA
luminescence26 endospore viability assay make µEVA a powerful instrument tool for
endospore viability assessment and validation of sterilization. With μEVA, we take
advantage of the long luminescent lifetime (τ = 0.5 to ~2 ms) of Tb-DPA27, enabling the
use of time gating to effectively remove background fluorescence (i.e., interferent
fluorophores with nanosecond lifetimes). Time gating eliminates potential false positive
causing features and renders the image background dark. Elimination of this background
enables a striking increase in image contrast and detection sensitivity even for the most
challenging environmental extracts (Figure 5.5, blue data), including near sterile
Atacama Desert28,29, Chile soil extracts, Greenland ice cores30, and Arctic permafrost, and
Antarctic lakes (Lake Vida).
µEVA is not only much more rapid than culture dependent methods (10-15 min
vs. 2-3 days), but the simple chemistry, instrumentation, and image analyses are all
amenable for automation. Automated viability assessment of endospores will have the
potential to find application in many areas where microbial inactivation needs to be
monitored and assured, including health care, food, and pharmaceutical industries.
Specific examples for applications include, automated performance testing for autoclaves,
milk powder production lines, wastewater treatment facilities, and validation of bioagent
inactivation after a biological attack. In the case of an anthrax attack, rapid viability
assessment technology will aid field personnel to rapidly determine the viability of
anthrax endospores before and after countermeasures. In the case of biological attacks
with other agents (e.g., Y. pestis, F. tularensis, Brucella, and Burkholderia species,
129
Variola and Foot and Mouth Disease (FMD) viruses), Bacillus endospores can be used as
a biological indicator for monitoring decontamination efficiency.
5.6 References
1. Nicholson, W.L., Munakata, N., Horneck, G., Melosh, H.J., and Setlow, P. Resistance of Bacillus endospores to extreme terrestrial and extraterrestrial environments. Microbiology and Molecular Biology Reviews 64, 548-572 (2000).
2. Setlow, P., in Bacterial Stress Response, edited by G. Storz, Hengge-Aronis, R. (ASM Press, Washington, D.C., 2000), pp. 217-230.
3. Horneck, G., Bucker, H., and Reitz, G. Long-term survival of bacterial spores in space. Advances in space research: the official journal of the Committee on Space Research (COSPAR) 14, 41-45 (1994).
4. Nicholson, W.L. Using thermal inactivation kinetics to calculate the probability of extreme spore longevity: Implications for paleomicrobiology and lithopanspermia. Origins of Life and Evolution of the Biosphere 33, 621-631 (2003).
5. Rutala, W.A. and Weber, D.J. Disinfection of endoscopes: review of new chemical sterilants used for high-level disinfection. Infection control and hospital epidemiology 20, 69-76 (1999).
6. Boyce, J.M. et al. Meticillin-resistant Staphylococcus aureus. The Lancet Infectious Diseases 5, 653-663 (2005).
7. Dancer, S.J. Importance of the environment in meticillin-resistant Staphylococcus aureus acquisition: the case for hospital cleaning. The Lancet Infectious Diseases 8, 101-113 (2008).
8. Higgins, J.A. et al. A field investigation of Bacillus anthracis contamination of US Department of Agriculture and other Washington, DC, buildings during the anthrax attack of October 2001. Applied and Environmental Microbiology 69, 593-599 (2003).
9. Small, D., Klusarwitz, B., and Muller, P. Evaluation of Bacillus anthracis contamination inside the Brentwood Mail Processing and Distribution Center, District of Columbia. Morbidity and Mortality Weekly Reports 50, 5 (2001).
10. Sharp, R.J. and Roberts, A.G. Anthrax: the challenges for decontamination Journal of Chemical Technology & Biotechnology 81, 1612-1625 (2006).
11. Pflug, I.J. and Evans, K.D. Carrying out biological qualification, the control operation of moist-heat (steam sterilization) processes for producing sterile pharmaceuticals and medical devices. PDA journal of pharmaceutical science and technology 54, 117-135 (2000).
12. Gould, G.W. and Hurst, A., The Bacterial Spore. (Academic Press, New York, 1969). 13. Setlow, P. Spore germination. Current Opinion in Microbiology 6, 550-556 (2003). 14. Powell, J.F. Isolation of dipicolinic acid (pyridine-2-6-dicarboxylic acid) from spores of
Bacillus megaterium. Biochemical Journal 54, 210-211 (1953). 15. Halvorson, H.O. and Howitt, C., in Spores, edited by H. O. Halvorson (Burgess Publishing
Company, Minneapolis, 1961), Vol. II, pp. 149-165. 16. Nicholson, W. and Setlow, P., in Molecular biology methods for Bacillus, edited by SM
Cutting (John Wiley and Sons, Sussex, England, 1990), pp. 391-450. 17. Hashimoto, T., Frieben, W.R., and Conti, S.F. Microgermination of Bacillus cereus spores.
Journal of Bacteriology 100, 1385-1392 (1969). 18. Sacks, L.E. Chemical germination of native and cation-exchanged bacterial spores with
trifluoperazine. Applied and Environmental Microbiology 56, 1185-1187 (1990).
130
19. Chick, H. An investigation of the laws of disinfection. Journal of Hygiene 8, 92-158 (1908). 20. Geeraerd, A.H., Herremans, C.H., and Van Impe, J.F. Structural model requirements to
describe microbial inactivation during a mild heat treatment. International Journal of Food Microbiology 59, 185-209 (2000).
21. Bigelow, W.D. The logarithmic nature of thermal death time curves. Journal of Infectious Disease 29, 528-536 (1921).
22. Kell, D.B., Kaprelyants, A.S., Weichart, D.H., Harwood, C.R., and Barer, M.R. Viability and activity in readily culturable bacteria: a review and discussion of the practical issues. Antonie van Leeuwenhoek 73, 169-187 (1998).
23. Barer, M.R. and Harwood, C.R. Bacterial viability and culturability. Advances in Microbial Physiology 65, 2776-2780 (1999).
24. Grenthe, I. Stability relationships among the rare earth dipicolinates. Journal of the American Chemical Society 83, 360-364 (1961).
25. Shafaat, H.S. and Ponce, A. Applications of a rapid endospore viability assay for monitoring UV inactivation and characterizing arctic ice cores. Applied and Environmental Microbiology 72, 6808-6814 (2006).
26. Cable, M.L., Kirby, J.P., Sorasaenee, K., Gray, H.B., and Ponce, A. Bacterial spore detection by [Tb3+(macrocycle)(dipicolinate)] luminescence. Journal of the American Chemical Society 129, 1474-1475 (2007).
27. Jones, G. and Vullev, V.I. Medium effects on the photophysical properties of terbium(III) complexes with pyridine-2,6-dicarboxylate (supporting information). Journal of Physical Chemistry A 106, 8213-8222 (2002).
28. Navarro-Gonzalez, R. et al. Mars-like soils in the Atacama Desert, Chile, and the dry limit of microbial life. Science 302, 1018-1021 (2003).
29. Connon, S.A., Lester, E.D., Shafaat, H.S., Obenhuber, D.C., and Ponce, A. Bacterial diversity in hyperarid Atacama Desert soils. Journal of Geophysical Research-Biogeosciences 112 (2007).
30. Yung, P.T., Shafaat, H.S., Connon, S.A., and Ponce, A. Quantification of viable endospores from a Greenland ice core. FEMS Microbiology Ecology 59, 300-306 (2007).
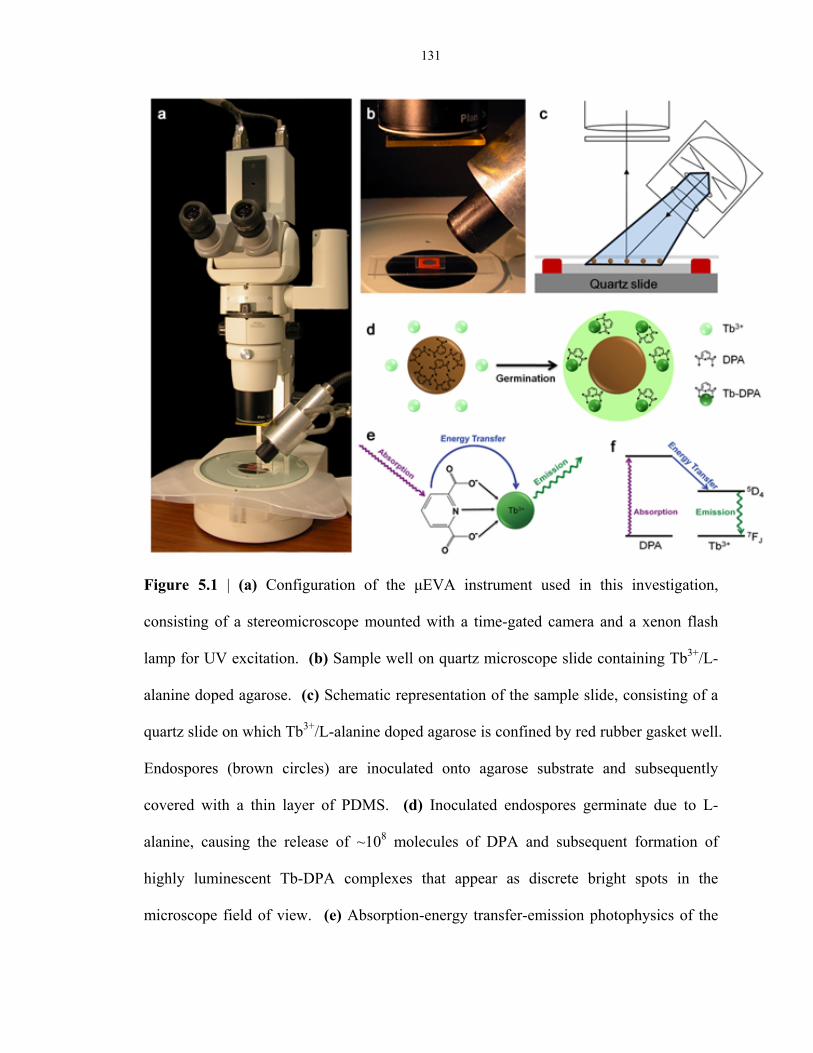
131
Figure 5.1 | (a) Configuration of the μEVA instrument used in this investigation,
consisting of a stereomicroscope mounted with a time-gated camera and a xenon flash
lamp for UV excitation. (b) Sample well on quartz microscope slide containing Tb3+/L-
alanine doped agarose. (c) Schematic representation of the sample slide, consisting of a
quartz slide on which Tb3+/L-alanine doped agarose is confined by red rubber gasket well.
Endospores (brown circles) are inoculated onto agarose substrate and subsequently
covered with a thin layer of PDMS. (d) Inoculated endospores germinate due to L-
alanine, causing the release of ~108 molecules of DPA and subsequent formation of
highly luminescent Tb-DPA complexes that appear as discrete bright spots in the
microscope field of view. (e) Absorption-energy transfer-emission photophysics of the
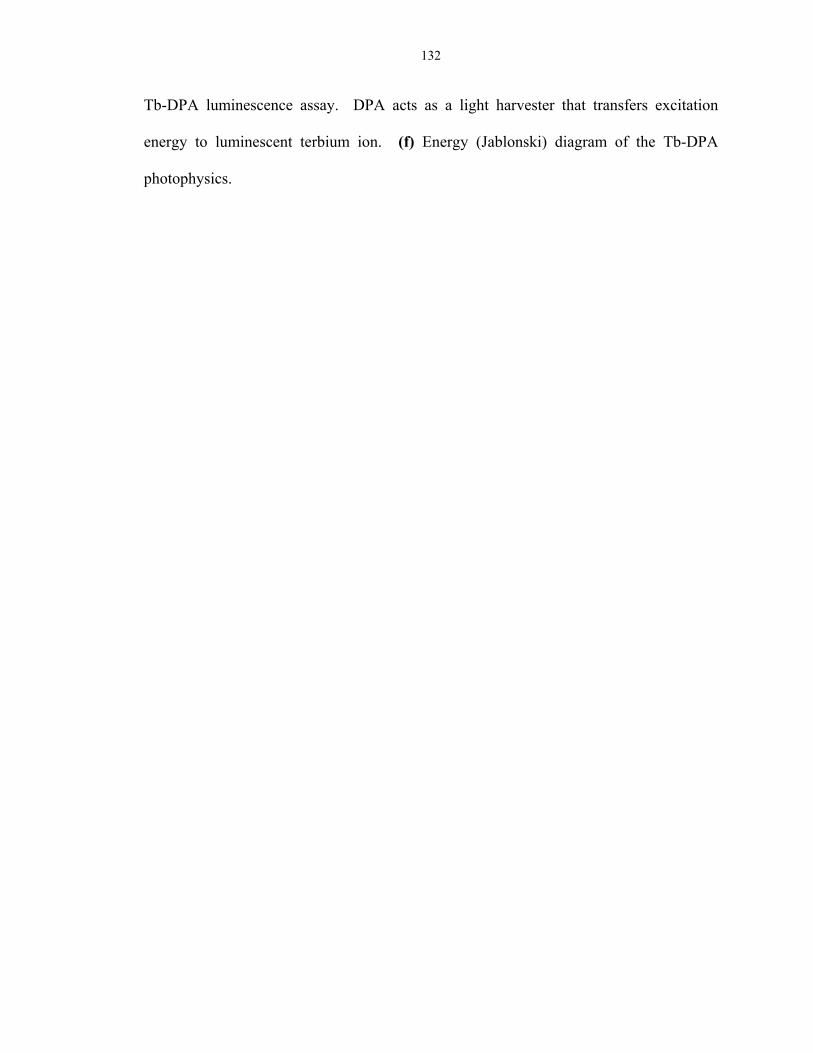
132
Tb-DPA luminescence assay. DPA acts as a light harvester that transfers excitation
energy to luminescent terbium ion. (f) Energy (Jablonski) diagram of the Tb-DPA
photophysics.

133
Figure 5.2 | Germination time courses of single B. atrophaeus spores at 22 °C monitored
by (a) phase transition from bright to dark as observed under phase contrast microscopy,
and (b) Tb-DPA luminescence using µEVA.
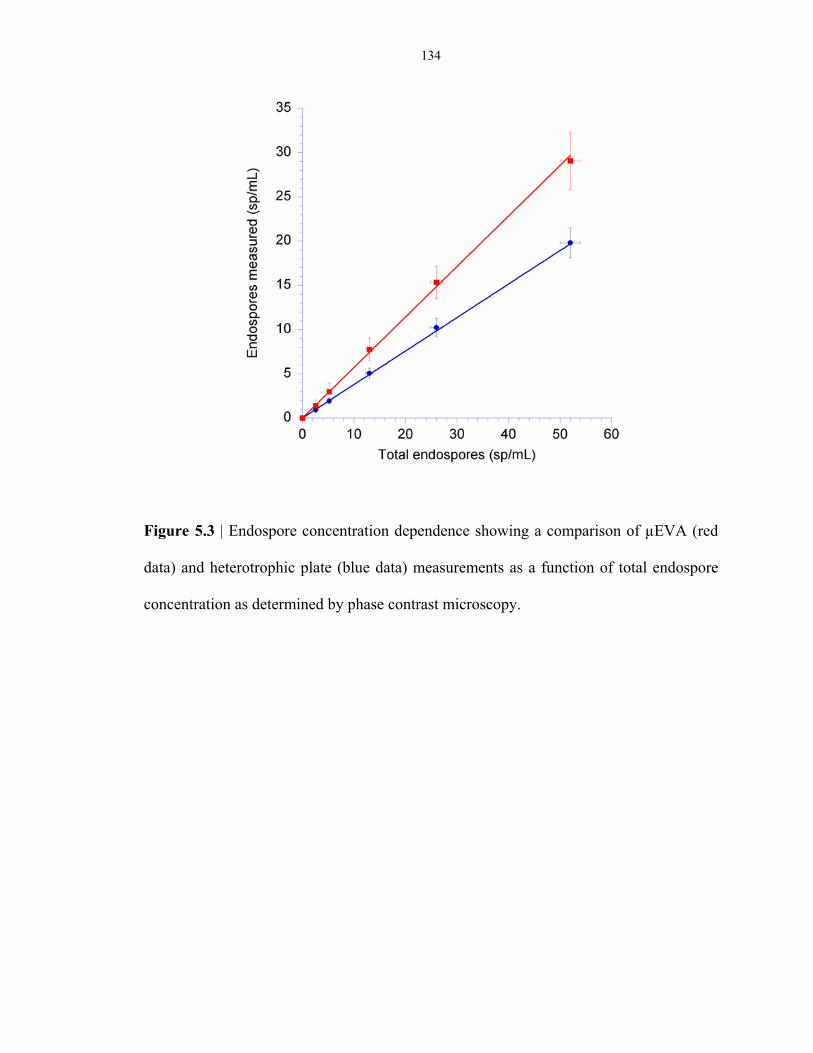
134
Figure 5.3 | Endospore concentration dependence showing a comparison of µEVA (red
data) and heterotrophic plate (blue data) measurements as a function of total endospore
concentration as determined by phase contrast microscopy.
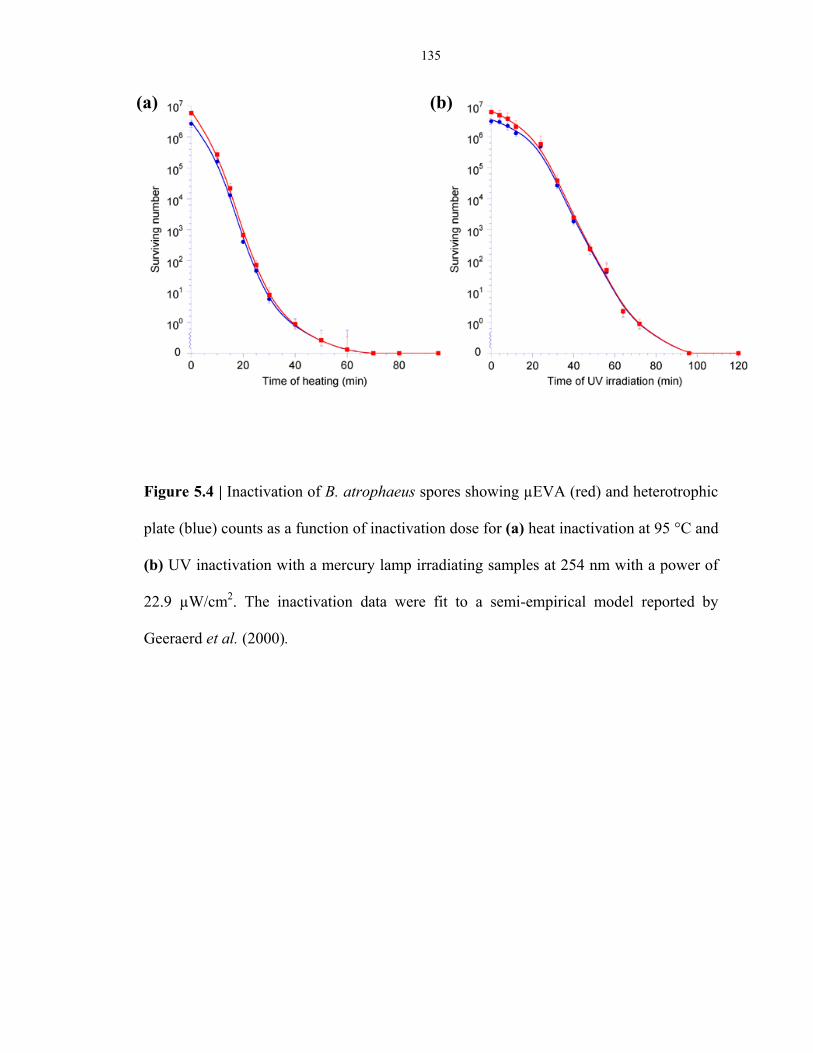
135
Figure 5.4 | Inactivation of B. atrophaeus spores showing µEVA (red) and heterotrophic
plate (blue) counts as a function of inactivation dose for (a) heat inactivation at 95 °C and
(b) UV inactivation with a mercury lamp irradiating samples at 254 nm with a power of
22.9 µW/cm2. The inactivation data were fit to a semi-empirical model reported by
Geeraerd et al. (2000).
(a) (b)
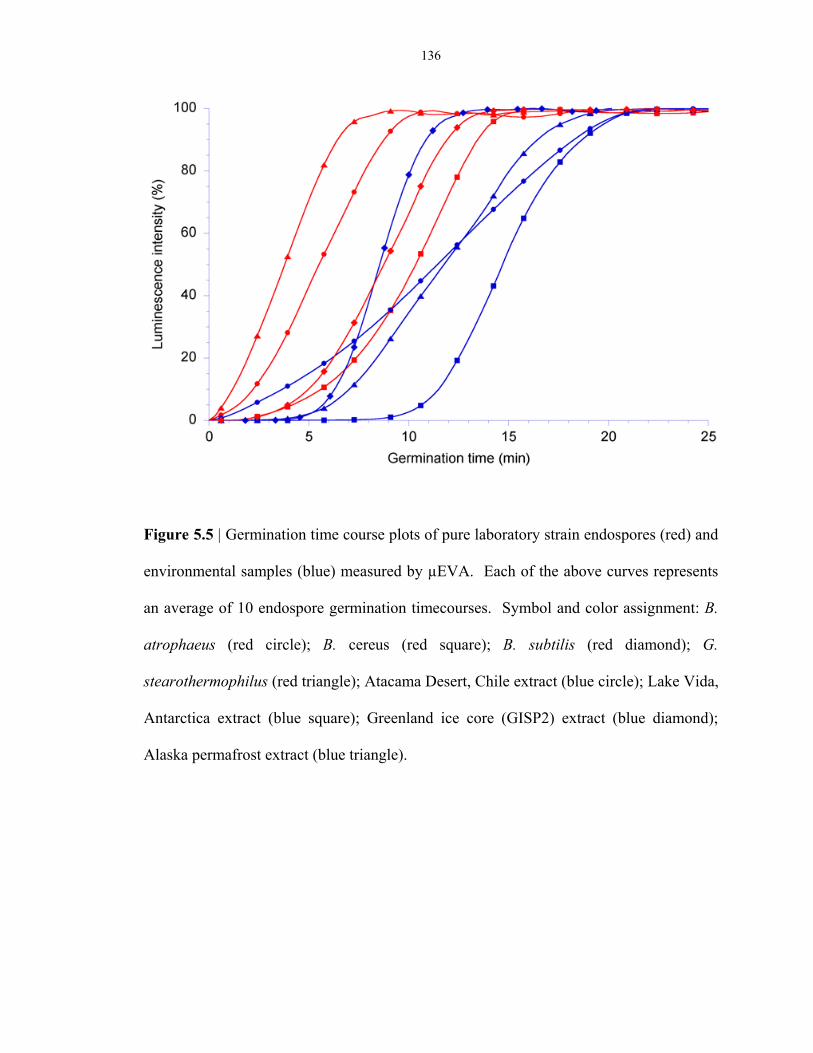
136
Figure 5.5 | Germination time course plots of pure laboratory strain endospores (red) and
environmental samples (blue) measured by µEVA. Each of the above curves represents
an average of 10 endospore germination timecourses. Symbol and color assignment: B.
atrophaeus (red circle); B. cereus (red square); B. subtilis (red diamond); G.
stearothermophilus (red triangle); Atacama Desert, Chile extract (blue circle); Lake Vida,
Antarctica extract (blue square); Greenland ice core (GISP2) extract (blue diamond);
Alaska permafrost extract (blue triangle).

137
Figure 5.6 | Excitation spectrum (λem = 545 nm) of the agarose substrate of µEVA when
108 B. atrophaeus endospores were inoculated, taken with a Fluorolog-3 fluorimeter at a
front-face configuration. The dual excitation peaks (λex = 271, 279 nm) indicated the
presence of Tb-DPA released from germinating spores. Blue plot represents the spectrum
of pure DPA inoculated on agarose; red plot represents germinating endospores on
agarose and the green plot shows the agarose substrate.
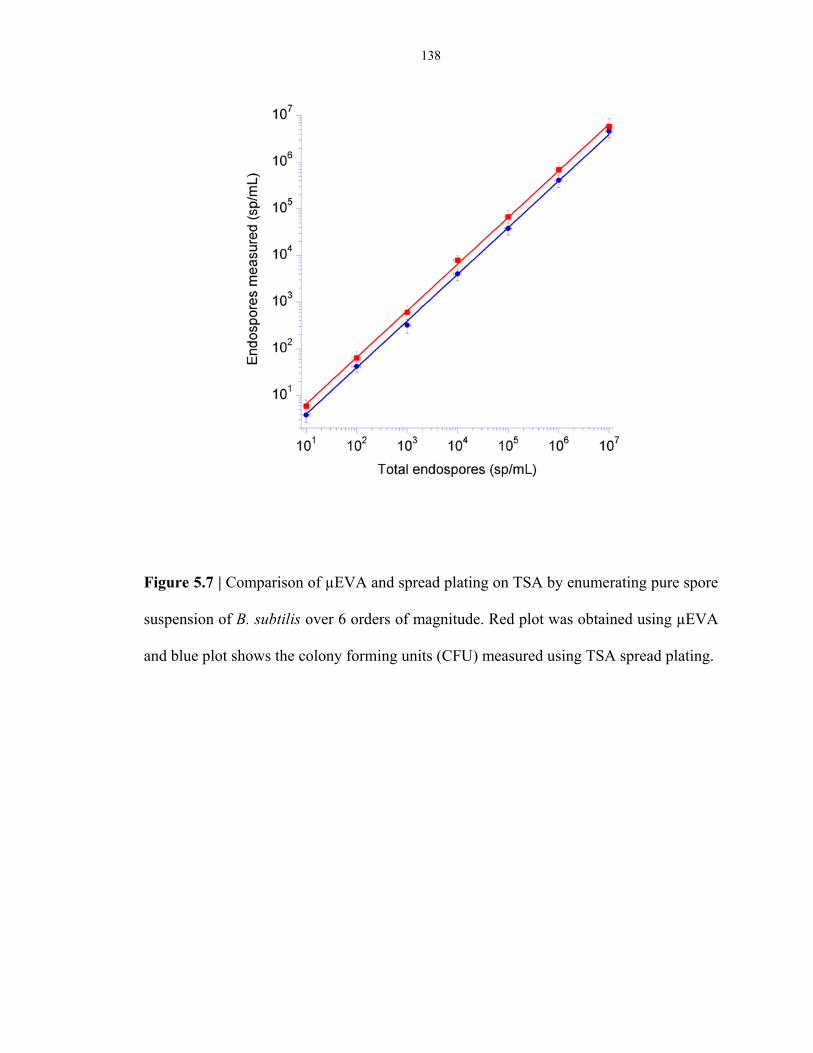
138
Figure 5.7 | Comparison of µEVA and spread plating on TSA by enumerating pure spore
suspension of B. subtilis over 6 orders of magnitude. Red plot was obtained using µEVA
and blue plot shows the colony forming units (CFU) measured using TSA spread plating.
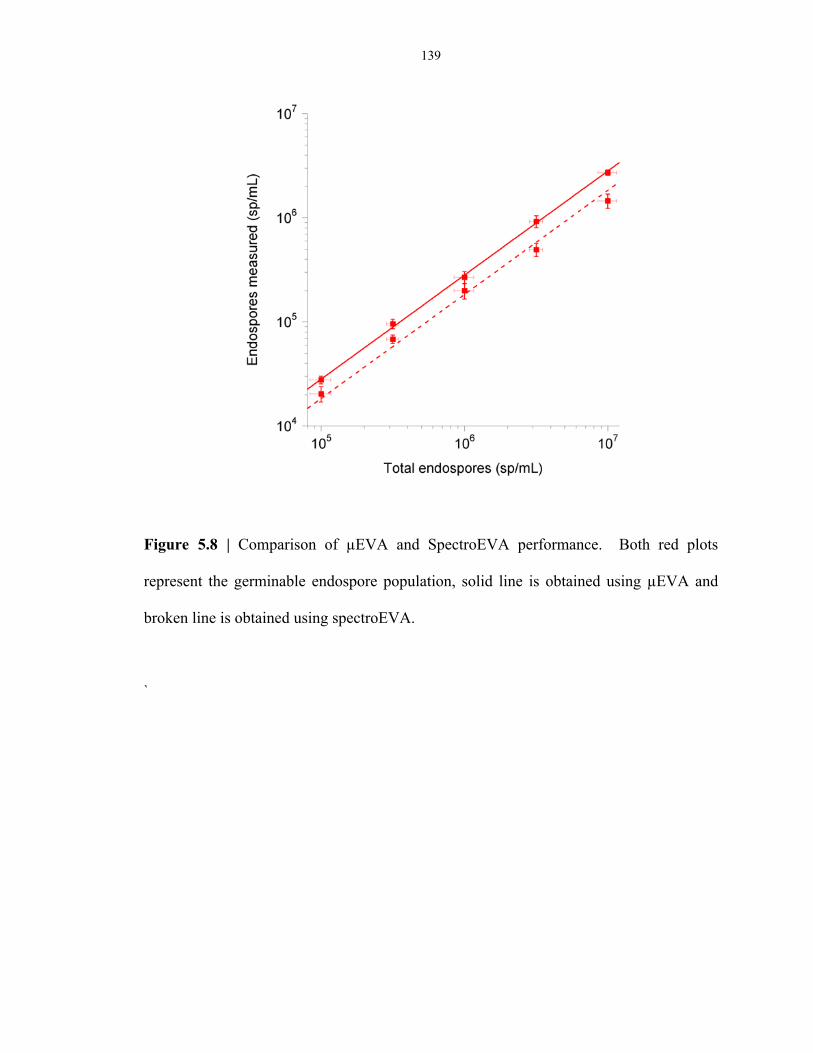
139
Figure 5.8 | Comparison of µEVA and SpectroEVA performance. Both red plots
represent the germinable endospore population, solid line is obtained using µEVA and
broken line is obtained using spectroEVA.
`
140
CHAPTER 6: TIME-GATED LUMINESCENCE MICROSCOPY OF SURFACE
BACTERIAL SPORES AS A RAPID BIOBURDEN ASSESSMENT OF
SPACECRAFT HARDWARE AND ASSEMBLY ENVIRONMENTS
6.1 Abstract
To prevent forward contamination to other celestial bodies, stringent requirements have
to be imposed during the assembly, test, and launch operations (ALTO) processes of
future explorations that involve invasive acquisition techniques and sample return
missions. A luminescence time-gated microscopy technique (known as microscopic
endospore viability assay or µEVA) has been developed to assess bioburden level as a
function of germinable bacterial spore concentration on spacecraft-like surfaces and
spacecraft assembly clean rooms in compliance with planetary protection guidelines. This
method is based on direct counting of individual bacterial spore under a time-gated
microscope, where the contrast is generated by a highly luminescent complex that forms
between dipicolinic acid released from bacterial spores during germination and terbium
ions in the substrate. Terbium dipicolinate acts as intrinsic probe for each germinating
spore due to its high luminescence and long lifetime. In this study, we compared the
surface sampling efficacy between µEVA and a culture-based NASA standard assay on
bacterial spore recovery from surrogate spacecraft surfaces and clean room facilities. On
a stainless steel metal surface, 25%-30% of germinable B. atrophaeus spores were
recovered using µEVA and 10%-15% of cultivable endospores were recovered using
NASA standard assay. The spore counts recovered from spacecraft assembly clean rooms
were highly correlated. μEVA and culturing yielded similar D-values for the inactivation

141
of bacterial spores on metal surfaces; vaporized hydrogen peroxide inactivation D-values
were 12.68 min and 13.39 min, respectively, while oxygen plasma inactivation D-values
were 14.03 min and 16.86 min, respectively.
6.2 Introduction
Bacterial spores are dormant structures formed during the resting stage in the life cycle of
genera such as Bacillus and Clostridium. They are formed within vegetative cells during
sporulation, which is frequently triggered in response to adverse changes in the
environment. The DNA of a spore is protected from the environment by a surrounding
spore coat comprised of calcium ions, DPA and protein layers. With no detectable
metabolism, bacterial spores can persist in environmental extremes, such as freezing1,
boiling2, pressure3,4 and desiccation5. Once favorable conditions return, spores undergo
germination and outgrowth to become vegetative cells that can actively multiply to cause
contaminations, food spoilage, diseases, etc.
Bacillus endospores are of crucial importance in astrobiology. Owing to their high
resilience, endospores are candidates to survive in space and even interplanetary travel6-9,
giving rise to the theory of Panspermia by Arrhenius in 190310,11. It hypothesized that
microscopic forms of life, such as endospores, were dispersed in space by the radiation
pressure from the sun, thereby seeding life from one planet to another. Spore survival in
the space environment has been extensively studied12. The theory of Panspermia was
verified with a modification by the introduction of rock ejecta that serves as vehicles for
spore space travel13. Therefore, presence of endospores on spacecrafts can potentially
142
cause false positives during exobiological life detection missions and both forward and
backward contaminations.
Planetary protection is the regulations imposed on robotic space missions to
prevent biological contamination of future exploration sites and, in sample return
missions, to protect the Earth from extraterrestrial contaminants. Viable microbes are of
prime concern for spacecraft cleanliness. Currently, bioburden level on spacecrafts during
ALDO processes is represented by the concentration of surface bacterial spores present
and is routinely assessed by a culture-based NASA standard assay, ensuring that the
bioload of spacecrafts are below a threshold level prior to launch. The NASA Procedures
and Guidelines document NPG 8020.12b14 describes planetary protection provisions for
robotic extraterrestrial missions. Among the required provisions for category III-V
missions is a terminal microbiological assay that determines spacecraft bioburden levels
prior to launch. For example, Class IVa planetary missions, comprising landers and
probes without life-detection experiments, must meet a bioburden limit of 3 × 10⁵
spores/vehicle (and less than 300 spores m-2). Missions with life-detection experiments
must undergo additional procedures to ensure that the total bioload does not exceed 30
spores15.
However, the NASA standard assay (NHB 5340.1B) method takes over three
days, a time frame that is not always in concert with the rigid schedule of spacecraft
assembly. µEVA can be used to expedite the detection and enumeration procedure.
µEVA is a lifetime-gated microscopy technique to count individual spores in a
microscope field of view, where the contrast is generated by the formation of long-lived
and brightly luminescent terbium dipicolinate complex. DPA (dipicolinic acid, 2,6-
143
pyridinedicarboxylic acid) was uniquely found in large quantities in bacterial spores16
and can serve as a signature proxy for spore presence17. DPA release is visualized as a
spreading halo originated from each spore during germination, where which
approximately 100 million molecules of DPA bind with Tb3+ ions doped in the
surrounding matrix, manifesting itself as a bright spot in the field of view that grow in
intensity over a timescale of minutes. Time-lapse pictures elicit focal points of
concentrated DPA with characteristic temporal luminescence increase, where which each
is scored an endospore count. µEVA can be coupled to a swab-rinse or wipe-rinse
technique to sample endospores on a surface.
In this study, we describe validation tests between the µEVA and the NASA
standard assay in enumerating bacterial spores in from metal coupon surfaces, clean room
environments, and during vaporized hydrogen peroxide and oxygen plasma inactivations
in terms of accuracy, precision, limit of detection, linearity and robustness.
6.3 Methods
6.3.1 Chemicals
Terbium (III) chloride hexahydrate, 99.999%, L-alanine and other salts were purchased
from Sigma (St. Louis, MO) and were used as received. Ultrapure agarose (>90%) was
purchased from Invitrogen (Carlbad, CA). Tryptic soy agar (TSA), nutrient broth and
agar were obtained from Becton, Dicksinon and Company, (Sparks, MD).
144
6.3.2 Preparation of endospore stock suspension
B. atrophaeus ATCC 9372 endospores were purchased from Raven Biological
Laboratories. B. subtilis ATCC 27370 vegetative cells were grown on TSA and
inoculated onto a sporulation medium after reaching exponential growth phase. The
medium contained 1.6% nutrient broth, 1.6% agar, 0.2% KCl, 0.05% MgSO4, 1 mM
Ca(NO3)2, 100 µM MnCl2·4H2O, 1 µM FeSO4 and 0.1% glucose (pH 7.0). After
incubation at 37°C for 1 week, cells were scraped and suspended into sterile deionized
water. 95% of the cells have formed spores free of sporangia. Spores were harvested and
separated from vegetative cells and debris by centrifugation at 6,300 g, washing 10 times
and sonication (25 kHz) for 5 minutes. The spore suspension was incubated in lysozyme
(0.2 mg/mL) and trypsin (0.1 mg/mL) at 30°C with constant stirring overnight to lyze and
degrade vegetative cells. Spores were finally purified by 8 cycles of centrifugation (6,300
g) and washed with sterile deionized water until > 99.9% of the cells were fully refractile
with no noticeable cellular debris. Spore suspensions were stored at 4°C in the dark
before use. Total spore concentrations were determined using a Petroff Hausser
hemocytometer and CFU concentrations were determined using TSA spread plating in
triplicate measurements.
6.3.3 Coupon cleaning and inoculation
Stainless steel sheets (40” × 80” or 100 cm × 200 cm) were procured and cut into 2” × 2”
coupons in the machine shop at California Institute of Technology (Caltech). Coupons
145
were cleaned and inoculated as described in the methods section. Cotton applicators
(Puritan, Guilford, ME) of length 15 cm were used to swab the coupon surfaces.
Coupons were rinsed with both 18.2 MΩ-cm deionized water and acetone to
remove surface impurities and stains. They were then cleaned with clean room grade
polyester wipes (BD Consumer Healthcare, Franklin Lakes, NY) saturated with 70%
isopropyl alcohol. Each coupon was autoclaved at 121°C for 15 minutes inside a glass
Petri dish. The sterile coupons were inoculated with endospores of B. atrophaeus and B.
subtilis. 500 µL of spore suspension was added aseptically evenly onto the coupons using
a multichannel pipettor, with final inoculum sizes of 0, 0.4, 1, 4, 12, 38, 119 and 376
CFU/coupon, respectively. Care was taken to spread the suspension evenly over the
surface but not to drip over the edge. Coupons were air dried at room temperature inside
a biohazard cabinet inside Petri dishes without controlling the humidity overnight.
6.3.4 Swab-rinse method
The procedures for sampling the coupons and processing the spores were similar to those
described in NASA handbook 5340.1D (NHB 5340.1D)18. Sterile cotton applicators were
used to sample the coupons (1 applicator per coupon). A single applicator was moistened
in sterile water (Nanopure, 18 MΩ-cm) and the coupon was swabbed 3 times with the
same cotton applicator. The coupon was rotated 90° after the first swab sampling, and
45° after the second swab sampling. The swab head was placed into 20 ml of sterile water
and mixed by vortexing for 5 to 10 seconds. A total of 5 coupons were swabbed for each
inoculum size. The applicator head in water was sonicated for 2 min at 25 kHz to recover
spores.
146
A 10 ml aliquot was removed and subjected to a heat shock (15 min at 80 ± 2°C). The
remaining 10 ml was not subjected to the heat shock. A 5 ml aliquot of the heat-shock
sample and a 5 ml aliquot of the non-heat shock sample were removed for use in µEVA.
The remaining 5 ml of the heat shock sample and the remaining 5 ml of the non heat
shock sample were used in the pour plate method of the NASA standard assay. Positive
and negative controls were run for each set of coupons as necessary.
After the coupons were swabbed (or not swabbed as in the positive control), they were
aseptically transferred to sterile 600 ml beakers. 40 ml of sterile water was added to the
coupons. The coupons were sonicated for 2 min at 25 kHz to recover any spores that
were remaining on the surface. A 10 ml aliquot was removed and subjected to a heat
shock (15 min at 80 ± 2°C). A separate 10 ml aliquot was not subjected to the heat shock.
A 5 ml aliquot of the heat shock sample and a 5 ml aliquot of the non heat shock sample
were removed for use in the lifetime gated imaging assay. The remaining 5 ml of the heat
shock sample and the remaining 5 ml of the non heat shock sample were used in the pour
plate method of the NASA standard assay.
The samples were: (1) heat shock swab; (2) no heat shock swab; (3) heat shock
coupon; (4) no heat shock coupon. The positive control consisted of: (1) heat shock
coupon; (2) no heat shock coupon. Negative controls included: (1) TSA media controls
(media only in the Petri dish); (2) swab water control (water that the swab was dipped
into before it was used to swab the coupon); (3) dilution water control (water that was
used to make the dilutions before the recovered spores were diluted and plated). Figure
6.2 outlines the experimental procedure in a flowchart.
147
6.3.5 NASA Standard Assay
The following procedure was used to perform the pour plate method of the NASA
standard assay (NHB 5340.1D)18. In the NASA standard assay of flight hardware for
Planetary Protection implementation, it is usually not necessary to make dilutions of the
samples before plating. However, some inoculum sizes in this experiment required that
serial dilutions be made so that the number of colonies in a Petri dish was countable.
The samples were stored at 4°C for about an hour after heat shock and before
dilutions were made. Serial 10-fold dilutions were made for each sample. For the
dilutions, 4.5 ml of water was used as the diluent. A 0.5 mL sample was removed and
added to the diluent to produce a 10-fold serial dilution. The dilution range was 100
(undiluted) to a 10-5 dilution. The pour plate method was used. 2 mL aliquots of the
diluted samples were placed into 2 Petri dishes (4 ml total). Approximately 25 mL of
sterile, molten TSA was added to each plate and gently swirled. A mediaclave (Integra
Biosciences, Chur, Switzerland) was used to dispense the sterile media. The plates were
allowed to harden and were incubated at 32°C for 3 days. The colonies on the plates were
counted after incubation
6.3.6 Sample preparation for µEVA experiments
Spore suspensions were filtered onto 0.2 µm polycarbonate membrane filters (Whatman,
Florham Park, NJ) using filtration manifolds of different diameters depending on the
desired concentration factor such that there were less than 300 spores per microscopic
148
field of view. To ensure that the spore surface density was optimal for a given initial
spore suspension concentration, suspensions of >106 sp mL-1 were filtered onto 25-mm-
diameter spots using glass filtration funnels, and suspensions of <106 sp mL-1 were
filtered onto 1.5-mm2 spots using a 96-well micro-sample filtration manifold (Schleicher
& Schuell, Keene, NH). Spores concentrated on the filter were rubbed and transferred to
a ~0.5 mm thick, 9 mm diameter slab of 1.5% agarose substrate containing 100 µM
TbCl3 and 20 mM L-alanine mounted in a silicone isolator (Molecular Probes, Eugene,
OR) on a quartz microscope slide. After spore transfer, the agarose surface was covered
with a piece of 0.2-mm-thick polydimethylsiloxane (PDMS). Figure 6.2 illustrates the
final sample configuration.
Polydimethylsiloxane (PDMS) was prepared by mixing the polymer base and
curing agent (Sylgard, Dow Corning) in 10 to 1 ratio. After degassing, the mixture was
casted over a 0.2-mm thick stainless steel mold and cured in an oven for 2 hours at 65°C.
Agarose, silicone isolator and PDMS were autoclaved at 121°C for 15 min before use. A
piece of PDMS was peeled off and attached on top of a spore-laden agarose surface
aseptically for sealing.
6.3.7 The µEVA instrument
The instrument consists of a time-gated camera (Photonics Research Systems, Salford,
UK) mounted on a Nikon SMZ800 stereoscopic microscope (large working distance for
xenon lamp), a xenon flashlamp (Perkin-Elmer, Waltham, MA) mounted at 45 degrees
with respect to the sample, and a temperature controlled microscope slide holder
(Thermal). The slide holder enabled spores to germinate at 37°C. The CCD camera has a

149
resolution of 752 x 582 pixels at 14 bits with a chip size of 2/3 inch. The camera has 50%
sensitivity between 430-730 nm, with peak sensitivity at 550 nm. It was cooled to 40°C
below ambient temperature and was synchronized to the xenon lamp via TTL pulses (300
Hz with tail time up to 50 µs). A highpass filter (03FCG067, Melles Griot) centered at
500 nm was placed along the light path on the emission side before reaching the
microscope objective. We collected time stacks of time-gated images by real-time
streaming with a delay of 100 µs and exposure time of 5 s in each frame (see Chapter 3).
6.3.8 Endospore germination and assignment
Spore germination on agarose surface followed the reported micro-germination kinetics19-
21. DPA released from single B. atrophaeus and B. subtilis spores manifested as
individual bright spots in 15 minutes under time-gated microscopy due to local formation
of Tb-DPA on the L-alanine doped agarose germination substrate. We performed image
analysis in Matlab to obtain background-subtracted stack of time-gated images.
Assignment of endospores was made based on intensity and size. Adaptive thresholding
was applied to segment pixels that were 3 times brighter than the background with a
characteristic rising intensity. Each bright spot must exhibit a continuous rising intensity
over the course of germination in order to register a spore count. This criterion minimized
false positives by eliminating sporadic bright spots and long-lived luminescent
interference. The 8-connected adjacent pixels were analyzed to screen for spore clumps.
The number of spores present was calculated by dividing the squared sum of neighboring
pixel brightness by the mean brightness of an individual spore determined empirically.
This was done in a recursive way until all of the pixels were counted and marked.
150
Germinable spore units would be reported as too numerous to count if they exceeded 300
in a field of view. Further dilution would be carried out in this case.
6.3.9 Viability ratio
Viability ratio of spores was determined by dividing the population of germinable spores
by total spores. Spores capable of releasing DPA during germination were considered
viable. Total spore counts were either performed using a hemocytometer if the initial
spore concentration was above 106 spores mL-1. Low spore concentrations were counted
using a phase contrast microscope. A smear of 10 µL or more of spores was prepared on
a cover slip. After mounted on a microscope slide, the area of smear would be calculated
under low magnification. About 100 images would be taken using a motorized
microscope stage and automatic counting algorithm under a 60x phase contrast objective
due to uneven spatial distribution. The number of total spores present in low
concentration samples would be determined by calculating the area conversion factor.
Viability ratio of spores was determined by dividing the number of germinable spore
counts by the total number of spore counts.
6.3.10 Surface sampling and NASA standard assay
To validate this novel Bacillus endospore viability assay, side-by-side comparison
experiments were performed on recovering B. subtilis pure endospores laden on metal
coupons using µEVA and the NASA standard assay. The procedures for sampling the
coupons and processing the spores were similar to those described in NASA handbook

151
5340.1D (NHB 5340.1D). A cotton applicator was moistened and the coupon was
swabbed 3 times with the same cotton applicator. We rotated the coupon 90° after the
first swab sampling, and 45° after the second swab sampling. The swab head was placed
into 10 ml of sterile water and mixed by vortexing for 5 seconds. We sonicated the
applicator head in water for 2 min at 25 kHz to enhance spore recovery. The aliquot was
subjected to a heat shock for 15 min at 80 ± 2°C. 5 ml aliquot was cultivated in TSA
using pour plating and colonies were counted after 72 hours of incubation at 37°C (n =
60). The remaining 5 ml was analyzed using our microscopy approach (n = 56).
6.3.11 Vaporized hydrogen peroxide inactivation
Vaporized hydrogen peroxide resistance was measured by germinability (DPA release)
and culturability (colony formation on TSA) of spores laden on metal coupons. G.
stearothermophilus ATCC 7953 endospores (Log 2967, mean population = 1.8 × 10⁶ cfu
coupon-1) were used. In a preliminary test, 0.5 mL of hydrogen peroxide was vaporized at
45°C for 3 minutes in a chamber at Jet Propulsion Laboratory. 107 B. atrophaeus spores
coupon-1 and 1.8 × 10⁶ G. stearothermophilus TCC 7953 spores coupon-1 were placed
inside sterilization pouches and subjected to vaporized H2O2 inactivation. B. atrophaeus
and G. stearothermophilus endospores were incubated and germinated at 37°C and 55°C,
respectively. In the concentration dependence experiment, G. stearothermophilus
endospores strips with different durations of vaporized H2O2 inactivation treatment (0, 15,
30, 45, 60 min) were obtained from Steris Corporation using a LaCalhene two-glove
isolator connected to a VHP1000ED system.
152
6.3.12 Oxygen plasma inactivation study
B. atrophaeus and B. subtilis endospores were inoculated onto a 2 mm × 2 mm piece of
PDMS placed on a glass microscope slide. During plasma inactivation, the sample slide
was placed within a glass vacuum chamber with oxygen and the plasma gas along with
various inert buffer gases in the air. Once evacuated, process gases were slowly returned
to the chamber in small quantities at approximately 200-600 millitorr. During this time, a
current was charged for approximately one minute and discharged into a copper solenoid
encircling the chamber. RF and electric fields generated at the center of the solenoid by
the current running through the coil excited oxygen electrons at low pressures within the
chamber therefore heating the gas into plasma which radiated visibly in violet. The
degree of inactivation was measured by µEVA and direct plating on TSA.
6.3.13 Clean room sampling
Surface samples were collected in the Spacecraft Assembly Facility building at Jet
Propulsion Laboratory, Pasadena. Proper gowns, gloves and protective gear were worn
while sampling in the clean and. Samples were collected using the swab-rinse technique
on the floor, metal plates, grooves on the ground as well as the Mars Science Laboratory
hardware surface.
6.3.14 Statistical analysis
In this study, bacterial counts could be categorized into 2 regimes of distribution. High
concentrations (>10 counts) followed Gaussian distribution. A square-root transformation
153
was performed on some of the dataset to homogenize the variance and normalize the
negative skewness. Normality was tested using the Shapiro-Wilk test by looking at
skewness and kurtosis of the distribution. Parametric analyses such as Student t-test was
used to determine the confidence interval and F-test was used to examine differences
between the sample variances. Low concentrations (<10 counts) followed Poisson
distribution. Non-parametric analyses such as Wilcoxon test was used to determine the
confidence interval, and Kruskal-Wallis test was used for variance analysis. We reported
the 95% confidence interval based on 1.96 SD on the normally distributed datasets. Data
fallen within 5% and 95% percentile ranking constituted the reported 95% confidence
interval for the Poisson distributed datasets.
6.4 Results
The fundamental objective of this investigation was to compare the surface sampling
efficacy between µEVA and the NASA standard assay in an effort to evaluate bioburden
reduction on spacecraft surfaces. A side-by-side comparison of the two methods was
carried out on determining the number of endospores inoculated on stainless steel
coupons, on a concentration of 1000 spores/coupon down to sterility. Once a correlation
had been established, the two assays were applied to evaluate the background endospore
level in a spacecraft assembly clean room. Finally, the two methods were employed to
assess the bioburden reduction effect by vaporized hydrogen peroxide and oxygen plasma,
two new low-temperature techniques that might potentially be adopted by NASA for
future sterilization endeavor on heat-liable spacecraft hardware.
154
6.4.1 Surface sampling of pure spore suspension on metal coupons
When sampling stainless steel coupons inoculated with B. subtilis 168 endospores
ranging from 1 to 1000, µEVA recovered 21.2% ± 3.7% (n = 56) and the NASA standard
assay recovered 6.8% ± 0.6% (n = 60) of the total population. Coefficients of
determination of the linear plots are 0.9919 for µEVA and 0.9906 for NASA standard
assay. False positive were not observed using sterile coupons. It has to be taken into
consideration that the germinable population was found to be higher than the culturable
population in the bacterial spore batch in this experiment. Of this population, 55.6% of
the endospores were germinable and only 37.4% were culturable. So, if the recovery rate
was calculated to be the number of measured endospores capable of germination divided
by the total number of germinable endospores and measured cfu normalized by the total
cfu. Then the adjusted recovery rate would be 38.1% ± 2.6% (n=56) for µEVA and the
18.2% ± 0.4% for NASA standard assay. The difference between the mean of the two
assays were statistically significant in both cases. There was no difference between
repeatability of the two assays at 90% confidence interval using the F-test.
The distribution of the number of recovered units was expressed in the form of a
histogram in Figure 6.3. At low inoculum, the distribution of recovered units is Poisson
distributed. The Poisson distribution approximated closely to a normal distribution when
the inoculum size reached 100 spores coupon-1. From 1 spore/coupon to 31.6
spores/coupon, the number of germinable units vs. culturable units showed correlation of
2.07 ± 0.20. At higher inoculum from 100 to 1000 spores/coupon, germinable to
culturable counts elicited a 1:1 ratio at 1.04 ± 0.15.
155
6.4.2 Surface sampling of endospores in a spacecraft assembly clean room
Results of the 4 different sampling places were tabulated in Table 6.1. The distributions
showed a general departure from Poisson distribution. The microbial population tended to
have an aggregated or clustered type of distribution, rather than being spread around at
random, leading to large proportion of empty samples but accompanied by a peak of
clumping. Relatively large standard deviations were therefore observed. Most of the
recovered microbes were heat-shock survivors as revealed by the insignificant differences
between the heat shock and non-heat shock results in NASA standard assays (p = 0.4060).
The difference between the results reported by both methods was not statistically
significant (p = 0.1532). Associated with dust and lint, the visibly turbid groove sample
extracts were found to contain more bacteria.
6.4.3 Monitoring of endospore inactivation to vaporized hydrogen peroxide
In the preliminary test carried out at the vaporized hydrogen peroxide facility at JPL.
Under the specified condition, B. atrophaeus spores were all rendered dead less than 3
minutes of exposure. No germinable or culturable counts were obtained. In the case of G.
stearothermophilus, µEVA recovered 1.71% ± 0.89% of the total germinable endospores
and the NASA standard assay recovered 0.69% ± 0.41% of the total cfu after vaporized
H2O2 inactivation. A systematic inactivation study of G. stearothermophilus as a function
of vaporized hydrogen peroxide treatment time was conducted with courtesy from Steris
Corporation. Figure 6.5a illustrates the inactivation data fitted to a log-linear plot. The
coefficients of determination values were 0.9918 and 0.9901 for µEVA and NASA
standard assay, respectively. The results obtained by both methods were highly correlated
156
(r = 0.9998). D-values were calculated as 12.68 ± 0.67 min and 13.39 ± 0.77 min using
µEVA and NASA standard assay, respectively.
6.4.4 Monitoring of endospore inactivation to oxygen plasma
Figure 6.5b shows the microbial survivor curve followed first-order exponential
inactivation kinetics from 0 to 30 min with good fitting to linear plots (R2 = 0.9852 for
µEVA and R2 = 0.9884 for NASA standard assay). A sudden drop in germinability and
culturability took place after 30 min. The two methods were highly correlated (r =
0.9997). The log-linear regime yielded D-values of 14.03 ± 1.56 min and 16.86 ± 3.96
min using µEVA and NASA standard assay, respectively.
6.5 Discussion and Conclusion
One of the fundamental tenets of microbiology is the use of cultivation in the
enumeration of bacteria. The cultivation-based NASA standard assay has been the only
method in validating the compliance of spacecraft bioburden reduction to planetary
protection requirements at NASA. There are several limitations for the NASA standard
assay. First, this process requires 3 days to complete. Thus, when plate counting is
employed as the terminal microbiological assay, the spacecraft must be protected from
recontamination. Second, a large number of bacterial spores can aggregate on individual
particulates giving rise to a single CFU, and is thus a large underestimation of the
bioburden. Third, colony-counting methods only account for cultivable spore-forming
species, which constitute less than 1% in soil samples; a significant component of
157
spacecraft contamination is known to come from soil. Bypassing the lengthy outgrowth
and colony-forming phases, µEVA proves to be a rapid and efficient assay combines
time-gating and lanthanide luminescence photochemistry to detect germinable Bacillus
endospores on surfaces. The unique photophysical and chemical characteristics of Tb-
DPA make µEVA a powerful analytical tool for bioburden assessment in exobiological
explorations.
Dry heat is currently used for the terminal decontamination process for
spacecrafts. We have compared the inactivation kinetics of Bacillus endospores using
µEVA and heterotrophic plate counts. In view of the increasing number of heat-liable
electronics, there is an urging need to develop low-temperature sterilization regimen for
spacecraft decontamination. Vaporized hydrogen peroxide and oxygen plasma are two
potential candidates as both methods operate at relatively low temperature, around 45°C,
and produce non toxic by-products towards the end of the sterilization process. We have
compared the inactivation profile using µEVA and NASA standard assay on Bacillus
endospores impregnated on metal strips. A high degree of correlation exists between the
loss of germinability and culturability with respect to these two inactivation regimens.
The probability of obtaining a sterile spacecraft is enhanced significantly if the
level of microbial contamination is relatively low prior to the terminal heat treatment.
Therefore, spacecraft hardware is assembled inside class 100 clean rooms where
microbial contamination can be minimized. Poisson and Gaussian distributions are
observed in the pure endospore suspension recovery from coupon experiment, but not
from the class 100 clean room sampling. A much greater degree of heterogeneity has
been observed in the latter case, characterized by aggregation and patchiness. Some kind
158
of territorialism may favor the presence of microbial hot spots in the clean room.
Variation may also be attributed by the larger variety of heat-shock survivors as revealed
by the plate count results. At least 3 distinct colony morphologies and different
germination kinetics have been observed in the clean room samples.
A quantitative relationship has been established between the two assays. µEVA
and NASA standard assay are found to correlate in a 2:1 ratio at low inoculum regime
and 1:1 at high inoculum regime. One plausible reason is that one of the intermediate
extraction processes selects preferentially for germinable-but-not culturable endospore. It
may give rise to the observed discrepancy, which becomes proportionately apparent at
low concentrations. In general, more germinable endospores are recovered than
culturable ones which may suggest that (1) germinable endospores endure heat shock,
swabbing, sonication and vortexing processes better; (2) endospores lose their ability to
form colonies during the sampling and extraction procedures. Endospores residing in a
clean room environment are reported to be more resistant22,23. The first point is further
substantiated by our clean room sampling results in which most of the germinable heat-
shock survivors can form colonies.
The culturable endospore recovery rate, albeit low, is consistent with similar
studies reported in the literature24-26. While the swab-rinse technique is not the most
effective way to collect and extract microbes in suspension, it is adopted by the NASA
standard assay and is thus used throughout this study. Both methods report a relatively
high standard deviation. Angelotti et al. proposed that high variance in recovery was not
inherent in the sampling, but was attributed by the intermediate extraction process27. So,
we have proposed the use of PDMS roller in the collection and analysis of surface
159
endospores in future studies. The adhesive PDMS can readily collect endospores on a
surface and can subsequently be pressed against a germination substrate for direct time-
gated imaging, obviating steps such as resuspension, vortexing and sonication. Since
µEVA is an endospore-specific method, there is no need to carry out an additional heat
shock process to remove vegetative bacteria. As indicated in our data, the difference
between heat shock and non heat shock µEVA data is statistically insignificant (p =
0.8064). This newly proposed PDMS sampling methodology is expected to facilitate the
efficiency, precision and speed in the enumeration of surface endospores.
For a given population of endospores, a subset will germinate, and a subset of that
population capable of germination will form colonies. The actual viable endospore
population will fall between the populations capable of outgrowth and germination. The
culture-based NASA standard assay will underestimate the viable endospore bioburden,
due to viable-but-non-culturable (VBNC) populations; on the other hand, µEVA will
overestimate the viable endospore bioburden since not every germinable endospore
eventually develops into a visible colony. Therefore, µEVA and NASA standard assay
are complementary methods in evaluating the upper and lower limits of bioburden level
in planetary protection endeavors. In conclusion, we demonstrated that a basic
microscope setup with time-gating image system is an effective tool for endospore
detection, and the use of a solid substrate to induce Bacillus endospore germination and
detect subsequent release of DPA, thus opening up new avenues for exploring the rich
biology of endospores. We envision the µEVA as a general fluorescence lifetime imaging
technique will contribute to the construction of a complete and high-throughput detection
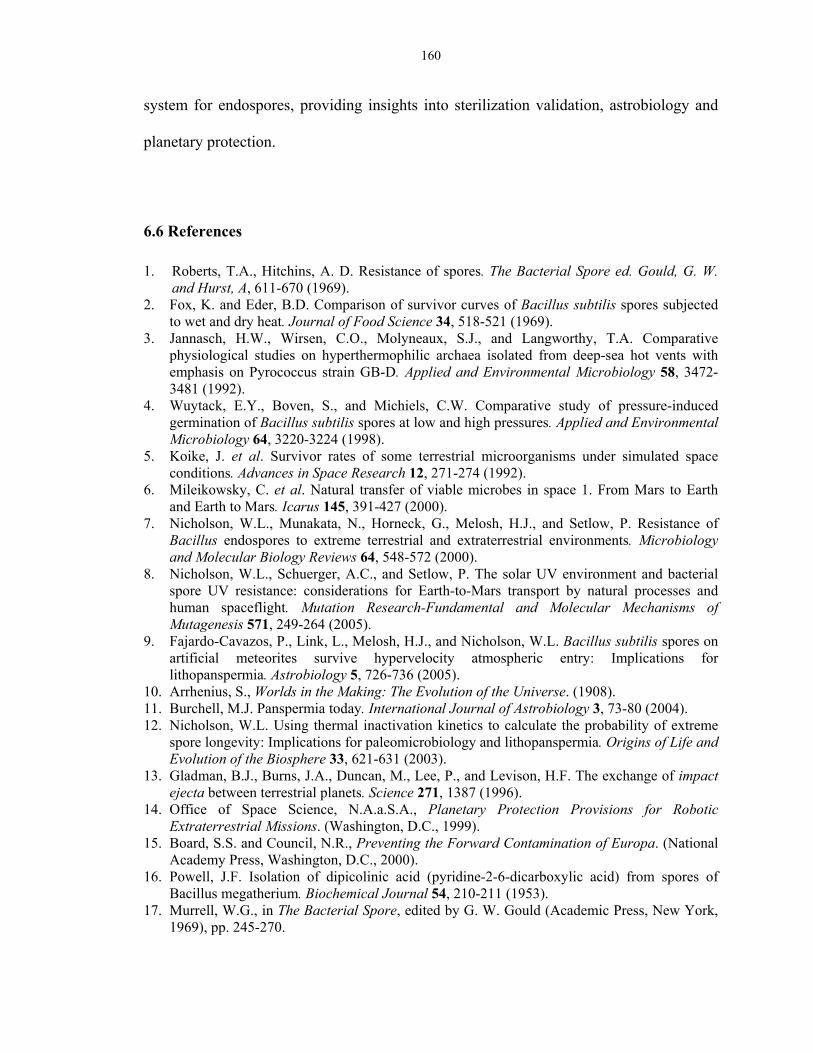
160
system for endospores, providing insights into sterilization validation, astrobiology and
planetary protection.
6.6 References
1. Roberts, T.A., Hitchins, A. D. Resistance of spores. The Bacterial Spore ed. Gould, G. W. and Hurst, A, 611-670 (1969).
2. Fox, K. and Eder, B.D. Comparison of survivor curves of Bacillus subtilis spores subjected to wet and dry heat. Journal of Food Science 34, 518-521 (1969).
3. Jannasch, H.W., Wirsen, C.O., Molyneaux, S.J., and Langworthy, T.A. Comparative physiological studies on hyperthermophilic archaea isolated from deep-sea hot vents with emphasis on Pyrococcus strain GB-D. Applied and Environmental Microbiology 58, 3472-3481 (1992).
4. Wuytack, E.Y., Boven, S., and Michiels, C.W. Comparative study of pressure-induced germination of Bacillus subtilis spores at low and high pressures. Applied and Environmental Microbiology 64, 3220-3224 (1998).
5. Koike, J. et al. Survivor rates of some terrestrial microorganisms under simulated space conditions. Advances in Space Research 12, 271-274 (1992).
6. Mileikowsky, C. et al. Natural transfer of viable microbes in space 1. From Mars to Earth and Earth to Mars. Icarus 145, 391-427 (2000).
7. Nicholson, W.L., Munakata, N., Horneck, G., Melosh, H.J., and Setlow, P. Resistance of Bacillus endospores to extreme terrestrial and extraterrestrial environments. Microbiology and Molecular Biology Reviews 64, 548-572 (2000).
8. Nicholson, W.L., Schuerger, A.C., and Setlow, P. The solar UV environment and bacterial spore UV resistance: considerations for Earth-to-Mars transport by natural processes and human spaceflight. Mutation Research-Fundamental and Molecular Mechanisms of Mutagenesis 571, 249-264 (2005).
9. Fajardo-Cavazos, P., Link, L., Melosh, H.J., and Nicholson, W.L. Bacillus subtilis spores on artificial meteorites survive hypervelocity atmospheric entry: Implications for lithopanspermia. Astrobiology 5, 726-736 (2005).
10. Arrhenius, S., Worlds in the Making: The Evolution of the Universe. (1908). 11. Burchell, M.J. Panspermia today. International Journal of Astrobiology 3, 73-80 (2004). 12. Nicholson, W.L. Using thermal inactivation kinetics to calculate the probability of extreme
spore longevity: Implications for paleomicrobiology and lithopanspermia. Origins of Life and Evolution of the Biosphere 33, 621-631 (2003).
13. Gladman, B.J., Burns, J.A., Duncan, M., Lee, P., and Levison, H.F. The exchange of impact ejecta between terrestrial planets. Science 271, 1387 (1996).
14. Office of Space Science, N.A.a.S.A., Planetary Protection Provisions for Robotic Extraterrestrial Missions. (Washington, D.C., 1999).
15. Board, S.S. and Council, N.R., Preventing the Forward Contamination of Europa. (National Academy Press, Washington, D.C., 2000).
16. Powell, J.F. Isolation of dipicolinic acid (pyridine-2-6-dicarboxylic acid) from spores of Bacillus megatherium. Biochemical Journal 54, 210-211 (1953).
17. Murrell, W.G., in The Bacterial Spore, edited by G. W. Gould (Academic Press, New York, 1969), pp. 245-270.
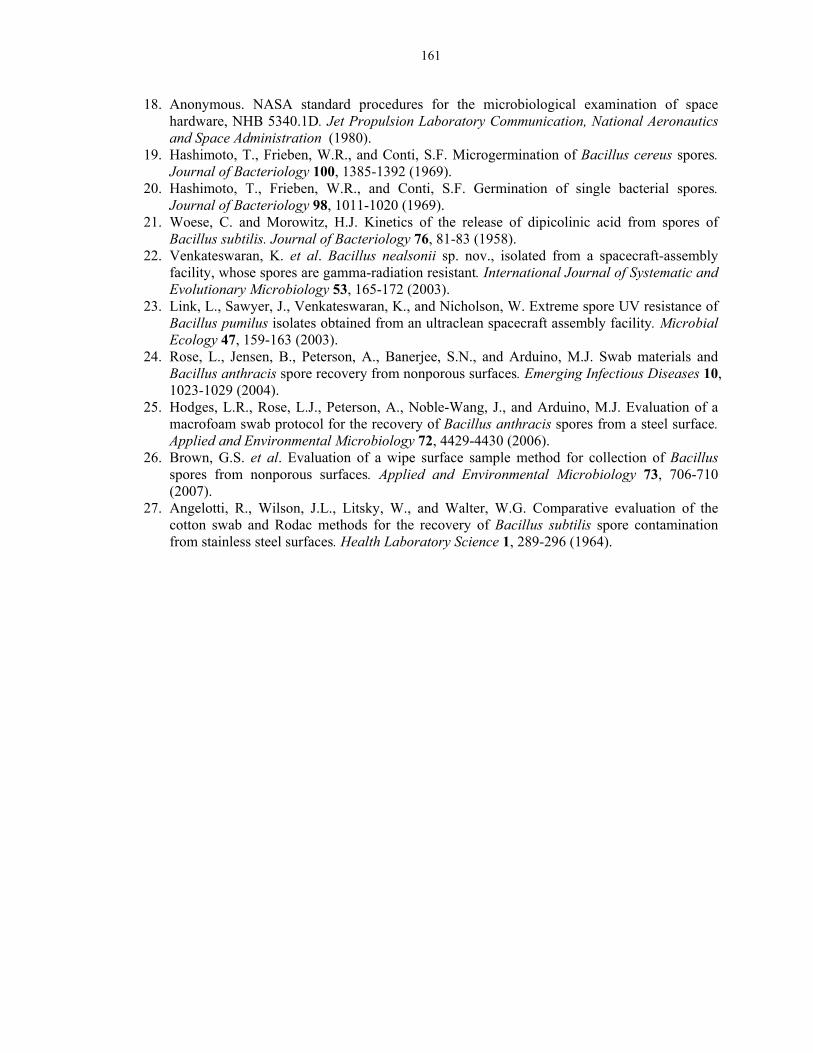
161
18. Anonymous. NASA standard procedures for the microbiological examination of space hardware, NHB 5340.1D. Jet Propulsion Laboratory Communication, National Aeronautics and Space Administration (1980).
19. Hashimoto, T., Frieben, W.R., and Conti, S.F. Microgermination of Bacillus cereus spores. Journal of Bacteriology 100, 1385-1392 (1969).
20. Hashimoto, T., Frieben, W.R., and Conti, S.F. Germination of single bacterial spores. Journal of Bacteriology 98, 1011-1020 (1969).
21. Woese, C. and Morowitz, H.J. Kinetics of the release of dipicolinic acid from spores of Bacillus subtilis. Journal of Bacteriology 76, 81-83 (1958).
22. Venkateswaran, K. et al. Bacillus nealsonii sp. nov., isolated from a spacecraft-assembly facility, whose spores are gamma-radiation resistant. International Journal of Systematic and Evolutionary Microbiology 53, 165-172 (2003).
23. Link, L., Sawyer, J., Venkateswaran, K., and Nicholson, W. Extreme spore UV resistance of Bacillus pumilus isolates obtained from an ultraclean spacecraft assembly facility. Microbial Ecology 47, 159-163 (2003).
24. Rose, L., Jensen, B., Peterson, A., Banerjee, S.N., and Arduino, M.J. Swab materials and Bacillus anthracis spore recovery from nonporous surfaces. Emerging Infectious Diseases 10, 1023-1029 (2004).
25. Hodges, L.R., Rose, L.J., Peterson, A., Noble-Wang, J., and Arduino, M.J. Evaluation of a macrofoam swab protocol for the recovery of Bacillus anthracis spores from a steel surface. Applied and Environmental Microbiology 72, 4429-4430 (2006).
26. Brown, G.S. et al. Evaluation of a wipe surface sample method for collection of Bacillus spores from nonporous surfaces. Applied and Environmental Microbiology 73, 706-710 (2007).
27. Angelotti, R., Wilson, J.L., Litsky, W., and Walter, W.G. Comparative evaluation of the cotton swab and Rodac methods for the recovery of Bacillus subtilis spore contamination from stainless steel surfaces. Health Laboratory Science 1, 289-296 (1964).

162
Figure 6.1 | Spectral overlap of different spectra. Excitation spectrum of terbium
dipicolinate (10 μM TbCl3 + 62.5 nM DPA in 1 M sodium acetate buffer at pH 5.8) at
544 nm emission wavelength is shown in solid red line. Excitation spectrum of the same
terbium dipicolinate solution at 278 nm excitation wavelength is shown in solid blue line.
The xenon flashlamp emission spectrum (red dashed line) is shown overlapping with Tb-
DPA excitation band in the mid-UV 250 - 300 nm range. The xenon flashlamp provides a
broadband emission wavelength from UV to IR, with peak intensity at 460 nm.
Transmittance spectrum of the emission UV-blocking high-pass filter (blue dashed line)
shows that it can effectively prevent most of the UV excitation from entering the camera.
In addition to this, a delay of 100-μs discriminates the long-lived Tb-DPA signal from the
short-lived xenon excitation. Green luminescence exhibited by Tb-DPA can thus be
imaged by the lifetime-gated CCD camera.

163
Figure 6.2 | Flowchart of the experimental procedure. Pre-cleaning, inoculation and
swab-rinse technique were common for both assays. Heat shock selected for bacterial
spores over vegetative cells. Extractions were split into halves and subjected to both
assays for parallel comparison. The cultivation-based NASA standard assay used TSA
pour plating to assess cultivable spore population in terms of CFU in 3 days. µEVA
enumerates endospores in less than 30 minutes in terms of germinable units by inducing
release of DPA via germination.
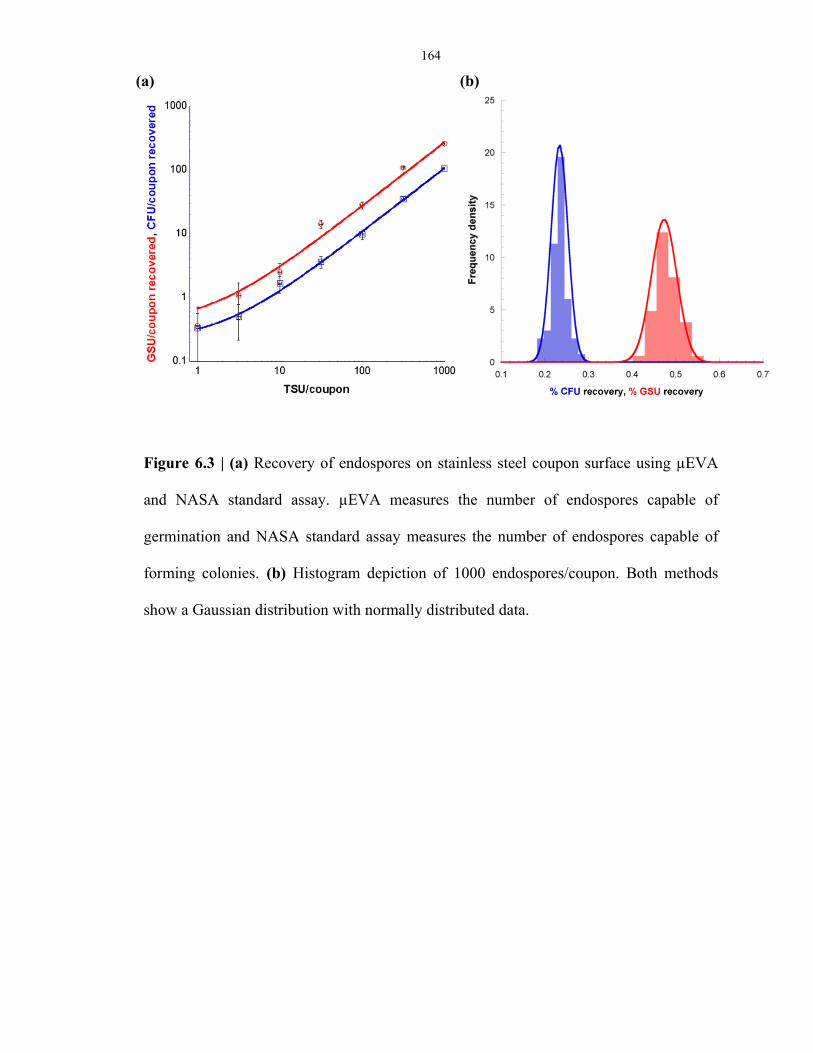
164
Figure 6.3 | (a) Recovery of endospores on stainless steel coupon surface using µEVA
and NASA standard assay. µEVA measures the number of endospores capable of
germination and NASA standard assay measures the number of endospores capable of
forming colonies. (b) Histogram depiction of 1000 endospores/coupon. Both methods
show a Gaussian distribution with normally distributed data.
(a) (b)
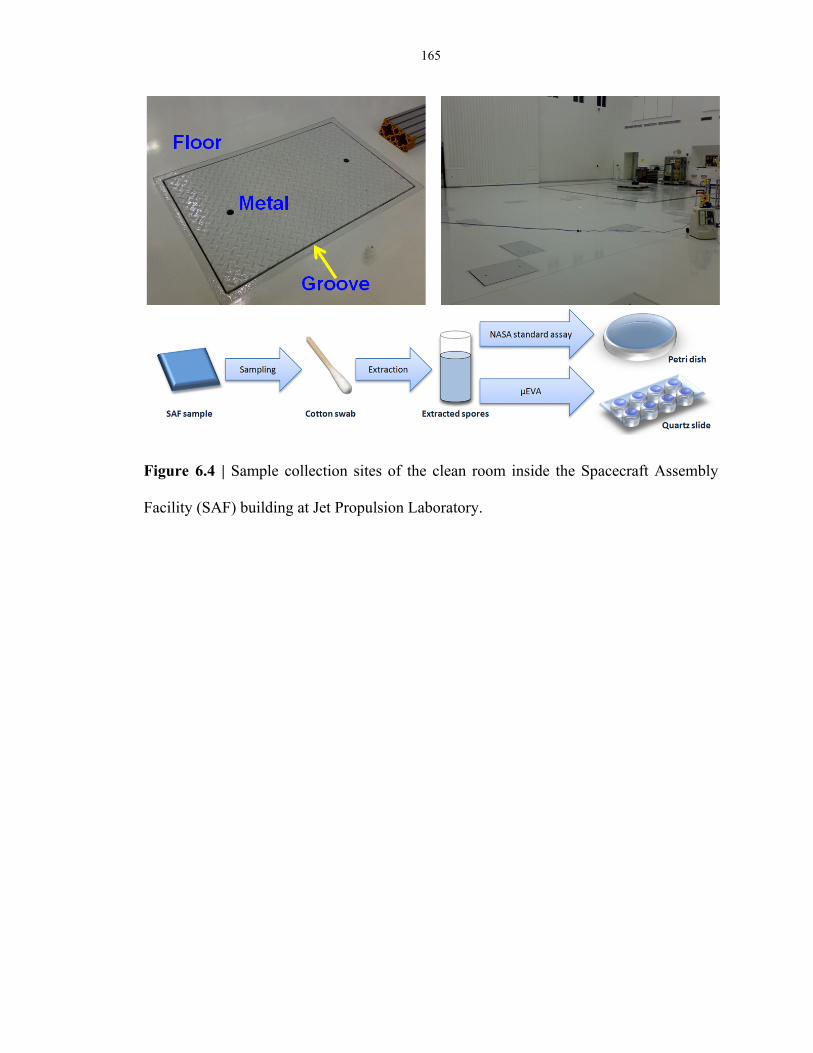
165
Figure 6.4 | Sample collection sites of the clean room inside the Spacecraft Assembly
Facility (SAF) building at Jet Propulsion Laboratory.
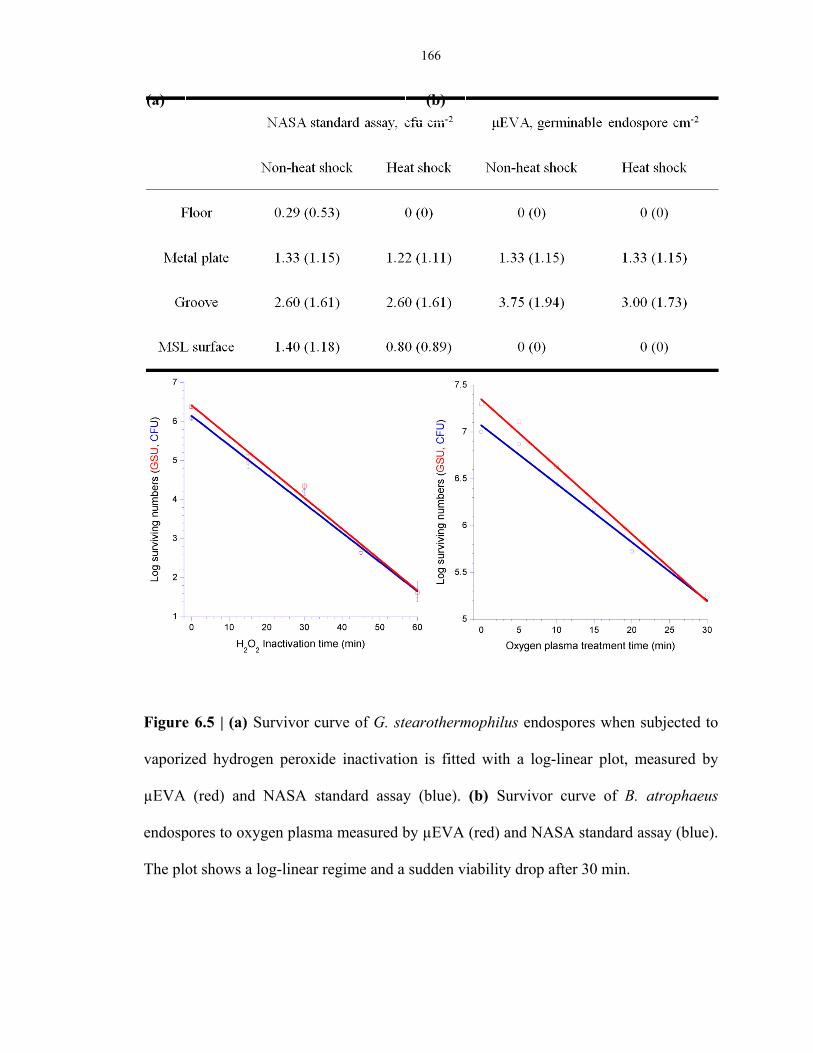
166
Figure 6.5 | (a) Survivor curve of G. stearothermophilus endospores when subjected to
vaporized hydrogen peroxide inactivation is fitted with a log-linear plot, measured by
µEVA (red) and NASA standard assay (blue). (b) Survivor curve of B. atrophaeus
endospores to oxygen plasma measured by µEVA (red) and NASA standard assay (blue).
The plot shows a log-linear regime and a sudden viability drop after 30 min.
(a) (b)
167
Table 6.1 | (a) Survivor curve of G. stearothermophilus endospores when subjected to
vaporized hydrogen peroxide inactivation is fitted with a log-linear plot, measured by
µEVA (red) and NASA standard assay (blue). (b) Survivor curve of B. atrophaeus
endospores to oxygen plasma measured by µEVA (red) and NASA standard assay (blue).
The plot shows a log-linear regime and a sudden viability drop after 30 min.
168
CHAPTER 7: METHOD DEVELOPMENT FOR ASTROBIOLOGIAL
EXPLORATION
7.1 Abstract
This chapter describes a wide variety of experiments involving method development,
instrument building and model formulation to path way for the study of endospores under
extreme environments on Earth as models for the astrobiological search of life in other
planets. This chapter consists of 3 separate modules (1) development of a sporulation
protocol for psychrophilic endospores; (2) mathematical modeling of the
microgermination and macrogermination kinetics of Bacillus endospores; (3)
methodology to increase culturable counts from endospores isolated from an environment.
7.2 Sporulation of psychrophilic endospores
Studying of psychrophilic bacterial spores in cyrospheres such as ice cores and
permafrost has shed light on the understanding of how microorganisms can survive at
subfreezing temperatures on Earth and possibly on Mars and other cold planetary bodies.
This chapter describes the isolation of psychrophilic Bacillus species from soils in Jet
Propulsion Laboratory and Lake Vida in Antarctica, as well as a comparison between
environmental psychrophilic strains with laboratory cultured psychrophilic endospores in
terms of endospore properties, heat resistance and germination kinetics. Novel
sporulation techniques have been developed to produce synchronized and homogeneous
psychrophilic Bacillus endospores. Psychrophilic endospores are more demanding than
169
their mesophilic counterparts in terms of sporulation requirement. Aeration and
germination inhibitor, such as D-alanine, were added to the nutrient exhaustion
sporulation medium in order to obtain large, pure and homogeneous spore batches for
germination and resistance studies.
7.2.1 Introduction
Endospores under psychrophilic conditions are of great significance because 3-quarter of
the earth’s surface are covered with cold oceans and large land masses are maintained at
low temperatures, which finds relevancy with lots of different icy celestial bodies. Study
of endospores as the most resistant and long-lived survivor in various extreme cold
biospheres, such as ice cores, polar lakes and alpine permafrost, hints to the exobiological
search for life. When encountering nutritional deficiency, rod-shaped Gram-positive
bacteria of the genera Bacillus and Clostridium differentiate to produce heat- and solvent-
resistant endospores. Endospores have also been detected from these cold environments1-
4. In the past several decades, mesophilic endospores such as Bacillus subtilis, B.
megaterium and B. anthracis have been thoroughly studied due to their easy handling and
fast growth rate. Yet endospore psychrophily has received little attention since Larkin
and Stokes have reported on spore formation and germination at 0°C by aerobic spore-
formers from soil, mud and water in 19665,6. Cold-adapted microbes can broadly be
categorized into two groupings, psychrophiles and psychrotolerants. Psychrophiles are
defined to be microorganisms that have a growth temperature range from 22°C to 0°C or
lower, with an optimum growth at about 15°C. On the other hand, psychrotolerants
generally do not grow at zero but do at 3-5°C, and have optimum and maximum growth
170
temperatures above 20°C7,8. For simplicity, in what follows, the term psychrophile is
used to cover both groups, unless there are specific and relevant differences. In this study,
we revisit and study sporulation, germination, and resistance properties of psychrophilic
endospores using an array of new microbiological techniques.
Work with Earth ice has raised the importance to develop proper protocols and
method at low temperatures. Nevertheless, most of our understanding on sporulation,
germination and resistance of endospores rest on the most-studied B. subtilis and its close
mesophilic relatives. In order to study cold biosphere properly, we need to understand
more about cold-tolerant endospore-forming bacteria. Towards this goal, the first step is
to produce clean psychrophilic endospores in a synchronized and homogeneous way.
Psychrophilic pores are routinely produced on fortified agar or in rich liquid media in
previous studies, which results in heterogeneous batches. It has also been well established
that bacterial spore properties are affected by the conditions during sporulation. Metal
and lipid contents in particular are affected greatly by the preparatory method. Therefore,
a novel sporulation protocol for psychrophilic spores have been developed that is of great
importance for obtaining reproducible and homogeneous endospore batches for a
thorough characterization of germination and other properties.
Considerable differences have been shown to exist between laboratory strain and
environmental mesophilic endospores, including B. subtilis and B. atrophaeus, which are
typically used as model strains in all types of spore work. Prolonged cultivation of
bacteria in laboratory conditions can cause changes in gene expression patterns and loss
of key properties for survival in the natural environment9-11. It is of prime importance to
know the variability of key spore properties such as germination and heat resistance in
171
the natural psychrophilic population. Knowing the boundary conditions for heat tolerance
in the environment can help determine an optimal heat shock temperature for screening
endospores from vegetative cells. Gould et al. have investigated the germination behavior
of crude spores isolated directly from soil and reported that a significant proportion of the
spores did not respond to any germinative compound12. Response to various germinants
is crucial to the application of endospore viability assays.
7.2.2 Methods
7.2.2.1 Bacterial strains and growth conditions
Bacillus longisporus (DSM 477) and Bacillus psychrodurans (DSM 11713) were
obtained from the German Collection of Microorganisms and Cell Cultures. All solutions
and agar media were pre-chilled to 4°C and held at this temperature on a cold tray during
the whole inoculation procedure. Both of them were growth in nutrient broth incubated at
20°C in a shaking bath at 120 rev min-1.
Environmental strains were isolated from JPL soils and Lake Vida from
Antarctica using the single cell technique13. JPL subsurface soil samples were collected
aseptically in sterile jars and Lake Vida brine sample was received as a gift. Soil and mud
samples were diluted 1:10 in sterile 0.1% peptone and heated at 80°C for 15 min to
inactivate vegetative cells. Lake Vida samples were heated without prior dilution. A 100-
µl amount of the soil extract was inoculated onto tryptic soy agar (TSA) (Difco, Sparks,
MD). 5-mL of the brine sample was inoculated into 25 ml of a medium consisting of 12.5
g of NaCl, 2 g of K2HPO4, 1.25 g of KH2PO4, 0.5 g of MgSO4 · 7H2O, 0.125 g of CaCl2 ·
2H2O, 0.05 g of MnSO4 · H2O, 2.5 g KNO3 and 2.5 g of yeast extract in 1 liter of water.
172
0.2-µm filter sterilized Wolfe’s mineral (0.5%) and vitamin (0.5%) solutions (ATCC)
were added aseptically to the sterile medium at 60°C. The basal medium was made of the
1/5 of the autoclaved lake sample.
The samples were incubated for 2 to 4 weeks at 7°C. The cells harvested on agar
plates and the broth were diluted accordingly and streaked on respective solid medium
and incubated at 7°C for 2 weeks. Isolated colonies were restreaked several times to
insure purity and were transferred to slants of agar for long-term storage. The strain
identities were confirmed by analyzing the first 500 base pairs of the 16S ribosomal DNA
gene.
7.2.2.2 Sporulation and endospore purification
Mesophilic endospores were prepared by using 2×SG sporulation agar because it is
reported to give high spore densities14. All ingredients were obtained from Sigma unless
otherwise noted. The medium consisted of: 16.0 g nutrient broth (Difco), 2.0 g KCl, 0.5 g
MgSO4 and 17.0 g agar in 1 litre of water. The medium pH was adjusted to 7, then
autoclaved and cooled. The following components were added after cooling: 1.0 mL 1 M
Ca(NO3)2, 1.0 mL 0.1 M MnCl2 · 4H2O, 1.0 mL 1 mM FeSO4 and 2.0 ml 0.5% glucose
(w/v). 200 µL of fresh Bacillus vegetative cells in tryptic soy broth in exponential phase
were added and spread over the agar surface. The plates were incubated at 30°C for 1
week. Spores were harvested using cotton applicators and suspended in sterile water. This
mixture of spores and cells was centrifuged at 1300 g for 20 min, washed with sterile
water 3 times. Lysozyme (50 µg mL-1) was added in the presence of buffer (¼ volume
TrisCl, 0.05 M, pH 7.2), and incubated with constant stirring at 37°C overnight.
173
Lysozyme was removed by centrifuging 8 times (at 1,300 g) and washing with sterile
deionized water. The resultant spore suspension was stored at 4°C.
B. longisporus and B. psychrodurans and spore-forming isolates from JPL soil
and Lake Vida were all sporulated using the same way except that the sporulation media
for Lake Vida was supplemented with sea water broth15 to mimic the natural
environments. The sporulation media was composed of nutrient broth (Difco) with 0.5%
yeast extract, 0.1% glucose, 0.7 mM CaCl2 · 2H2O, 1mM MgCl2 · 6H2O and 50 mM
MnCl2 · 4H2O, supplemented with 1 mM methyl anthranilate and 1 mM D-alanine16, at
final pH of 7.0. Media for Lake Vida was further fortified with 1.5 g Bacto Peptone, 0.01
g FePO4 · H2O, 750 ml sea water and 250 ml distilled water, adjusted to pH 7.0. Actively
growing culture, consisting of vegetative cells and endospores, was heat treated at 65°C
for 15 minutes and transferred to fresh medium several times17 and finally inoculated into
sporulation media augmented with an airlift system. The sporulation media was added to
a 250-mL vacuum filtration flask fitted with a fritted glass gas silicone dispersion tube,
two outlets, and a magnetic stir bar. The tube was connected to a fish tank pump through
a 0.2-µm membrane filter. Sterile air was bubbled through the medium at a constant rate
with an aspirator. The degree of sporulation was determined by direct microscopic counts.
After incubation of 2 weeks at room temperature, 70% of the biological particles present
were free “phase-bright” endospores.
After two washing steps and following resuspension in PBS, samples were heat
shocked at 65°C and sonicated for 5 min to damage vegetative cells. The suspension was
then incubated in lysozyme (50 mg mL-1) at 37°C overnight to lyse the vegetative cells.
The lysozome-treated suspension was put on top of an sodium bromide density gradient
174
and centrifuged at 5000 g (4°C) for 45 min. This gradient allowed the formation of
successive stages of NaBr density with the addition of density beads: 1.5, 1.4, 1.3, 1.2,
1.1 and 1.0 g mL-1.18 The endospores formed a solid pellet with a light crème color at
1.33 g mL-1 density level, where debris and vegetative cells were found at the 1.1 and 1.2
g mL-1 levels, respectively, as thin, loosely packed, dark brownish upper layers. The
isolated endospores were washed 10 times in 1 mL sterile water to get rid of any
remaining lysozyme. More than 99% of the samples were composed of free ‘phase-bright’
endospores. The suspension was either kept at 4°C with the addition of 50 mM D-alanine
to avoid germination or freeze-dried and stored as lyophilized powder at -20°C under the
dark. The usual mesophilic endospore storage condition in deionized water at 4°C was
not sufficient because psychrophilic endospores manage to germinate at a considerable
rate at this temperature.
7.2.2.3 Growth characteristics of strains
Optimal and maximal growth temperatures of the endospores were determined at 4, 7, 15,
20, 30 and 37°C in TSB inoculated in 96-well microtiter plates. Growth was measured by
monitoring optical density at 660 nm with a spectrophotometer (NanoDrop) after 2, 7 and
14 days of incubation and turbidity increases of >0.1 OD unit were scores as positive.
7.2.2.4 Characterization procedure
Concentration of bacterial endospores was determined by turbidity measurement and
phase-contrast microscopy under a 60× oil immersion objective (Nikon Eclipse 80i, AG
Heinze Co., Lake Forest, CA). Size and shape of endospores were determined from

175
malachite green staining. The Schaeffer-Fulton modification of Wirtz’s spore stain was
used19. DPA was measured with a fluorescent assay modified from Shafaat and Ponce20.
Endospore suspension were autoclaved (134°C for 45 min), a treatment known to release
all DPA21, and pelleted at maximum speed for 10 minutes. The supernatant was assayed
for DPA in a final volume of 800 µL containing 100 µL of supernatant and 700µL
sodium acetate buffer (20 mM at pH 5.6) with freshly added TbCl3 at a final
concentration of 100 µM. Excitation spectra (λex = 250 to 360 nm; λem = 544 nm) and
emission spectra (λex = 270 nm; λem = 515 to 580 nm) were measured with a Fluorolog-3
fluorimeter (Jobin Yvon, NJ) consisting of a 450-W xenon lamp for excitation, two
double-monochromators set with 3 nm bandpass filter, and a Pelletier-cooled
photomultiplier tube. A 500 nm cutoff filter (Omega Filters, Brattleboro, VT) was placed
at the entrance of the emission monochromator. Standard curves of 0-100 µM DPA
demonstrated straight lines (R2> 0.99) with this method. Endospores were induced to
germinate by a combination of L-alanine, inosine and sodium bicarbonate quantified by
the described fluorimetric analysis and OD660 measurement.
The heat resistance of microbes was determined by subjecting a 100-µL mixture
of 107 endospores and 107 vegetative cells in PCR tubes to controlled thermal cycles
using a PCR machine. The bacterial suspension was kept at 4°C before and after the heat
treatment. The temperature was ramped up quickly with 1 minute to the following
temperatures: 50, 60, 70, 75, 80, 85, 90, and 95°C. A replicate of 8 tubes were used for
each heat inactivation temperature. Heat treated bacterial suspension were pipetted into
96-well microtiter plates and incubated at the approximate temperature with mild
agitation until visible turbidity was observed.
176
Spore surface hydrophobicity was measured according to the method described by
Rosenberg et al.22 Spores were suspended in water, and after measurement of the
absorbance at 660 nm using a Nanodrop (Abefore, values at 0.4-0.5), 20 µL of n-
hexadecane (Sigma Aldrich) was added to 100 µL of spore suspension in a centrifuge
tube. This mixture was vortexed for 1 min, after which the phases were allowed to
separate for 15 min. Then, the absorbance of the aqueous phase was determined again
(Aafter), and the % transfer to the n-hexadecane was deduced by calculating 100 –
(Aafter/Abefore) × 100.
The wet density of the whole endospore was measured with a Percoll gradient
according to the method described by Tisa et al.23 Spores were concentrated in 0.15 M
NaCl, added to 90% (v/v) Percoll (Amersham Pharmacia Biotech) solution with 0.15 M
NaCl, and subsequently centrifuged for 40 min at 10,000 g. While spore wet density was
derived by comparison of the positions of the spores with those of density marker beads
(Amersham Pharmacia Biotech) in the self-established gradient.
The spore core density was determined with Nycodenz density gradients24
according to Lindsay et al.25 as follows: spores were permeabilized with a decoating
solution containing 0.1 M DTT, 0.1 M NaCl and 0.5% SDS according to Vary (1973)26.
Permeabilized spores were equilibrated in 30% Nycodenz (1.159 g mL-1). Semi-
continuous gradients were made by letting discontinuous gradients diffuse overnight at
5°C. After centrifugation for 45 min at 3700 rpm, the spores formed a band at a certain
position. The refractive index, which was linearly correlated with the density, from
samples taken just above and below the band was measured with a spectrophotometer,
and the average yielded the spore core density. Core water content was calculated
177
according to Lindsay et al.25.
7.2.3 Results
Two psychrophilic isolates of Bacillus were successfully isolated and sporulated from
JPL soil; 4 were isolated and produced as clean endospore suspensions from Lake Vida
lake brine water. They grew well at 4°C, optimally at 20°C, and failed to grow at
temperatures higher than 30°C. Their minimal and maximal growth temperatures were
lower than those for mesophilic species of Bacillus by 10°C. Both sporulation and
germination were observed to occur at lower temperatures than their mesophilic
counterparts. The Lake Vida grew optimally in media supplemented with sea water broth.
One of the Lake Vida isolates contained two endospores in a single mother cell.
Sporulation was observed via the typical seven steps27. DPA can be detected and the
degree of heat and UV resistance were comparable to other psychrophilic endospores.
Micro-cycle sporulation and germination events were observed in the sporulation
medium, resulting in a heterogeneous mixture of vegetative, sporulating and sporulated
cells. Endospores were observed to transition from phase bright to phase dark constantly
in the sporulation medium. To remedy this situation, 1 mM methyl anthranilate and 1
mM D-alanine were added into the sporulation medium to inhibit the action of L-alanine-
α-ketoglutarate aminotransferase28, thereby preventing endospores from going through
the germination pathway. A more synchronous and higher percentage of sporulation rate
(~70%) could be obtained afterwards. Aerated sporulation broth fortified with yeast
extract, glucose, and D-alanine was found to be the best sporulation medium for
psychrophilic endospore-forming bacteria. With further cleaning and purification, final
178
pure psychrotolerant endospore suspensions of >95% were produced. Table 7.1
summarizes the morphological and physiological characterization of the spore samples.
Figure 7.1 shows the phase contrast micrograph of some of the isolates.
The optimal germinant for mesophilic endospores was 50 mM L-alanine, whereas
the optimal germinant for psychrophilic endospores was 50 mM L-alanine and 1 mM
inosine. The optimal combination of germinants was studied on the psychrophilic
endospores. The germination rate of environmental psychrophilic endospores was very
low. Upon heat activation at 50°C and pre-incubation at 50 mM calcium dipicolinate, a
ten-told increase in germination rate was observed among environmental psychrophilic
endospores at 22°C. Figure 7.2 shows a comparison between the optimal germination
temperature between mesophilic and psychrophilic endospores when induced by 50 mM
L-alanine and 50 mM L-alanine plus 1 mM inosine. Mesophilic endospores germinated
fastest and optimally at 37°C and psychrophilic endospores generally germinated best
between 15°C and 22°C. Germination still proceeded at a slow but measurable rate at 4°C.
However, the lowest possible germination for mesophilic endospores was 12°C.
The inhibitory effect of sodium bicarbonate on endospore germination was
concentration dependent. The higher concentration of sodium bicarbonate, the slower the
rate of germination. For instance, 1 mM sodium bicarbonate reduced L-alanine
germination rate of B. atrophaeus and B. longisporus endospores by 42% and 46%,
respectively. The effect of sodium bicarbonate on mesophilic and psychrophilic
endospores was statistically insignificant (p < 0.001). The effect of the cationic surfactant,
dodecylamine, in inducing endospore germination was also studied. 1 mM dodecylamine
was used as the germinant without any buffer29,30. The highest rate of germination rate of
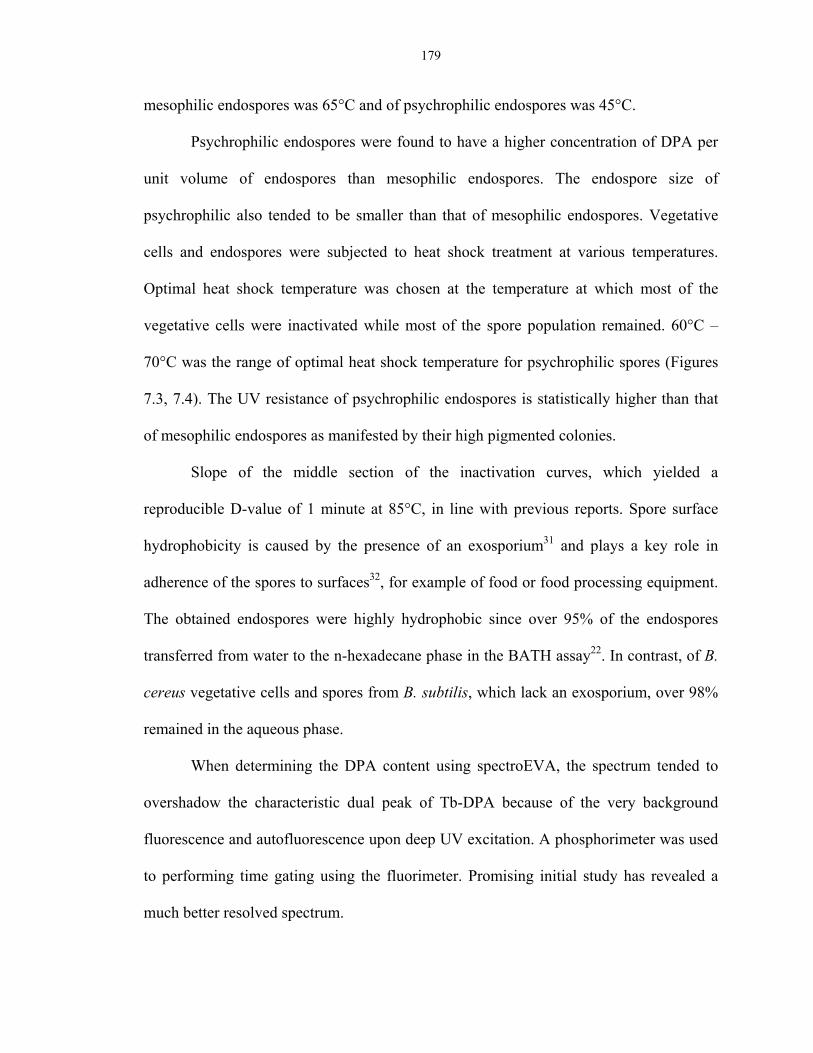
179
mesophilic endospores was 65°C and of psychrophilic endospores was 45°C.
Psychrophilic endospores were found to have a higher concentration of DPA per
unit volume of endospores than mesophilic endospores. The endospore size of
psychrophilic also tended to be smaller than that of mesophilic endospores. Vegetative
cells and endospores were subjected to heat shock treatment at various temperatures.
Optimal heat shock temperature was chosen at the temperature at which most of the
vegetative cells were inactivated while most of the spore population remained. 60°C –
70°C was the range of optimal heat shock temperature for psychrophilic spores (Figures
7.3, 7.4). The UV resistance of psychrophilic endospores is statistically higher than that
of mesophilic endospores as manifested by their high pigmented colonies.
Slope of the middle section of the inactivation curves, which yielded a
reproducible D-value of 1 minute at 85°C, in line with previous reports. Spore surface
hydrophobicity is caused by the presence of an exosporium31 and plays a key role in
adherence of the spores to surfaces32, for example of food or food processing equipment.
The obtained endospores were highly hydrophobic since over 95% of the endospores
transferred from water to the n-hexadecane phase in the BATH assay22. In contrast, of B.
cereus vegetative cells and spores from B. subtilis, which lack an exosporium, over 98%
remained in the aqueous phase.
When determining the DPA content using spectroEVA, the spectrum tended to
overshadow the characteristic dual peak of Tb-DPA because of the very background
fluorescence and autofluorescence upon deep UV excitation. A phosphorimeter was used
to performing time gating using the fluorimeter. Promising initial study has revealed a
much better resolved spectrum.
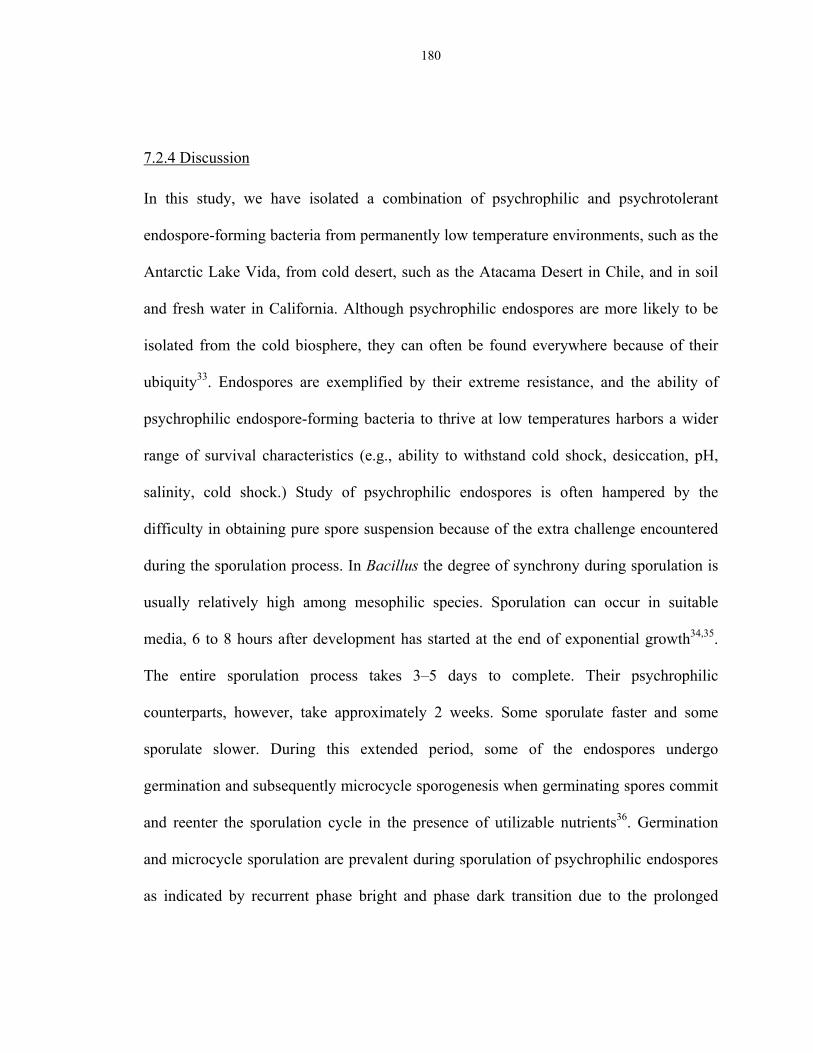
180
7.2.4 Discussion
In this study, we have isolated a combination of psychrophilic and psychrotolerant
endospore-forming bacteria from permanently low temperature environments, such as the
Antarctic Lake Vida, from cold desert, such as the Atacama Desert in Chile, and in soil
and fresh water in California. Although psychrophilic endospores are more likely to be
isolated from the cold biosphere, they can often be found everywhere because of their
ubiquity33. Endospores are exemplified by their extreme resistance, and the ability of
psychrophilic endospore-forming bacteria to thrive at low temperatures harbors a wider
range of survival characteristics (e.g., ability to withstand cold shock, desiccation, pH,
salinity, cold shock.) Study of psychrophilic endospores is often hampered by the
difficulty in obtaining pure spore suspension because of the extra challenge encountered
during the sporulation process. In Bacillus the degree of synchrony during sporulation is
usually relatively high among mesophilic species. Sporulation can occur in suitable
media, 6 to 8 hours after development has started at the end of exponential growth34,35.
The entire sporulation process takes 3–5 days to complete. Their psychrophilic
counterparts, however, take approximately 2 weeks. Some sporulate faster and some
sporulate slower. During this extended period, some of the endospores undergo
germination and subsequently microcycle sporogenesis when germinating spores commit
and reenter the sporulation cycle in the presence of utilizable nutrients36. Germination
and microcycle sporulation are prevalent during sporulation of psychrophilic endospores
as indicated by recurrent phase bright and phase dark transition due to the prolonged
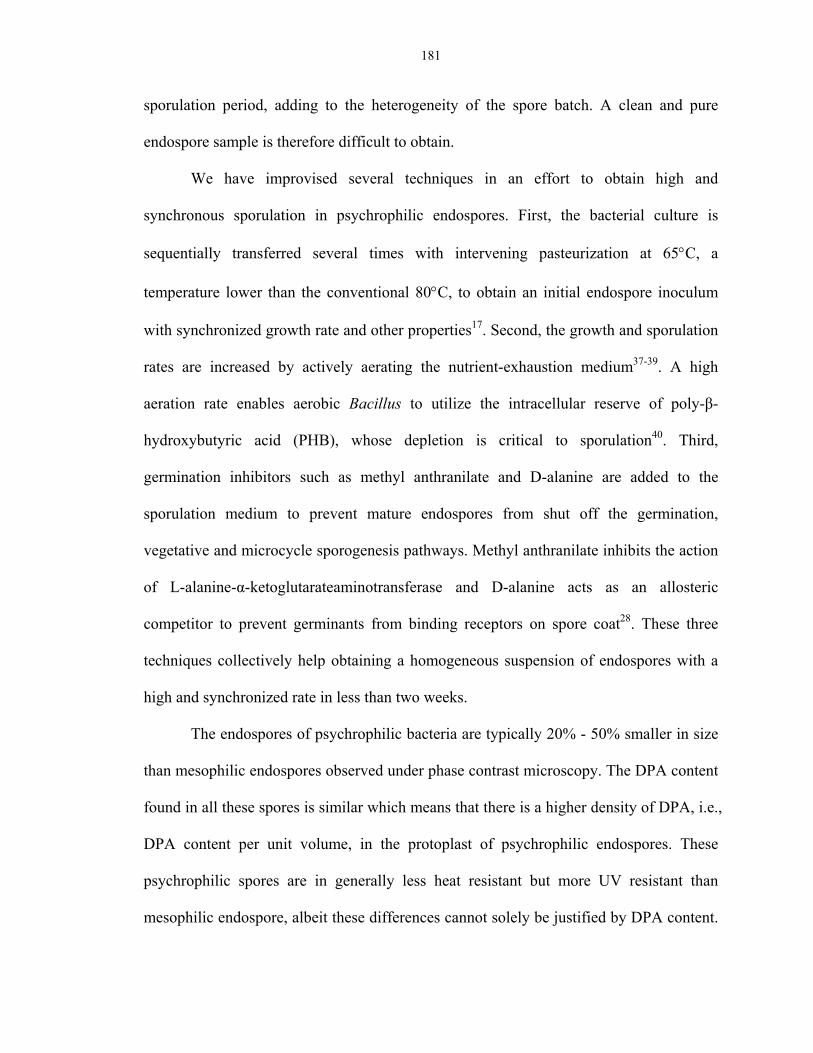
181
sporulation period, adding to the heterogeneity of the spore batch. A clean and pure
endospore sample is therefore difficult to obtain.
We have improvised several techniques in an effort to obtain high and
synchronous sporulation in psychrophilic endospores. First, the bacterial culture is
sequentially transferred several times with intervening pasteurization at 65°C, a
temperature lower than the conventional 80°C, to obtain an initial endospore inoculum
with synchronized growth rate and other properties17. Second, the growth and sporulation
rates are increased by actively aerating the nutrient-exhaustion medium37-39. A high
aeration rate enables aerobic Bacillus to utilize the intracellular reserve of poly-β-
hydroxybutyric acid (PHB), whose depletion is critical to sporulation40. Third,
germination inhibitors such as methyl anthranilate and D-alanine are added to the
sporulation medium to prevent mature endospores from shut off the germination,
vegetative and microcycle sporogenesis pathways. Methyl anthranilate inhibits the action
of L-alanine-α-ketoglutarateaminotransferase and D-alanine acts as an allosteric
competitor to prevent germinants from binding receptors on spore coat28. These three
techniques collectively help obtaining a homogeneous suspension of endospores with a
high and synchronized rate in less than two weeks.
The endospores of psychrophilic bacteria are typically 20% - 50% smaller in size
than mesophilic endospores observed under phase contrast microscopy. The DPA content
found in all these spores is similar which means that there is a higher density of DPA, i.e.,
DPA content per unit volume, in the protoplast of psychrophilic endospores. These
psychrophilic spores are in generally less heat resistant but more UV resistant than
mesophilic endospore, albeit these differences cannot solely be justified by DPA content.
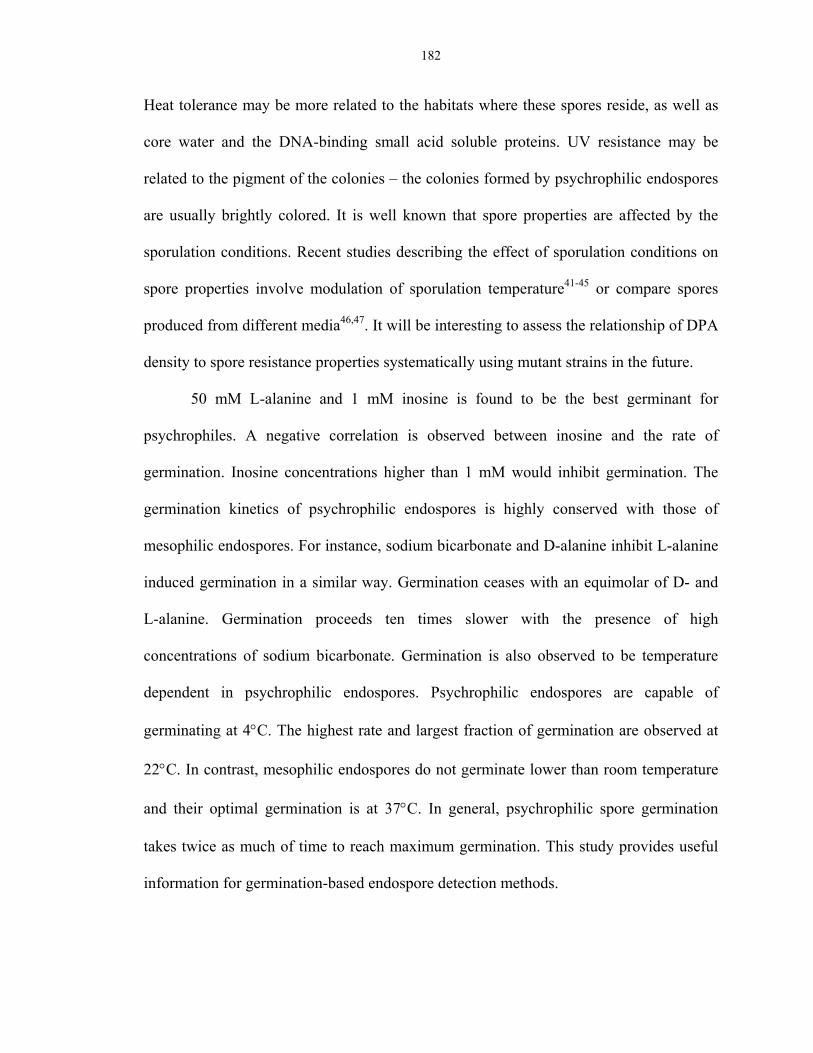
182
Heat tolerance may be more related to the habitats where these spores reside, as well as
core water and the DNA-binding small acid soluble proteins. UV resistance may be
related to the pigment of the colonies – the colonies formed by psychrophilic endospores
are usually brightly colored. It is well known that spore properties are affected by the
sporulation conditions. Recent studies describing the effect of sporulation conditions on
spore properties involve modulation of sporulation temperature41-45 or compare spores
produced from different media46,47. It will be interesting to assess the relationship of DPA
density to spore resistance properties systematically using mutant strains in the future.
50 mM L-alanine and 1 mM inosine is found to be the best germinant for
psychrophiles. A negative correlation is observed between inosine and the rate of
germination. Inosine concentrations higher than 1 mM would inhibit germination. The
germination kinetics of psychrophilic endospores is highly conserved with those of
mesophilic endospores. For instance, sodium bicarbonate and D-alanine inhibit L-alanine
induced germination in a similar way. Germination ceases with an equimolar of D- and
L-alanine. Germination proceeds ten times slower with the presence of high
concentrations of sodium bicarbonate. Germination is also observed to be temperature
dependent in psychrophilic endospores. Psychrophilic endospores are capable of
germinating at 4°C. The highest rate and largest fraction of germination are observed at
22°C. In contrast, mesophilic endospores do not germinate lower than room temperature
and their optimal germination is at 37°C. In general, psychrophilic spore germination
takes twice as much of time to reach maximum germination. This study provides useful
information for germination-based endospore detection methods.
183
7.2.5 Conclusion
Study of psychrophiles is essential to the understanding of early lives on Earth.
Endospores have widely been examined in ancient Earth ice and permafrost due to their
longevity as analogues to study cold biospheres in other celestial bodies. The ability of
these endospores to thrive and subsequently remain dormant at low temperature seems to
have been acquired during evolutionary time. And in view of the glaciations periods
suggested by the Snowball hypothesis, study of psychrophilic endospores can provide
great insights in the testing of theories and development of methods to search for
extraterrestrial life in other polar systems.
7.3 Micro- and macro-germination kinetics
Germination events of individual and a population of Bacillus endospores were
monitored using phase-contrast microscopy, terbium-dipicolinic acid luminescence assay,
fluorescence staining, flow cytometry and ATP luciferin-luciferase assay. In particular,
we have adopted and developed mathematical models to describe microgermination and
macrogermination kinetics by monitoring DPA release from endospores induced by L-
alanine. The microgermination model is a differential equation approach to describe
single endospore germination based on a 3-compartmental analysis. This model
quantitatively describes the germination events of 4 laboratory and 4 environmental strain
endospores. The microgermination model has been extrapolated into the
macrogermination model based on a stochastic assumption of the heterogeneous
population of individual endospores. Inconsistent results are obtained between micro- and
macro-germination characteristics. The endospore inoculum size and time-to-germination

184
was found to vary in a logarithmic fashion. Plausible reasons are quorum sensing,
feedback or feed-forward mechanisms during germination. In this study, we report the
use of a combination of methods to study different properties of endospore, such as
stainability, loss of heat resistance, drop in refractility, release of DPA, during the course
of germination and re-affirm the sequence of physiological processes taking place during
germination.
7.3.1 Introduction
When starved of nutrients Bacillus, Clostridium and cells from other genera initiate a
series of genetic, biochemical and structural events that result in the formation of
metabolically dormant endospores. They can remain dormant for extended periods and,
partly because of their tough spore coat, have a significant resistance to extreme
environmental factors including heat, radiation and toxic chemicals. Germination is the
process whereby an endospore changes from a dormant state to reenter the vegetative
mode of replication upon detection of favorable conditions.
The process of germination is a time-ordered sequence in which spores lose their
characteristic resistance to heat, desiccation, pressure, vacuum, ultraviolet and ionizing
radiations, antibiotics and other chemicals, extremes of pH and an increased permeability
to a number of different molecules. Once a germinant binds to receptors in the inner
membrane of spore, hydration of the cortex is accompanied with rapid degradation
including a release of calcium dipicolinate and different chemicals from the spore core.
Cortex hydrolysis and germ cell wall expansion follows with subsequent resumption of
metabolism and macromolecular synthesis. Any of these observables can be used to track
185
and signify the germination timecourse of endospores. Hashimoto et al. has shown that
single spore germination timecourse has two distinct phases based on spore refractility
and optical density48. Partial dehydration occurs and DPA is released into the medium in
the first rapid phase. Hydration of the spore core happens in the second phase. The first
phase was reported to take 75 ± 15 sec and 3 - 4.5 minutes; second phase lasted ~2 min
and ~7 min for B. cereus and B. megaterium, respectively.
It is known that endospore germination will be affected by a number of factors,
including sporulation condition, germinant concentration, temperature and ionic strength
of the medium49-51. So, in this experiment, all the laboratory grown strains are sporulated
using the same protocol. All endospores were activated at 50°C for 30 minutes prior to
exposure to a millimolar concentration of L-alanine, with the only difference in
temperature between mesophilic and thermophilic endospore-forming bacteria.
Dipicolinic acid (DPA) is a unique molecule in endospores. The terbium
photoluminescence assay has been used to quantify endospore concentration based on the
fluorimetric measurement of DPA concentration in a germinating endospore suspension.
We have employed this method to examine the germination kinetics of endospores in a
population large than 1000 sp mL-1 due to the assay limit of detection. On the other hand,
single endospore germination kinetics was measured by refractility change under phase-
contrast microscopy and a time-gated microscopic version of the Tb-DPA luminescence
assay (i.e., μEVA). Single endospores are observed to transition from phase bright to
phase dark using a phase contrast microscope; from null to formation of a bright spot
under μEVA. In specific, μEVA measures intensity enhancement of the long-lived
terbium dipicolinate complex as a function of DPA release from spores.
186
In addition to these, ATP synthesis, stainability and heat resistance were also
measured to serve as index for germination to augment these fluorimetric and
microscopic results. Dormant endospores are not stainable by fluorescent dyes because of
the permeation barrier imposed by the spore coat and outer edge of the cortex unless
specially treated by acids or heat. Germinating spores are, however, readily stainable by
fluorescent markers and DNA-intercalating dyes due to activation of lytic enzymes and
an increase in permeability of the endospore membranes, both of which are events in the
process of endospore germination. Heat resistance is related to structural integrity of the
spore coats and loss of heat resistance is observed almost concurrently with the onset of
germination. Dormant spores have little if any detectable endogenous metabolism52 and
contain extremely low levels of ATP and reduced pyridine nucleotides. However, the low
energy forms of ATP (e.g., ADP and AMP) and other compounds essential for
metabolism and macromolecular synthesis are present in spores at levels similar to those
in growing cells. Production of high energy compounds in the early minutes of spore
germination is driven, in large part, via metabolism of energy reserved stored in the
dormant spore. These compounds produced via metabolism of endogenous reserves then
support considerable RNA and protein synthesis. However, continued rapid production of
high energy compounds after the first 10-15 min of germination of these spores requires
exogenous metabolites. Another major endogenous energy reserve of dormant spores is
the amino acid generated via protein degradation early in spore germination.
Approximately 15%-20% of the total proteins are degraded to free amino acids in the first
20 minutes of germination, which in turn is subsequently metabolized through oxidative
reactions.
187
The early timecourse of germination of endospores, whether individual or in a
population, has been reported to be sigmoidal using lots of the aforementioned methods.
There is one account proposing a biphasic germination kinetic, which cannot be
reproduced. A large variety of germination models, mechanistic or empirical, single
endospore or a population, deterministic or stochastic, have been proposed in the
literature. The logistic model is insufficient because it only describes the values of a
particular set of experimental data, bearing little direct relation to the biological structure
or the general physical laws. Mechanistic models, both deterministic and stochastic, have
been proposed to account for germination kinetics based on some biological and physical
understanding of the system. Although significant progress has been made in
understanding the biochemical and genetic bases of the spore germination process,
inconsistencies still exist and it is still unclear about the integration of individual
endospore germination collectively into germination of an endospore population. For
instance, Mohd et al. have reported germination of Bacillus anthracis spores into
vegetative cells in 3 hours using atomic force microscopy and transmission electron
microscopy53. Hashimoto et al. used time-lapse phase contrast microscopy to characterize
germination on the timescale of minutes48,54. In this study, we have adopted a reported
deterministic and a reported stochastic model, in conjunction with the new DPA detection
methodologies, to study both micro- and macro-germination, as well as establish a link
between the two germination models.
188
7.3.2 Methods
Germination was performed without heat activation, and initiated by the addition of 100
mM L-alanine and different concentrations of inosine (0, 0.01, 0.05 and 0.1 mM).
Samples were incubated at 37°C and aliquots were taken at different time intervals and
centrifuged at 5000 g for 5 min. The pellet was suspended in phosphate buffered saline
(PBS) to a concentration of 106 to 5×10⁶ spores mL-1. The time course of germination in
endospores was monitored by observing the change in absorbance of a sample at 600 nm
in a spectrometer and change in DPA content at 278 nm in a fluorimeter. and then
analyzed by spectroEVA as described before.
Deterministic Model
This model was originally developed for describing macrogermination based on drop in
optical density of an endospore suspension55. Here, we modify this model to describe
both micro- and macrogermination kinetics based on the increase of DPA release as a
proxy for germination.
Germination is a time-ordered sequence of four distinct phases, consists of
activation, commitment, stage I and stage II. In the activation phase, various pre-
treatments, often consisting of exposure to elevated temperatures, results in an increase in
both the rate and extent of germination. In the second phase, the spore is irreversibly
committed to complete the germination process, and it will do so even on subsequent
removal of the germinant. The spore next enters the phase called initiation of germination.
During this phase, one observes the characteristic manifestation of the germination
process, such as loss of heat resistance, release of spore materials, uptake of stains, loss
189
of refractility and loss of absorbance in spore suspensions. These events have been shown
to occur in a time-ordered sequence14,56-58. This is a phase of degradative processes,
culminating in drastic morphological changes. The final phase, called outgrowth, is a
period of synthesis of new materials, the outcome of which is a vegetative cell.
The overall features of the experimental DPA release vs. time curves are
reasonably well described by the phenomenological function xp(t), given by:
x t x , t < t0,
x t x∞ K e λ K e λ , t t .
Subject to the experimentally determined boundary conditions:
x t x ; 0,
where K1, K2, λ1 and λ2 are curve-fitting parameters, x0 and x∞ are the initial and final
values of the DPA luminescence, and t0 is the lag time. The condition on xp(t) leads to
x∞ x K K .
While the condition on the slope requires that
λ K λ K .
The rate at which spores enter state C is determined by the transition probabilities λA and
λB, with λA being identified with the triggering event. The time rate of change in the
number of spores in each of these states are given by
A λAA t ,
B λBB t λAA t .
And by the principle of conservation, we have
A t B t C t A ,
190
where A0 is the concentration of spores which eventually germinate. The solution of the
above system of simultaneous differential equations is
A t A e λA ,
B t λAλB λA
A e λA e λB ,
C t A AλB λA
λAe λB λBe λA .
The above description of germination is independent of any of the characteristic
properties employed to follow the time course of this process. ε(t) is the contribution of a
single spore to this index. In this model, ε maintains its initial value, ε0, until the spore
enters C, whereupon its time dependence can be described by the expression,
ε t ε ε∞ ε α τ dτ,
subject to the normalization condition
α τ dτ∞ 1.
The observed index can then be expressed at any time t as
x t ε N A ε A t B t C ′
′ ′ τε t τ dτ,
where N0 is the total spore concentration, ε N A is the contribution of the non-
germinable spores, ε A t and ε B t are due to spores in states A and B, respectively,
and the integral expression is the contribution of spores have entered state C up to the
time t. Note that dC t′ dt′⁄ ′ τdτ is the number of spores which entered state C between
τ and τ+dτ and each one of these spores contributes ε(t-τ) at time t. The last term in the
previous equation can be integrated by parts.
x t x ε∞ ε C t τ α τ dτ,
where x0=ε0No. Thus x(t) is essentially the convolution of C(t) and α(t).
191
x t x A ε∞ ε F t, 0 λAλB λA
e λB F t, λBλB
λB λAe λA F t, λA ,
where
F t, λ eλτα τ dτ.
To evaluate the asymptotic value of x(t), we note that
lim ∞ e λτ F t, λ 0.
The above integral equation for x(t) can be transformed into a corresponding differential
equation. Making use of the fact that
F ,λ eλτα τ .
In the successive differentiation of the equation, one obtains
F t, 0A ε∞ ε λAλB
λA λB λAλB y t y .
Subject to the boundary conditions
y 0 y ε N ,
0.
By combining the previous equations, we can derive differential expressions for the
functions ε(t) and α(t), which describe the manifestations of germination in the single
spore case:
ϵ t ϵA λAλB
λA λB λAλB y t y ,
and
α tA ε∞ ε λAλB
λA λB λAλB .
The presence of a lag time occurs between the time at which a spore enters state C and
the time that its change in ε begins. Since the observable manifestations of germination
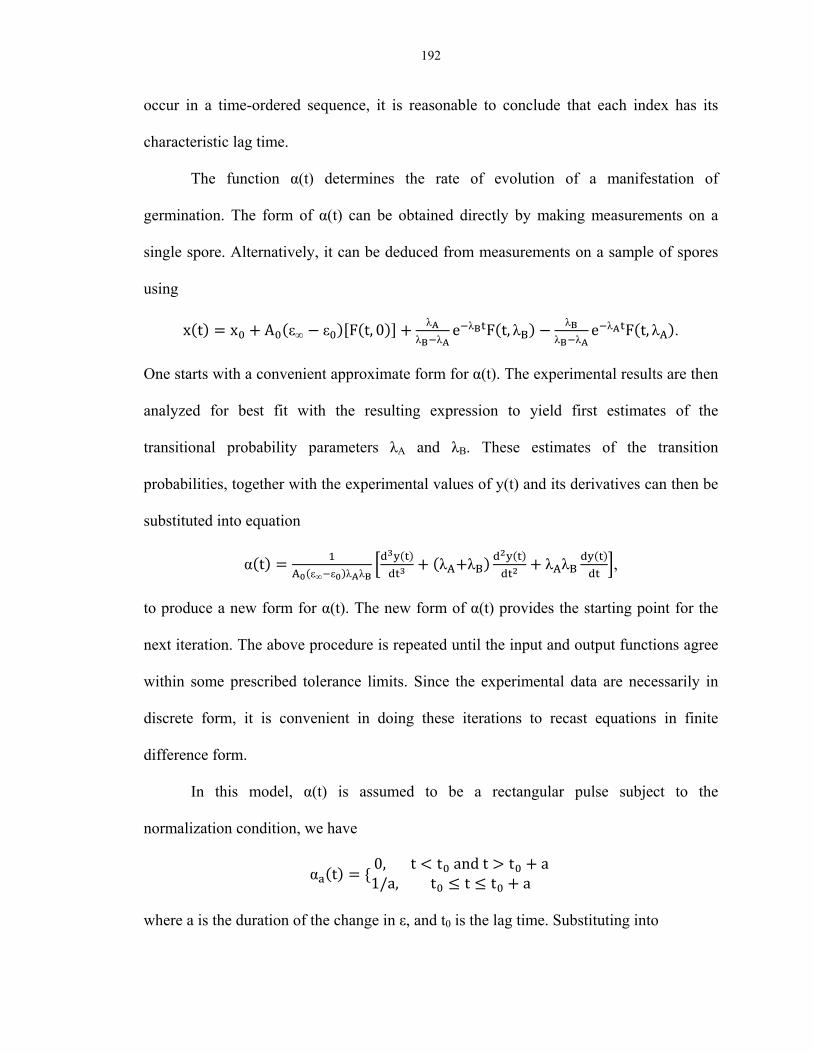
192
occur in a time-ordered sequence, it is reasonable to conclude that each index has its
characteristic lag time.
The function α(t) determines the rate of evolution of a manifestation of
germination. The form of α(t) can be obtained directly by making measurements on a
single spore. Alternatively, it can be deduced from measurements on a sample of spores
using
x t x A ε∞ ε F t, 0 λAλB λA
e λB F t, λBλB
λB λAe λA F t, λA .
One starts with a convenient approximate form for α(t). The experimental results are then
analyzed for best fit with the resulting expression to yield first estimates of the
transitional probability parameters λA and λB. These estimates of the transition
probabilities, together with the experimental values of y(t) and its derivatives can then be
substituted into equation
α tA ε∞ ε λAλB
λA λB λAλB ,
to produce a new form for α(t). The new form of α(t) provides the starting point for the
next iteration. The above procedure is repeated until the input and output functions agree
within some prescribed tolerance limits. Since the experimental data are necessarily in
discrete form, it is convenient in doing these iterations to recast equations in finite
difference form.
In this model, α(t) is assumed to be a rectangular pulse subject to the
normalization condition, we have
α t 0, t t and t t a1/a, t t t a
where a is the duration of the change in ε, and t0 is the lag time. Substituting into
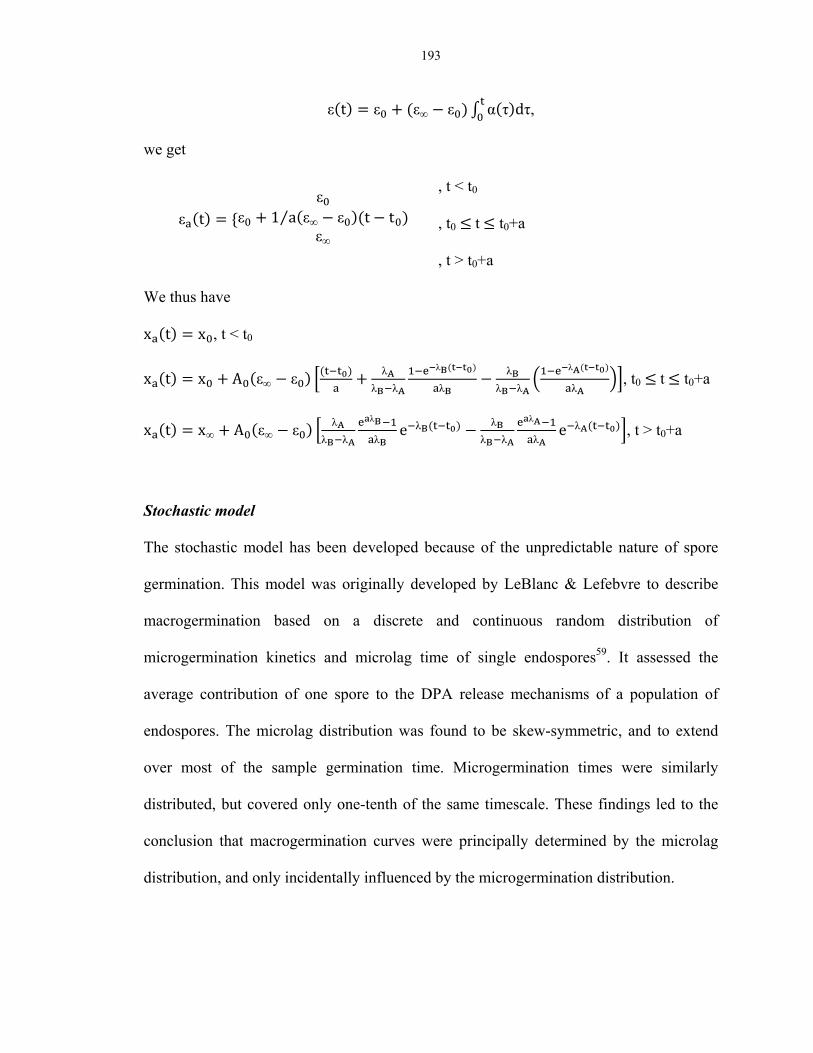
193
ε t ε ε∞ ε α τ dτ,
we get
ε tε
ε 1 a ε∞ ε t t⁄ε∞
, t < t0
, t0 t t0+a
, t > t0+a
We thus have
x t x , t < t0
x t x A ε∞ ε λAλB λA
λB
λB
λBλB λA
λA
λA, t0 t t0+a
x t x∞ A ε∞ ε λAλB λA
λB
λBe λB λB
λB λA
λA
λAe λA , t > t0+a
Stochastic model
The stochastic model has been developed because of the unpredictable nature of spore
germination. This model was originally developed by LeBlanc & Lefebvre to describe
macrogermination based on a discrete and continuous random distribution of
microgermination kinetics and microlag time of single endospores59. It assessed the
average contribution of one spore to the DPA release mechanisms of a population of
endospores. The microlag distribution was found to be skew-symmetric, and to extend
over most of the sample germination time. Microgermination times were similarly
distributed, but covered only one-tenth of the same timescale. These findings led to the
conclusion that macrogermination curves were principally determined by the microlag
distribution, and only incidentally influenced by the microgermination distribution.

194
In the model, the DPA level at any time t of a randomly selected endospore can be
represented by
X εT t T ,
where T0 and T1 are non negative and independent random variables.
E(Xt) is the mean DPA luminescence level of a single endospore at time t. We
first determine the probability of the possible values of Xt for a fixed microgermination
time. These probabilities are expressed in terms of f0(τ0), the density function of the
variable T0, and its distribution function F0 is defined by
F u f τ∞ dτ .
The final model is of the form
E X ε F uτ∞ εT t u f τ dudτ .
Using this probabilistic approach, it is possible to show that the observed sigmoid-shaped
absorbance cs. Time curve of a sample of germinating bacterial spores can be generated
from the simple observation that the individual spore germination times are distributed
over a range of values.
195
7.3.3 Results
Each of these observables reports comparable but slightly different kinetics, presumably
due to underlying differences in the detection method and also the fact that each of the
physiological changes is associated with a different interval and time scale of germination.
When an endospore is committed to germinate, it follows a microlag period and a
microgermination period en route to the outgrowth phase. Microlag period has been
defined in the 1950s as the period at which a committed endospore remain its refractility.
This term could be confusing when DPA release was used as the metric for the
monitoring of germination timecourse. An endospore could have started releasing Ca-
DPA without any apparent refractility change during the early minutes of germination.
Phase transition has been correlated with a combination of events, including DPA and
metal ion exudation, degradation of spore coat, influx of water, and swelling of
endospores. When it starts to change from phase bright to phase dark, the period is
termed microgermination during which DPA and metal ions are exuded from the
endospores and water enters to rehydrate the core, leading to subsequent or arguably
concurrent loss of heat resistance and increased stainability, followed by synthesis of
macromolecules and production of ATP. A shorter microlag time was observed in the
case of DPA release, which is consistent with the postulated time-ordered sequence of
germination - Ca-DPA release precedes the water rehydration. Heat resistance and
increased stainability were both shown to correlate to refractility more than DPA release,
albeit the difference was not statistically significant (p < 0.001) due to the relatively long
process of heat resistance and stainability assessment compared to the short time scale of
germination. ATP can be detected during the late stage of germination II when a high
196
inoculum of spores was used. This ATP should be the reserve stored inside endospores
and were utilized and could thus be assayed by luciferin. When a growth medium, such
as tryptic soy broth, was provided, a continued rise in ATP could be observed in
conjunction with the outgrowth phase where new molecules were being synthesized.
Although the initiation of spore germination may not require macromolecular
synthesis or metabolic energy, generation of ATP as well as macromolecular synthesis
begin within minutes or even seconds of the initiation process. Furthermore, these latter
events often begin well before completion of some of the degradative reactions
accompanying initiation. As a consequence, it is difficult to separate the periods of
germination and outgrowth by measuring parameters such as the kinetics of
macromolecular biosynthetic or degradative reactions.
Germination was carried out in bulk solution with 50 mM L-alanine in pH-
controlled buffer at a total number of endospores of 103, 104, 105, 106, and 107. Another
challenge was observed in the difference in the time-to-germination. The higher the
concentration of spores, the longer the suspension takes to plateau in DPA concentration
(defined to be within 95% of the final DPA concentration measured at the end of a 24-
hour cycle). The reason for this correlation is still unclear. Inoculum size dependency of
germination has been observed in our laboratory strains. This could be due to the
stochastic nature of microgermination, quorum sensing among Bacillus spores or a
feedback or feed-forward mechanism in the germination process. Microgermination
kinetics has been studied and well characterized by monitoring the absorbance property
of endospores during the course of germination. Several models have been proposed in
the past, either through theory or empirical mathematical modeling. Endospores transition

197
from phase bright to phase dark during germination, accompanied with a drop in
refractility and absorbance. Hashimoto et al. have measured the germination timecourse
of a single endospore, known as microgermination. Microgermination is characterized by
a microlag period in which endospores have been exposed to germinants and no
physiological changes can yet be detected. Microlag is followed by a sigmoidal
timecourse of germination, measured by either heat resistance, stainability, DPA release
or refractility loss (Figure 7.5). A logistic model was first proposed to characterize such a
microgermination system. Table 7.2 and Figure 7.6 demonstrate the microgermination
model of 4 lab-strain and 4 environmental-strain endospores.
Endospore germination by itself is a stochastic process due to the heterogeneity of
an endospore population. When endospores germinate, they release a large depot of
chemicals. Among these, calcium dipicolinate and alanine have been postulated to play a
role in affecting the germination kinetics. Ca-DPA is a very germinant and induces
endospores to germinate via a mechanism different then nutrient induction. As more
spores germinate in a population, more Ca-DPA is released to facilitate the rate of
germination. On the other hand, alanine could be both a germinant and an inhibitor to
endospores. As spores germinate, alpha-keto transalantrase will convert L-alanine into D-
alanine, which is an allosteric inhibitor to germination. Quorum sensing may also a
reason affecting macrogermination but not much study have been done on this respect so
far.
Macrogermination will be characterized using spectroEVA and modeled using a
stochastic model, which involves mixed continuous and discrete probabilities of different
stages of germination. Macroscopically, endospores from a pure culture generally exhibit
198
a high degree of synchrony. And the microlag distribution is found to be skew-symmetric
and to extend over most of the sample germination time. Microgermination time
germination is skew distributed, but covers only about a tenth of the same time scale.
Therefore, macroscopic germination is principally influenced by the microlag distribution,
and only incidentally influenced by the microgermination distribution. The distribution
shows that individual spores in a sample are highly heterogeneous and there exists some
super-dormant spores that are very insensitive to germination induction. Figure 7.7 shows
a stochastic model derived from microgermination kinetics. The microlag and
microgermination distributions (both skew symmetric) were fitted into the stochastic
model, which yielded a discrepancy from the actual data.
In µEVA, we are selecting the fraction of a low inoculum of endospores that
respond fast to germinants. At high inocula, endospores are more easily affected by the
skew-symmetric distribution of microlag times, leading to a much longer germination
time. Whether endospore requires minutes to germinate or 24 hours to germinate is still a
debate.
7.3.4 Conclusion
In this study, we apply and modify the previous models based on different observables
during the germination process, notably the release of DPA from endospores. The model
makes a clear distinction between the intrinsic aspects of the germination process and the
observable changes consequent to germination. The intrinsic process consists of two
successive random transitions between three spore states: triggerable, triggered and
germinated. The observable changes begin with the spore’s entry into the germinated
199
state. Each observable change, or manifestation, has a characteristic lag time, t0, and a
characteristic rate of evolution controlled by a function.
7.4 Methods to increase culturability
7.4.1 Introduction
A central problem in the study of endospores in extreme environments is the lack of
reliable cultivation methods. Extreme environments are generally difficult to replicate in
the laboratory and more difficult to maintain in order to culture native extremophiles.
Only a tiny fraction of the organisms observed in environmental samples can be cultured
in the laboratory. The ability to revive these dormant lives in vitro as well as the viable-
but-not-culturable state is currently the biggest stumbling block in microbiology.
Although new genetic and fluorescence microscopy techniques have been developed to
complement culture-based techniques, cultivation still remains the most important and
fundamental method to assess endospore viability. Endospores are susceptible to be
neglected using these new techniques because they are usually non stainable and
exceptionally difficult to be lysed for DNA analysis due to their tough cell wall. The
recently developed endospore viability assays (EVA) are effective approaches to directly
assess the viable endospore population in an environmental sample. Improvement in
endospore culturing techniques will increase the fidelity of the EVA results. Extracting,
culturing and identifying these native soilborne endospores also provide insight into
understanding in situ endospore dormancy and the relation of their spatial or temporal
distribution with respect to past geological events as analogous models for exobiological
life exploration.

200
Endospores were independently discovered by Cohn (1876)60, Koch (1876)61,62,
and Tyndall (1877)63 as resting forms of life formed intracellularly in some genera such
as Bacillus and Clostridium. They demonstrate exceptional dormancy, resistance and
longevity conferred by their special chemical composition and ultrastructure. The genus
Bacillus is considered heterogeneous compared with other bacterial genera. This is
apparent from the variety of carbohydrate metabolism and from the DNA base pair
composition (33-60 mol% G+C). Bacteria such as B. subtilis or B. licheniformis are
robust, grow readily in most media, and can be easily isolated. Nevertheless, certain
Bacillus species are very difficult to culture. First of all, they tend to exist in very low
numbers in soils. They grow very slowly and sometimes in translucent colonies, which
will readily be overshadowed and swarmed by migrating motile colonies of other fast-
growing sporeforming species. Therefore, proper enrichment and isolation techniques are
crucial in recovering these rare sporeforming bacteria.
Enrichment is generally viewed as increasing the proportional numbers of a
particular type of organism in a sample by providing a selective environment for the
growth of the desired organism. Both physical and nutritional constraints can be used.
Enrichment seems to be a prerequisite for the isolation of hydrocarbon-utilizing Bacillus
since the great majority of species do not grow or grow only weakly on these substrates64.
Other carbon sources that have been used to isolate specific Bacillus types include agar,
chitin and various other polysaccharides. Nitrogen nutrition has also been exploited for
the enrichment of unusual bacilli. Urea-decomposing bacilli are common in soil.
There is a big reservoir of Bacillus species in the soil and various strains have
been isolated from the extremes of desert and Antarctica. Generally, soils of low organic
201
content have a restricted flora dominated by B. subtilis, B. licheniformis and B. cereus;
however, with increasing fertility, a wider range of species is encountered. It is advisable
to sample exotic environments when searching for bacteria with particular characteristics,
such as thermo- or pH tolerance, the frequency with which new species of Bacillus are
isolated from normal soils suggests that many more taxa remain to be discovered given
the correct enrichment and isolation condition.
Because of the aforementioned reasons, here we propose methodologies to
improve the general culturability of endospores in terms of both number and variety from
the soil habitat. Calcium dipicolinate (Ca-DPA) will be as a germinant during pre-
incubation, combination of induced germination and heat shock temperature to select for
slow-growing spore-forming species, optimization of heat shock treatment temperature
for spore-forming species sampled from different temperature extremes, and the use of a
high-throughput microtiter well technique to improve culturability of rare sporeforming
species.
7.4.2 Methods
7.4.2.1 Chemicals and media
The following chemicals, dipicolinic acid, picolinic acid and L-alanine were purchased
from Sigma (St. Louis, MO) and were used as received. Sodium hydroxide, calcium
hydroxide and calcium chloride were purchased from Baker. Calcium dipicolinate was
prepared by neutralizing calcium hydrogen and dipicolinate acid. Sodium dipicolinate
Tryptic soy agar (TSA) was used for most the spread plate counting.
202
7.4.2.2 Preparation of spore suspensions
Spores of Bacillus atrophaeus (ATCC 9372) spores were purchased from Raven
Biological Laboratories. Spores of B. subtilis (ATCC 27370) and B. licheniformis were
prepared as described previously. Spores of psychrotrophic B. longisporus and
thermophilic Geobacillus stearothermophilus were prepared as described before. The
spore batches were stored at 4°C for less than 6 months. Unless indicated otherwise, a
spore suspension in water, was heat activated at 50°C for 1 hour, centrifuged at
maximum speed and resuspended in water with 0.01% Tween-80 to prevent clumping
before use.
7.4.2.3 Preparation of soil samples
Soil samples were collected from JPL temperate soil, Mojave Desert arid soil, Atacama
Desert hyper-arid soil and cold permafrost. Microorganisms Soil extraction method used
was previously reported. The soil extracts were subjected to a heat treatment of different
temperatures for 15 minutes to screen for spore.
7.4.2.4 Germination
To 2 mL of spore suspension, 0.6 ml of 0.4 M CaCl2 solution was added. Germination
was initiated by the addition of 1 mL of 0.2 M DPA at 20°C. The final volume was 5 ml.
Germination was followed either by microscopic examination of stained spores in a phase
contrast microscope or by measuring the decrease in optical density at 625 nm. In most
cases, the germinant effect was assessed by spread plating onto TSA and incubated at the
optimal growth temperature.
203
7.4.2.5 Delayed germination
Environmental samples were exposed to L-alanine and Ca-DPA for 2 hours of
germination, followed by heat shock for 15 minutes. The samples were examined by
phase contrast microscopy to examine for the degree of phase bright to phase dark
transition as well as the residual phase bright bodies remaining.
7.4.2.6 24-well Bacillus spore enrichment
A 24-well microtiter plate method was developed to provide specific isolation medium
for maximum recovery of endospore-forming bacteria. The following media were all
minimal growth media. The 24 media consisted of (1) neutralized acid fertile soil extract
agar; (2) neutralized acid desert soil extract agar; (3) neutralized acid rhizosphere soil
extract agar; (4) 1/10 R2A adjusted to pH 3.0; (5) 1/10 R2A adjusted to pH 11.0; (6)
yeast extraction with biotin; (7) 10% NaCl; (8) lysozyme; (9) nalidixic acid; (10)
NH4SO4 and 5% urea; (11) novobiocin (25 µg mL-1); (12) Sporolactobacillus isolation
medium; (13) Sporosarcina halophila isolation medium and (14) Sporosarci naureae
isolation medium. Each of the respective chemical was added as the sole carbon and
nitrogen source in a minimal medium, namely (15) trimethylamine, (16) benzoate, (17)
nitrate, (18) citrate, (19) propionate, (20) arginine, (21) allantoin, (22) succinate, (23)
urea and (24) control. Once growth was observed, colonies were restreaked onto a more
nutrient-rich media for isolation.
204
S. halophila isolation medium consisted of 5.0 g of peptone, 3.0 g of meat extract, 30.0 g
of NaCl, 5.0 g of MgCl2, 15.0 g of agar in 1 L of water, with pH adjusted to 7.5. The soil
suspension was treated with ethanol, 50% (v/v) for 1 hour to kill vegetative bacterial cells.
After 3 days of incubation at 3°C, mainly pigmented (yellow, orange, or pink) colonies of
various sizes of Bacillus species will have developed. S. ureae isolation medium
consisted of 30.0 g of L-asparagine ·H2O, 3.4 g of KCl, 0.25 g of K2HPO4, 0.2 g of
(NH)2SO4, 0.05 g of MgSO4 · 7H2O, 2.5 mg of FeSO4 · 7H2O, 0.25 mg of MnCl2 · 4H2O,
1 mg of biotin, 5 mg of L-cysteine in 1 L of water, adjusted to pH 8.7 with1 M NaOH
and supplemented with NaCl to a final concentration of 50 mM Na+. Sporolactobacillus
isolation medium consisted of 10.0 g of glucose, 10.0 g of polypeptone, 10.0 of yeast
extract, 0.027 g of sodium citrate, 0.5 g of KH2PO4, 0.5 g of K2HPO4, 0.3 g of MgSO4 ·
7H2O, 0.01 g of NaCl, 10 mg of MnSO4 · 5H2O, 1.0 mg of CuSO4 · 5H2O, 1.0 mg of
CoC2 · 6H2O, 1.0 mg of FeSO4 · 7H2O, 100 mL soil extract and 900 distilled water. Soil
extract was prepared by autoclaving 100 g of soil mixed with 200 mL distilled water for
20 min at 130°C. The mixture was centrifuged to obtain a clear supernatant.
Plate counts were determined by spread plating on TSA preceded by heat shock
followed and germinant incubation. Total spore concentrations were determined using a
Petroff-Hausser hemocytometer and CFU concentrations were determined using TSA
spread plating in triplicate measurements.
7.4.3 Results
Figure 7.8 shows that endospores only responded to calcium dipicolinate and L-alanine
as germination potentiator to increase the final colony forming units by more than 2 times.

205
This method works for the cultivation of both laboratory and environmental endospores
with varying degrees of improvement. For instance, the percent germination of B. subtilis
168 increased almost null to 40% when pretreated with germination incubation. No
significant difference was observed in the case of B. cereus endospores.
Differences in germination rate can be exploited to provide additional selection.
Spores of many of the common species such as B. subtilis and B. cereus germinate
rapidly in simple media but spores of the less vigorous species do not. By incubating a
heat-treated sample in a suitable medium for several hours and repeating the heat
treatment, B. subtilis and similar organisms can be destroyed and spores of B. macerans,
B. polymyxa, and other (rarer species) often remain. The use of selective agents to inhibit
germination offers a powerful approach to the isolation of novel Bacillus strains.
Experiments will be carried out this week.
The kinetics of L-alanine-induced and CaDPA-induced germination differs
significantly. An 8 to 10 min lag and a slower germination rate are typical for CaDPA-
induced germination. In L-alanine-induced germination, the lag period is only 1 to 2 min,
followed by a germination rate about five times faster than obtained with CaDPA. The
effect of prior heat-shock treatment on the rate of germination also depends on the
germination agent employed. L-alanine-induced65,66 and L-cysteine induced germination
are heat-shock dependent. On the other hand, the rate of germination induced by CaDPA
is unaffected by heat shock67-69.
206
7.4.4 Discussion
It is an axiom in microbial ecology that since no single medium is able to support the
growth of (even the known) spore-forming bacteria, there is, accordingly, no such thing
as a total (viable) plate count. Thus, the development of selective media increases our
insight into the populations of spore-forming bacteria present in a particular habitat.
Useful selective media may be used on increased comprehension of the possession novel
metabolic traits. Physical traits can also be used as for selection of sporangial subgroup II
Bacillus species by pasteurization at 100°C rather than at 80°C, and with B.
xerothermodurans by longer treatment at higher holding temperatures70 .
Dormancy is the key to endospore’s resistance to many agents, including heat,
radiation, chemicals, and their survival over long period of time. Some endospores do not
respond to germinants unless pretreated with some activating agents, such as sublethal
heat, pressure, and chemicals. Since germination is upstream to outgrowth, multiplication
and colony formation, enhancing the germinability is analogous to increasing the
culturable counts. Germination can be triggered by physiological agents with nutrients
including amino acids, purine nucleosides and sugars and these interact in a species and
stereospecific manner with one of the number of receptors located in the spore's inner
membrane71-73.
A wide geographical distribution of spore-forming bacteria reflects their diverse
nutritional requirements74-76. They can thrive in the soil habitat, from the cold permafrost
to dry desert soils pushing forward the boundary conditions of survival. No single
organism is known to possess the spectrum of life styles encompassed by the
sporeformers. However, some of the organisms regarded as “more common” in terms of

207
distribution are those which grow relatively rapidly on complex laboratory media at near-
neutral pH containing mixtures of sugars, nitrogenous materials, vitamins, etc. If soil
preparations are plated and incubated, under both anaerobic and aerobic conditions, there
is every reason to expect that the bacteria represented by organisms such as B. fastidosus,
B. pasteurii, S. ureae, D. nigrificans or C. acidiurici will not grow and hence will not be
regarded as present. This study aims to recover these hard-to-culture bacteria.
One explanation for the lag period during CaDPA-induced germination is that this
period is required for enzymatic reactions involved in the breaking of dormancy. Such
reactions maybe part of an activation stage common to many dormant systems, and are
characterized by increased metabolic activity and decreased dependence on exogenous
germinating stimulants. Conventional method involves a heat shock treatment of 80°C
for 15 minutes or soaking in ethanol (50%) for 30 minutes to screen for soil-borne
endospores. These prior treatments are essential because both endospores and vegetative
form the same colonies on growth media. We investigated the optimal heat shock
temperature with regard to soils samples collected from different temperature origins.
The samples were subsequently subjected to a sublethal heat treatment at 50°C,
known as heat activation, and then plated onto heterotrophic medium. The first to note
the direct activating effect of heat on spores were Curran and Evan77, who noticed an
increase in the colony count of milk after heat treatment. “A mild heating of the spores of
mesophilic aerobes has been shown to hasten their subsequent germination“. They also
found that this sublethal heating influences the number of spores which will subsequently
germinate and form colonies.
208
7.5 References
1. Abyzov, S.S. et al, in Space Life Sciences: Search for Signatures of Life, and Space
Flight Environmental Effects on the Nervous System (2004), Vol. 33, pp. 1222-1230. 2. Abyzov, S.S. et al. Antarctic ice sheet as an object for solving some methodological
problems of exobiology. Advances in Space Research 23, 371-376 (1999). 3. Christner, B.C., Mosley-Thompson, E., Thompson, L.G., and Reeve, J.N. Bacterial
recovery from ancient glacial ice. Environmental Microbiology 5, 433-436 (2003). 4. Castello, J.D. et al. Detection of tomato mosaic tobamovirus RNA in ancient glacial ice.
Polar Biology 22, 207-212 (1999). 5. Larkin, J.M. and Stokes, J.L. Taxonomy of psychrophilic strains of Bacillus. Journal of
Bacteriology 94, 889-895 (1967). 6. Larkin, J.M. and Stokes, J.L. Isolation of psychrophilic species of Bacillus. Journal of
Bacteriology 91, 1667 (1966). 7. Morita, R.Y. Psychrophilic bacteria. Bacteriological Reviews 39, 144-167 (1975). 8. Russell, N.J., in Extremophiles (Eolss Publishers, Oxford, UK., 2003). 9. Branda, S.S., Gonzalez-Pastor, J.E., Ben-Yehuda, S., Losick, R., and Kolter, R. Fruiting
body formation by Bacillus subtilis. Proceedings of the National Academy of Sciences of the United States of America 98, 11621-11626 (2001).
10. Cooper, A., Drummond, A.J., and Willerslev, E. Ancient DNA: Would the real neandertal please stand up? Current Biology 14, R431-R433 (2004).
11. Fux, C.A., Costerton, J.W., Stewart, P.S., and Stoodley, P. Survival strategies of infectious biofilms. Trends in Microbiology 13, 34-40 (2005).
12. Gould, G.W. and Hurst, A., The Bacterial Spore. (Academic Press, New York, 1969). 13. Rotman, Y., Fields, M. L. Structure of spores of rough and smooth variants of Bacillus
stearothermophilus with special reference to their heat resistance. Journal of Food Science 31, 437 (1966).
14. Nicholson, W. and Setlow, P., in Molecular Biology Methods for Bacillus, edited by S. M. Cutting (John Wiley and Sons, Sussex, England, 1990), pp. 391-450.
15. Zobell, C.E. Action of microorganisms on hydrocarbons. Bacteriological Reviews 10, 1 (1946).
16. Church, B.D., Halvorson, H., and Halvorson, H.O. Studies on spore germination: Its independence from alanine racemase activity. Journal of Bacteriology 68, 393-399 (1954).
17. Buono, F., Testa, R., and Lundgren, D.G. Physiology of growth and sporulation in Bacillus cereus I. Effect of glutamic and other amino acids. Journal of Bacteriology 91, 2291 (1966).
18. Nicholson, W.L. and Law, J.F. Method for purification of bacterial endospores from soils: UV resistance of natural Sonoran desert soil populations of Bacillus spp. with reference to B-subtilis strain 168. Journal of Microbiological Methods 35, 13-21 (1999).
19. Schaeffer, A.B. and Fulton, M.D. A simplified method of staining endospores. Science 77, 194-194 (1933).
20. Shafaat, H.S. and Ponce, A. Applications of a rapid endospore viability assay for monitoring UV inactivation and characterizing Arctic ice cores. Applied and Environmental Microbiology 72, 6808-6814 (2006).
21. Janssen, F.W., Lund, A.J., and Anderson, L.E. Colorimetric assay for dipicolinic acid in bacterial spores. Science 127, 26-27 (1958).

209
22. Rosenberg, M., Gutnick, D., and Rosenberg, E. Adherence of bacteria to hydrocarbons: A simple method for measuring cell-surface hydrophobicity. FEMS Microbiology Letters 9, 29-33 (1980).
23. Tisa, L.S., Koshikawa, T., and Gerhardt, P. Wet and dry bacterial spore densities determined by buoyant sedimentation. Applied and Environmental Microbiology 43, 1307 (1982).
24. Rickwood, D., Ford, T., and Graham, J. Nycodenz: A new nonionic iodinated gradient medium. Analytical Biochemistry 123, 23-31 (1982).
25. Lindsay, J.A. and Murrell, W.G. Changes in density of DNA after interaction with dipicolinic acid and its possible role in spore heat resistance. Current Microbiology 12, 329-333 (1985).
26. Vary, J.C. Germination of Bacillus megaterium spores after various extraction procedures. Journal of Bacteriology 116, 797-802 (1973).
27. Fitz-James, P. and Young, E., in The Bacterial Spore, edited by G. W. Gould and A. Hurst (Academic Press, London, England, 1969), Vol. 1, pp. 39-72.
28. Cooney, P.H., Whiteman, P.F., and Freese, E. Media dependence of commitment in Bacillus subtilis. Journal of Bacteriology 129, 901 (1977).
29. Foerster, H.F. and Foster, J.W. Endotrophic calcium strontium and barium spores of Bacillus megaterium and Bacillus cereus. Journal of Bacteriology 91, 1333-1345 (1966).
30. Setlow, B., Cowan, A.E., and Setlow, P. Germination of spores of Bacillus subtilis with dodecylamine. Journal of Applied Microbiology 95, 637-648 (2003).
31. Koshikawa, T. et al. Surface hydrophobicity of spores of Bacillus spp. Journal of General Microbiology 135, 2717-2722 (1989).
32. Wiencek, K.M., Klapes, N.A., and Foegeding, P.M. Hydrophobicity of Bacillus and Clostridium spores. Applied and Environmental Microbiology 56, 2600-2605 (1990).
33. Wynn-Williams, D.D., in The Ecology of Cyanobacteria (Kluwer Academic Press, Dordrecht, The Netherlands, 2000), pp. 341-346.
34. Grelet, N. Growth limitation and sporulation. Journal of Applied Bacteriology 20, 315 (1957).
35. Schaeffer, P. Sporulation and the production of antibiotics, exoenzymes, and exotonins. Bacteriological Reviews 33, 48-71 (1969).
36. Vinter, V. and Slepecky, R.A. Direct transition of outgrowing bacterial spores to new sporangia without intermediate cell division. Journal of Bacteriology 90, 803-807 (1965).
37. Bernlohr, R.W. and Leitzmann, C., in The Bacterial Spore, edited by G. W. Gould and A. Hurst (Academic Press, London, England, 1969), Vol. 1, pp. 183-213.
38. Halvorson, H., in The Bacteria: A Treatise on Structure and Function (Academic Press, 1985).
39. Roth, N.G., Lively, D.H., and Hodge, H.M. Influence of oxygen uptake and age of culture on sporulation of Bacillus anthracis and Bacillus globigii. Journal of Bacteriology 69, 455 (1955).
40. Slepecky, R.A. and Law, J.H. Synthesis and degradation of poly-β-hydroxybutyric acid in connection with sporulation of Bacillus megaterium. Journal of Bacteriology 82, 37-42 (1961).
41. Atrih, A. and Foster, S.J. Analysis of the role of bacterial endospore cortex structure in resistance properties and demonstration of its conservation amongst species. Journal of Applied Microbiology 91, 364-372 (2001).
42. Raso, J., Palop, A., Pagan, R., and Condon, S. Inactivation of Bacillus subtilis spores by combining ultrasonic waves under pressure and mild heat treatment. Journal of Applied Microbiology 85, 849-854 (1998).
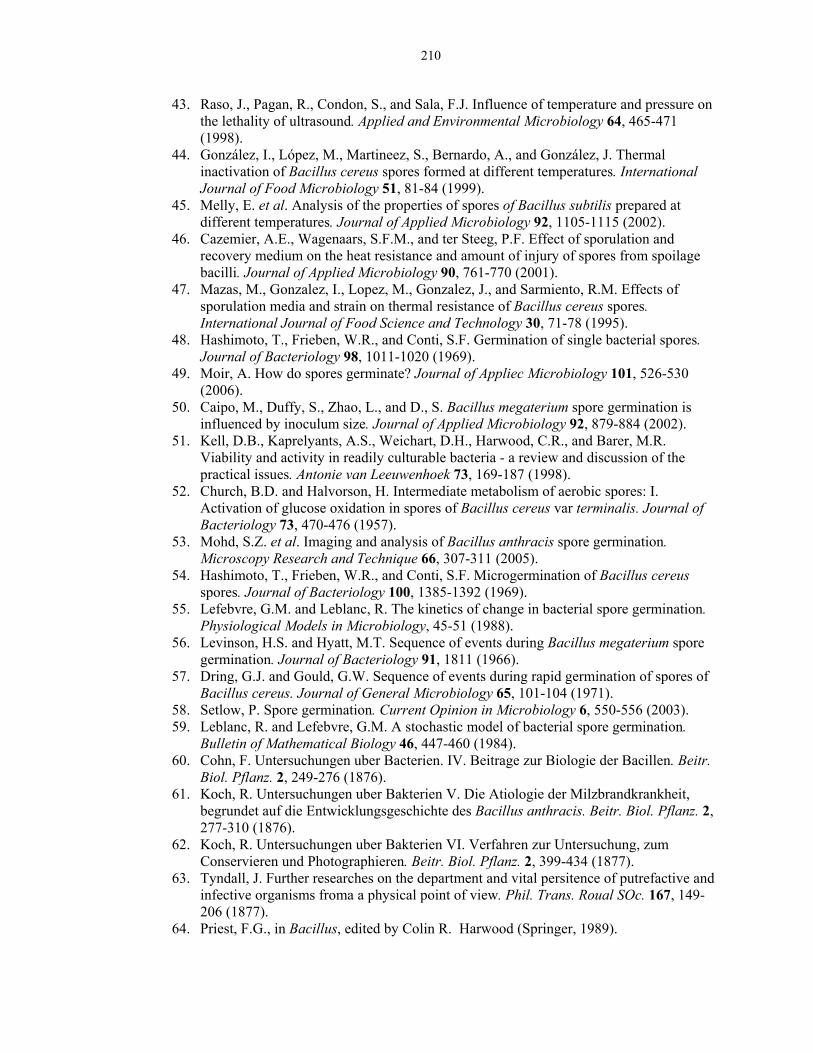
210
43. Raso, J., Pagan, R., Condon, S., and Sala, F.J. Influence of temperature and pressure on the lethality of ultrasound. Applied and Environmental Microbiology 64, 465-471 (1998).
44. González, I., López, M., Martineez, S., Bernardo, A., and González, J. Thermal inactivation of Bacillus cereus spores formed at different temperatures. International Journal of Food Microbiology 51, 81-84 (1999).
45. Melly, E. et al. Analysis of the properties of spores of Bacillus subtilis prepared at different temperatures. Journal of Applied Microbiology 92, 1105-1115 (2002).
46. Cazemier, A.E., Wagenaars, S.F.M., and ter Steeg, P.F. Effect of sporulation and recovery medium on the heat resistance and amount of injury of spores from spoilage bacilli. Journal of Applied Microbiology 90, 761-770 (2001).
47. Mazas, M., Gonzalez, I., Lopez, M., Gonzalez, J., and Sarmiento, R.M. Effects of sporulation media and strain on thermal resistance of Bacillus cereus spores. International Journal of Food Science and Technology 30, 71-78 (1995).
48. Hashimoto, T., Frieben, W.R., and Conti, S.F. Germination of single bacterial spores. Journal of Bacteriology 98, 1011-1020 (1969).
49. Moir, A. How do spores germinate? Journal of Appliec Microbiology 101, 526-530 (2006).
50. Caipo, M., Duffy, S., Zhao, L., and D., S. Bacillus megaterium spore germination is influenced by inoculum size. Journal of Applied Microbiology 92, 879-884 (2002).
51. Kell, D.B., Kaprelyants, A.S., Weichart, D.H., Harwood, C.R., and Barer, M.R. Viability and activity in readily culturable bacteria - a review and discussion of the practical issues. Antonie van Leeuwenhoek 73, 169-187 (1998).
52. Church, B.D. and Halvorson, H. Intermediate metabolism of aerobic spores: I. Activation of glucose oxidation in spores of Bacillus cereus var terminalis. Journal of Bacteriology 73, 470-476 (1957).
53. Mohd, S.Z. et al. Imaging and analysis of Bacillus anthracis spore germination. Microscopy Research and Technique 66, 307-311 (2005).
54. Hashimoto, T., Frieben, W.R., and Conti, S.F. Microgermination of Bacillus cereus spores. Journal of Bacteriology 100, 1385-1392 (1969).
55. Lefebvre, G.M. and Leblanc, R. The kinetics of change in bacterial spore germination. Physiological Models in Microbiology, 45-51 (1988).
56. Levinson, H.S. and Hyatt, M.T. Sequence of events during Bacillus megaterium spore germination. Journal of Bacteriology 91, 1811 (1966).
57. Dring, G.J. and Gould, G.W. Sequence of events during rapid germination of spores of Bacillus cereus. Journal of General Microbiology 65, 101-104 (1971).
58. Setlow, P. Spore germination. Current Opinion in Microbiology 6, 550-556 (2003). 59. Leblanc, R. and Lefebvre, G.M. A stochastic model of bacterial spore germination.
Bulletin of Mathematical Biology 46, 447-460 (1984). 60. Cohn, F. Untersuchungen uber Bacterien. IV. Beitrage zur Biologie der Bacillen. Beitr.
Biol. Pflanz. 2, 249-276 (1876). 61. Koch, R. Untersuchungen uber Bakterien V. Die Atiologie der Milzbrandkrankheit,
begrundet auf die Entwicklungsgeschichte des Bacillus anthracis. Beitr. Biol. Pflanz. 2, 277-310 (1876).
62. Koch, R. Untersuchungen uber Bakterien VI. Verfahren zur Untersuchung, zum Conservieren und Photographieren. Beitr. Biol. Pflanz. 2, 399-434 (1877).
63. Tyndall, J. Further researches on the department and vital persitence of putrefactive and infective organisms froma a physical point of view. Phil. Trans. Roual SOc. 167, 149-206 (1877).
64. Priest, F.G., in Bacillus, edited by Colin R. Harwood (Springer, 1989).
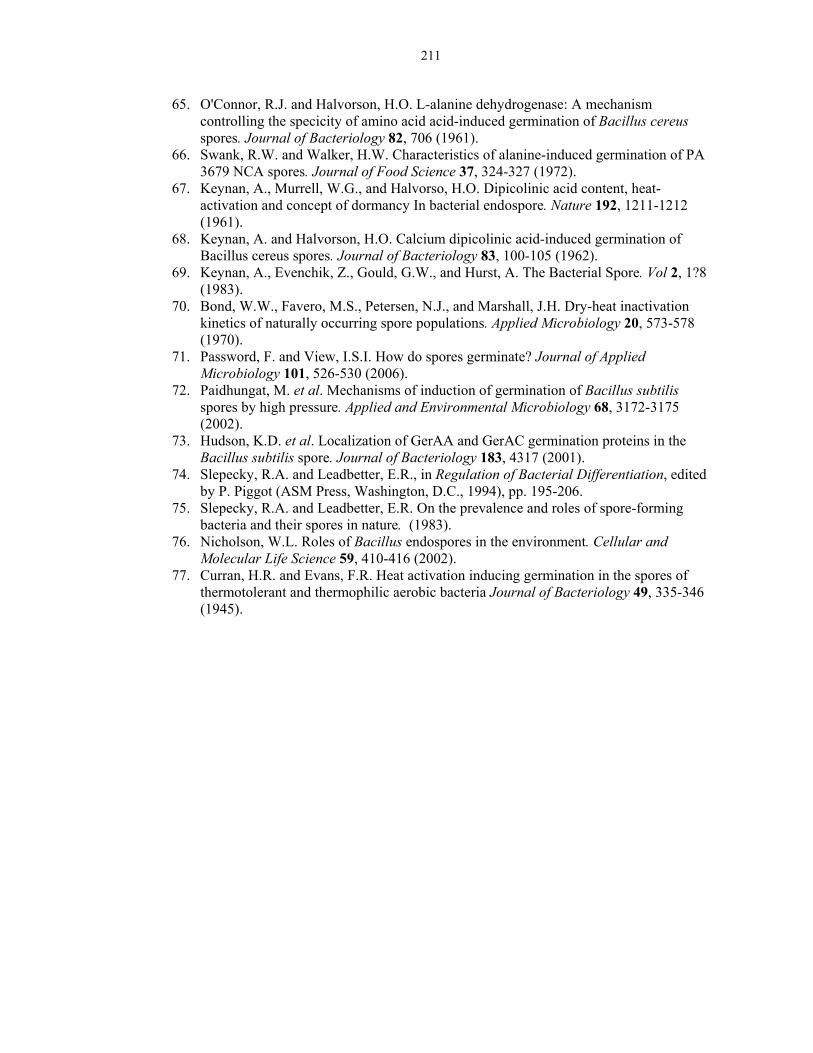
211
65. O'Connor, R.J. and Halvorson, H.O. L-alanine dehydrogenase: A mechanism controlling the specicity of amino acid acid-induced germination of Bacillus cereus spores. Journal of Bacteriology 82, 706 (1961).
66. Swank, R.W. and Walker, H.W. Characteristics of alanine-induced germination of PA 3679 NCA spores. Journal of Food Science 37, 324-327 (1972).
67. Keynan, A., Murrell, W.G., and Halvorso, H.O. Dipicolinic acid content, heat-activation and concept of dormancy In bacterial endospore. Nature 192, 1211-1212 (1961).
68. Keynan, A. and Halvorson, H.O. Calcium dipicolinic acid-induced germination of Bacillus cereus spores. Journal of Bacteriology 83, 100-105 (1962).
69. Keynan, A., Evenchik, Z., Gould, G.W., and Hurst, A. The Bacterial Spore. Vol 2, 1?8 (1983).
70. Bond, W.W., Favero, M.S., Petersen, N.J., and Marshall, J.H. Dry-heat inactivation kinetics of naturally occurring spore populations. Applied Microbiology 20, 573-578 (1970).
71. Password, F. and View, I.S.I. How do spores germinate? Journal of Applied Microbiology 101, 526-530 (2006).
72. Paidhungat, M. et al. Mechanisms of induction of germination of Bacillus subtilis spores by high pressure. Applied and Environmental Microbiology 68, 3172-3175 (2002).
73. Hudson, K.D. et al. Localization of GerAA and GerAC germination proteins in the Bacillus subtilis spore. Journal of Bacteriology 183, 4317 (2001).
74. Slepecky, R.A. and Leadbetter, E.R., in Regulation of Bacterial Differentiation, edited by P. Piggot (ASM Press, Washington, D.C., 1994), pp. 195-206.
75. Slepecky, R.A. and Leadbetter, E.R. On the prevalence and roles of spore-forming bacteria and their spores in nature. (1983).
76. Nicholson, W.L. Roles of Bacillus endospores in the environment. Cellular and Molecular Life Science 59, 410-416 (2002).
77. Curran, H.R. and Evans, F.R. Heat activation inducing germination in the spores of thermotolerant and thermophilic aerobic bacteria Journal of Bacteriology 49, 335-346 (1945).
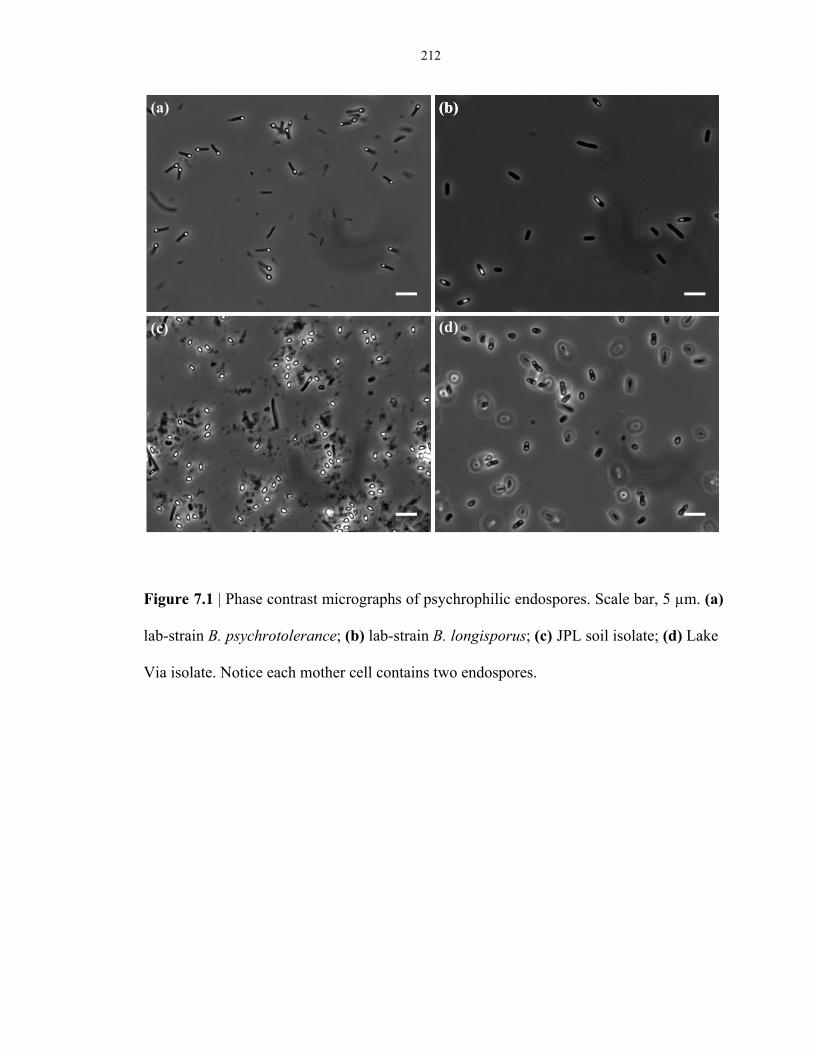
212
Figure 7.1 | Phase contrast micrographs of psychrophilic endospores. Scale bar, 5 µm. (a)
lab-strain B. psychrotolerance; (b) lab-strain B. longisporus; (c) JPL soil isolate; (d) Lake
Via isolate. Notice each mother cell contains two endospores.
(a) (b)
(c)
(b)
(d)

213
Figure 7.2 | Germination study of mesophilic endospores and psychrophilic endospores.
The spores were germinated using 50 mM L-alanine without heat activation. The degree
of germination was monitored by the release of DPA measured with a fluorimeter using
the Tb-DPA luminescence assay. Plots represent different germination temperatures.
Color designation: purple: 4°C, blue: 12°C, green: 22°C, orange: 30°C, red: 37°C. (a)
Mesophilic B. atrophaeus endospores germinated fastest at 37°C.; (b) psychrophilic B.
longisporus germinated fastest at 22°C.
(a) (b)
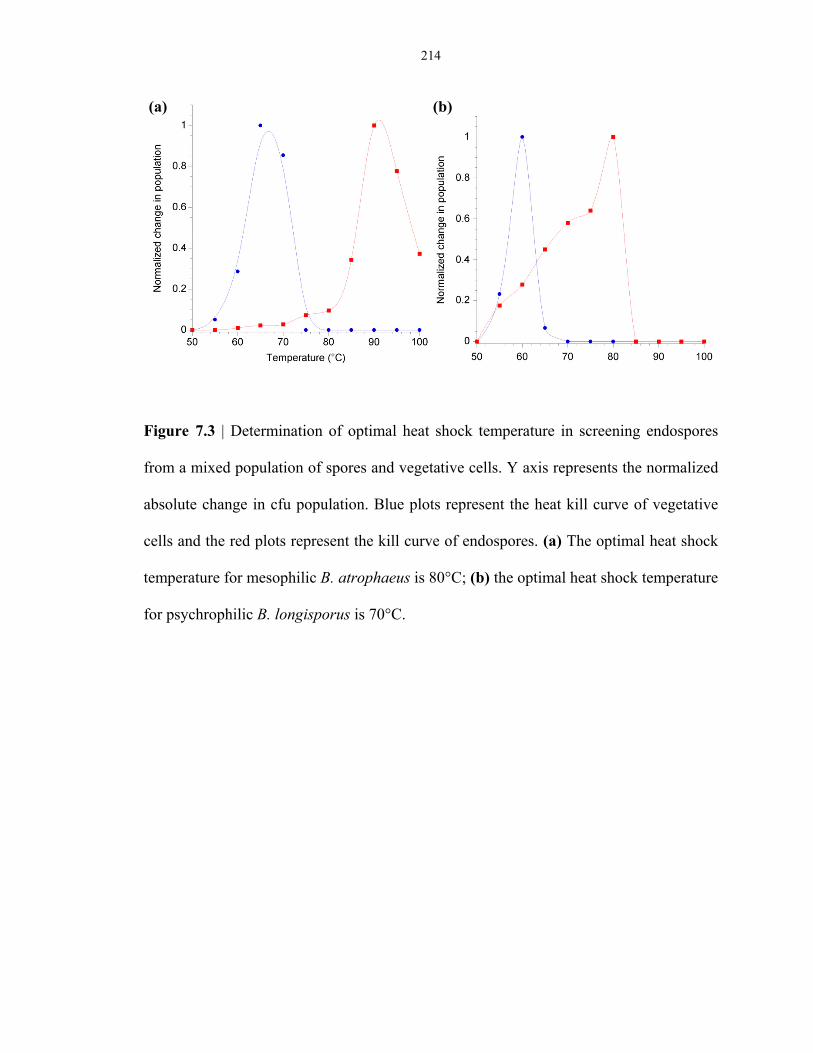
214
Figure 7.3 | Determination of optimal heat shock temperature in screening endospores
from a mixed population of spores and vegetative cells. Y axis represents the normalized
absolute change in cfu population. Blue plots represent the heat kill curve of vegetative
cells and the red plots represent the kill curve of endospores. (a) The optimal heat shock
temperature for mesophilic B. atrophaeus is 80°C; (b) the optimal heat shock temperature
for psychrophilic B. longisporus is 70°C.
(a) (b)
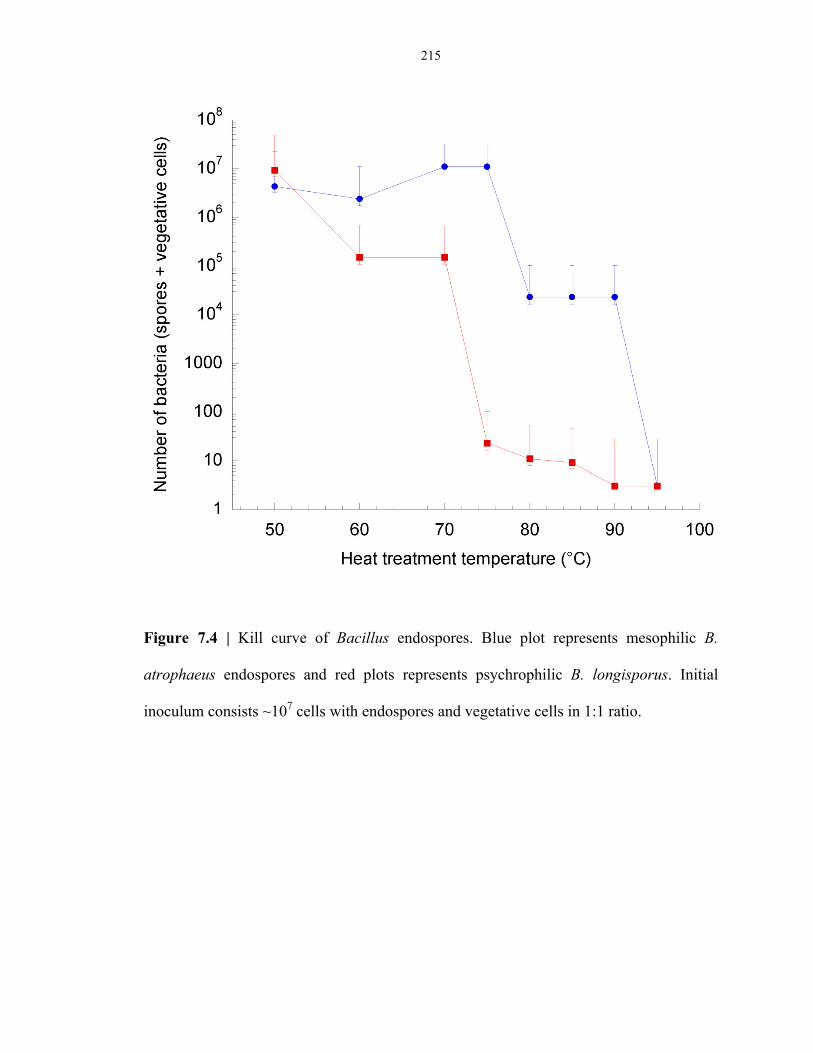
215
Figure 7.4 | Kill curve of Bacillus endospores. Blue plot represents mesophilic B.
atrophaeus endospores and red plots represents psychrophilic B. longisporus. Initial
inoculum consists ~107 cells with endospores and vegetative cells in 1:1 ratio.
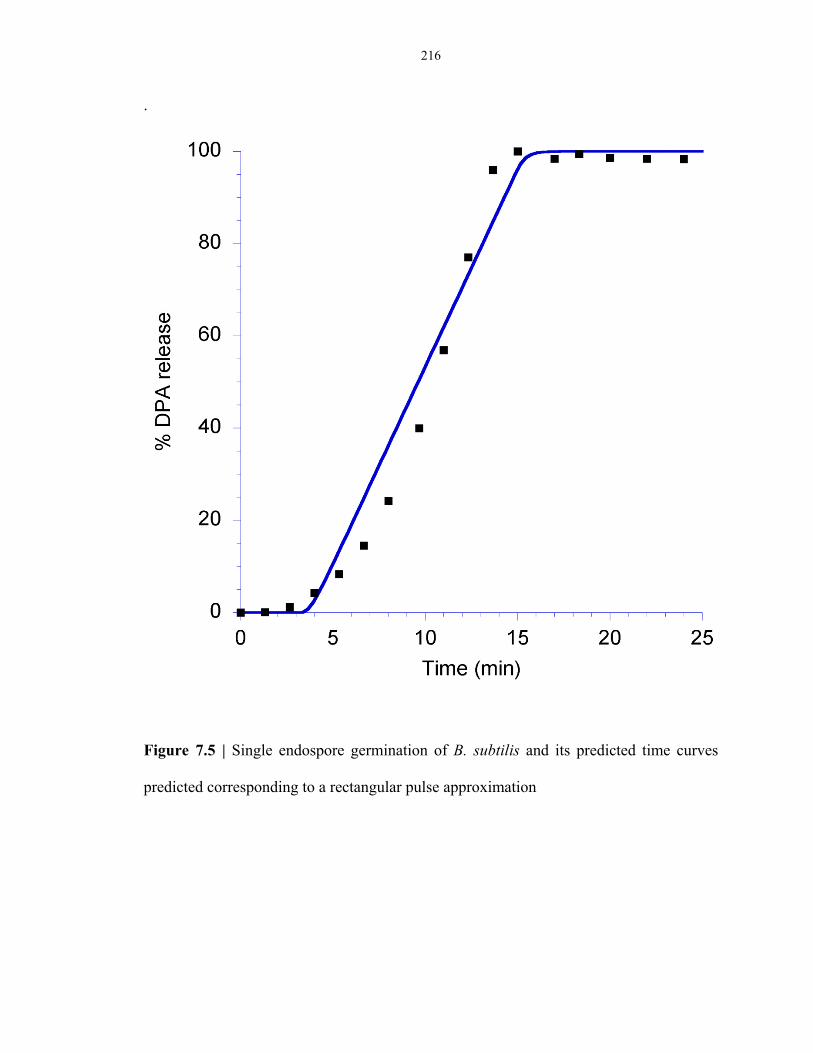
216
.
Figure 7.5 | Single endospore germination of B. subtilis and its predicted time curves
predicted corresponding to a rectangular pulse approximation
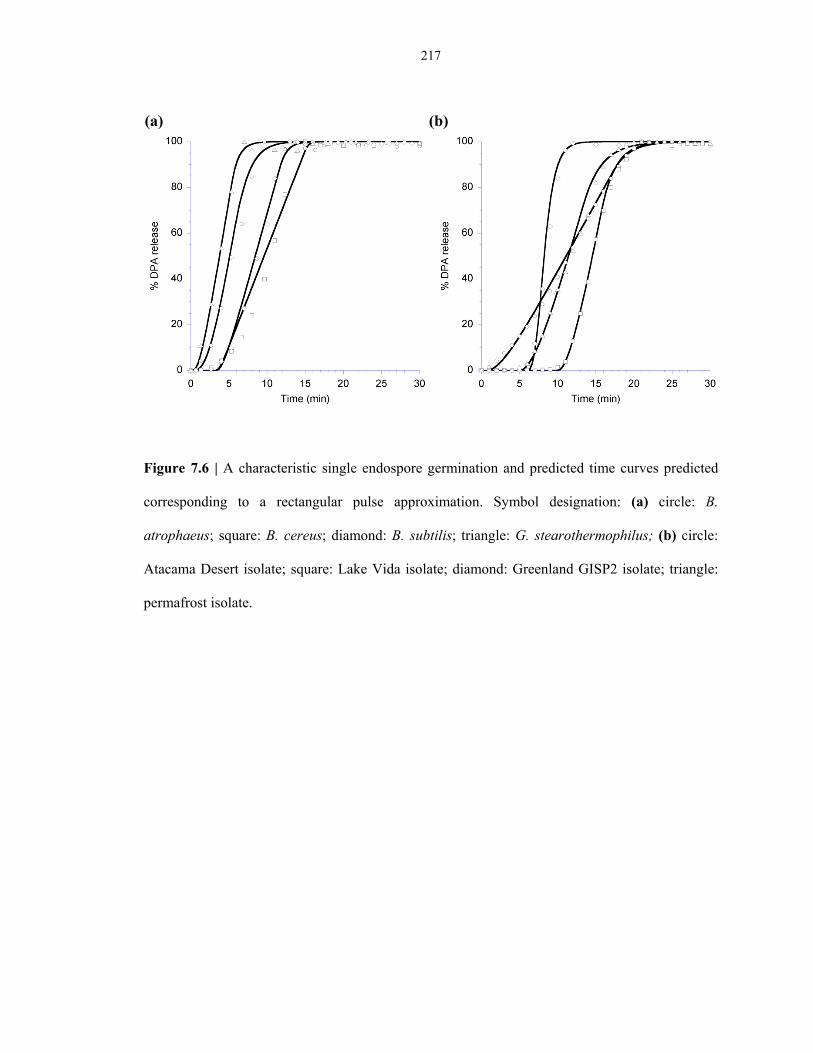
217
Figure 7.6 | A characteristic single endospore germination and predicted time curves predicted
corresponding to a rectangular pulse approximation. Symbol designation: (a) circle: B.
atrophaeus; square: B. cereus; diamond: B. subtilis; triangle: G. stearothermophilus; (b) circle:
Atacama Desert isolate; square: Lake Vida isolate; diamond: Greenland GISP2 isolate; triangle:
permafrost isolate.
(a) (b)

218
Figure 7.7 | (a) Comparison of a stochastic model derived from microgermination
kinetics (blue) and measured macrogermination kinetics of B. atrophaeus. (b) Correlation
of the number of spores with germination time. 100 data was obtained using µEVA while
the rest of the data are obtained using spectroEVA. (c) The plot with circle points
represent the τ distribution and the plot with rectangular points represents the microlag
distribution of B. atrophaeus endospores.
(a) (b) (c)
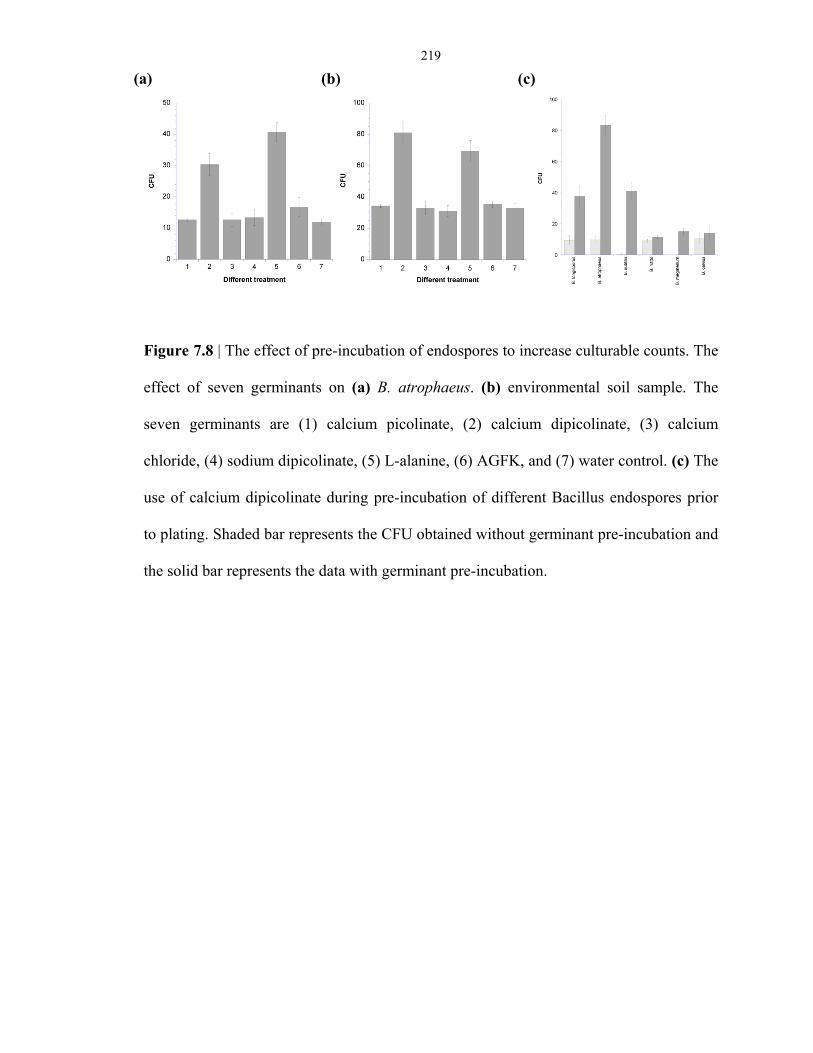
219
Figure 7.8 | The effect of pre-incubation of endospores to increase culturable counts. The
effect of seven germinants on (a) B. atrophaeus. (b) environmental soil sample. The
seven germinants are (1) calcium picolinate, (2) calcium dipicolinate, (3) calcium
chloride, (4) sodium dipicolinate, (5) L-alanine, (6) AGFK, and (7) water control. (c) The
use of calcium dipicolinate during pre-incubation of different Bacillus endospores prior
to plating. Shaded bar represents the CFU obtained without germinant pre-incubation and
the solid bar represents the data with germinant pre-incubation.
(a) (b) (c)
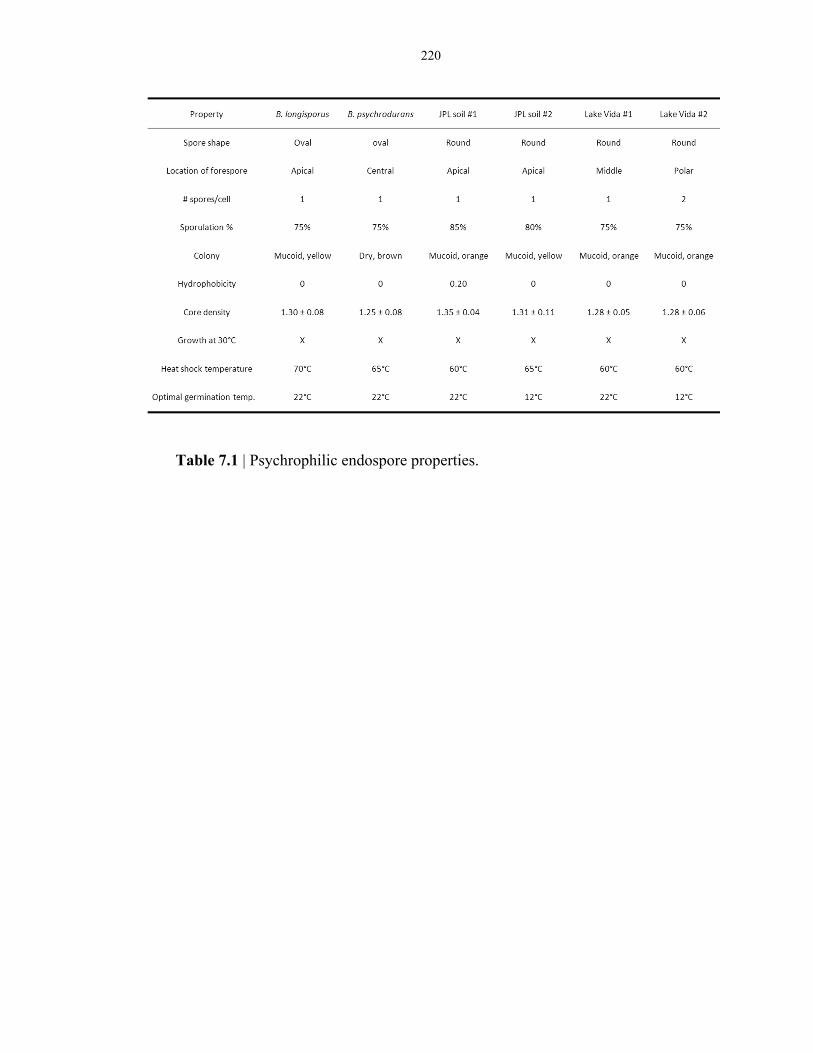
220
Table 7.1 | Psychrophilic endospore properties.
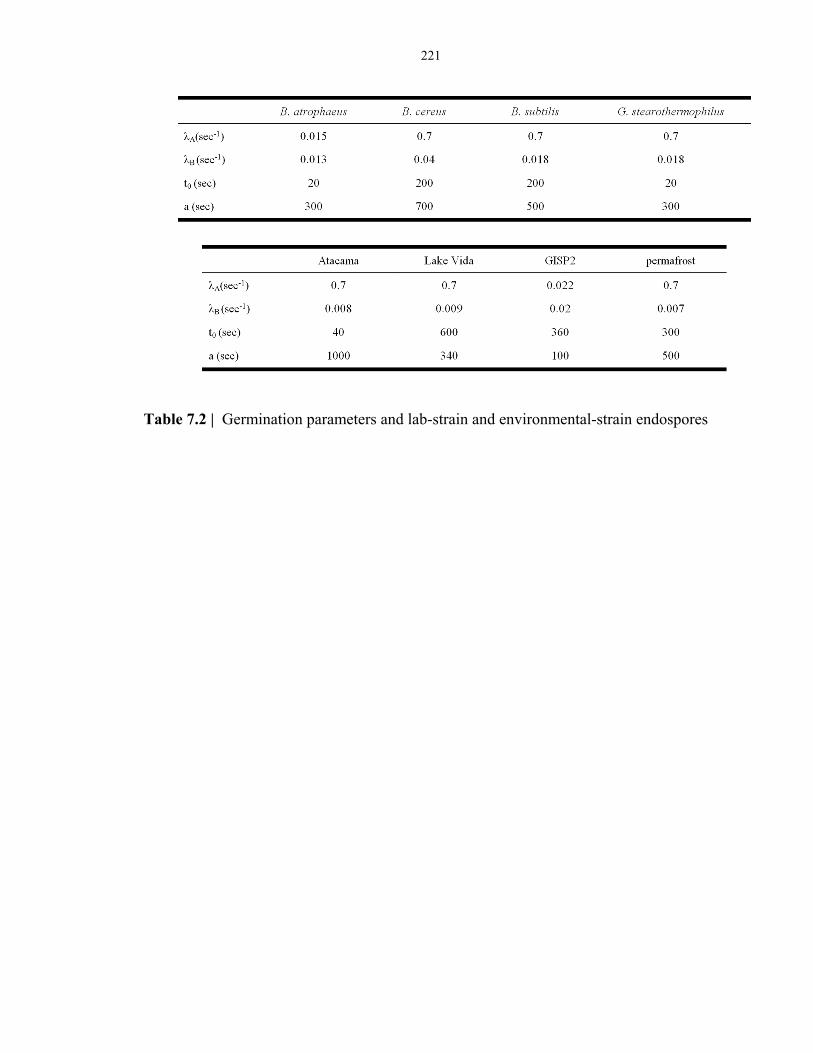
221
Table 7.2 | Germination parameters and lab-strain and environmental-strain endospores

222
CHAPTER 8: ENDOSPORES IN COLD BIOSPHERE
8.1 Abstract
Bacterial endospores entombed in polar ices, suspended in frozen lakes and
embedded in permafrost present an opportunity to investigate the most durable form
of life in the ideal media for maintaining long-term viability. However, little is
known about the bacterial spore distribution and viability in these frigid biospheres.
We have determined the concentration of endospores capable of germination in a
depth transect of Greenland ice core, corresponding to an ages from 295 to 110,000
years, and in Antarctic Lake Vida using two complementary endospore viability
assays (EVA). They are based on bulk spectroscopic analysis (i.e., spectroEVA),
and direct microscopic enumeration (i.e., µEVA). Both assays detect dipicolinic
acid (DPA) release during L-alanine induced germination via terbium ion
(Tb3+)-DPA luminescence. In addition, DNA analysis and culture-based methods
were conduced to characterize the microbial diversity. Anaerobic culturability was
up to 11 cfu mL-1 of melted ice after 6 months of incubation at room temperature on
solid media. Bacillus spore-forming species have been isolated in the brine water
from Lake Vida. We hypothesize the longevity of life based on extrapolation of our
exponential decay trend of endospores viability along a depth profile of the

223
Greenland ice cores. Studying these extreme polar habitats on Earth gleans
invaluable information on the search for extinct or extant life on icy biospheres such
as Mars and Europa.
8.2 Introduction
Approximately 75% of Earth’s biosphere is cold and covered by oceans at
temperatures below 5°C1. More than 70% of Earth’s freshwater occurs as ice and a
large portion of the soil ecosystem exists as permafrost. These permanently frigid
habitats are unique repositories of microbes frozen at various points in the geologic
past. A diversity of viable microorganisms, including fungi, bacteria and archaea have
been isolated from glacial ice up to 400,000 years old and permafrost up to 3 million
years old, originating from many geographical locales2-10. Formation of the
remarkably resistant and dormant endospores in genera such as Bacillus, Clostridium,
and Sporosarcina is observed as a response to nutrient-poor and cold environmental
conditions. Research on endospores as the most resistant life form in these
permanently cold environments provides insight into how microbial life endured the
ice ages during Paleoproterozoic and Neoproterozoic11, and the validity of the
Snowball Earth Hypothesis. This is synergistic with the search for past or present life
on the polar regions of Mars, Europa and the moons of Jupiter and Saturn12-17.
224
The extent to which organisms can survive extended periods of metabolic
inactivity in ice cores is one of the key questions in the exobiological study of life in
extreme environments. Viable bacteria have been cultured from 110,000-year-old
Greenland ice cores, but the relationship between the age of the bacteria and the age
of the sediment remains controversial. In this study, we analyze the germination
property of endospores embedded in GISP2 ice core samples collected from several
sites in Greenland. We have shown that even during long exposures to low
temperatures (-10°C to -15°C), the bacterial cells in permafrost are not completely
dormant, but continue to metabolize and at least partially control the extent of amino
acid racemization.
Endospores (i.e., bacterial spores) are dormant structures formed by Bacillus,
Clostridium, and several other genera in the Firmicutes phylum18 that are highly
resistant to chemical, physical, and radiation sterilization processes19. Their
structure is highly unique and very different from the structure of normal vegetative
bacterial cells to survive extended periods of adverse environments. Because of their
metabolic dormancy, bacterial spores do not require any nutrients or energy sources
to persist20. In fact, Bacillus subtilis spores have survived for six years in space
while exposed to high vacuum, temperature extremes, and intense solar and galactic
radiation21. This has led to the suggestion that endospores are the most likely to
225
survive an interplanetary lithopanspermic journey19,22-24. If endospore formers were
present in an early warm and wet Martian environment, they may currently be
surviving in the subsurface ice/permafrost. Certain extreme environments on Earth
are considered close approximations to those found on Mars or Europa. Antarctic
ice sheets and underground lakes, for example, have been treated as models for
these planetary systems25,26.
Endospores exhibit remarkable longevity, with reports ranging from
thousands19,23,27-29 to one quarter of a billion years30,31, although it is difficult to rule
out contamination in these most ancient samples32. The extent to which endospores
can survive extended periods of metabolic inactivity in ice cores, frozen brine and
permafrost is one of the key questions in the exobiological study of life in extreme
environments. Ice cores, as an environment with low and more or less constant
temperature, is the region where remnants of life or even dormant forms of life
would be preserved for the longest time. Viable bacteria have been cultured from
110,000-year-old Greenland ice cores, but the relationship between the age of the
bacteria and the age of the sediment remains controversial. The transition from a
water-rich past to the present Mars implies that endospores might have undergone a
terminal hyper-saline frozen niche that resembled the Lake Vida habitat.
Considering that ice is an excellent storage medium for preserving endospore
226
viability, we are interested in answering the overarching questions—how well can
the most durable form of life (i.e., endospores) survive in an extreme medium (i.e.,
Lake Vida frozen brine) and how long endospores remain viable in an ideal storage
medium (i.e., ice)?
The ice sheets of Greenland and Lake Vida in Antarctica are considered
suitable sites for the study of longevity of microbial cells at low temperature33,34.
GISP2 (Greenland Ice Sheet Project 2) is an international collaborative project that
lasted from 1993 to 1998 to drill and collect ice cores from different depths along
the 3053.44 m ice. Lake Vida is located in the McMurdo Dry Valley in Antarctica.
This endorheic lake has been isolated from outside world by a layer of non glacial
icecap. The briny water is 7 times more saline than sea water and remains unfrozen
at -10°C. Only a few studies have been carried out on bacterial communities within
ice cores and the population of bacterial spores in these communities has never been
directly assessed. However, bacterial spore formers have been isolated from various
ice core environments35-40.
Permafrost in defined to be soils at or below the freezing point of water for two
or more years. Over 20% of the terrestrial soil ecosystems consist of alpine and
glacier permafrost. Permafrost is one of the extreme habitats on Earth, characterized
by permanently subzero temperatures, high salinity, low water activity and low rate
227
of nutrient and metabolite transfer. Extremophiles residing and thriving in this
habitat are composed of a great diversity of microorganisms, including halophiles,
psychrophiles and spore-forming bacteria. Formation of the remarkably resistant
and dormant endospores in genera such as Bacillus, Clostridium, and Sporosarcina.
is generally regarded as a response to nutrient-poor and adverse environmental
conditions. So far, most of the endospore studies on permafrost habitats are
constituted by culture-based techniques. In this study, we demonstrated the
integration of culture-based and non-culture-based techniques to assess the viable
bacterial endospore population in a permafrost sample. Dipicolinic acid was
measured from endospores as a proxy for endospore viability in an effort to
determine the longest dormancy period demonstrable for one of the most resilient
Earth microorganisms and the survival strategies under martian-like extraterrestrial
conditions including dehydration, freezing, starvation and salinity, for exobiology
exploration.
Microbial communities from permafrost have been described as “a community
of survivors.41” This “starvation-survival style” is the normal physiological state of
microbial communities within permafrost, contributed by cold temperature,
desiccation and starvation42 that are coincidentally the driving forces for sporulation.
Endospores have been widely found in permafrost all over the world14,41,43,44. As one
228
of the most resistant form of life on Earth, endospores present themselves as time
capsule preserving geological history, as well as the ideal surviving candidate in
other analogous extraterrestrial environments from the perspective of astrobiology.
In the GISP2 ice core experiment, we ultimately aim to determine the longevity
of bacterial spores embedded in ices by measuring the viable fraction of endospores
as a function of ice core age. Toward this end, we have developed two
complementary endospore viability assays (EVA) capable of quantifying the
number of endospores capable of germination45,46, where the ability to germinate
serves as an indicator for viability. These viability assays are based on bulk
spectroscopic analysis (i.e., spectroEVA), and direct microscopic enumeration (i.e.,
µEVA). Both assays detect the release of dipicolinic acid (DPA), a unique chemical
marker found only in endospores47, during L-alanine induced germination. The
process of endospore germination can be initiated on the timescale of minutes by the
addition of trigger molecules such as L-alanine, L-asparagine, or glucose47-51.
During the first stage of germination, most of the DPA is released from the core of
the endospore into solution47,52,53.
Specifically, in µEVA experiments, the Tb3+-DPA luminescence halos that
form as DPA is released into Tb3+-containing media under UV excitation are
enumerated in a microscope field of view. SpectroEVA experiments quantify

229
germinating endospore concentrations by comparison of Tb3+-DPA luminescence
intensities to a standard curve. In addition, the total number of endospores in a
sample can be determined with spectroEVA experiments by inducing total DPA
release through spore rupture by autoclaving, which in combination with the
germinating spore count allows the computation of the viable fraction of
endospores.
In the permafrost study, we focus on developing culture-dependent and
culture-independent methods to detect endospores embedded in permafrost.
Permafrost can be any soil or rock which has remained frozen for two consecutive
winters and the intervening summer. The matrix is usually highly complex and
presents difficulty in detecting the resident endospores. Apart from the
previously-reported µEVA, we have used phase-contrast microscopy, SYBR® Gold,
Live/Dead BacLight viability, 5-cyano-2,3-diotolyl tetrazolium chloride (CTC)
staining54, ATP luciferin-luciferase and terbium-dipicolinate (Tb-DPA)
luminescence assays to study microorganisms in permafrost. Different property and
processes associated with endospore, including phase property, germination, DPA
content, ATP synthesis, outgrowth and respiration, are all used as proxy for
assessing viability. Among these methods, the use of CTC is a novel method to
detect respiring endospores in permafrost. Because of their bright red fluorescence
230
(emission maximum = 602 nm), actively respiring endospores were readily
distinguishable from abiotic particles and other background substances, which
typically fluoresced at shorted wavelengths.
Here we report the first application of µEVA and spectroEVA to determine the
germinating and total endospore concentrations in Greenland (GISP2) ice cores,
Antarctic Lake Vida brine water, and polar permafrost.
8.3 Materials and Methods
8.3.1 Materials
Deionized water (18.2 MΩ/cm) was obtained from an ultrafilter system (Water Pro PS,
LabConco, Kansas City, MO). Terbium (III) chloride hexahydrate-(99.999%),
dipicolinic acid (99%) (2,6-pyridinedicarboxylic acid, DPA), and L-alanine were
obtained from Aldrich (Milwaukee, WI), and were used without further purification.
Agarose for culturing experiments was obtained from MacConnell Research (San
Diego, CA). Agarose for µEVA experiments was obtained from Invitrogen (Carlbad,
CA). All utensils were either prepackaged one-use only or glassware was kilned at
500°C for 4 hours for sterilization and removal of biomolecules such as DNA, RNA
and DPA. All media and utensils were pre-chilled to 4°C before use. All aerobic
procedure, unless otherwise specified, was carried out inside a biohazard safety

231
cabinet (Sterilgard III Advance, The Baker Company, Sanford, ME) on a cold
aluminum plate. Anaerobic procedure was carried out in an anaerobic chamber with
using bench-top chiller and ice for temperature control.
8.3.2 Validation of ice core decontamination protocol
The ice core was received as a gift from the Greenland Ice Sheet Project (GISP 2)
and corresponded to 11 depths from 1566 to 2804 m. We have made synthetic ice
core sections (a cylinder 5 cm in diameter and 15 cm in length), consisting of frozen
suspensions of 104 B. atrophaeus endospores in the interior, and 105 B. megaterium
endospores smeared on the exterior surfaces. The colonies of these two endospores
can easily be distinguished by color. We compared and evaluated the effectiveness
of decontamination protocols previously reported55,56 (Figure 8.1).
8.3.3 GISP2 ice core handling
The GISP2 ice cores, arranged in ascending depth order (ID# G2-271, depth
93.96–94.21 m, age 295 years; MCA.02 # 1566, depth 1565.75-1566.00 m, age
10,000 years; MCA.02 #1923, depth 1922-1922.25 m, age 20,000 years; MCA.02
#2096, depth 2095.75-2096.00 m, age 30,000 years; MCA.02 #2253, depth
2252.10-2252.35 m, age 40,000 years; MCA.02 #2429, depth 2428.00-2428.25 m,
232
age 50,000 years; MCA.02 #2517, depth 2516.75-2517.00 m, age 60,000 years;
MCA.02 #2593, depth 2592.31-2592.56 m, age 70,000 years; MCA.02 #2657, depth
2656.20-2656.45 m, age 80,000 years; MCA.02 #2703, depth 2702.11-2702.36 m,
age 90,000 years; MCA.02 #2746, depth 2745.65-2745.90 m, age 100,000 years;
MCA.02 #2804, depth 2803.65-2803.90 m, age 110,000 years), were obtained from
the National Ice Core Laboratory (NICL) and stored at -80°C. In preparation for
decontamination, the ice core temperature was ramped to 0°C via storage first at
-25°C for eight hours, followed by two hours at 0°C. Temperature equilibration of
the ice core was necessary to prevent the decontamination solutions from freezing
onto the outside of the ice core.
Decontamination was carried out under aseptic conditions, as illustrated in
Figure 8.2. The core sections were then placed on an aluminum block (pre-chilled at
-80 °C freezer and disinfected by bleach). A heat-sterilized saw was used to cut the
core into half. One half underwent the decontamination process and the remaining
portion was stored at -80 °C for future processing. A beaker containing 1600 mL of
cold (4°C) 6.25% sodium hypochlorite solution and 3 beakers containing 1600 mL
of cold (4°C) sterile distilled water (18.2 MΩ, < 1 ppb TOC, DNase-free and
RNase-free) were prepared. The ice core was submerged in the NaOCl solution for
10 s and then rinsed with sterile water 3 times, each with 10 s, and finally placed in
233
another beaker for melting at room temperature inside a biohazard cabinet hood
aseptically.
Before melting, 1/10 of the meltwater was reserved for culturing. The remaining
meltwater was vacuum filtered through a 45 mm 0.1 µm membrane filter (Nucleopre
Track-etch membrane, Sterlitech Corporation, Kent, WA) backed with a 0.45 µm
Supor backing filter. The meltwater was analyzed with 24 hours by culturing. The
filter(s) was/were resuspended in 5 mL of the original cold filtrate. The suspension
and filter(s) were vortexed for 5 minutes, with 1-min chilling increment in between to
prevent cells from overheating. The membrane filter(s) was/were removed from the
suspension and stored in -20°C freezer for clone library analysis. The concentrated
suspension was used for subsequent endospore viability assays, microscopy and ATP
analyses.
After melting, the ice core sample (~400 mL) was vacuum filtered through 0.2
µm filters (Nucleopore Track-Etch Membrane, Sterlitech Corporation, Kent, WA)
and resuspended in 3 mL of cold, sterile water, resulting in a concentration factor of
145. Of this volume, 1 mL was used for spectroEVA, 1 mL for µEVA, 1 mL for
DAPI stain fluorescence microscopy. These aliquots were sufficient to reproduce all
measurements in triplicate.

234
8.3.4 Permafrost handling
The permafrost decontamination protocol was developed based on previous reports
on the sources of contamination on permafrost57,58. The permafrost sample was
moved from -80°C to -20°C overnight for gradual warming. A cold (-20°C)
aluminum plate was used as a workbench to keep the sample and hood cold. The
permafrost sample consisted of a compact ball of silty and claylike soil particles.
The frozen spherical soil sample was fractured in a hood with a sterile knife and
scalpel and only internal fragments are taken by forceps aseptically for analysis. 3
layers of surface soils were scrapped off in series. The excavated sample was then
weighted in a 50 mL centrifuge tube quickly lest water evaporation affected the final
weight (Figure 8.3). 1:5 ratio of 50 mM sodium pyrophosphate with 0.1% Tween-80
is added into the tube. The suspension was vortexed for 5 min and sonicated for 2
min. To prevent overheating, samples were put on ice during sonication, and
between vortexing and sonication the samples were cooled on ice for at least 1
min. The suspension was centrifuged at 200 g for 20 min to separate the silty
permafrost particles and microbial cells. The supernatant was aliquoted into 3 vials
(1) without heat treatment; (2) heat shocked at 60°C for 15 min and (3)
235
heat-shocked at 80°C for 15 min. Culture-based and culture-independent analysis
tests were carried out on these permafrost extracts.
8.3.5 Ice core analysis using spectroEVA
For shallow ice cores, SpectroEVA experiments were performed as previously
described46. Endospore suspensions for spectroEVA experiments were prepared to a
final volume of 3 mL and contained 100 mM L-alanine and 1 μM TbCl3, unbuffered,
at pH 6.2. Tb-DPA luminescence excitation (λex = 250 – 360 nm, λem = 544 nm) and
emission (λex = 278 nm, λem = 515 - 580 nm) spectra were recorded at room
temperature with a fluorimeter (Fluorolog 3-τ system, Jobin Yvon, Edison, NJ,
FL-1089). Emission intensities were calibrated with respect to an external Tb-DPA
luminescence standard solution. Luminescence intensities were quantified by
integrating the area under the 544-nm emission peak with a baseline subtraction. To
correlate intensity to endospore concentrations, a calibration curve was established
for 1 μM Tb3+ over the range of 103 – 107 spores mL-1. From this, the corresponding
limit of detection was calculated to be 1000 spores mL-1 of a preconcentrated
sample.
Several different sample holders have been explored to determine the
concentration of DPA spectroscopically to maximize the final concentration factor

236
and decrease the background fluorescence. Initially, disposable methacrylate
cuvettes have been used. To determine the concentration of germinating endospores
in a sample, 50 µL of 1 M L-alanine was added to 450 µL of the concentrated ice
core sample. This solution was then placed in a 37°C water bath for 16 h to promote
germination. To determine the total endospore concentration, a parallel aliquot of
the concentrated solution was autoclaved at 124°C for 20 min. Following either
germination or autoclaving, 300 µL of 10 μM Tb3+ and 2550 µL of deionized water
were added to 150 µL of each solution, which were analyzed using fluorescence
spectroscopy. The integrated intensities were converted into germinating endospore
concentrations or total endospore concentrations, respectively, by comparison to the
standard curve. The endospore concentrations were then divided by the dilution
factor of 7.25 to account for the pre-concentration of the ice core and obtain the
germinating endospore and total endospore concentrations in the dilute, native ice
core.
For deeper and old ice cores, the protocol has been modified and optimized to
analyze the much lower concentrations of embedded endospores. The use of a
250-µL quartz microcuvette and 50-µL micro-cuvette called Fluorovette (ALine,
Redondo Beach, CA) have been explored to minimize the sample volume. The
endospore suspension was prepared in 300 µL containing 100 mM L-alanine and 1
237
µM TbCl3 at pH 6.0.The pH of the autoclaved sample was adjusted accordingly
with 1 N HCl with respect to the reference. Steady-state emission and excitation
spectra were taken as described before with a Fluorolog-3 FL-1089 model.
Phosphorescence spectra were obtained by coupling a Spex 19340 phosphorimeter
module to the Fluorolog-3 instrument; the excitation and emission slits were set at
10 nm. All spectra were corrected for lamp fluctuations and photomultiplier tube
response. Quartz micro-cuvettes (Starna Cell) were used for minimal dilution factor.
The anaerobic version of spectro-EVA has also be employed on the deeper ice
cores with a change in the germinant used. Sodium bicarbonate has been used as an
activator to germinate anaerobic endospores.
8.3.6 Ice core analysis using µEVA
µEVA experiments were performed as previously described45. Briefly, a time-gated
microscopy technique was used to count individual endospores in a microscope field
of view. The contrast in the image is generated by the formation of the long-lived
and brightly luminescent Tb-DPA complex as DPA is released during the
germination process. DPA release is observed as a spreading halo originated from
each endospore during germination, where DPA molecules bind with Tb3+ that has
238
been added into the surrounding matrix. The germinating endospores manifest as
bright spots in the field of view that grow in intensity over a period of 3-5 minutes.
Specifically, a 300 µL aliquot of the concentrated sample was filtered through
a 9 mm spot of a 25 mm 0.2 µm pore size black polycarbonate filter (#110656
Whatman, Florham Park, NJ), backed with a 0.45 µm pore size cellulose membrane
(#140618 Whatman, Florham Park, NJ), using a conventional membrane filtration
apparatus. The filter was transferred aseptically to 1.5% agarose doped with 100 µM
TbCl3 and 10 mM L-alanine, contained in a 9 mm silicone well (Molecular Probes,
Eugene, OR) on a quartz slide. A 15 mm × 15 mm piece of 0.5 mm thick
polydimethylsiloxane (PDMS) was placed on top of the agarose to prevent
evaporation and aerial contamination, and the sample was analyzed using
time-resolved fluorescence microscopy.
Endospores were filtered and concentrated onto the surface of a membrane
filter. The particles were transferred onto Tb3+- and L-alanine-doped agarose by
streaking the membrane filter across the agarose surface. The L-alanine within the
agarose triggers any endospores present to germinate and release DPA. A piece of
4.5 µm thick polydimethylsiloxane (PDMS) film was placed on top of the agarose to
prevent aerial contamination, minimize water loss and DPA diffusion across the
agarose substrate. Images were taken with a time-gated microscope, which consists
239
of a pulse xenon flashlamp, a stereoscopic microscope (1 mm × 0.8 mm field of
view at 63× magnification), mounted with a time-gated camera (Photonics Imaging
System, UK). The timing of gating is governed by the xenon flashlamp, which
serves as the master oscillator at 300 Hz. After a delay of 100 µs after the lamp flash,
the CCD camera begins integration of single photons. Over a germination course of
30 minutes, formation of miniature luminescence spots could be observed under
time-gated microscopy, which was indicative of the localized formation of Tb-DPA
due to DPA release during endospore germination. Background fluorescence and
autofluorescence were minimized because of time gating, rendering a dark
background. Characteristic germination time course allows unambiguous
assignment of germinating endospores.
8.3.7 Ice core cultivation
For the shallow ice core, the growth medium consisted of 1/100th R2A (Difco)
dissolved into distilled water and solidified with 0.8% agarose. Freshly melted
sample water was plated onto a total of 7 plates with three replicates of 200 µL and
4 replicates of 100 µL. The plates were wrapped in Parafilm to prevent desiccation,
placed at 4°C in the dark and monitored biweekly for growth for 147 days.
240
For the deeper ice cores, 1/10 R2A was used for the cultivation of aerobic
bacteria. Two solid media, MM2 and 1/10 R2A, were used for the growth of
anaerobic microbial communities. MM2 consisted of basal salts, trace elements,
vitamin solution, and different substrate supplements to enrich for different groups
of microorganisms at 7°C and at room temperature. MM2, as described by Ferrara
Guerrero et al.59, was designed for enrichment of fermentative bacteria and for
methanogens. The Petri dishes were sealed inside GasPaks to provide an anaerobic
environment. 3-tube MPN series method was applied in the aerobic culture and 2
MPN series dilutions was used in the anaerobic culture. The anaerobically prepared
media (50 mL in 125-mL bottles) were overgassed with N2, inoculated from the
melted ice (~1:200 dilution). For each depth, solid agar plates were prepared in
duplicate, and the aerobic and anaerobic plates and tubes were incubated with
appropriate controls at 7 °C and room temperature. Results reported are based on
solid agar cultures after ~6 months of incubation at room temperature.
In addition, a system of 5 enrichment media was prepared using
filtered-sterilized ice core filtrate, mineral and vitamin supplements, 1 mM calcium
dipicolinate as the basal medium, namely (1) full strength R2B for heterotrophic
bacteria, (2) B10 medium for ferric-reducing bacteria, (3) Butlin’s broth
supplemented with agar (1.5%) for sulfate-reducing bacteria, (4) nitrate broth

241
supplemented with agar (1.5%) for nitrifying bacteria, (5) N-deficient combined
broth for diazotrophic bacteria60. The agar plates were prepared at 5 different pHs (3,
5, 7, 9, 11) and incubated at 7°C and 22°C. Calcium dipicolinate was added for
facilitating spore germination and hence subsequent outgrowth and colony
formation
8.3.8 Lake Vida Cultivation
Various cultivation methods were used, spread plating, most probable number, fluid
thioglycollate culture and multiplex 24-well microtiter plate for isolation of Bacillus
endospores. The medium consisted of 12.5 g of NaCl, 2 g of K2HPO4, 1.25 g of
KH2PO4, 0.5 g of MgSO4 · 7H2O, 0.125 g of CaCl2 · 2H2O, 0.05 g of MnSO4 · H2O,
2.5 g KNO3 and 2.5 g of yeast extract in 1 liter of water. 0.2-µm filter sterilized
Wolfe’s mineral (0.5%) and vitamin (0.5%) solutions (ATCC) were added
aseptically to the sterile medium at 60°C. The basal medium was made from 1/5 of
the autoclaved actual brine water sample, incubated at different temperatures,
different pHs and different salinity with and without urea.
242
8.3.9 Permafrost cultivation
Heterotrophic plate counts were prepared by spread plate 100 µL aliquots of 10-3,
10-4, and 10-5 serial dilutions of samples on 1/2 TSA agar (Becton, Dickson and
Company, Sparks, MD), supplemented with 0.1 M sucrose and 10% sodium
chloride, as well as on 1/5 R2A with cycloheximide (50 µg mL-1). Plates were
incubated at ambient temperature for up to 20 days and 7°C for up to 2 months. All
plating was performed in quadruplicate and results are reported as mean counts with
standard error. Colonies were streaked for isolation on fresh medium of the same
type from which they were isolated and incubated at their specific growth
temperature. Plates were incubated aerobically and anaerobically inside GasPaks.
A MPN technique was used to enumerate viable bacteria. Three replicate
10-fold dilutions of sediment samples in the medium broth consisting of 1/5 TSB
with 0.1 M sucrose and 10% sodium chloride were prepared. MPN tubes were
incubated for 2 months aerobically under ambient temperature and at 7°C. Tubes
were score positive on the basis of ATP production by the firefly luciferin-luciferase
bioluminescence assay.
243
8.3.10 Permafrost metabolic study
In the augmentation experiment, the permafrost extract was incubated in a low
nutrient bath (final concentration of 1/10 TSB and 10 mM L-alanine) at ambient
temperature for 1 week with agitation and full aeration. The ATP level, DPA level
and respiration rate were monitored during the course of growth.
ATP was measured by the microluminometer NHD Model 3550i (New
Horizon Diagnostics). A sample suspension was transferred to the FiltravetteTM
(0.45 µm), four drops of somatic cell releasing agent were added. The mixture was
pushed though the Filtravette by a positive pressure device. Four more drops of
somatic cell releasing agent were added and pressure filtered to ensure the removal
of interfering substances, free ATP, and somatic cell ATP. The Filtravette was then
placed into the drawer slide of the microluminometer. Two drops of bacterial
releasing agent were added into the Filtravette to extract the microbial ATP.
Immediately after the addition of the bacterial releasing agent, 50 µL of
luciferin-luciferase reagent was added and mixed by aspirating the fluid up and
down three times. The drawer slide was closed immediately. Light emission was
measured with integration with 10 seconds. ATP was reported as relative light units
(RLUs), taken directly from the luminometer’s digital readout.
244
DPA measurement is equivalent to the measurement of germination propensity.
1.5 mL of extract was pipetted into methylcrylate cuvettes at each time interval. 1.5
mL of 50 µM TbCl3 supplemented with 10 mM aluminum chloride buffered with 10
mM sodium acetate to pH 5.5 was added. The luminescence intensity was measured
using the following home made spectrometer: the spectrometer consists of a 24 W
pulsed xenon flashlamp (FWHM ~5 µs and tailing out to ~50 µs), a photomultiplier
tube (Hamamatsu R6353P, Bridgewater, NJ), 2 concave aluminum mirrors and 2
bandpass filters. Pulsed excitation light at 10 Hz was focused on samples with a
concave aluminum turning mirror and band-limited by an interference filter (50%
pass bandwidth 255–280 nm, 23% maximum transmittance). Luminescence from
the sample traversed through a bandpass filter (50% pass bandwidth 538–553 nm,
70% maximum transmittance) and another concave aluminum mirror to enter the
PMT. The filter set was chosen to overlap with the excitation and emission spectra
of Tb-DPA. Time gating was achieved by a delayed detection of the sample
luminescence after each flash, according to a chosen delay time. Throughout all
measurements in this study, the PMT was operated at 950 V, photocathode aperture
set to be 15 mm × 10 mm, delay and integration time was 100 µs and 2 ms,
respectively. The entire assembly was shielded from ambient light using a black
anodized aluminum enclosure. The spectrometer was custom constructed by Jobin
245
Yvon, Edison NJ. Cuvettes and tape matrix were measured at a distance of 15 mm
from the spectrometer.
CTC was used to test the respiratory activity during germination and growth.
Reduction of CTC was used to evaluate the respiratory potential of freshly isolated
endospores. Dehydrogenase activity in bacterial respiration was measured with this
dye, which has the ability to produce a red fluorescent molecule (formazan) when
reduced. A stock solution of 50 mM CTC was prepared in sterile ultra-filtered water.
90 µL TSB and 10 µL CTC stock solution (final concentration of 5 mM) were
incubated for an additional 2 hours at 37°C in the dark. The stained samples were
loaded on a filtration apparatus and pumped through a 0.22-µm nucleopore
polycarbonate filter. The filters were mounted on a slide and observed under 100×
oil immersion objective.
8.3.11 Fluorescence microscopy
The DNA-intercalating fluorescent dye, SYBR Gold (Molecular Probes, Invitrogen)
was used to determine the number of total cells by epifluorescence microscopy. To
dislodge cells from sediment particles, the protocol described by Epstein and Rossel
was modified61. Aliquots of fixed sediment samples were mixed with 0.2-µm
filter-sterilized and autoclaved water. The samples were sonicated three times for 1
246
min at the lowest setting with a microtip. Aliquots of the sonicated sediment samples
or fixed pure cultures were diluted in 5 mL of particles free PBS and stained with
SYBR Gold (1 µg of SYBR Gold mL-1 of PBS). After 10 min of staining, the cells
were concentrated by filtration onto black polycarbonate filters (pore size 0.2 µm;
Nuclepore). The membrane filters were mounted with immersion oil. Epifluorescence
microscopy was performed with a Nikon Optiplex microscope. For each filter no
fewer than 400 cells were counted in at least 10 microscopic fields.
The LIVE/DEAD® BacLightTM kit (Molecular Probes, Invitrogen) was employed
to assess the viability of permafrost vegetative bacterial communities. Phase contrast
microscopy was performed to determine the total number of endospores present.
Endospores are not stainable but they can be observed as phase-bright oval bodies
under phase contrast optics. Malachite green staining was performed to identify the
presence of endospores. Endospores would be stained green while the rest would be
stained red.
Direct cell counts were obtained as previously described62, with the exception
of using a 3.7% formaldehyde fixative and 2 µg mL-1 of
4’,6-diamidino-2-phenylindole (DAPI) stain. One hundred microliters of the DAPI
stock solution (1 mg mL-1) were added to 1 ml of sample which was stained for 8-10
min and then filtered through a black 0.2 µm Nucleopore black polycarbonate filter.
247
For staining with acridine orange 40 µl of stock solution (0.5 mg mL-1, dissolved in
PBS) were added to 1 ml of sample, stained for 2 min and further tested as the
DAPI-stained sample. Filters were mounted with immersion oil before the cover slip
was placed on top. DAPI binds strongly to DNA for total bacterial enumeration. The
counts were enumerated by IP-Lab imaging processing software (Becton Dickinson).
Segmented particles were included in the count if they ranged from 0.06 to 0.5 µm2,
which corresponds to a sphere with a radius ranging from 0.14 to 0.4 µm. This
lower size limit also corresponds to the volume, 0.01 µm3, of the smallest know free
living bacterial cell, Pelagibacter ubique. The apparently high counts could be due
to non cell particles that were able to take up the DAPI stain.
8.3.12 Phase contrast microscopy
Spores appear as phase bright bodies under microscope and thus TSU can be
obtained. Epifluorescence microscopy was performed with a Nikon Optiplex
microscope. For each filter no fewer than 400 cells were counted in at least 10
microscopic fields. Deposit on agarose for easy enumeration. Spore films were
prepared by drying 50 µL of a suitably diluted suspension of spores spread out over
a circular area of about 1.5 cm in diameter. When dry, the monolayer of cells
formed a smear of endospores. Due to the low number of counts, the entire smear
248
was counted. Approximately 100 fields of views were examined using 60× pH3
phase contrast objective. Endospore appeared as bright thick-wall round/oval bodies,
and vegetative cell appeared as phase dark. Spore size was determined using the
following equation:
8.3.13 Method of Schaeffer and Fulton
The Schaeffer and Fulton method in staining endospores were modified as follows:
A smear of 20 µL of Lake Vida brine was prepared, air dried and heat fixed on a
microscope slide. The smear was covered with a piece of blotting paper soaked with
malachite green, and then placed over a boiling water bath for 5 min. The overlying
blotting paper was kept moist by constant introduction of malachite. The slide was
then cooled down and washed with deionized water until no residual green stain was
left. The slide was placed in a staining jar with safranin for 2 min, and then rinsed
until no residual red stain was left. The entire smear was examined using 100× oil
immersion objective in which endospores were stained light green found/oval
bodies and vegetative were stained red. This method is not quantitative due to
unknown number of cells being washed out during the staining procedure. 3 slides

249
were prepared and counted. This method is, however, a definitive qualitative
method and can set the lower boundary for endospore count.
8.3.14 Flow cytometry
Staining of 500 µL samples from the melted ice with propidium iodide (PI) and
SYTO-9 was according to the instructions of the LIVE/DEAD BacLight bacterial
viability kit (Molecular Probes, Eugene, OR), and samples were examined under a
Nikon Optiplex microscope with a 100× objective. Flow cytometry analysis was
carried out with a FACSCalibur flow cytometer (Beckton Dickinson
Immunocytometry Systems, San Jose, CA) equipped with an air-cooled argon ion
laser emitting 15 mW of blue light at 488 nm and with a standard filter setup.
Live/Dead BacLight viability kit is used to stain live cells green with SYTO-9 and
dead cells red with propidium iodide. The green and red fluorescence were collected
using a 530 ± 30 nm bandpass filter (FL1 channel); the red fluorescence emitted from
PI was collected by a 650 ± 13 nm bandpass filter (FL3 channel). All analyses were
performed at low flow-rate setting (~12 µL min-1) while the count was lower than
1000 events/s. Data were analyzed in software. Control samples as well as 1µm
europium fluorescent beads (Bead concentration = 1.25 x 10⁸ mL-1) were used for the
instrument calibration (voltage of the detector and threshold) and for checking the
250
instrument sensitivity over time. Cells were discriminated from background using a
double threshold set on both side scatter (SSC) and forward scatter (FSC). A dual dot
plot of FSC vs. SSC in combination with a one parameter histogram representing the
green fluorescence (FL1) was used to back gate cells and distinguish them from the
background.
8.4 Results
In this section, we will describe the first successful application of two novel
endospore viability assays (i.e., spectroEVA and µEVA) on Greenland ice cores.
Parallel determination of both germination-capable and total endospore
concentrations allows us to calculate the fraction of germination-capable endospores
in a given sample. Since germination is an indicator of viability, we call this the
viable fraction. Ultimately, we measure the viable fraction as a function of ice core
age to determine the viability decay and corresponding longevity of endospores
embedded in ices. The spectroEVA and µEVA experimental results reported here
represent the first step towards addressing the endospore longevity question. First,
we will review the data on the first ice core (295 years) that we analyzed and then
proceed to the other deeper and more challenging depths, followed by preliminary
characterization experiments of Lake Vida and polar permafrost.
251
8.4.1 Validation of ice core decontamination protocol
The outside of ice cores was associated with contaminants originated from such as
drilling fluids, transport, handling and cutting. The outer surfaces of the ice cores
had to be effectively removed and decontaminated in specimen authentication. We
carried out the validation based on two criteria, the first was to ensure that
contaminants are completely eliminated from outer layers; the second was to protect
organisms inside the ice cores during decontamination and melting of the ice.
Among the liquid sterilants (sodium hypochlorite, calcium hypochlorite, ethanol,
hydrogen peroxide) used, sodium hypochlorite in the form of Chlorox (6.25% active
ingredient) was the most effective, assuring completing elimination of all outer B.
megaterium endospores and preservation of the inner B. atrophaeus endospores
(Figure 8.1).
8.4.2 Ice core SpectroEVA
Different SpectroEVA procedures and data analyses were applied to the shallow
depth (94 m) and deeper depths ( 1566 m) because of the difference in postulated ≧
endospore concentrations. SpectroEVA results are presented in two parts here.
252
Figure 8.4 illustrates a comparison of the excitation spectrum between a 94 m
Greenland ice core and the excitation spectrum of 1 μM DPA with 10 μM Tb3+. The
excitation spectrum of the ice core concentrate clearly showed Tb-DPA complex
formation, indicating the presence of endospores. The slight differences in shapes
between the excitation spectra arise due to the presence of impurities in the ice core;
however, the maxima of the DPA vibrational progressions clearly aligned. Control
negative experiments did not manifest excitation spectra similar to the Tb-DPA
complex. This evidence supports our claim that DPA was extracted from the ice
cores and was the source of the increased Tb3+ luminescence intensity. From this,
and the fact that endospores are the only source of DPA in a natural environment47,
we conclude that SpectroEVA was able to detect and quantify endospores within the
GISP2 ice core.
After the germination process in the ice core sample was complete, the
germination-capable endospore concentration was determined to be 295 ± 19 spores
mL-1 for the native ice core. After autoclaving the ice core sample, the total
endospore concentration was determined to be 369 ± 36 spores mL-1. From these
two values, we calculated a viability ratio of 0.80 ± 0.09.
Figure 8.5 illustrates an excitation spectrum of a 1566 m deep ice core section.
The green spectra represented the excitation spectra of 1 µM DPA with 5 µM TbCl3
253
in water (solid line) and native ice core filtrate with 0.1 µm membrane filter (dotted
line). The filtrate was shown to slightly broaden the characteristic Tb-DPA
characteristic dual-peak spectroscopic handle. Endospore spectra were compared with
the dotted DPA reference. The blue, orange and pink plots represented the DPA
content by autoclaving, induced aerobic germination and induced anaerobic
germination of the ice core sample, respectively. The control negative sample, shown
in black, did not manifest any spectral similarity to the Tb-DPA complex. A DPA
reference and standard curve was created for each specific ice core due to
heterogeneity of background fluorescence observed in the meltwater filtrate.
In the DPA calibration curve, adding interferring chemicals would only result in
a general broadening and up-shifting of the entire excitation spectrum. Only in the
presence of DPA that the excitation peaks at 271 and 279 nm could be observed. The
robustness of the Tb-DPA binding was also stressed in other literature. Pure DPA
demonstrated background absorption at wavelengths beyond the range of 260 and 300
nm. So, we performed a deconvolution on the spectra assuming supposition of x
molar ratio of DPA that contributed to the dual-peak pattern and y molar ratio of
interferring background fluorescence that contributed to the general broadening and
up-shifting of the spectrum. DPA reference and the deconvolved sample spectra were
compared with a point-to-point matching algorithm. Similarity was assessed based on
254
an Euclidean cosine squared correlation coefficient63. 0.9 was chosen as the threshold
correlation coefficient. In the case of the ice core sample shown in Figure 8.5, the
total endospore and aerobic germination endospore spectra were shown correlated
with the DPA reference, while the anaerobic germination spectrum was classified as
uncorrelated. The total endospore concentration was calculated to be 136 ± 26 spores
mL-1 and germination-capable aerobic endospore concentration was calculated to be
29 ± 9 spores mL-1 after deconvolution and linear regression with the standard curve.
The viability ratio was determined to be 0.23 ± 0.11.
SpectroEVA experiments rely on a standard curve to relate measured Tb-DPA
intensities to an equivalent endospore concentration. The standard curve for the 94
m sample was generated using B. atrophaeus (ATCC 9372) endospores assuming
that endospores within an ice core contained an average DPA content per spore
equivalent to that of the B. atrophaeus spores. For the rest of the deeper samples, the
standard curve was created using B. longisporus, a psychrophilic strain, in each
specific ice core filtrate due to heterogeneity of background fluorescence. B.
atrophaeus contained 0.208 fmol DPA spore-1. And B. longisporus contained 0.992
fmol DPA spore-1.
255
8.4.3 Ice core µEVA
Figure 8.6 shows a representative µEVA image of germinated endospores and
corresponding germination time course plots of 10 endospores. DPA release during
germination resulted in bright luminescent spots due to Tb-DPA complex formation
with the Tb3+ that was present in the surrounding agarose medium. While individual
endospores, with reported sizes between 0.8 and 4 µm, could hardly be spatially
resolved with a stereoscopic microscope, the intense Tb-DPA luminescence
emanating from the location of germinating endospores enabled rapid enumeration.
From µEVA experiments, we determined that 27 ± 3 spores mL-1 in the 94 m
sample germinated under experimental conditions. Germination-capable endospores
were detected in all depths except the core sections at 2517 m and 2804 m. The
number of spores was approximately two orders of magnitude lower than the
measurable at 94 m underground. Control negatives experiments contained
background counts that were at least 3 orders of magnitude lower than those
obtained from ice core samples.
Our data showed that individual endospores in the GISP2 ice core released
detectable amounts of DPA within the first 10 minutes. Our observed germination
time course data are consistent with microgermination times previously reported
64-66. For reference, we overlaid the germination time courses of ice core endospores
256
with (1) a pure B. atrophaeus spore suspension, and (2) an environmental surface
swab from our laboratory.
8.4.4 Ice core microscopy and flow cytometry
The 93 m sample was the clearest among all the depths, with a cell concentration of
7.0 × 10³ ± 6.7 × 10² cells mL-1. This ice core sample was visibly clear and cell
count preparations showed very little sand or debris. Cell concentration of the rest of
the ice cores ranged from 2.1 × 10⁴ to 8.3 × 10⁶ cells mL-1 showing correlation with
the degree of meltwater turbidity of specific depths. For instance, the depths that
corresponded to ages 20,000, 30,000 and 40,000 years, which took twice as much
time to filter, contained the highest cell counts. An increased number of
microorganisms was found associated with a high degree of fine grain sediments in
the silty layer at the bottom portion of the GISP2 ice cores67. Although DAPI
staining is generally specific for DNA, occasionally larger particles that are
obviously not cells are stained. Therefore, this count may be a slight overestimate as
some cell-sized particles (approximately 1 µm), which are not as easily
distinguished from actual cells, may have been included in the count. Staining with
the fluorescent DNA-binding dyes SYTO-9 and PI allowed the accessibility of
bacterial DNA and the status of the cytoplasmic membrane to be assessed. Using the

257
Live/Dead BacLight viability kit, the live to dead cells ratio was approximately 10-3
(Figure 8.7). Both flow cytometry and epifluorescence revealed a predominately
PI-stained red cell bodies. Phase contrast microscopy revealed approximately 102 to
103 phase-bright bodies mL-1 of the native ice core. Most of the cells were small,
with sizes 1 µm or below. Detailed counts are shown in Table 8.2.
8.4.5 Ice core cultivation
Culturing attempts yielded two colonies in the 93 m deep sample after applying 1
mL of fresh ice core meltwater to 1/100 R2A. These colonies only became visible as
pinpoints after 147 days at 4°C corresponding to a concentration of 2 cfu mL-1 in the
native ice core. For the deeper ice cores, both aerobic and anaerobic culturing were
practiced. No colonies were observed in the spread plating culture on either 1/10
R2A medium, B10 medium, Butlin’s medium, nitrate medium, or N-deficient
medium supplemented with native ice core meltwater at different pHs 3, 5, 7, 9, 11
at 7°C and 22°C after 6 months of incubation. Aerobic MPN tubes were still under
incubation and would be tested for growth by ATP assay. Anaerobic spread plating
yielded 0 to 11 cfu mL-1, some of which were heat-shock survivors, on both 1/10
R2A and MM2 media.
258
8.4.6 Lake Vida analysis
The method described for examining endospore abundance in ice cores46,68 was not
applicable to Lake Vida brine water. Interference from background fluorescence
masked the spectral characteristics of DPA. Pre-concentration was impossible because
the lake water was highly turbid. A modified ethyl extraction protocol successfully
extracted detectable quantities of DPA from the lake water69,70. Figure 8.8 shows an
overlay of the excitation spectra of DPA references and endospore suspensions. The
green spectra represented the excitation spectra of 1 µM DPA with 5 µM TbCl3 in
water (solid line) and native filtered Lake Vida water with 0.2 µm membrane filter
(dotted line). The filtrate was shown to slightly broaden and elevate the spectrum
from 300 – 360 nm, due to presence of unknown interference particulates that
fluoresced green in the UV range. The characteristic Tb-DPA characteristic dual-peak
spectroscopic handle could still be observed. Endospore spectra were compared with
the dotted DPA reference. The blue, orange and pink plots represented the DPA
content by autoclaving, induced aerobic germination and induced anaerobic
germination of the brine water sample, respectively. The control negative, shown in
black, did not manifest any spectral similarity to the Tb-DPA complex. Using a
deconvolution, point-to-point matching algorithm and Euclidean cosine squared
correlation coefficient method, it was determined that the total endospore and
259
germination-capable aerobic endospore populations were 4800 ± 800 spores mL-1 and
1600 ± 230 spores mL-1, respectively. The excitation spectrum derived from
germination-capable anaerobic endospores elicited a broad band across 270-280 nm
and therefore lacked similarity with the DPA reference. µEVA experiment revealed a
concentration of 0.80 ± 0.24 spores mL-1 of germination-capable aerobic endospores.
Cultivation attempt on various media yielded a total culturable count of 0.5 cells
mL-1 and 0.1 heat-shock survivors mL-1 of native lake water (heat shocked at 65°C).
Growth was observed in cultures incubated at 7°C and 22°C with distinct differences
in morphologies. Colonies obtained from low-temperature cultures in general
exhibited bright colors, e.g., orange, red and pink, while those from room-temperature
cultures were usually brown in color. Most of the isolates were halotolerant and were
recovered from medium with NaCl concentration of >5%. Majority of the isolates
were obtained from alkaline media (pH 9 and 11) supplemented with urea.
Subsequent sporulation attempt resulted in an endospore-forming species that
harbored two endospores per mother cell (Figure 8.9). DPA was detected from a
sporulating culture of this species.
A spore size distribution histogram (Figure 8.10) was observed using phase
contrast microscopy. Spores remaining after being washed in the malachite green
staining protocol were determined to be 5% of the original population. Malachite
260
green staining revealed a concentration of 196 ± 58 spores mL-1 and phase contrast
microscopy revealed 1.9 × 10⁴ ± 2.7 x 10³ spores mL-1 of the native Lake Vida brine
water. The spore size calculated by phase contrast microscopy was 10%-15% larger
than that by malachite green staining. The size discrepancy is due to the presence of
phase ring, which obscures the accurate determination of an endospore appearing as a
phase bright body under phase contrast microscopy.
8.4.7 Permafrost analysis
After incubation of about 4 months, colonies started to show up takes time to grow.
Sub-culture did not take as much as to grow under low temperature. Inoculum has
been heat-shocked and therefore colonies isolated should presumably by
spore-forming species. DNA analysis revealed the presence of spore-forming species.
After 2 weeks of incubation, aerobically, we have obtained 8.7 × 10² cfu g-1 on
minimal TSA plates selecting for halophiles; and 6.7 × 10² cfu g-1 on minimal R2A
selecting for heterotrophic bacteria at 7°C. At room temperature, we obtained 3.8 ×
103 cfu g-1 on TSA plates and 1.3 × 10² on R2A plates. It showed the presence of both
aerobic mesophilic and psychrophilic halophiles and heterotrophs vegetative bacteria.
Anaerobic culture yielded no growth on TSA; 1.3 × 10² cfu g-1 and 4.3 × 10² cfu g-1
on R2A plates at 7°C and room temperature, respectively. No anaerobic halophiles
were recovered but some heterotrophic counts were obtained. MPN enumeration yield
261
comparable results with spread plate counting. Conventional endospore selection
process involves heating at 80°C for 15 minutes. It has, however, been reported that
psychrophilic endospores has a lower heat tolerance. Therefore two different
heat-shock temperatures were used to experiment the heat resistance of any present
endospores. We have chosen a heat-shock treatment at 80°C and 60°C for 15 minutes
on the permafrost sample, respectively. We have only obtained approximately 102 cfu
g-1 and 102 mpn g-1 for the 60°C-treated sample incubated aerobically at room
temperature on TSA plates and in TSB. The rest of the heat-shocked samples yielded
unobservable growth after one month of incubation. The permafrost under analysis
contained a very low culturable aerobic mesophilic bacterial endospore population
which is susceptible to 80°C of heat treatment. All negative controls showed negative
growth (Table 8.1).
A DPA-spike standard curve could not be established with the ethyl acetate
extraction method because of the high background interference. Spectro-EVA
approach failed but µEVA identified 8.3 ± 3.3 spores g-1 of native permafrost.
Figure 8.11 shows time-lapse images of spore germination time courses. Endospores
were induced to germinate at room temperature on an agarose substrate fortified
with 50 mM L-alanine and covered with PDMS. The germination timecourse of the
predominant endospore in the permafrost had a sigmoidal kinetics of DPA release.
262
SYBR-Gold staining of permafrost yielded a total number of vegetative cells of
3.57 × 10⁶ cells g-1 (n = 24). BacLight viability staining yielded a live SYTO-9
count of 4.07 × 10⁵ cells g-1 and a dead PI count of 3.47 × 10⁶ cells g-1. Phase
contrast microscopy gave a total endospores count of 3.96 × 10³ spores g-1. µEVA
gave a germinable endospore population of 8.33 × 100 spores g-1 (Figure 8.12). Of
the total 3.57 × 10⁶ cells g-1 in the permafrost sample, 11.40% were stained live by
SYTO-9 and the live to dead ratio of vegetative cells was found to be 11.73%. Total
and germinable endospores constituted 0.11% and 0.0002% of the total microbial
population. Compared with the cultivation results, approximately 0.1% of the
vegetative cells were culturable; ~0.01% of the total endospores was culturable and
~0.002% of the total endospores was germinable.
At the beginning of incubation with CTC (t = 0), no red signal (CTC-positive
cells) was detected for the heat-shock permafrost sample. However, after 6 hours of
incubation, some endospores demonstrated respiration and some red signal was
observed at the center of endospores. The red signal appeared as round, oval and
small at this time. After 2 days of incubation, the red signal became more apparent
and the stained endospores looked bigger than the previous ones. In addition, some
stained elongated cells forms could be observed. Some endospores should have
undergone germination and outgrowth to become vegetative cells again. After 7
263
days in incubation, a huge increase in cell numbers and size were noticed. The
red-stained cells have characteristic morphologies of vegetative cells in oval and
filamentous shapes (Figure 8.13). It showed that the vegetative bacteria have
undergone multiplication. Positive reduction reaction was not observed in the
control sample.
The levels of ATP and DPA of permafrost samples were monitored over 7 days
upon exposure to nutrients (1/2 TSB and 10 mM L-alanine). Figure 8.14 shows the
respective ATP and DPA timecourses. ATP levels rose in both the non-heat-shock
and heat-shock samples at 60°C, indicating the presence of metabolic processes. No
ATP was released when the sample was subjected to 80°C for 15 minutes. This is
probably due to the inactivation power of heat at this temperature. Insignificant
levels of DPA were detected in any of the three cases due to low number of
endospores present in the permafrost. It was anticipated to be close to, or not lower
than, the limit of detection of the instrument. Moreover, any released DPA via
endospore germination would be used up as energy in the growth broth. Therefore,
no observable changes were noticed in DPA level.
264
8.5 Discussion
The dormancy of endospores, combined with their resistance, enables them to
last for extreme periods of time. Numerous reports have documented the isolation of
viable spores from environmental samples such as dried soil in herbarium
collections, paleosols, ancient lake sediments, permafrost soils, ice cores and old
cans of meat. These samples ranged in age from several decades to thousands of
years28,71-75.
To better understand constraints on bacteria at extremely low temperatures in
ice, we describe here the adaptation of methods previously developed for the
imaging of mesophilic endospores. Endospore viability assessment, using the
Tb-DPA luminescence assay, time-gated microscopy and image analysis were
applied to Greenland ice core. Abundances of aerobic, anaerobic, total, viable,
germinable, culturable were also determined from samples melted at 0°C using
Tb-DPA luminescence assay and DNA intercalating dyes. Following a vertical
transect of 11 depths in Greenland ice cores, we observed a decrease in both
bacterial viability and abundance with increasing age. Germinable endospores were
found in all ice core samples (295 years and 10,000 to 110,000 years), but on
average less than 1 endospore/mL of the original ice. Percentage of viable cells
ranged between >0.1% based on germination assay and total epifluorescence
265
enumeration. Endospore viability was significantly correlated (p < 0.001), indicating
that viability assessment by µEVA is a good probe for endospore enumeration in ice
cores. Our results expand the spectrum of information available on bacteria in ice
cores on a scale relevant to the organism and provide insight into characteristics of
frozen microbial habitats on Earth and perhaps elsewhere in the universe. Viable
bacteria have been recovered from Greenland ice cores over 100,000 years old.
Although there is not much doubt about the presence of microorganisms and other
biotic materials in ice cores, the microorganisms or their DNA could survive in a
viable or amplifiable form in ice for centuries or millennia is not universally
accepted. We concentrated our efforts on spore-forming bacteria, because, as with
other types of microorganisms, spore-forming bacteria respond to stressful
environmental conditions by producing a resistant structure, dormant endospores.
Most of these structures have extremely thick cell walls, some with another layer of
exosporium. The microbial composition of ancient ice core samples from Greenland
was examined through culture and culture-independent approaches. The culturable
and non culturable microorganisms found in the ice cores provide a prototype for
possible life on the cryogenic planets of the solar system.
266
8.5.1 Comparison of spectroEVA and µEVA at 295 m depth
Our measurements of this GISP ice core yielded 295 ± 19 spores/mL using
spectroEVA and 27 ± 3 spores/mL using µEVA. This discrepancy is presumably
due to differences in DPA content between environmental samples and lab strain B.
atrophaeus, which may give rise to an overcount in spectroEVA experiments. In
addition, agglomeration of more than one endospore per dust particle will lead to an
undercount in µEVA experiments, but not in spectroEVA experiments. These two
factors may constructively combine to account for the discrepancy; for example, a
three-fold difference in DPA content combined with an agglomeration rate of three
endospores per particle results in an order of magnitude difference between the two
measurements. Comparison of the two methods using laboratory B. atrophaeus gave
a linear correlation as given by equation (1).
Spores/mL (µEVA) = 1.6 × Spores/mL (spectroEVA) (1)
8.5.2 Viability assessment at 295 m depth
The definition of viability of microorganisms is neither simple nor
straightforward76,77. Endospores that give rise to colonies on growth media are
clearly viable, but culture based approaches generally miss more than 99% of the
viable-but-not-culturable cells found in the environment78-80. Similarly, the
267
conditions we provide for germination will not work for all endospores in a given
sample (e.g., superdormant endospores). In addition, endospores that germinate are
not necessarily viable since the molecular machinery for subsequent metabolic
activity and reproduction may be damaged.
Quantification of the true viable biomass of an environmental sample, defined
as cells that have the capability of metabolic activity and reproduction is currently
not experimentally accessible since all experimental methods used to determine
viability each have their own intrinsic biases and limitations. Due to the
well-documented difficulty of obtaining growth of environmental cells under
laboratory conditions we contend that our method of measuring endospore
germination gives an easy and reliable measurement of viability. We have
demonstrated that DPA release can be observed using EVA, based on bulk
spectroscopic analysis and direct microscopic enumeration. Rather than requiring
full outgrowth before enumeration, we probe for viability much earlier, during stage
I germination when DPA is released and water begins to enter the core. Germination
and colony formation assays are complementary in that they set experimentally
tractable upper and lower bounds for the viable endospore population. For a given
population of endospores, a subset will germinate and a subset of the population
capable of germination will form colonies. We have previously demonstrated the

268
reproducible correlation of germination-capable populations to culturable
populations46, and we contend that germination is a good indicator of endospore
viability. In this study, we define the viable fraction as the ratio of
germination-capable and total endospore concentrations, and we investigate the
longevity of endospores by looking at their total population, viability, germinability
as well as the culturable fractions, as shown in the Venn diagram (Figure 8.15).
Both the germinable and culturable counts are very low in our study. One of
the reasons may be non optimal germination conditions for psychrophilic spores.
Another experiment performed by our group has demonstrated that psychrophilic
spores do not respond to conventional germinants, such as L-alanine and arginine,
glucose, etc. A more thorough study should be carried out to characterize the
germination kinetics of psychrophilic spores.
8.5.3 Toward endospore longevity experiments
The experimental results presented above clearly demonstrate the utility of spectro-
and µEVA experiments to determine germinating and total endospore
concentrations in Greenland ice cores. The particular Greenland ice core sample
used in this investigation was obtained from a depth of ~94 m and is estimated to be
295 years old. As we obtain additional allocations of ice cores from increasingly
269
older layers, we will be able to evaluate the viability decay of endospores in ices. In
the case that the initial viable fraction (Vi) at the time of deposition is constant
across various age samples, and decays exponentially with time (t) at a rate (k), we
would expect to observe a viable fraction decay (V) following equation (2).
V V e (2)
Regarding the underlying assumption that Vi is constant for samples from all
depths, we acknowledge that the initial viable fraction (Vi) for a given sample will
depend on the spore-forming species, sporulation conditions, and exposure to
environmental conditions prior to deposition. However, given a large enough
population sampled per experiment, we contend that the average Vi will not vary
with ice core depth, thus enabling the viability decay experiment. Another
assumption in the interpretation of putative viability decay data in terms of
endospore longevity is that the spores are lying dormant while embedded in the ice
core. While this assumption is generally well accepted, we note that bacteria have
been found to be metabolically active in Arctic Sea ices down to -20 °C81,82 found
no evidence of a minimum metabolic threshold and estimated 10 cellular carbon
turnovers per billion years at -40°C. Rejuvenation of endospore populations through
germination, repair, and sporulation cycles on the time scale of endospore longevity
would yield viability depth data that are flat.
270
In microbiology, the definition of viability is often plagued with the presence
of microbes existing in a viable-but-not-germinable state. This phenomenon is made
more complicated when studying microbes residing in extreme environments
because of the low culturability of extremophiles and the abundance of endospores.
Endospores are ubiquitous in most extreme environments on Earth. Despite the
broad application of culture-independent techniques for the analysis of endospores
in a wide range of these extreme habitats, little information is available on their
viability because of 3 major problems: (1) endospores exhibited very low or null
metabolism, making metabolic and microcalorimetric assays impossible; (2)
endospores escape from fluorescence staining because their spore coat is high
unsusceptible to most types of staining without a rigorous pre-treatment process; (3)
the resistant spore coat poses a challenge to extract DNA via cell lysis and therefore
endospores tend to escape from molecular biology methods. Even if they are lysed,
their DNA content is usually much lower than that of vegetative cells; (4) the
difficulty in differentiating methods. All in all, endospore viability assignment is a
very challenging task in extreme environments.
In this study, the viability of endospores inhabiting GISP2 ice cores, Lake Vida
and permafrost were analyzed by a combination of experiments in terms of
culturability, germinability and microscopic total cell counts. Based on our
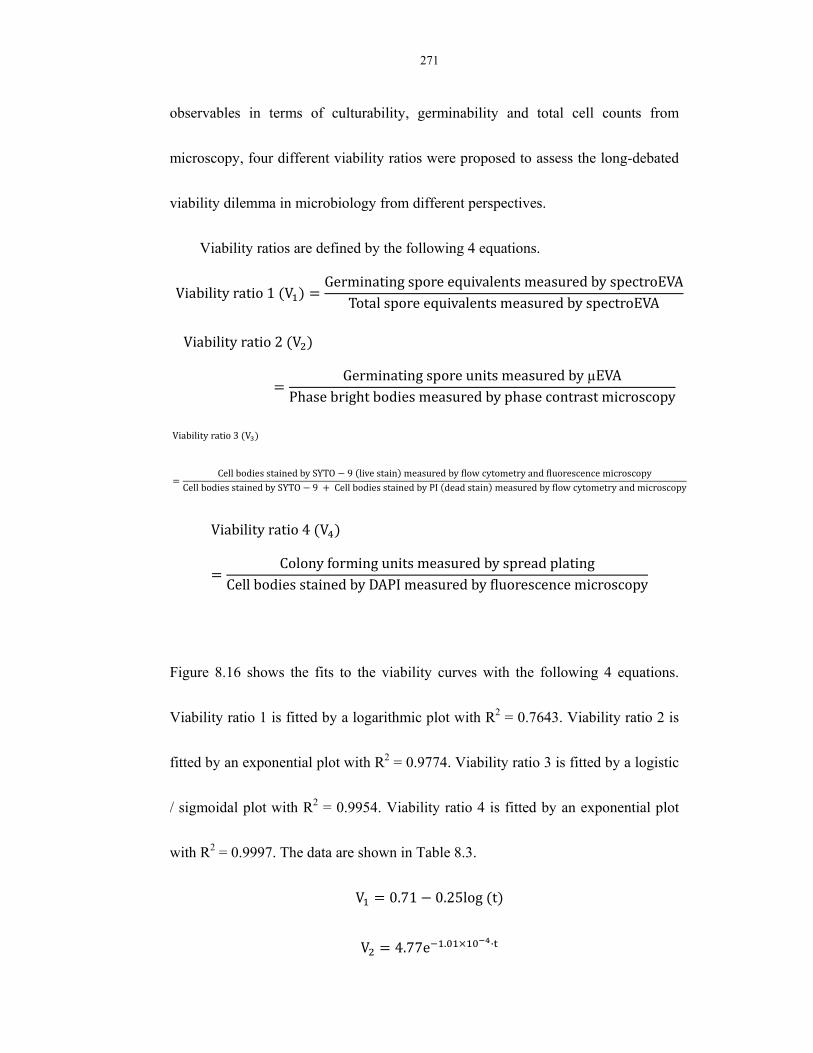
271
observables in terms of culturability, germinability and total cell counts from
microscopy, four different viability ratios were proposed to assess the long-debated
viability dilemma in microbiology from different perspectives.
Viability ratios are defined by the following 4 equations.
Viability ratio 1 VGerminating spore equivalents measured by spectroEVA
Total spore equivalents measured by spectroEVA
Viability ratio 2 V
Germinating spore units measured by µEVAPhase bright bodies measured by phase contrast microscopy
Viability ratio 3 V
Cell bodies stained by SYTO 9 live stain measured by flow cytometry and fluorescence microscopyCell bodies stained by SYTO 9 Cell bodies stained by PI dead stain measured by flow cytometry and microscopy
Viability ratio 4 V
Colony forming units measured by spread platingCell bodies stained by DAPI measured by fluorescence microscopy
Figure 8.16 shows the fits to the viability curves with the following 4 equations.
Viability ratio 1 is fitted by a logarithmic plot with R2 = 0.7643. Viability ratio 2 is
fitted by an exponential plot with R2 = 0.9774. Viability ratio 3 is fitted by a logistic
/ sigmoidal plot with R2 = 0.9954. Viability ratio 4 is fitted by an exponential plot
with R2 = 0.9997. The data are shown in Table 8.3.
V 0.71 0.25log t
V 4.77e . ·
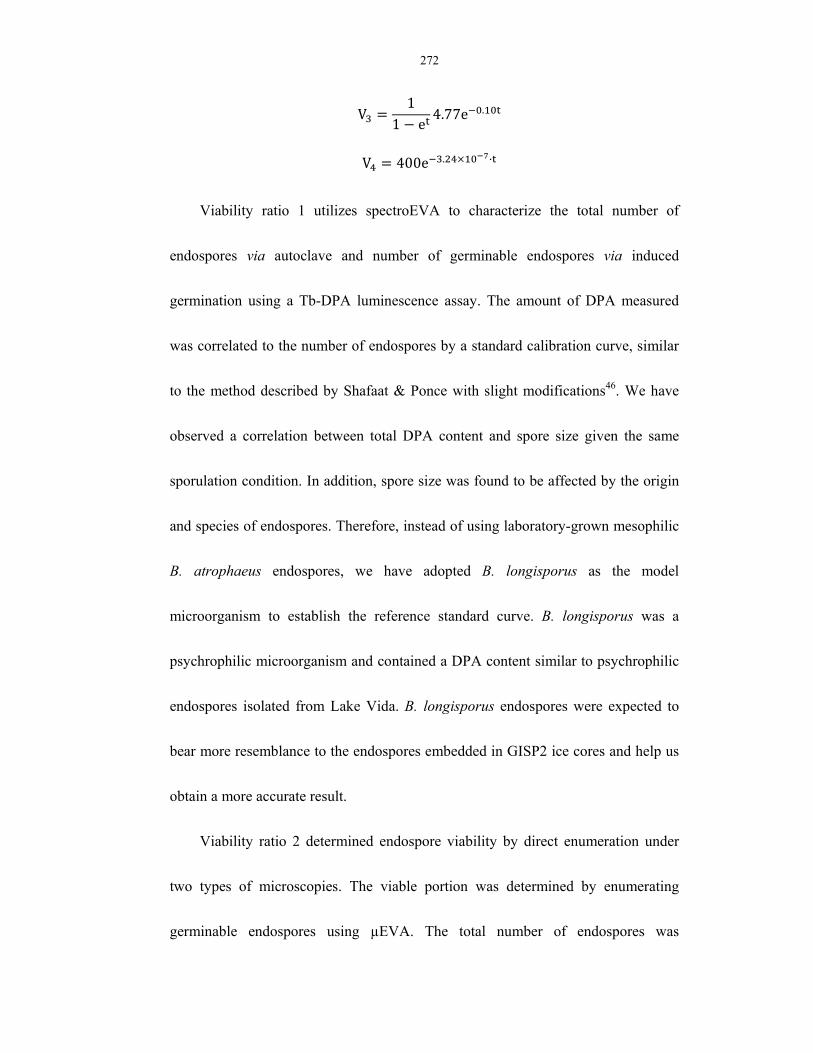
272
V1
1 e 4.77e .
V 400e . ·
Viability ratio 1 utilizes spectroEVA to characterize the total number of
endospores via autoclave and number of germinable endospores via induced
germination using a Tb-DPA luminescence assay. The amount of DPA measured
was correlated to the number of endospores by a standard calibration curve, similar
to the method described by Shafaat & Ponce with slight modifications46. We have
observed a correlation between total DPA content and spore size given the same
sporulation condition. In addition, spore size was found to be affected by the origin
and species of endospores. Therefore, instead of using laboratory-grown mesophilic
B. atrophaeus endospores, we have adopted B. longisporus as the model
microorganism to establish the reference standard curve. B. longisporus was a
psychrophilic microorganism and contained a DPA content similar to psychrophilic
endospores isolated from Lake Vida. B. longisporus endospores were expected to
bear more resemblance to the endospores embedded in GISP2 ice cores and help us
obtain a more accurate result.
Viability ratio 2 determined endospore viability by direct enumeration under
two types of microscopies. The viable portion was determined by enumerating
germinable endospores using µEVA. The total number of endospores was
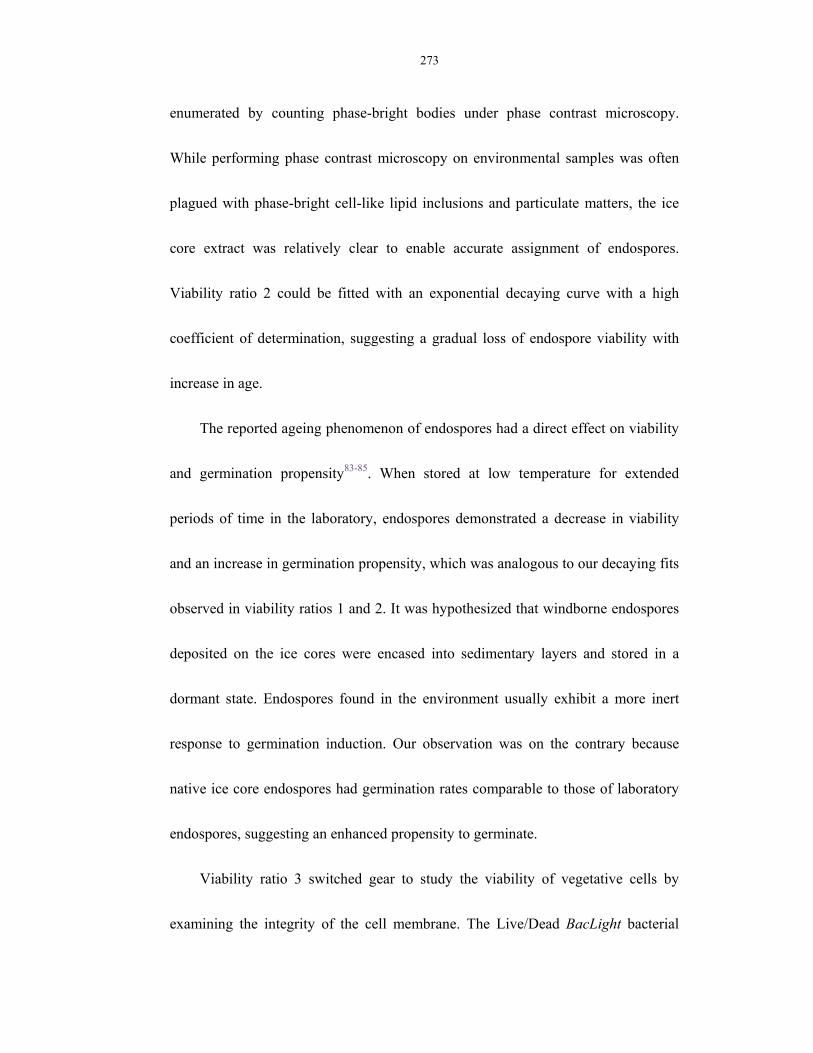
273
enumerated by counting phase-bright bodies under phase contrast microscopy.
While performing phase contrast microscopy on environmental samples was often
plagued with phase-bright cell-like lipid inclusions and particulate matters, the ice
core extract was relatively clear to enable accurate assignment of endospores.
Viability ratio 2 could be fitted with an exponential decaying curve with a high
coefficient of determination, suggesting a gradual loss of endospore viability with
increase in age.
The reported ageing phenomenon of endospores had a direct effect on viability
and germination propensity83-85. When stored at low temperature for extended
periods of time in the laboratory, endospores demonstrated a decrease in viability
and an increase in germination propensity, which was analogous to our decaying fits
observed in viability ratios 1 and 2. It was hypothesized that windborne endospores
deposited on the ice cores were encased into sedimentary layers and stored in a
dormant state. Endospores found in the environment usually exhibit a more inert
response to germination induction. Our observation was on the contrary because
native ice core endospores had germination rates comparable to those of laboratory
endospores, suggesting an enhanced propensity to germinate.
Viability ratio 3 switched gear to study the viability of vegetative cells by
examining the integrity of the cell membrane. The Live/Dead BacLight bacterial
274
viability was used. It consists of the green SYTO-9 and red PI. SYTO 9 stained both
live and dead vegetative bacteria but PI only penetrated bacteria with damaged
membranes. Therefore healthy and live vegetative cells were stained green and dead
cells were stained red. The proportion of green and red stained cell bodies was
quantified by a combination of flow cytometry and epifluorescence microscopy.
Endospores were precluded from measurement because of their unstainable cell coat.
Except for a ~50% viability ratio at 295 m depth, the rest of the samples elicited a
sigmoidal fit, with higher viability towards deeper depths. While it might sound
counterintuitive, we postulated that the membrane-compromised cells were
susceptible to remain intact physiologically at times of analysis. The cellular
materials disintegrated and the cell ceased to exist in the form of an intact body
during the course of preservation or during the melting, filtration and staining
processes. And the rate of membrane susceptibility was positively corrected to
depths. At lower depths, fewer “dead” cells remained intact enough to be stained
and therefore the ratio of live to dead vegetative cells increased with increasing age.
To avoid underestimation of ultra small cells (i.e., < 1 µm), we have also
enumerated the samples using a 100× objective under epifluorescence to compare
with the flow cytometry results. No significant differences were observed in the
measurement of viability ratio.
275
Viability ratio 4 addressed the VBNC phenomenon in ice cores by looking at
the colony-forming units normalized by the total cell counts by DAPI staining.
Apart from a culturability ratio of 10-4 at the shallow depth at 295m, all the other
depths recorded ratios approximately equal to 10-6. That meant about 1 out of 1
million cells could be recovered on agar plate. This low culturable ratio was
consistent with cultivation studies in other extreme environments on Earth. The
replication pathway was damaged over hundreds of thousands of years.
These are preliminary results based on analysis on ice cores from 10,000 to
110,000 years of age. More data will be collected on ice cores from different depths to
test our hypothesis. Bacterial endospore is among one of the most interesting
extremophiles due to its resistance, ubiquity and longevity. And GISP2 ice core offers
a sedimentary time capsule in which ancient genetic materials; endospores and
biological remnants of the past can be retrieved. A thorough µEVA study of the
viability of endospores at each depth will give us with a unique window to understand
analogous extreme environments in other celestial bodies, such as Martian permafrost,
ice on the Jovian moon Europa, lunar ice and other frozen planetary bodies, and
evaluate the possibility of interplanetary microbial transfer via impact ejecta86 by
determining the maximum period of time of that dormant endospores can retain
viability.
276
8.5.4 Our results in the context of literature reports
Our results fall within the range of reported microbial abundance values in glacial
ice meltwater, 100 to 104 viable microbes per milliliter of ice core meltwater4,6,9,87-91.
Miteva and colleagues found spore formers among the isolates acquired from GISP2
3,043 m, a visibly silty layer, which had a total microbial concentration of 1 to 9 ×
107 cells/mL36-38. However, they note that spore formers were not dominant in their
culture collection. Spore-forming bacteria have also been isolated from 750,000
year old Guliya ice35 and from a Malan Glacier ice core (0-102m)39,40. While spore
formers have been previously isolated from deep ice cores, no studies have been
previously undertaken to determine the abundance of the endospores themselves in
these systems. Our DAPI stained fluorescence enumeration in correlation with
spectroEVA data suggest that endospores are ~10% of the total bacterial population
in this GISP2 sample. This is the first study that assesses the ratio of spore formers
to the total bacteria population in any ice core sample.
The age of ice cores from Vostok Station increases with increasing depth with
2,750 m, corresponding to an age of ~240,000 years. The microorganism
distribution as a function of depth (1,500 to 2,750 m) was examined for both viable
and total number of cells using radioactive carbon consumption and direct
microscopic enumeration, respectively92. This data corroborated their earlier finding
277
that viability, as assessed by cfu mL-1, decreased with increasing depth from 0 to
2,400 m. It was also noted that in all layers below 500 m only spore forming
bacteria were able to form colonies2. Overall the authors showed a decreasing
probability of finding viable microorganisms with increasing depth. A unique
attribute of the spectroEVA measurement is that both the viable and total endospore
concentrations can be measured. This enables us to calculate the viable fraction of
endospores within a given sample. Considering that the total concentrations of
microorganisms vary over several orders of magnitude, the viable fraction is the
relevant measurement to glean viability decays from ice cores.
8.5.5 Insights from Lake Vida analysis
Lake Vida presents a greater than GISP2 ice cores in determining the concentration
of DPA using Spectro-EVA because of background interference and the quenching
of fluorescence. So, prior to spectro-EVA analysis, a DPA extraction protocol based
on ethyl acetate phase separation has been performed. Using this method, the
dual-peak spectral characteristics of DPA can be observed in the excitation spectrum
with an improved Euclidean cosine squared correlation coefficient from 0.45 to 0.84.
This is the first application of Tb-DPA luminescence assay on the analysis of Lake
Vida brine water. We have isolated a spore-forming isolate from Lake Vida which
278
contained 2 endospores per sporulating mother cell, which hinted at other
evolutionary roles of endospores. Endospores considered as only a stage in the life
cycle for the microorganisms to survive through unfavorable environments. The cell
would have died if it did not undergo sporulation without a role in reproduction.
Endospore formation has long been suggested to be an autogamic process. During
sporulation, a diploid phase was observed in our isolate and it might confer a genetic
advantage upon the microorganism, representing a primitive form of recombination
and segregation. Producing a large number of offspring in times of unfavorable
conditions is not an evolutionarily competitive strategy. But it would be
advantageous to the spore-forming bacteria if genetic differences are observed in the
two spores. Further studies on this species will glean us useful information on the
reproduction mechanism of endospores.
8.5.6 Insights from permafrost analysis
Plate count is the only method to assess bacterial endospore viability in routine
microbiological analysis. Although culturing is an easy way to verify the
multiplicative growth capacity of endospores, colony formation requires several
hours, and its efficiency is highly debatable due to the VBNC state. In this study, we
aim to complement traditional culturing with a variety of culture-independent
279
methods to evaluate viability of endospores as well as other psychrophilic and
halophilic microorganisms entombed in the permafrost matrix.
The conventional heat-shock temperature 80°C was shown to be too high to
screen for endospores. In this experiment, all endospores were inactivated at 80°C
as all cultivation, µEVA, CTC staining, and ATP assay were reported negative. We
have chosen a lower temperature 60°C to kill off vegetative cells and screen for
endospores. In the CTC respiratory experiment, we have observed a gradual staining
of red cells over time. The surviving endospores were undergoing respiration, which
reduced CTC via electron transport activity for form a fluorescent and insoluble
CTC-formazan. It accumulates intracellularly and reflected transition of the shape of
the cells. In the first 24 hours of incubation, the stained cells all shared an
endospore-like morphology – oval and small. As time progressed, the stained cells
grew in size and transitioned from oval to filamentous and rod shaped, resembling
vegetative cells. After 7 days of incubation, a huge increase in the cell number was
observed, which was consistent with the corresponding increase in ATP level
measured separately. Dormant endospores were not stainable by fluorescent dyes,
but after addition of combinations of L-alanine and TSB, endospores quickly
became stainable by fluorescent markers and DNA-binding dyes. This indicated
280
activation of lytic enzymes and an increase in permeability of the spore membranes,
both of which are events in the process of spore germination.
We conclude the application of a suite of comprehensive endospore detection
methodologies in permafrost. The mechanisms that preserve endospore viability at
subzero temperature, and in highly halophilic permafrost with water phase near zero
on Earth probably also extend to environments beyond the planet Earth, such as the
frozen subsurface environments that may house past or extinct life in Mars and
Europa43,44,93. Recent data from the Mars Global Surveyor mission suggest the
possibility of permafrost or perhaps liquid water under the Martian surface13. The
results in this study shed light for the development of future exobiological
life-detection technologies.
8.6. Conclusion
Both spectro- and µEVA methods are sensitive enough to determine the
trace endospore concentrations capable of germination in Greenland GISP2 ice
cores. In addition, spectroEVA was used to determine the viable fraction (i.e., the
fraction of endospores capable of germination under experimental conditions) by
quantifying both germination-capable and total endospore concentrations. Since
spectro- and µEVA assays require germination for detection, these assays can be
281
completed on the timescale of minutes for µEVA and hours for spectroEVA
experiments. This is in marked contrast to the months of incubation required for
colony formation. We have also described the application of a combination of
culture-based and culture-independent assays on endospores in extreme cold
biospheres on Earth, including GISP2 (Green Ice Sheet Project 2) ice cores,
Antarctic underground frozen brine Lake Vida, and polar permafrost. Apart from the
Tb-DPA luminescence assays, a lot of other methods such as metabolic dyes,
bioluminescence and flow cytometry are explored to determine viability of the
resident microbes. 4 different viability ratios have been obtained independently
based on different measurables in terms of culturability, germinability and total
microscopy counts to characterize the microbial abundance and viability in each of
these cold habitats. In particular, a transect of 12 depths extending from 295 to
110,000 years old have been analyzed to shed light on the longevity of the most
resistant life form, i.e., endospores, in the best storage repository on Earth.
The proof-of-principle experiments reported here will enable us to measure
endospore viability decays in ice cores. Strong experimental evidence of endospore
longevity greater than 105 or 106 years would be a milestone in microbiology. A
precedent that life can be stored in a viable form on a geological timescale would
have profound implications in astrobiology. In particular, extreme longevity of
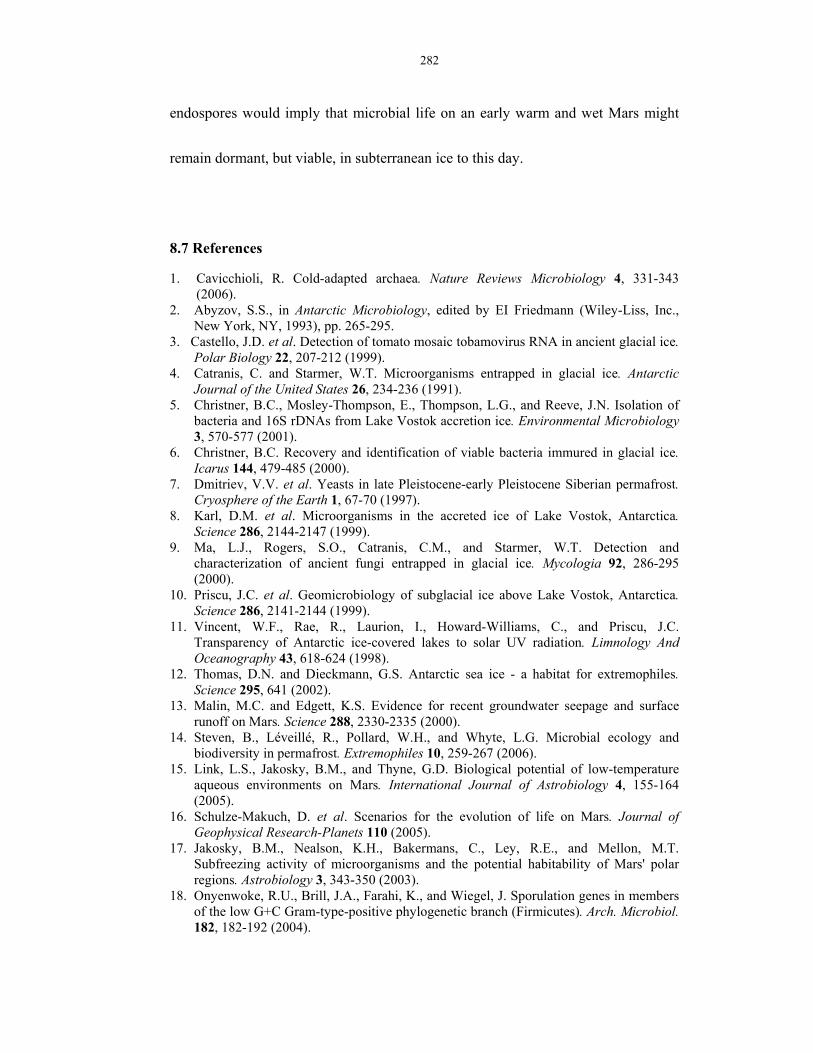
282
endospores would imply that microbial life on an early warm and wet Mars might
remain dormant, but viable, in subterranean ice to this day.
8.7 References
1. Cavicchioli, R. Cold-adapted archaea. Nature Reviews Microbiology 4, 331-343 (2006).
2. Abyzov, S.S., in Antarctic Microbiology, edited by EI Friedmann (Wiley-Liss, Inc., New York, NY, 1993), pp. 265-295.
3. Castello, J.D. et al. Detection of tomato mosaic tobamovirus RNA in ancient glacial ice. Polar Biology 22, 207-212 (1999).
4. Catranis, C. and Starmer, W.T. Microorganisms entrapped in glacial ice. Antarctic Journal of the United States 26, 234-236 (1991).
5. Christner, B.C., Mosley-Thompson, E., Thompson, L.G., and Reeve, J.N. Isolation of bacteria and 16S rDNAs from Lake Vostok accretion ice. Environmental Microbiology 3, 570-577 (2001).
6. Christner, B.C. Recovery and identification of viable bacteria immured in glacial ice. Icarus 144, 479-485 (2000).
7. Dmitriev, V.V. et al. Yeasts in late Pleistocene-early Pleistocene Siberian permafrost. Cryosphere of the Earth 1, 67-70 (1997).
8. Karl, D.M. et al. Microorganisms in the accreted ice of Lake Vostok, Antarctica. Science 286, 2144-2147 (1999).
9. Ma, L.J., Rogers, S.O., Catranis, C.M., and Starmer, W.T. Detection and characterization of ancient fungi entrapped in glacial ice. Mycologia 92, 286-295 (2000).
10. Priscu, J.C. et al. Geomicrobiology of subglacial ice above Lake Vostok, Antarctica. Science 286, 2141-2144 (1999).
11. Vincent, W.F., Rae, R., Laurion, I., Howard-Williams, C., and Priscu, J.C. Transparency of Antarctic ice-covered lakes to solar UV radiation. Limnology And Oceanography 43, 618-624 (1998).
12. Thomas, D.N. and Dieckmann, G.S. Antarctic sea ice - a habitat for extremophiles. Science 295, 641 (2002).
13. Malin, M.C. and Edgett, K.S. Evidence for recent groundwater seepage and surface runoff on Mars. Science 288, 2330-2335 (2000).
14. Steven, B., Léveillé, R., Pollard, W.H., and Whyte, L.G. Microbial ecology and biodiversity in permafrost. Extremophiles 10, 259-267 (2006).
15. Link, L.S., Jakosky, B.M., and Thyne, G.D. Biological potential of low-temperature aqueous environments on Mars. International Journal of Astrobiology 4, 155-164 (2005).
16. Schulze-Makuch, D. et al. Scenarios for the evolution of life on Mars. Journal of Geophysical Research-Planets 110 (2005).
17. Jakosky, B.M., Nealson, K.H., Bakermans, C., Ley, R.E., and Mellon, M.T. Subfreezing activity of microorganisms and the potential habitability of Mars' polar regions. Astrobiology 3, 343-350 (2003).
18. Onyenwoke, R.U., Brill, J.A., Farahi, K., and Wiegel, J. Sporulation genes in members of the low G+C Gram-type-positive phylogenetic branch (Firmicutes). Arch. Microbiol. 182, 182-192 (2004).

283
19. Nicholson, W.L., Munakata, N., Horneck, G., Melosh, H.J., and Setlow, P. Resistance of Bacillus endospores to extreme terrestrial and extraterrestrial environments. Microbiol. Mol. Biol. Rev. 64, 548-572 (2000).
20. Keynan, A., Evenchik, Z., Gould, G.W., and Hurst, A. The Bacterial Spore. Vol 2, 1?8 (1983).
21. Horneck, G., Bucker, H., and Reitz, G. Long-term survival of bacterial spores in space. Adv. Space Res. 14 (10), 41-45 (1994).
22. Hoch, J.A. and Losick, R. Panspermia, Spores and the Bacillus subtilis genome. Nature 390, 237-238 (1997).
23. Kennedy, M.J., Reader, S.L., and Swierczynski, L.M. Preservation records of microorganisms - evidence of the tenacity of life. Microbiol-UK 140, 2513-2529 (1994).
24. Parsons, P. Dusting off panspermia. Nature 383, 221-222 (1996). 25. Horneck, G. The microbial world and the case for Mars. Planet. Space. Sci. 48,
1053-1063 (2000). 26. Abyzov, S.S. et al. Antarctic ice sheet as an object for methodological problems of
exobiology. Adv. Space Res. 23, 371-376 (1999). 27. Gest, H., Mandelstam, J. Longevity of microorganisms in natural environments.
Microbiol. Sci. 4, 69-71 (1987). 28. Potts, M. Desiccation Tolerance of Prokaryotes. Microbiol. Rev. 58, 755-805 (1994). 29. Sneath, P.H. Longevity of micro-organisms. Nature 195, 643-646 (1962). 30. Cano, R.J. and Borucki, M.K. Revival and Identification of Bacterial-Spores in
25-Million- Year-Old to 40-Million-Year-Old Dominican Amber. Science 268, 1060-1064 (1995).
31. Vreeland, R.H., Rosenzweig, W.D., and Powers, D.W. Isolation of a 250 million-year-old halotolerant bacterium from a primary salt crystal. Nature 407, 897-900 (2000).
32. Willerslev, E., Hansen, A.J., and Poinar, H.N. Isolation of nucleic acids and cultures from fossil ice and permafrost. Trends Ecol. Evol. 19, 141-147 (2004).
33. Lozina-Lozinski, L., (Nauka, Leningrad, 1972), pp. 288. 34. Llano, G., presented at the Proceeding of the Colloquium on Conservation Problems in
Antarctica, Lawrence, Kansas, 1972 (unpublished). 35. Christner, B.C., Mosley-Thompson, E., Thompson, L.G., and Reeve, J.N. Bacterial
recovery from ancient glacial ice. Environ. Microbiol. 5, 433-436 (2003). 36. Miteva, V.I. and Brenchley, J.E. Detection and isolation of ultrasmall microorganisms
from a 120,000-year-old Greenland glacier ice core. Appl. Environ. Microbiol. 71, 7806-7818 (2005).
37. Miteva, V.I., Sheridan, P.P., and Brenchley, J.E. Phylogenetic and physiological diversity of microorganisms isolated from a deep Greenland glacier ice core. Appl. Environ. Microbiol. 70, 202-213 (2004).
38. Sheridan, P.P., Miteva, V.I., and Brenchley, J.E. Phylogenetic analysis of anaerobic psychrophilic enrichment cultures obtained from a Greenland glacier ice core. Appl. Environ. Microbiol. 69, 2153-2160 (2003).
39. Zhang, X.J., Yao, T.D., Ma, X.J., and Wang, N.L. Microorganisms in a high altitude glacier ice in Tibet. Folia Microbiol. 47, 241-245 (2002).
40. Zhang, X.J., Yao, T.D., Ma, X.J., and Wang, N.L. Analysis of the characteristics of microorganisms packed in the ice core of Malan glacier, Tibet, China. Sci. China Ser. D. 44, 369-374 (2001).
41. Friedmann, E.I., in Viable Microorganisms in Permafrost, edited by D. A. Gilichinsky (Russian Academy of Science, Pushchino, Russia, 1994), pp. 21-26.
42. Morita, R.Y., Bacteria in Oligotrophic Environments: Starvation-Survival Lifestyle. (Chapman & Hall, New York, 1997).
43. Gilichinsky, D. et al. Biodiversity of cryopegs in permafrost. FEMS Microbiology Ecology 53, 117-128 (2005).
284
44. Rivkina, E. et al. Microbial life in permafrost. Advances in Space Research 33, 1215-1221 (2004).
45. Yung, P.T., Kempf, M.J., and Ponce, A., presented at the IEEE Aerospace Conference, Big Sky, Montana, 2006 (unpublished).
46. Shafaat, H.S. and Ponce, A. Applications of a rapid endospore viability assay for monitoring UV inactivation and characterizing Arctic ice cores. Applied and Environmental Microbiology 72, 6808-6814 (2006).
47. Gould, G.W. and Hurst, A., The Bacterial Spore. (Academic Press, New York, 1969). 48. Hills, G.M. Chemical Factors In The Germination Of Spore-Bearing Aerobes - The
Effect Of Yeast Extract On The Germination Of Bacillus-Anthracis And Its Replacement By Adenosine. Biochem. J. 45, 353-362 (1949).
49. Hills, G.M. Chemical Factors In The Germination Of Spore-Bearing Aerobes - The Effects Of Amino-Acids On The Germination Of Bacillus-Anthracis, With Some Observations On The Relation Of Optical Form To Biological Activity. Biochem. J. 45, 363-370 (1949).
50. Hills, G.M. Chemical Factors In The Germination Of Spore-Bearing Aerobes - Observations On The Influence Of Species, Strain And Conditions Of Growth. J. Gen. Microbiol. 4, 38-47 (1950).
51. Setlow, P. Spore germination. Curr. Opin. Microbiol. 6, 550-556 (2003). 52. Sacks, L.E. Chemical germination of native and cation-exchanged bacterial-spores with
trifluoperazine. Appl. Environ. Microbiol. 56, 1185-1187 (1990). 53. Woese, C. and Morowitz, H.J. Kinetics of the release of dipicolinic acid from spores of
Bacillus subtilis. J. Bacteriol. 76, 81-83 (1958). 54. Hurwitz, S.J. and McCarthy, T.J. 2, 3, 5-Triphenyltetrazolium chloride as a novel tool
in germicide dynamics. Journal of Pharmaceutical Sciences 75, 912-916 (1986). 55. Rogers, S.O. et al. Comparisons of protocols for decontamination of environmental ice
samples for biological and molecular examinations. Appl. Environ. Microbiol. 70, 2540-2544 (2004).
56. Christner, B.C., Mikucki, J.A., Foreman, C.M., Denson, J., and Priscu, J.C. Glacial ice cores: A model system for developing extraterrestrial decontamination protocols. Icarus 174, 572-584 (2005).
57. Juck, D.F. et al. Utilization of fluorescent microspheres and a green fluorescent protein-marked strain for assessment of microbiological contamination of permafrost and ground ice core samples from the Canadian High Arctic. Applied and Environmental Microbiology 71, 1035 (2005).
58. Smith, H.D. and McKay, C.P. Drilling in ancient permafrost on Mars for evidence of a second genesis of life. Planetary and Space Science 53, 1302-1308 (2005).
59. Ferrara-Guerrero, M.J., Marty, D.G., and Bianchi, A., in Handbook of Methods in Aquatic Microbial Ecology, edited by P. Kemp (Lewis Publishers, Boca Raton, FL, 1993), pp. 9-19.
60. Knowles, R. and Barraquio, W.L., in Methods of Soil Analysis, Part 2. Microbiological and Biochemical Properties (Madison, WI, 1994), pp. 179-197.
61. Epstein, S.S. and Rossel, J. Enumeration of sandy sediment bacteria: Search for optimal protocol. Marine Ecology Progress Series. Oldendorf 117, 289-298 (1995).
62. Turley, C.M., in Handbook of Methods in Aquatic Microbial Ecology edited by P.F. Kemp, Sherr, B.F., Sherr, E.B. and Cole, J.J. (Lewis Publishers, Boca Raton, 1993), pp. 143-147.
63. Li, J., Hibbert, D.B., Fuller, S., and Vaughn, G. A comparative study of point-to-point algorithms for matching spectra. Chemometrics and Intelligent Laboratory Systems 82, 50-58 (2006).
64. Hashimoto, T., Frieben, W.R., and Conti, S.F. Microgermination of Bacillus cereus spores. J. Bacteriol. 100, 1385-1392 (1969).
65. Hashimoto, T., Frieben, W.R., and Conti, S.F. Germination of single bacterial spores. J. Bacteriol. 98, 1011-1020 (1969).
285
66. Vary, J.C. and Halvorson, H.O. Kinetics of germination of Bacillus spores. J. Bacteriol. 89, 1340-1347 (1965).
67. Sheridan, P.P. Phylogenetic analysis of anaerobic psychrophilic enrichment cultures obtained from a Greenland glacier ice core. Applied and environmental microbiology 69, 2153 (2003).
68. Yung, P.T., Shafaat, H.S., Connon, S.A., and Ponce, A. Quantification of viable endospores from a Greenland ice core. FEMS Microbiology Ecology 59, 300-306 (2007).
69. Warth, A.D. Liquid chromatographic determination of dipicolinic acid from bacterial spores. Applied and Environmental Microbiology 38, 1029-1033 (1979).
70. Fichtel, J., Koster, J., Rullkotter, J., and Sass, H. Spore dipicolinic acid contents used for estimating the number of endospores in sediments. FEMS Microbiology Ecology 61, 522-532 (2007).
71. Gest, H., Mandelstam, J. Longevity of microorganisms in natural environments. Microbiological Science 4, 69-71 (1987).
72. Nicholson, W.L., in Bacterial Spore Formers: Probiotics and Emerging Applications, edited by E. Ricca, A. O. Henriques, and S. M. Cutting (Horizon Scientific, Norfolk, UK, 2004), pp. 1-15.
73. Parkes, R.J. and Wellsbury, P., in Microbial Diversity and Bioprospecting, edited by A. T. Bull (ASM Press, 2004), Vol. 1000, pp. 67.
74. Parkes, R.J. A case of bacterial immortality? Nature 407, 897-900 (2000). 75. Sussman, A.S., in The Bacterial Spore, edited by G. W. Gould and A. Hurst (Academic
Press, London, England, 1969), Vol. 1, pp. 1-38. 76. Colwell, R.R. and Grimes, D.J. eds., Nonculturable Microorganisms in the
Environment. (ASM Press, Washington, DC, 2000). 77. Roszak, D.B. and Colwell, R.R. Survival Strategies of Bacteria in the
Natural-Environment. Microbiol. Rev. 51, 365-379 (1987). 78. Amann, R.I., Ludwig, W., and Schleifer, K.H. Phylogenetic Identification and in-Situ
Detection of Individual Microbial-Cells without Cultivation. Microbiol. Rev. 59, 143-169 (1995).
79. Jones, J.G. Effect of Environmental-Factors on Estimated Viable and Total Populations of Planktonic Bacteria in Lakes and Experimental Enclosures. Freshwater Biol. 7, 67-91 (1977).
80. Torsvik, V., Goksoyr, J., and Daae, F.L. High Diversity in DNA of Soil Bacteria. Appl. Environ. Microbiol. 56, 782-787 (1990).
81. Junge, K., Eicken, H., and Deming, J.W. Bacterial activity at -2 to -20 degrees C in Arctic wintertime sea ice. Appl. Environ. Microbiol. 70, 550-557 (2004).
82. Price, P.B. and Sowers, T. Temperature dependence of metabolic rates for microbial growth, maintenance, and survival. Proc. Natl. Acad. Sci. U.S.A. 101, 4631-4636 (2004).
83. Powell, J.F. Factors affecting the germination of thick suspensions of Bacillus subtilis spores in L-alanine solution. Journal of General Microbiology 4, 330-339 (1950).
84. Keynan, A. and Evenchik, Z., in The Bacterial Spore, edited by G. W. Gould and A. Hurst (Academic Press, London, England, 1969), Vol. 1, pp. 359-396.
85. Murty, G.G.K. and Halvorson, H.O. Effect of duration of heating, L-alanine and spore concentration on the oxidation of glucose by spores of Bacillus cereus var. terminalis. Journal of Bacteriology 73, 235 (1957).
86. Mileikowsky, C. et al. Natural transfer of viable microbes in space 1. From Mars to Earth and Earth to Mars. Icarus 145, 391-427 (2000).
87. Abyzov, S.S., Mitskevich, I.N., and Poglazova, M.N. Microflora of the deep glacier horizons of Central Antarctica. Microbiology 67, 451-458 (1998).
88. Gruber, S. and Jaenicke, R. Biological microparticles in the Hans Tausen ice cap, North Greenland. Meddelelser om Groland Geoscience 39, 161-163 (2001).

286
89. Li, W.H., Fraser, S.E., and Meade, T.J. A calcium-sensitive magnetic resonance imaging contrast agent. Journal of the American Chemical Society 121, 1413-1414 (1999).
90. Sharp, M. et al. Widespread bacterial populations at glacier beds and their relationship to rock weathering and carbon cycling. Geology 27, 107-110 (1999).
91. Skidmore, M.L., Foght, J.M., and Sharp, M.J. Microbial life beneath a high Arctic glacier. Applied And Environmental Microbiology 66, 3214-3220 (2000).
92. Abyzov, S.S. et al. Antarctic ice sheet as a model in search of life on other planets. Adv. Space Res. 22, 363-368 (1998).
93. Gilichinsky, D., Rivkina, E., Shcherbakova, V., Laurinavichuis, K., and Tiedje, J. Supercooled water brines within permafrost - An unknown ecological niche for microorganisms: A model for astrobiology. Astrobiology 3, 331-341 (2003).
287
Figure 8.1 | (a) Validation of ice core decontamination protocol by using a
fabricated ice core in (b) and (c) with 105 B. atrophaeus endospores (blue) smeared
on the surface and 104 B. megaterium endospores (red) embedded and frozen with
the ice. These two species were chosen due to their distinctive difference in colony
morphology. When the concentration of ultra-chlorox (6.25% sodium hypochlorite)
increased, a corresponding decrease in the number surface B. atrophaeus
endospores was measured. At full strength (100%), all of the surface endospores
were either removed or inactivated while the number of endospores in the ice core
interior remained constant.
(a) (b)
(c)
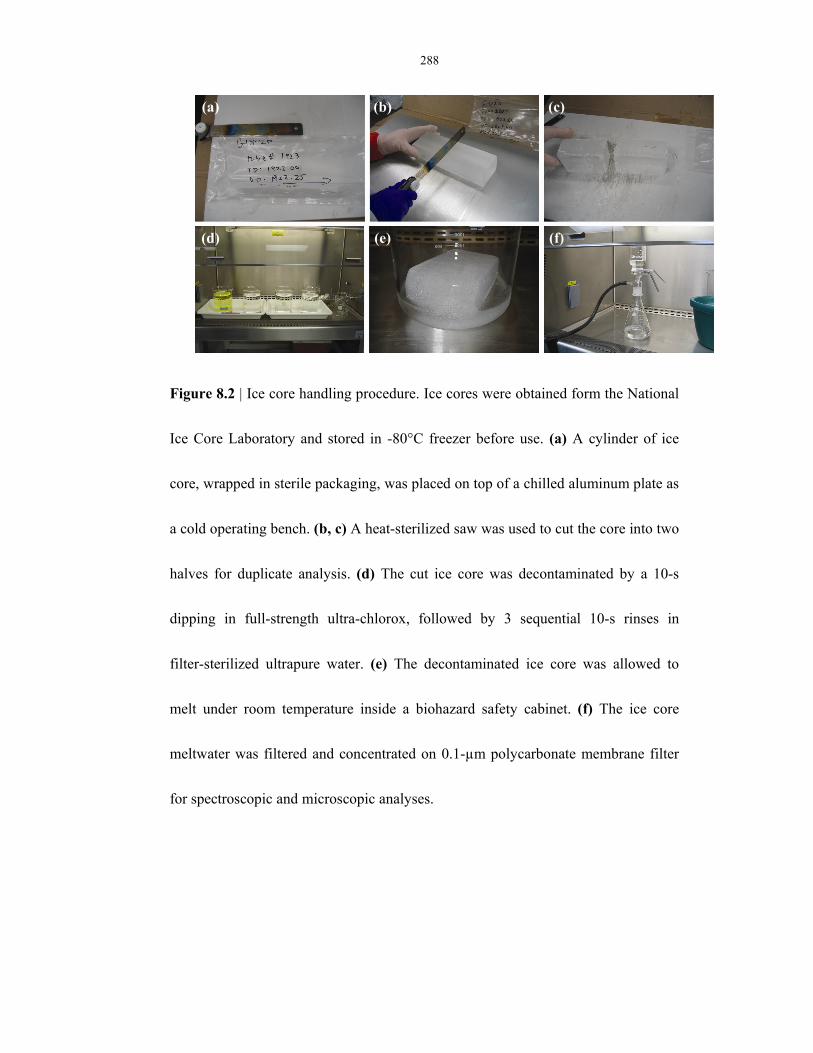
288
Figure 8.2 | Ice core handling procedure. Ice cores were obtained form the National
Ice Core Laboratory and stored in -80°C freezer before use. (a) A cylinder of ice
core, wrapped in sterile packaging, was placed on top of a chilled aluminum plate as
a cold operating bench. (b, c) A heat-sterilized saw was used to cut the core into two
halves for duplicate analysis. (d) The cut ice core was decontaminated by a 10-s
dipping in full-strength ultra-chlorox, followed by 3 sequential 10-s rinses in
filter-sterilized ultrapure water. (e) The decontaminated ice core was allowed to
melt under room temperature inside a biohazard safety cabinet. (f) The ice core
meltwater was filtered and concentrated on 0.1-µm polycarbonate membrane filter
for spectroscopic and microscopic analyses.
(a) (b) (c)
(d) (e) (f)
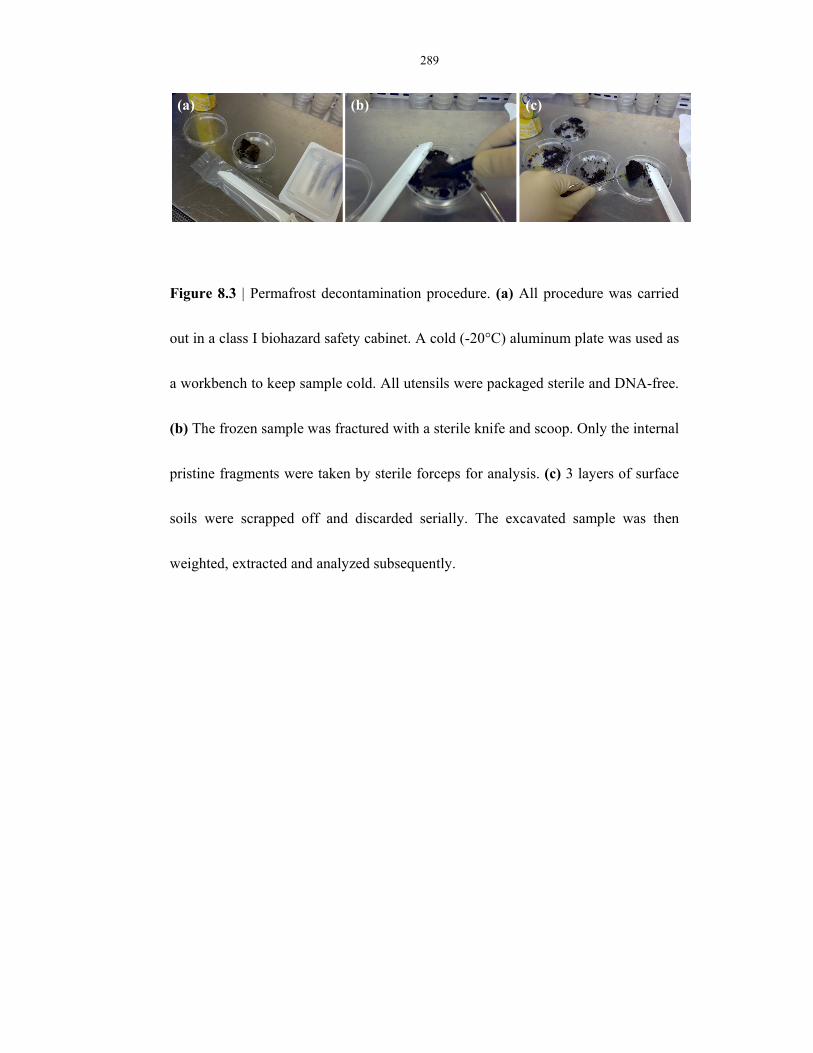
289
Figure 8.3 | Permafrost decontamination procedure. (a) All procedure was carried
out in a class I biohazard safety cabinet. A cold (-20°C) aluminum plate was used as
a workbench to keep sample cold. All utensils were packaged sterile and DNA-free.
(b) The frozen sample was fractured with a sterile knife and scoop. Only the internal
pristine fragments were taken by sterile forceps for analysis. (c) 3 layers of surface
soils were scrapped off and discarded serially. The excavated sample was then
weighted, extracted and analyzed subsequently.
(a) (b) (c)
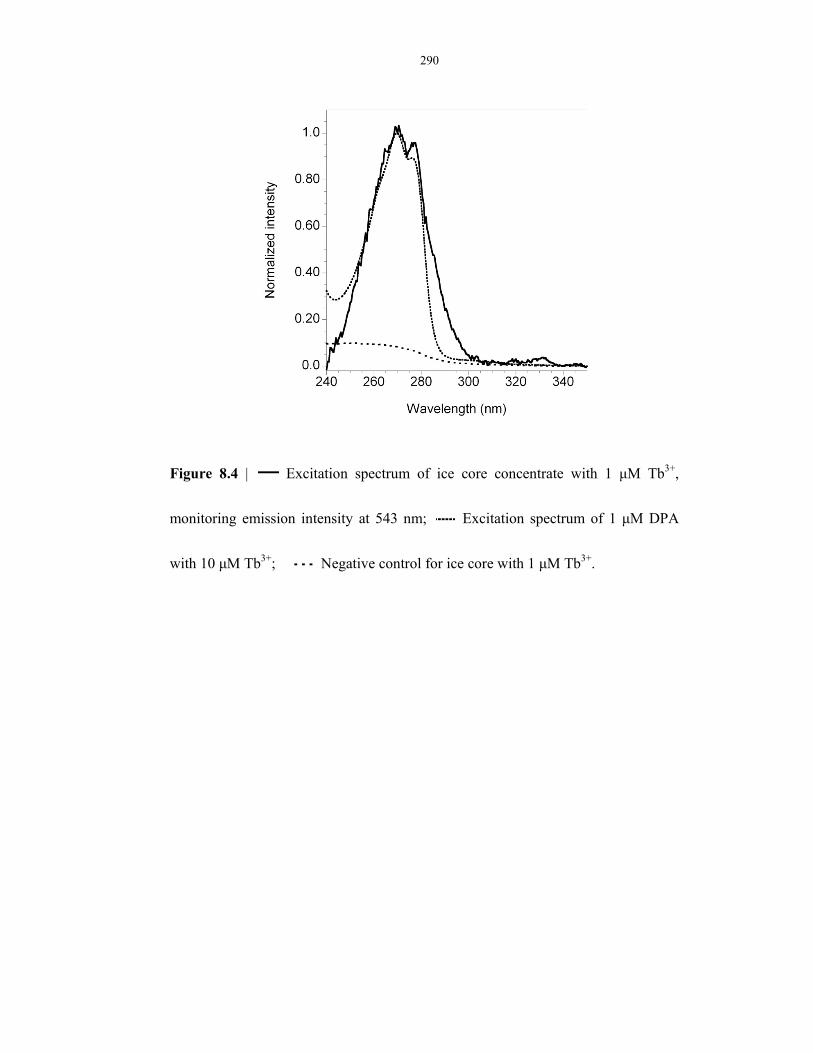
290
Figure 8.4 | Excitation spectrum of ice core concentrate with 1 μM Tb3+,
monitoring emission intensity at 543 nm; Excitation spectrum of 1 μM DPA
with 10 μM Tb3+; Negative control for ice core with 1 μM Tb3+.
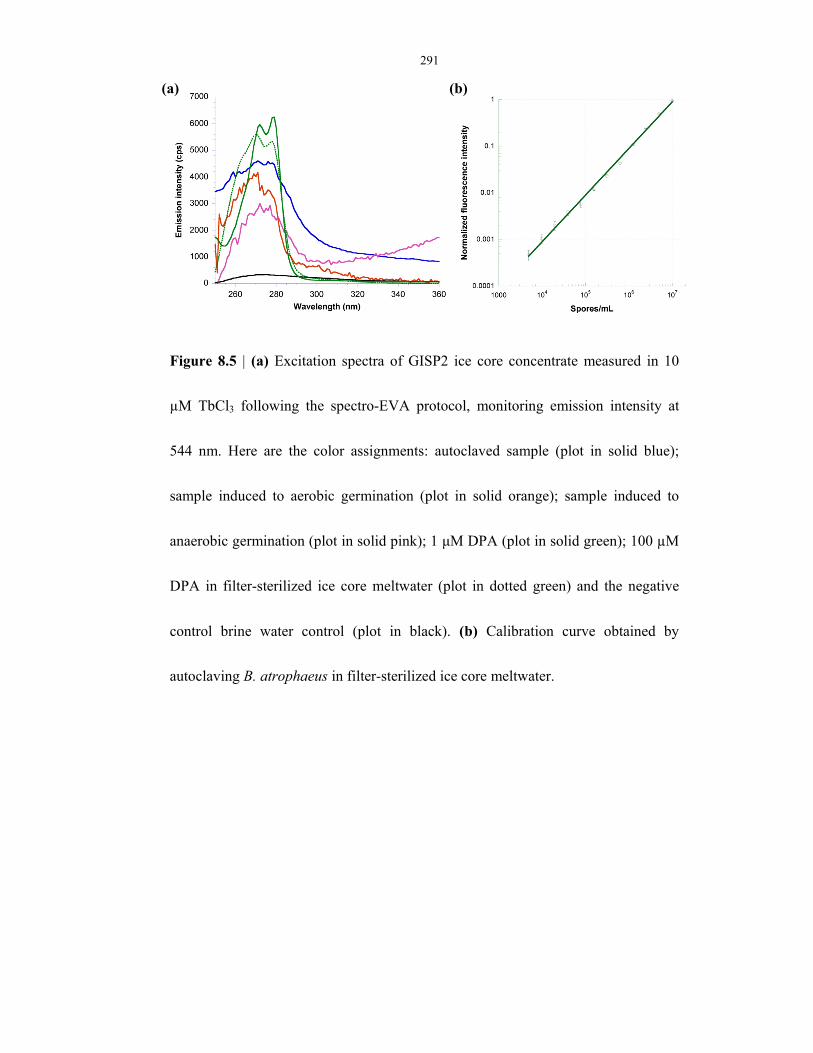
291
Figure 8.5 | (a) Excitation spectra of GISP2 ice core concentrate measured in 10
µM TbCl3 following the spectro-EVA protocol, monitoring emission intensity at
544 nm. Here are the color assignments: autoclaved sample (plot in solid blue);
sample induced to aerobic germination (plot in solid orange); sample induced to
anaerobic germination (plot in solid pink); 1 μM DPA (plot in solid green); 100 µM
DPA in filter-sterilized ice core meltwater (plot in dotted green) and the negative
control brine water control (plot in black). (b) Calibration curve obtained by
autoclaving B. atrophaeus in filter-sterilized ice core meltwater.
(a) (b)

292
Figure 8.6 | (a) µEVA image showing germinated endospores in the ice core sample.
It was taken after 10 minutes of germination. (b) Corresponding time course plots of
germinating spores. 10 overlays from image of ice core sample (fine solid line); B.
atrophaeus ATCC 9372, broken line; unidentified spore species from a surface
swab of our laboratory, bold solid line.
(a) (b)
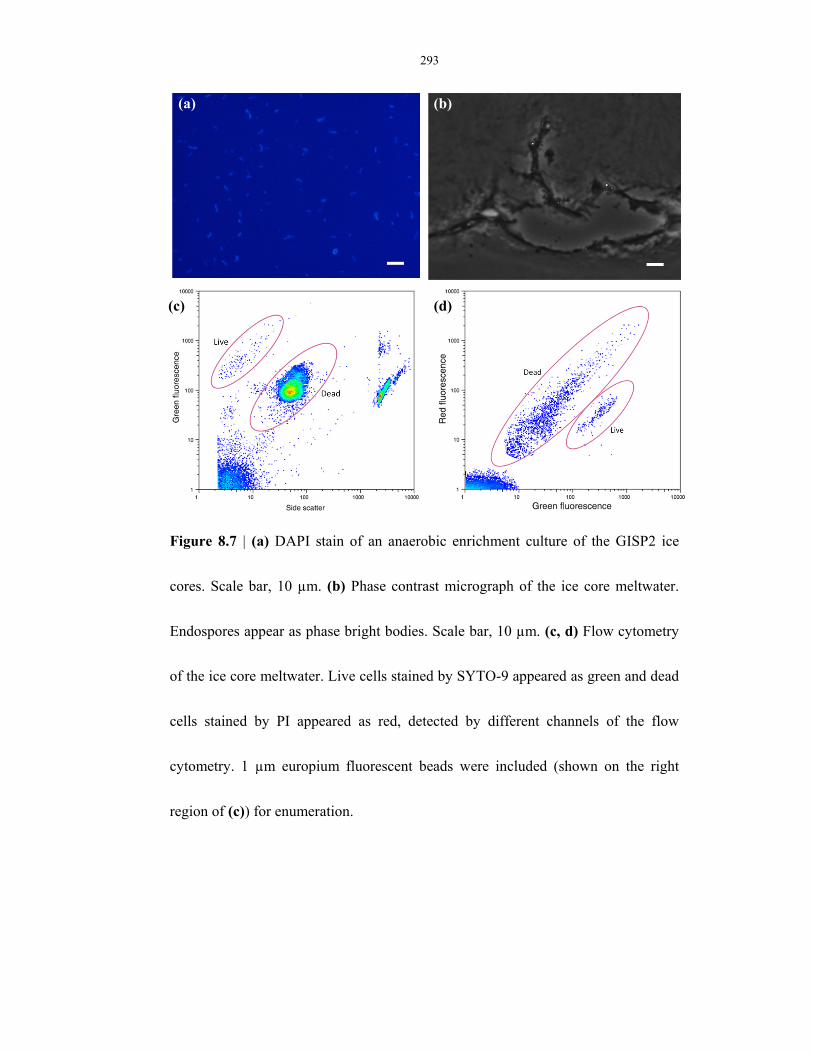
293
Figure 8.7 | (a) DAPI stain of an anaerobic enrichment culture of the GISP2 ice
cores. Scale bar, 10 µm. (b) Phase contrast micrograph of the ice core meltwater.
Endospores appear as phase bright bodies. Scale bar, 10 µm. (c, d) Flow cytometry
of the ice core meltwater. Live cells stained by SYTO-9 appeared as green and dead
cells stained by PI appeared as red, detected by different channels of the flow
cytometry. 1 µm europium fluorescent beads were included (shown on the right
region of (c)) for enumeration.
(a) (b)
(c) (d)
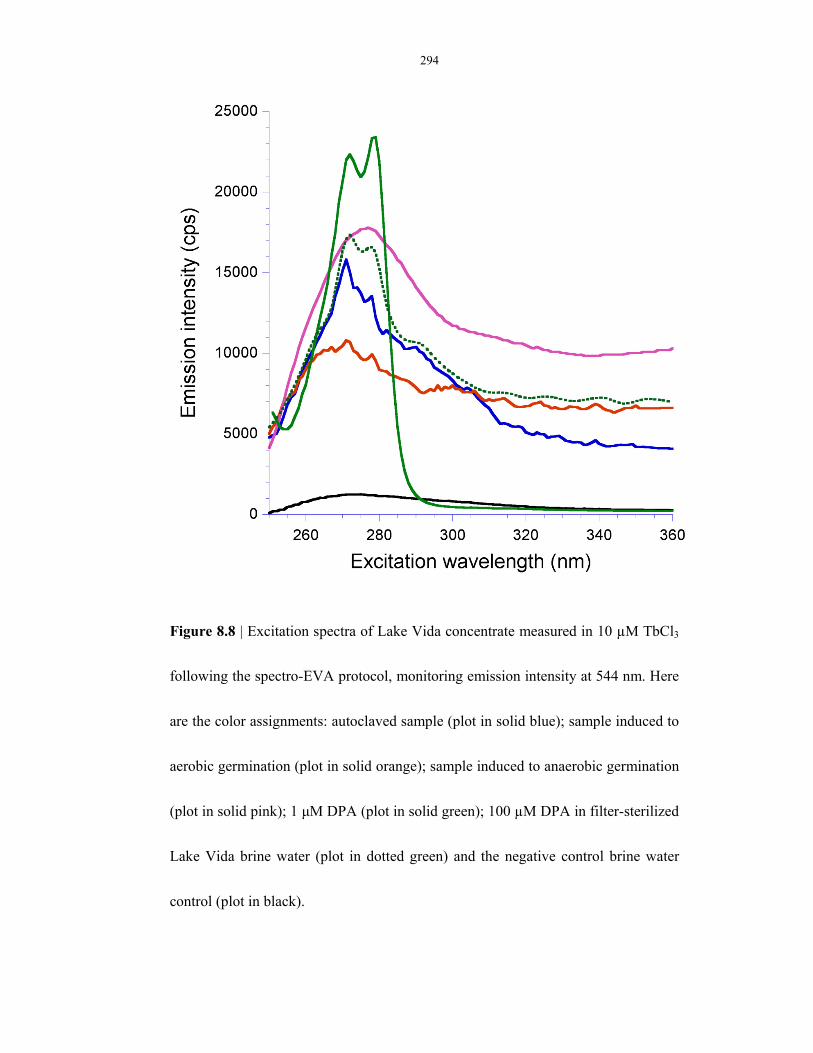
294
Figure 8.8 | Excitation spectra of Lake Vida concentrate measured in 10 µM TbCl3
following the spectro-EVA protocol, monitoring emission intensity at 544 nm. Here
are the color assignments: autoclaved sample (plot in solid blue); sample induced to
aerobic germination (plot in solid orange); sample induced to anaerobic germination
(plot in solid pink); 1 μM DPA (plot in solid green); 100 µM DPA in filter-sterilized
Lake Vida brine water (plot in dotted green) and the negative control brine water
control (plot in black).
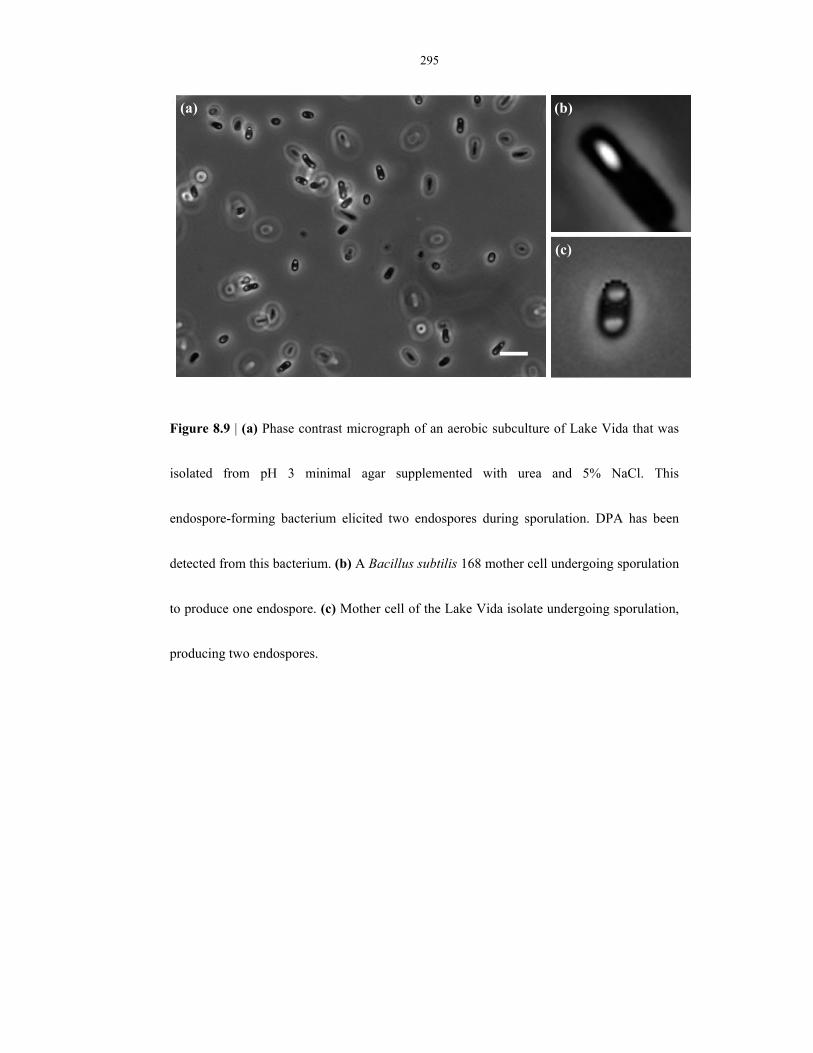
295
Figure 8.9 | (a) Phase contrast micrograph of an aerobic subculture of Lake Vida that was
isolated from pH 3 minimal agar supplemented with urea and 5% NaCl. This
endospore-forming bacterium elicited two endospores during sporulation. DPA has been
detected from this bacterium. (b) A Bacillus subtilis 168 mother cell undergoing sporulation
to produce one endospore. (c) Mother cell of the Lake Vida isolate undergoing sporulation,
producing two endospores.
(a) (b)
(c)
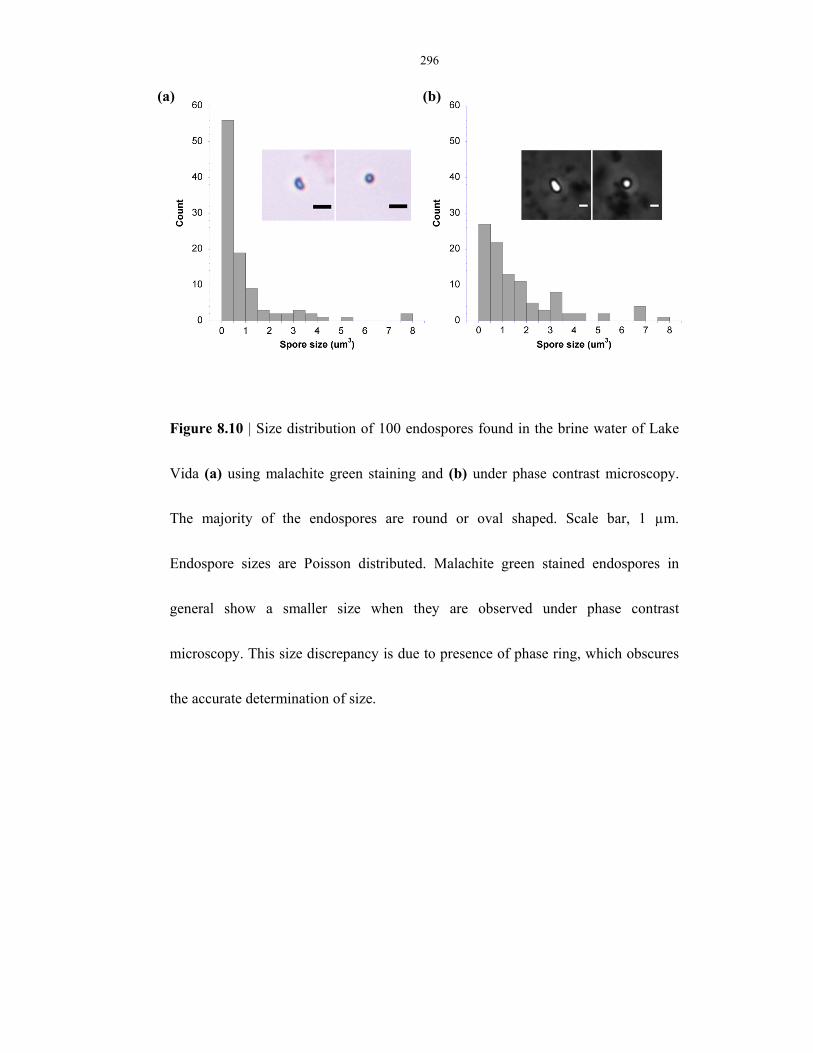
296
Figure 8.10 | Size distribution of 100 endospores found in the brine water of Lake
Vida (a) using malachite green staining and (b) under phase contrast microscopy.
The majority of the endospores are round or oval shaped. Scale bar, 1 µm.
Endospore sizes are Poisson distributed. Malachite green stained endospores in
general show a smaller size when they are observed under phase contrast
microscopy. This size discrepancy is due to presence of phase ring, which obscures
the accurate determination of size.
(a) (b)
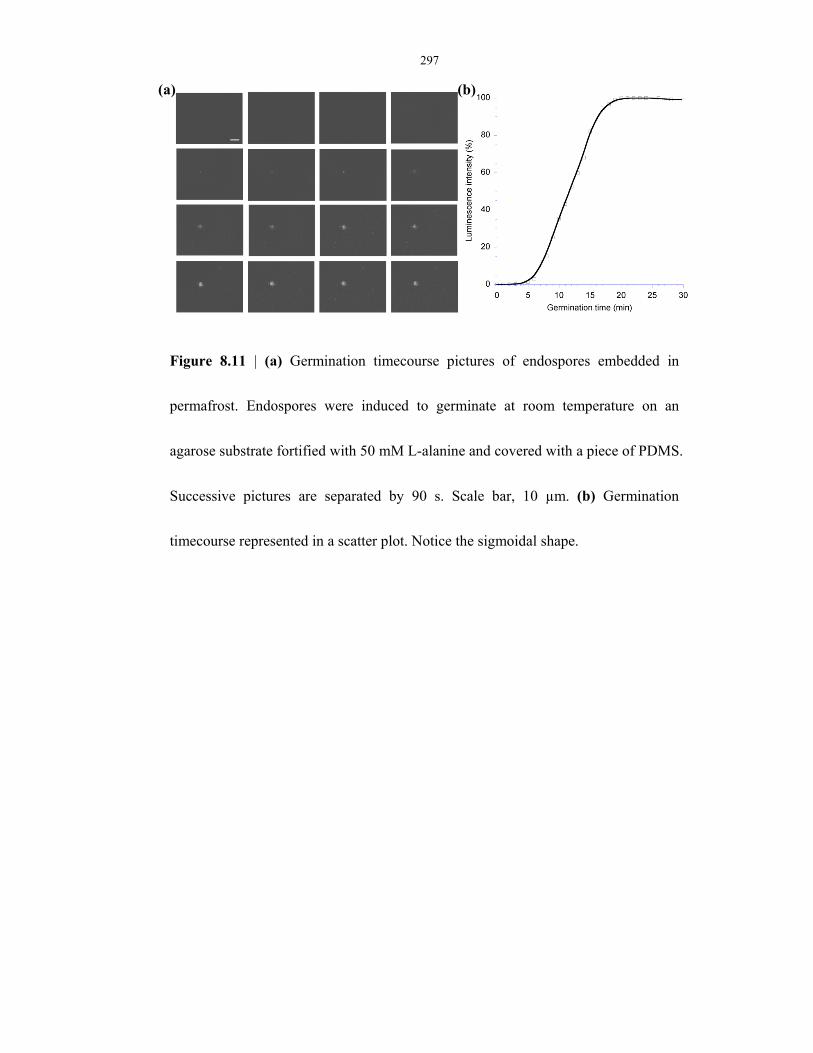
297
Figure 8.11 | (a) Germination timecourse pictures of endospores embedded in
permafrost. Endospores were induced to germinate at room temperature on an
agarose substrate fortified with 50 mM L-alanine and covered with a piece of PDMS.
Successive pictures are separated by 90 s. Scale bar, 10 µm. (b) Germination
timecourse represented in a scatter plot. Notice the sigmoidal shape.
(a) (b)

298
Figure 8.12 | Staining micrographs of permafrost samples. Scale bar, 10 µm. (a).
SYBR Gold staining epifluorescence microscopy. All cells, except endospores, were
stained gold by this DNA-intercalating dye. (b) Phase contrast microscopy.
Endospores appear as distinct phase-bright oval bodies. (c) Live/Dead BacLight
viability staining. Dead cells were stained red and live cells were stained green by
propidium iodide and SYTO-9, respectively. (d) Malachite green staining
bright-field microscopy. Dead cells and cell debris were stained red while
endospores were stained green.
(a) (b)
(c) (d)
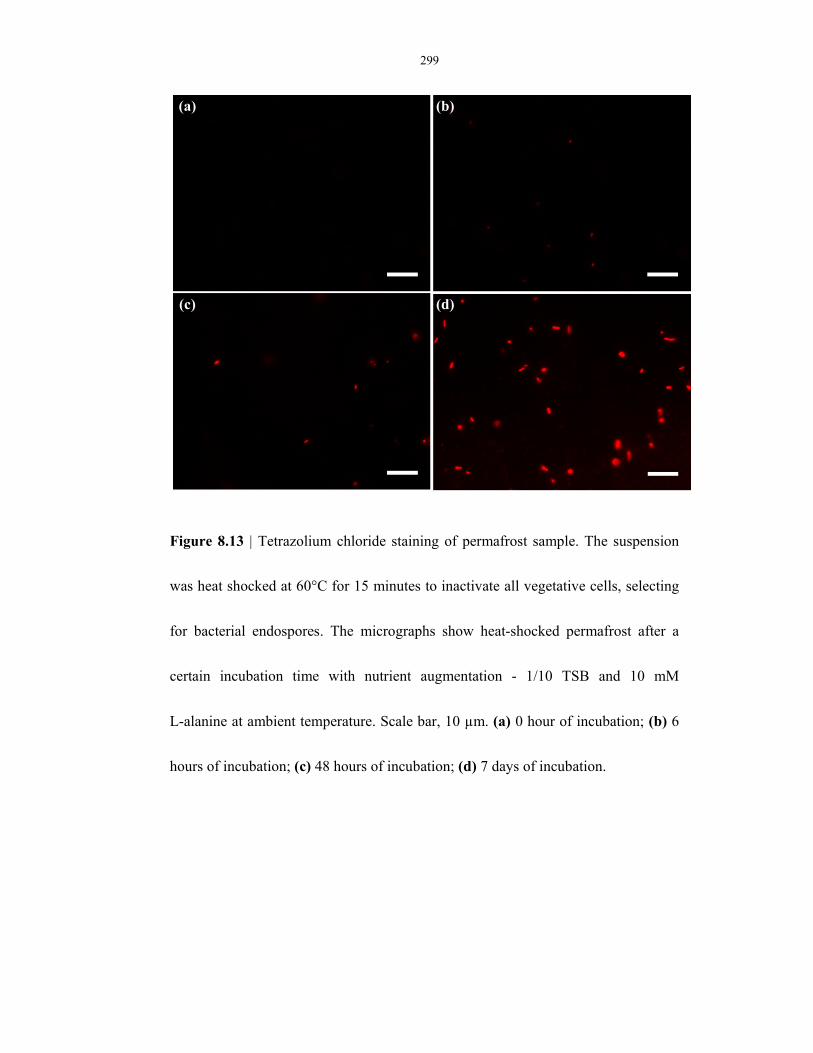
299
Figure 8.13 | Tetrazolium chloride staining of permafrost sample. The suspension
was heat shocked at 60°C for 15 minutes to inactivate all vegetative cells, selecting
for bacterial endospores. The micrographs show heat-shocked permafrost after a
certain incubation time with nutrient augmentation - 1/10 TSB and 10 mM
L-alanine at ambient temperature. Scale bar, 10 µm. (a) 0 hour of incubation; (b) 6
hours of incubation; (c) 48 hours of incubation; (d) 7 days of incubation.
(a) (b)
(c) (d)
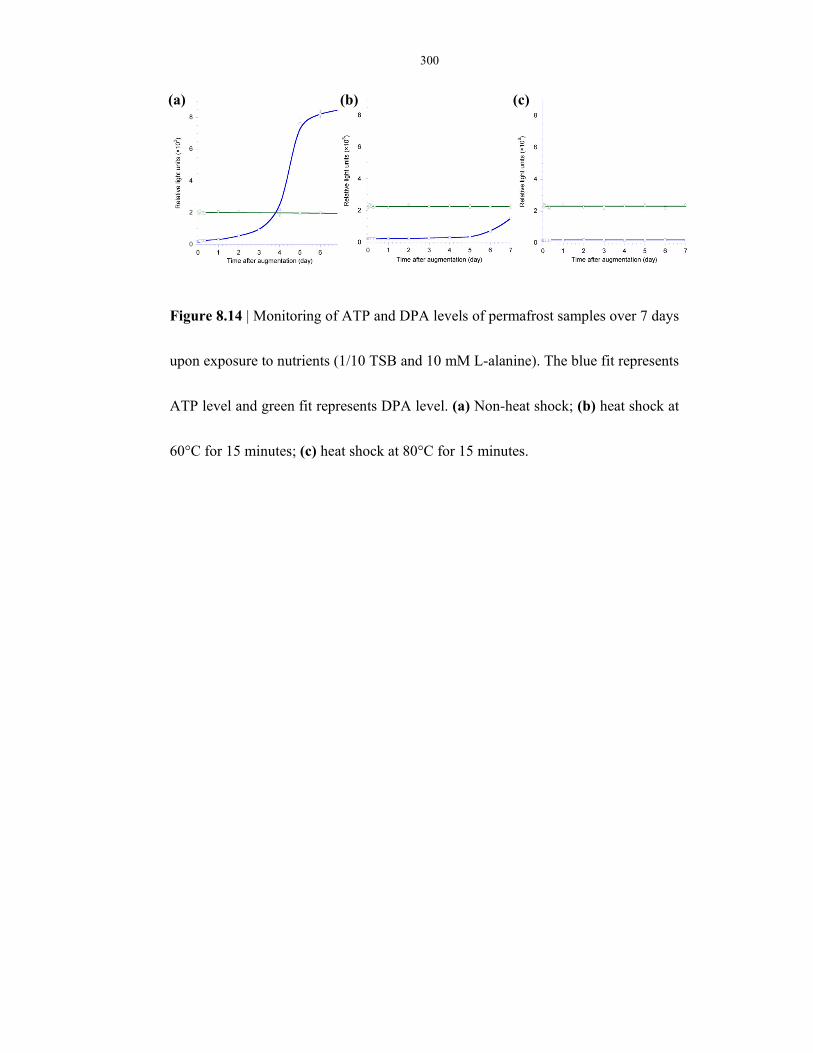
300
Figure 8.14 | Monitoring of ATP and DPA levels of permafrost samples over 7 days
upon exposure to nutrients (1/10 TSB and 10 mM L-alanine). The blue fit represents
ATP level and green fit represents DPA level. (a) Non-heat shock; (b) heat shock at
60°C for 15 minutes; (c) heat shock at 80°C for 15 minutes.
(a) (b) (c)
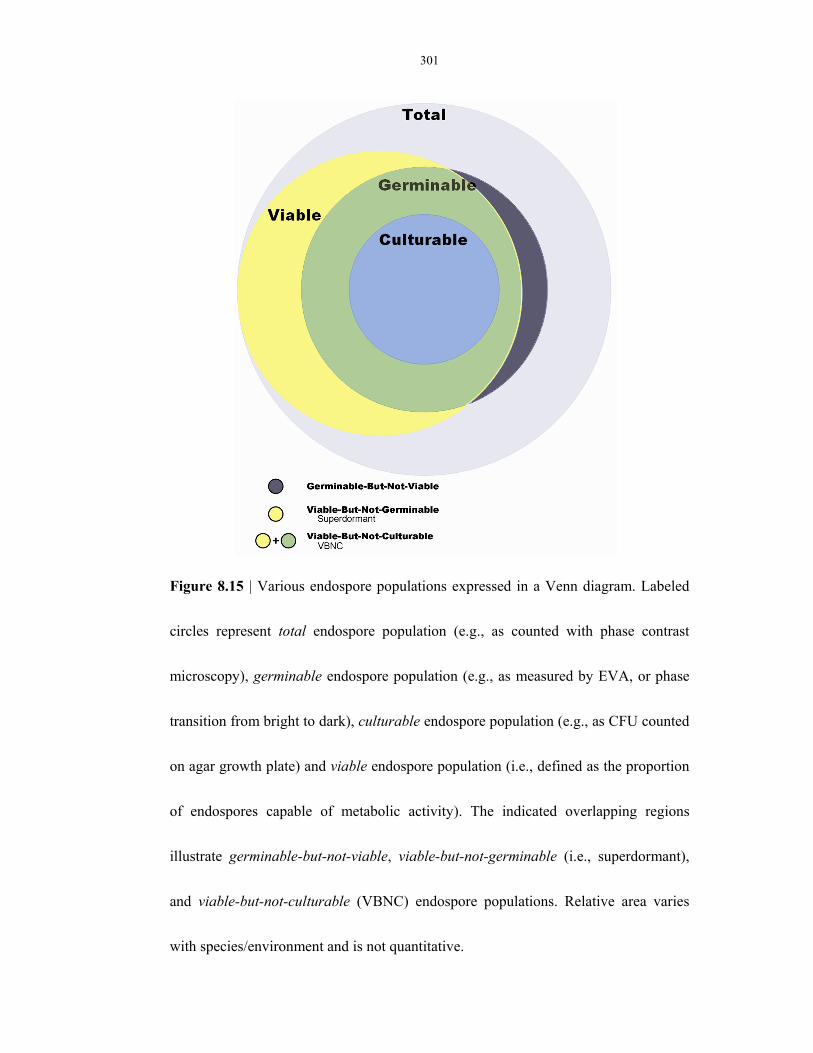
301
Figure 8.15 | Various endospore populations expressed in a Venn diagram. Labeled
circles represent total endospore population (e.g., as counted with phase contrast
microscopy), germinable endospore population (e.g., as measured by EVA, or phase
transition from bright to dark), culturable endospore population (e.g., as CFU counted
on agar growth plate) and viable endospore population (i.e., defined as the proportion
of endospores capable of metabolic activity). The indicated overlapping regions
illustrate germinable-but-not-viable, viable-but-not-germinable (i.e., superdormant),
and viable-but-not-culturable (VBNC) endospore populations. Relative area varies
with species/environment and is not quantitative.

302
Figure 8.16 | Viability plots of the ice cores samples along a depth transect.
Definitions of the 4 different viability ratios are stated previously. (a) Viability ratio
1 shows a logarithmic decaying trend of the proportion of germinable endospores
with increasing age. One outlying data point at age 40,000 is neglected in obtaining
the fit. (b) Viability ratio 2 shows an exponential decaying trend of the proportion of
germinable endospores with increasing age. (c) Viability ratio 3 shows an increasing
correlation of cells stained by SYTO-9 with ice age in a sigmoidal fashion. One
(a) (b)
(c) (d)

303
outlying data point at age 10,000 has been removed. (d) Viability ratio 4 shows an
exponential decaying trend of the number of culturable bacteria with increasing age.
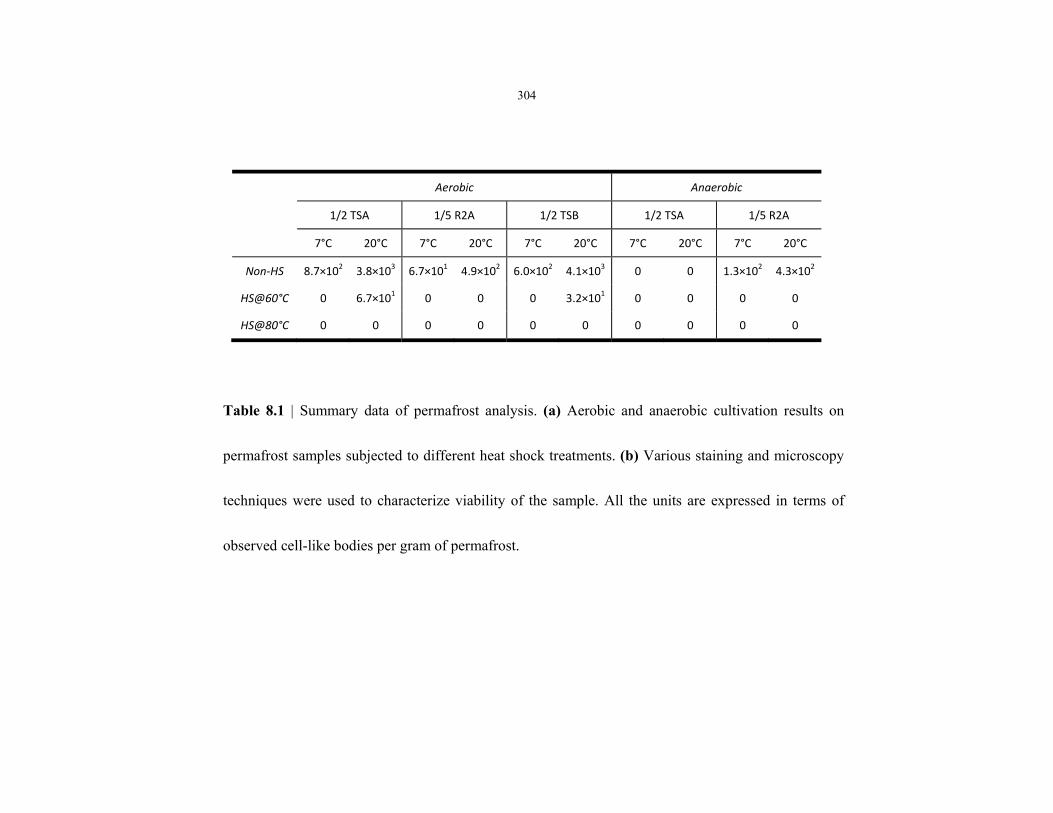
304
Aerobic Anaerobic
1/2 TSA 1/5 R2A 1/2 TSB 1/2 TSA 1/5 R2A
7°C 20°C 7°C 20°C 7°C 20°C 7°C 20°C 7°C 20°C
Non‐HS 8.7×10² 3.8×10³ 6.7×101 4.9×10² 6.0×10² 4.1×10³ 0 0 1.3×10² 4.3×10²
HS@60°C 0 6.7×101 0 0 0 3.2×101 0 0 0 0
HS@80°C 0 0 0 0 0 0 0 0 0 0
Table 8.1 | Summary data of permafrost analysis. (a) Aerobic and anaerobic cultivation results on
permafrost samples subjected to different heat shock treatments. (b) Various staining and microscopy
techniques were used to characterize viability of the sample. All the units are expressed in terms of
observed cell-like bodies per gram of permafrost.
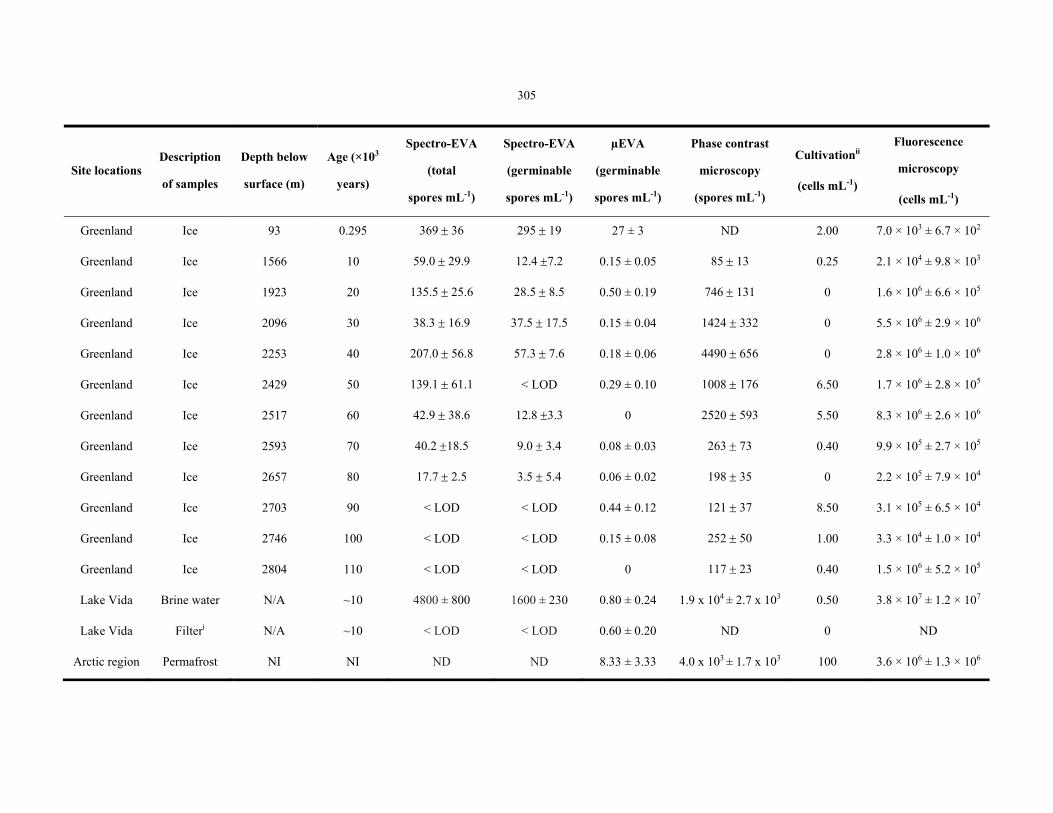
305
Site locations Description
of samples
Depth below
surface (m)
Age (×103
years)
Spectro-EVA
(total
spores mL-1)
Spectro-EVA
(germinable
spores mL-1)
µEVA
(germinable
spores mL-1)
Phase contrast
microscopy
(spores mL-1)
Cultivationii
(cells mL-1)
Fluorescence
microscopy
(cells mL-1)
Greenland Ice 93 0.295 369 ± 36 295 ± 19 27 ± 3 ND 2.00 7.0 × 10³ ± 6.7 × 10²
Greenland Ice 1566 10 59.0 ± 29.9 12.4 ±7.2 0.15 ± 0.05 85 ± 13 0.25 2.1 × 10⁴ ± 9.8 × 10³
Greenland Ice 1923 20 135.5 ± 25.6 28.5 ± 8.5 0.50 ± 0.19 746 ± 131 0 1.6 × 10⁶ ± 6.6 × 10⁵
Greenland Ice 2096 30 38.3 ± 16.9 37.5 ± 17.5 0.15 ± 0.04 1424 ± 332 0 5.5 × 10⁶ ± 2.9 × 10⁶
Greenland Ice 2253 40 207.0 ± 56.8 57.3 ± 7.6 0.18 ± 0.06 4490 ± 656 0 2.8 × 10⁶ ± 1.0 × 10⁶
Greenland Ice 2429 50 139.1 ± 61.1 < LOD 0.29 ± 0.10 1008 ± 176 6.50 1.7 × 10⁶ ± 2.8 × 10⁵
Greenland Ice 2517 60 42.9 ± 38.6 12.8 ±3.3 0 2520 ± 593 5.50 8.3 × 10⁶ ± 2.6 × 10⁶
Greenland Ice 2593 70 40.2 ±18.5 9.0 ± 3.4 0.08 ± 0.03 263 ± 73 0.40 9.9 × 10⁵ ± 2.7 × 10⁵
Greenland Ice 2657 80 17.7 ± 2.5 3.5 ± 5.4 0.06 ± 0.02 198 ± 35 0 2.2 × 10⁵ ± 7.9 × 10⁴
Greenland Ice 2703 90 < LOD < LOD 0.44 ± 0.12 121 ± 37 8.50 3.1 × 10⁵ ± 6.5 × 10⁴
Greenland Ice 2746 100 < LOD < LOD 0.15 ± 0.08 252 ± 50 1.00 3.3 × 10⁴ ± 1.0 × 10⁴
Greenland Ice 2804 110 < LOD < LOD 0 117 ± 23 0.40 1.5 × 10⁶ ± 5.2 × 10⁵
Lake Vida Brine water N/A ~10 4800 ± 800 1600 ± 230 0.80 ± 0.24 1.9 x 10⁴ ± 2.7 x 10³ 0.50 3.8 × 10⁷ ± 1.2 × 10⁷
Lake Vida Filteri N/A ~10 < LOD < LOD 0.60 ± 0.20 ND 0 ND
Arctic region Permafrost NI NI ND ND 8.33 ± 3.33 4.0 x 10³ ± 1.7 x 10³ 100 3.6 × 10⁶ ± 1.3 × 10⁶
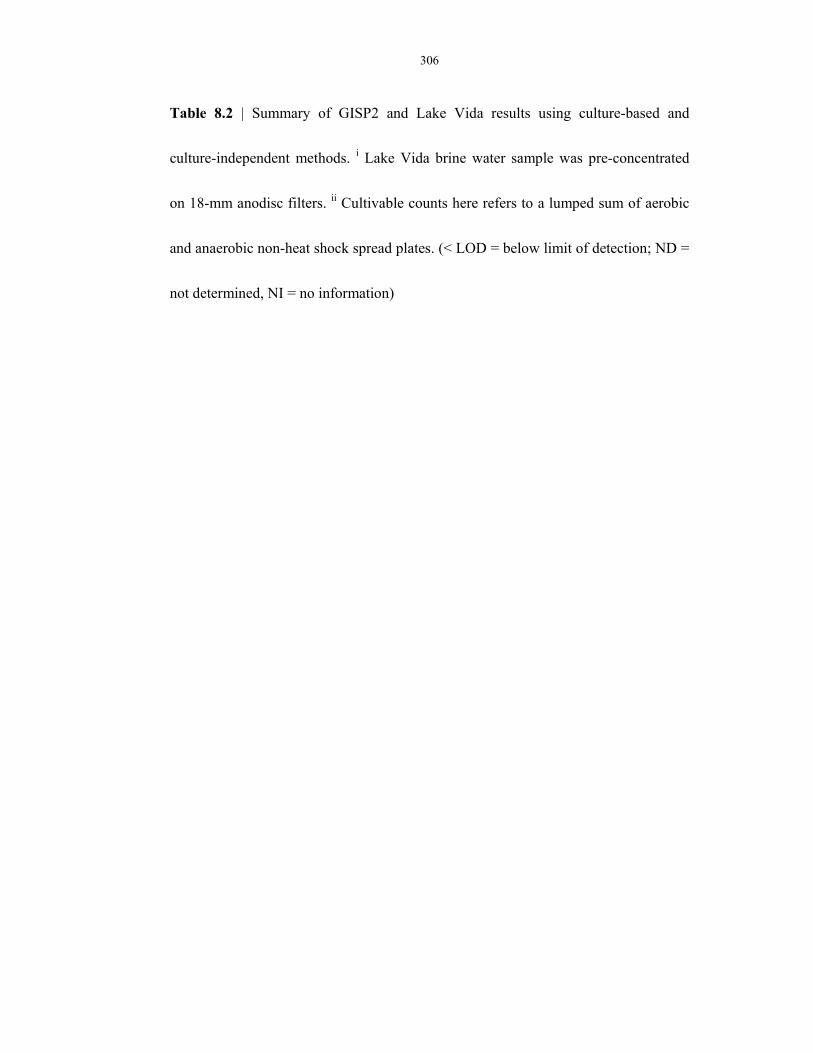
306
Table 8.2 | Summary of GISP2 and Lake Vida results using culture-based and
culture-independent methods. i Lake Vida brine water sample was pre-concentrated
on 18-mm anodisc filters. ii Cultivable counts here refers to a lumped sum of aerobic
and anaerobic non-heat shock spread plates. (< LOD = below limit of detection; ND =
not determined, NI = no information)
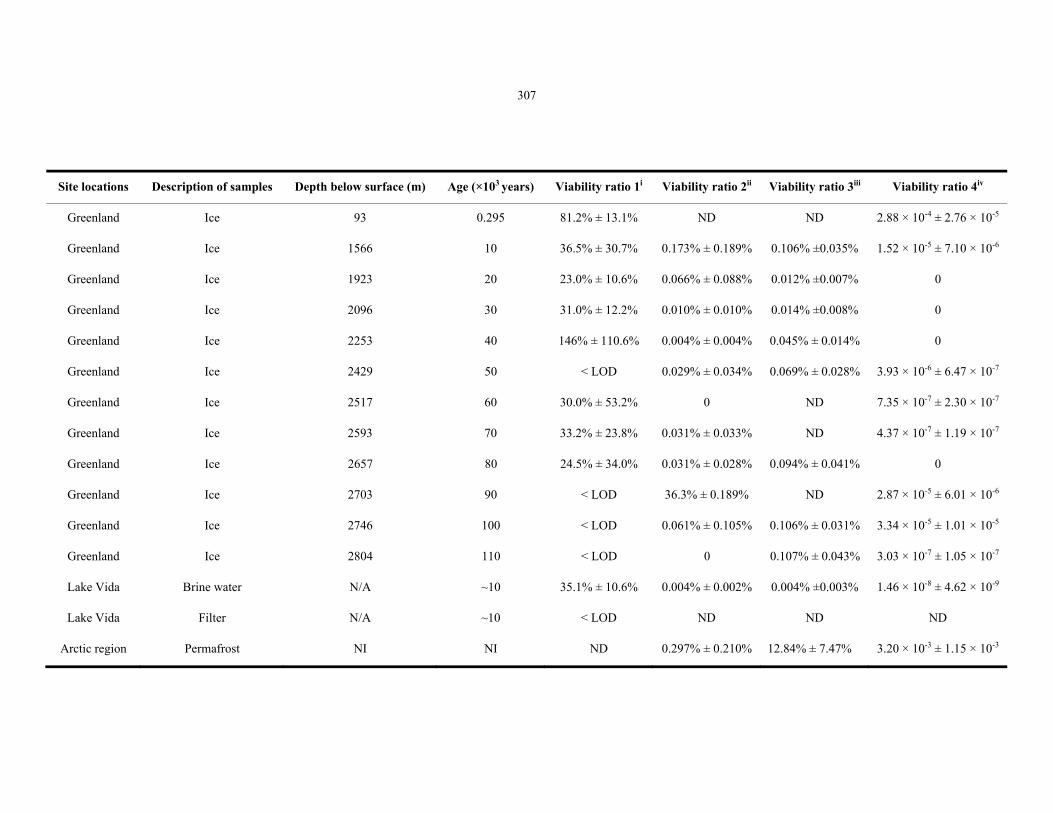
307
Site locations Description of samples Depth below surface (m) Age (×103 years) Viability ratio 1i Viability ratio 2ii Viability ratio 3iii Viability ratio 4iv
Greenland Ice 93 0.295 81.2% ± 13.1% ND ND 2.88 × 10⁻⁴ ± 2.76 × 10⁻⁵
Greenland Ice 1566 10 36.5% ± 30.7% 0.173% ± 0.189% 0.106% ±0.035% 1.52 × 10⁻⁵ ± 7.10 × 10⁻⁶
Greenland Ice 1923 20 23.0% ± 10.6% 0.066% ± 0.088% 0.012% ±0.007% 0
Greenland Ice 2096 30 31.0% ± 12.2% 0.010% ± 0.010% 0.014% ±0.008% 0
Greenland Ice 2253 40 146% ± 110.6% 0.004% ± 0.004% 0.045% ± 0.014% 0
Greenland Ice 2429 50 < LOD 0.029% ± 0.034% 0.069% ± 0.028% 3.93 × 10⁻⁶ ± 6.47 × 10⁻⁷
Greenland Ice 2517 60 30.0% ± 53.2% 0 ND 7.35 × 10⁻⁷ ± 2.30 × 10⁻⁷
Greenland Ice 2593 70 33.2% ± 23.8% 0.031% ± 0.033% ND 4.37 × 10⁻⁷ ± 1.19 × 10⁻⁷
Greenland Ice 2657 80 24.5% ± 34.0% 0.031% ± 0.028% 0.094% ± 0.041% 0
Greenland Ice 2703 90 < LOD 36.3% ± 0.189% ND 2.87 × 10⁻⁵ ± 6.01 × 10⁻⁶
Greenland Ice 2746 100 < LOD 0.061% ± 0.105% 0.106% ± 0.031% 3.34 × 10⁻⁵ ± 1.01 × 10⁻⁵
Greenland Ice 2804 110 < LOD 0 0.107% ± 0.043% 3.03 × 10⁻⁷ ± 1.05 × 10⁻⁷
Lake Vida Brine water N/A ~10 35.1% ± 10.6% 0.004% ± 0.002% 0.004% ±0.003% 1.46 × 10⁻⁸ ± 4.62 × 10⁻⁹
Lake Vida Filter N/A ~10 < LOD ND ND ND
Arctic region Permafrost NI NI ND 0.297% ± 0.210% 12.84% ± 7.47% 3.20 × 10⁻³ ± 1.15 × 10⁻³
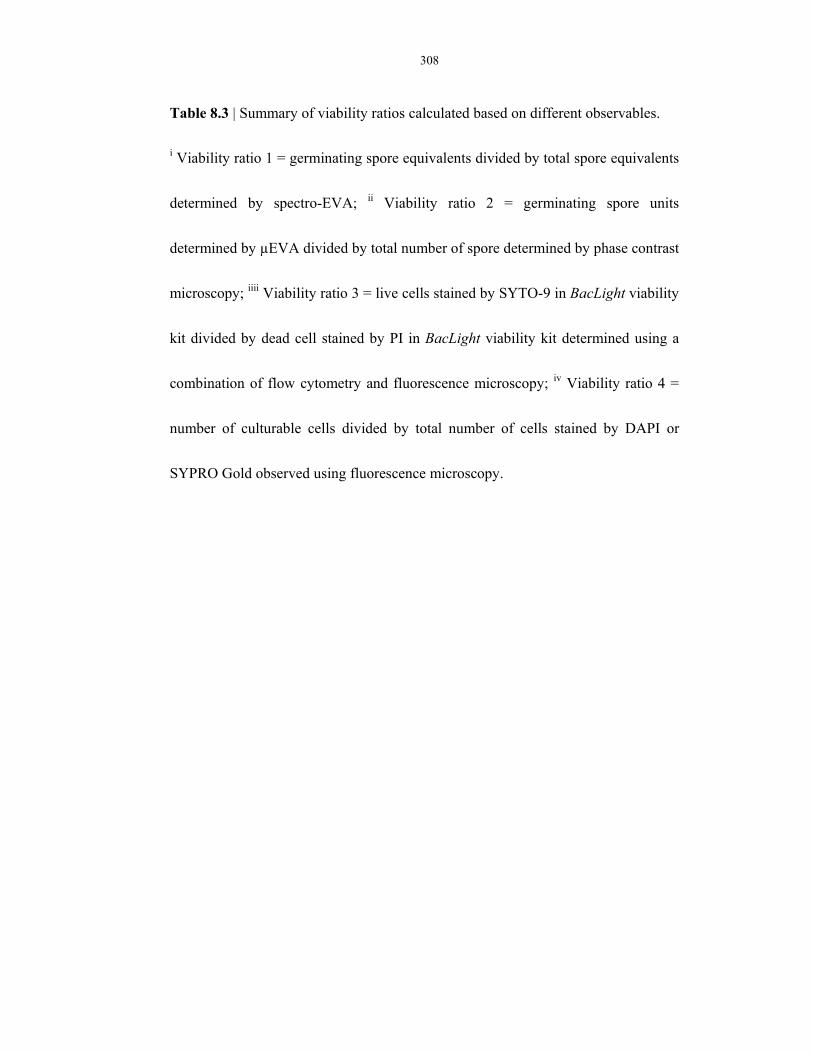
308
Table 8.3 | Summary of viability ratios calculated based on different observables.
i Viability ratio 1 = germinating spore equivalents divided by total spore equivalents
determined by spectro-EVA; ii Viability ratio 2 = germinating spore units
determined by µEVA divided by total number of spore determined by phase contrast
microscopy; iiii Viability ratio 3 = live cells stained by SYTO-9 in BacLight viability
kit divided by dead cell stained by PI in BacLight viability kit determined using a
combination of flow cytometry and fluorescence microscopy; iv Viability ratio 4 =
number of culturable cells divided by total number of cells stained by DAPI or
SYPRO Gold observed using fluorescence microscopy.
309
CHAPTER 9: ENDOSPORES IN HYPER-ARID BIOSPHERE
9.1 Abstract
Bacterial endospores are one of the hardiest life forms on Earth, renowned for their
omnipresence in extreme environments, including polar ices, permafrost, and deserts.
This chapter is devoted to the study of endospores in hyper-arid environments on Earth as
terrestrial model to Mars. The Atacama Desert in Chile serves as the perfect model
system because it is the driest desert on Earth. Previous studies have reported a
near-sterile state in the soils. My research group has been on a sampling expedition to the
Atacama Desert for 10 days in September 2007 to carry out a series of in situ and sample
return analyses with the goal to study the microbial diversity, abundance and the response
of the effect of water on the native microbes. New culture-independent methods, such as
phospholipid fatty acid and total organic carbon analyses were performed on the desert
soils along with terbium-dipicolinic acid based assays. Significant differences in
culturability and germinability were obtained along a depth profile in a soil pit
corresponding to ages approximately equal to 25000 and 35000 years ago based on
radioactive carbon dating. A spike in microbial response was also observed when sterile
water was added into otherwise-sterile desert soils. Endospore isolates obtained from the
Atacama Desert were compared with laboratory strains and other environmental isolates
as an effort to investigate the long-debated ecological role of endospores in a particular
environment. Comparative studies were made on sporulation, outgrowth, germination
kinetics, morphology, dipicolinic acid content, thermal and UV resistances.
Environmental strains generally exhibited higher resistance and are less responsive to
310
conventional chemical germinants. In particular, we assess the feasibility of using the
abundance and viability of endospore as proxies to study the ecosystem in Atacama.
9.2 Introduction
The Atacama Desert in Northern Chile is the driest place on Earth. This is a cold desert
with a hyperarid habitat. The average annual air temperature is -5°C to 45°C, depending
upon elevation and distance from the sea. The annual precipitation is less than 1 mm.
Some of the weather stations in the Atacama Desert have never received any rainfall
records. The cold water brought from Antarctica along the Chilean coast creates a
phenomenon called the temperature inversion in which cold air is below a ceiling of
warm air, preventing water evaporation and formation of clouds. Also, the desert is in the
rain shadow of the Andes on the west and Chilean Coast Range on the north, within the
dry subtropical climate belt1,2. Owing to the combined effects of these physical factors,
the Atacama Desert has been devoid of water for over 150 million years3-5. The upper soil
layers are dry and weathered. The soil environment precludes any downward infiltration.
For this reason, the possibility of penetration of model microorganisms into the soil
subsurface is precluded, making it a very good model to assess the dry limit of life, effect
of water on microbial abundance and preservation of organic material along a depth
transect of soil.
The study of environmental endospores has gained wider popularity. An increased
understanding of the interactions between the environment and the dormant life form
provides insight into microflora. Until relatively recently, conventional cultivation
techniques has been the primary tool for the study of environmental endospores.
311
Nevertheless, endospore viability is still the one often-neglected topic. µEVA has been
developed as a time-gated luminescence microscopy technique to assess the viability of
endospores. Indigenous microflora of most environments develop in spatially organized
gradients according to physicochemical driving forces6. Microbial population is
organized either horizontally or vertically along these gradients. Endospores follow suit
under different environments. For example, dormant endospores can remain viable for
long periods of time and may thus accumulate in deep sea sediments, ice cores, and
desert soils as a function of stratification age. The quantitative distribution of endospores
will be an interesting subject to study.
When vegetative cells of Bacillus species are confronted with low nutrient, the
bacteria can initiate the process of sporulation, in which the growing cells differentiate
into dormant spores7. Spores do not metabolize at a detectable level and are highly
resistant to several perturbations, such as heat and exposure to UV and gamma
radiation8-10. They exhibit longevity with reports ranging from thousands up to half a
billion years11-13. Arid desert is one of the best repositories for life on Earth because of
minimal biological degradation of dead remains. Bacteria have been entombed desiccated
in these environments for a long time. Endospores are one of the survivors due their
remarkable resistance. Understanding constraints on microbial populations in extreme
environments is of great interest in the context of Earth analogs for possible
extraterrestrial habitats. Hyper-arid and oxidizing environemnts, such as the Atacama
Desert, are good analogs of environments on Mars and the Jovian moon Europa.
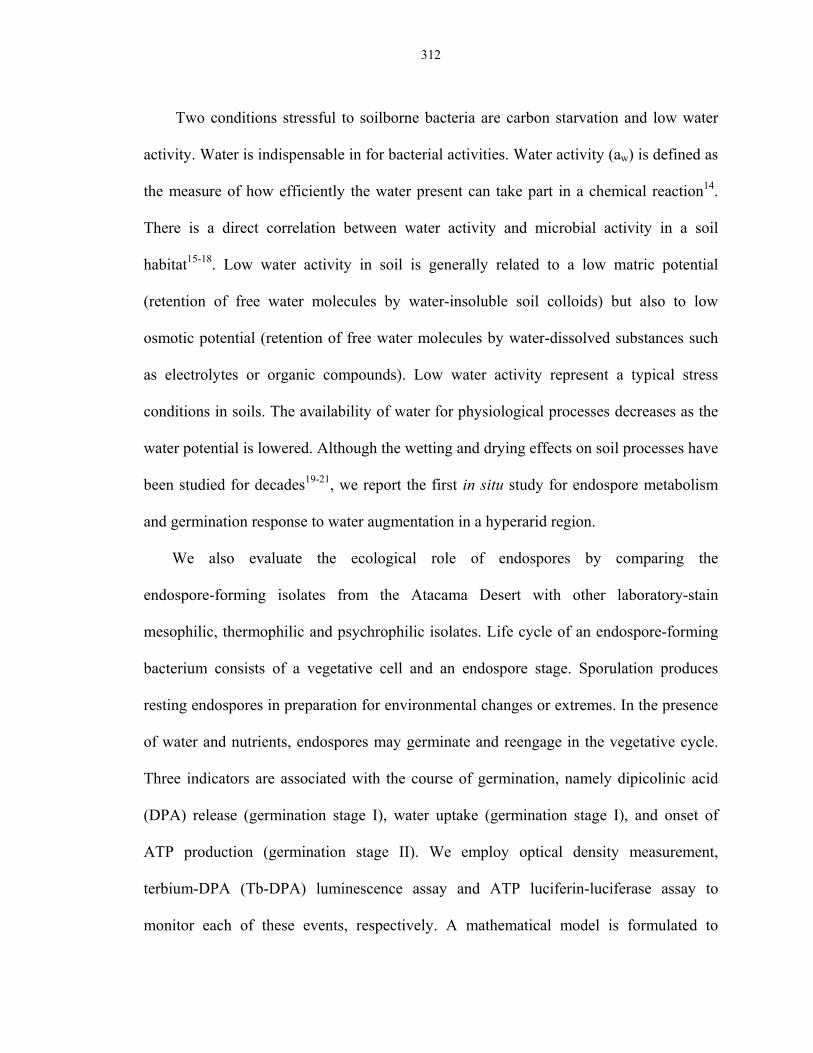
312
Two conditions stressful to soilborne bacteria are carbon starvation and low water
activity. Water is indispensable in for bacterial activities. Water activity (aw) is defined as
the measure of how efficiently the water present can take part in a chemical reaction14.
There is a direct correlation between water activity and microbial activity in a soil
habitat15-18. Low water activity in soil is generally related to a low matric potential
(retention of free water molecules by water-insoluble soil colloids) but also to low
osmotic potential (retention of free water molecules by water-dissolved substances such
as electrolytes or organic compounds). Low water activity represent a typical stress
conditions in soils. The availability of water for physiological processes decreases as the
water potential is lowered. Although the wetting and drying effects on soil processes have
been studied for decades19-21, we report the first in situ study for endospore metabolism
and germination response to water augmentation in a hyperarid region.
We also evaluate the ecological role of endospores by comparing the
endospore-forming isolates from the Atacama Desert with other laboratory-stain
mesophilic, thermophilic and psychrophilic isolates. Life cycle of an endospore-forming
bacterium consists of a vegetative cell and an endospore stage. Sporulation produces
resting endospores in preparation for environmental changes or extremes. In the presence
of water and nutrients, endospores may germinate and reengage in the vegetative cycle.
Three indicators are associated with the course of germination, namely dipicolinic acid
(DPA) release (germination stage I), water uptake (germination stage I), and onset of
ATP production (germination stage II). We employ optical density measurement,
terbium-DPA (Tb-DPA) luminescence assay and ATP luciferin-luciferase assay to
monitor each of these events, respectively. A mathematical model is formulated to

313
describe germination based on DPA released, which will be helpful for understanding the
underlying germination kinetics and eventually help detecting spores based on induced
germination.
For over 80 years it has been known that there is a large discrepancy between the
number of bacterial colonies that form on solid media when soil is used as an inoculum
and the total number of bacterial cells actually present in that same soil. This discrepancy
has limited our understanding of the species diversity of soil bacterial communities. In
the past decade, this limitation has been partially overcome through the application of
molecular ecological techniques.
Based mostly on bulk measurements from homogenized soil samples, microbial
communities have been found to exist and possibly even maintain their activity in the
Atacama Desert, Chile, but the actual distribution and metabolic activity of the organisms
under in situ conditions has not been demonstrated due to the lack of adequate
technologies. Extracting microorganisms in soils through suspending in buffer,
subsequently by vortexing and sonication, destroys the micro-environments within the
soil matrix.
Here we report the first successful extraction of DPA and measurement of
germinable endospores from the soils in the most arid zone of the Atacama Desert, the
Yungay area. We focused on two primary Yungay sample collection sites, which we call
sites A and E. Site A is the location of a past effort to extract DNA from the soils of this
region, which did not yield detectable concentrations of DNA22. Site E is 5 km northeast
of Site A, and is the location of prior investigations that focused on soil chemistry,
identification of cultured isolates and DNA extraction23,24. We also determined
314
phospholipid fatty acid (PLFA), total organic carbon (TOC), culturable microbial
populations, anion concentrations, soil reduction potential (Eh), conductivity (eC), and
water activity for surface and subsurface samples. In addition, we measured the change in
microbial abundance along a depth transect in a soil pit to investigate endospore viability
and the long-term preservation of organic materials in an arid environment.
In this study, we first of all build upon various endospore detection assays that have
been developed, together with germination models, airborne endospore models,
sporulation protocols for psychrophilic and thermophilic endospores and a lot of different
ideas to develop instruments for field work. We first tested the new instruments and field
protocols in the local Mojave Desert for the proof of principles. Next, we went on an
expedition to the Atacama Desert to test out our new field-customized assays and
instruments. Finally, we compared the bacterial isolates that we obtained from the desert
with laboratory endospore strains to study the ecological role of endospores in different
environments and various temperature extremes.
Next, we aim to compare properties of spores isolated from soils, including isolates
from Atacama Desert, with laboratory strain spores. Germination kinetics will be
emphasized in the pursuit to devise an optimal germination conditions for spores
inhabiting in each of the different biotic extremes. Psychrophilic and thermophilic spores
are prepared to study both cold and hot habitats. In particular, Atacama Desert is
considered one of the most extreme places on Earth. It is the driest desert. It has been
reported to contain near sterile soils with only trace organic carbon and nitrogen content
and these conditions have existed for at least several millions years.
After that, we screened endospores of isolated spore-forming bacteria from a
315
growing collection of spacecraft and associated environmental isolates for resistance to
UV irradiation at 254 nm (UV254). In order to examine the biocidal effects of direct UV
irradiation predicted for Mars, UV254-resistant spores were exposed to simulated Martian
UV irradiation. The effects of UVA, UVA+B (280 to 400 nm), UVC (200 to 280 nm),
and total UV irradiation (200 to 400 nm) on the survival of microorganisms at intensities
expected to strike the surface of equatorial Mars were examined.
9.3 Methods
9.3.1 Materials
Terbium (III) chloride hexahydrate (99.999%), L-alanine, D-alanine, dipicolinic acid
(99%; 2,6-pyridinedicarboxylic acid), L-asparagine, L-glucose, L-fructose, potassium
chloride were all purchased from Sigma Aldrich (Milwaukee, WI) and were used as
received. ATP luciferin and luciferase mix were purchased from Promega. n-hexadecane
was purchased from TGI American. Bacteria were counted by spreading plating on
tryptic soy agar (Difco, Sparks, MD). An endospore suspension of Bacillus atrophaeus
(ATCC 9372) was purchased from Raven Biological Laboratories (Omaha, NE) and
stored at 4°C before use. Other lab-strain Bacillus endospores used in this study include B.
atrophaeus (ATCC 9372), B. subtilis 168, B. subtilis natto, B. cereus, B. licheniformis, B.
megaterium and B. pumilis. All solutions were prepared in 18.2 MΩ-cm deionized water
(Elga, UltraPure Lab) and 0.2-µm filter sterilized.
9.3.2 Soil sampling
316
All utensils were either packaged sterile or pre-treated at 240°C overnight. The sampling
sites were approached downwind, and gloves and masks worn to reduce the chance of
contamination. Care was taken to minimize contamination of the experimental sites by
reducing foot traffic to designated paths and areas. Soil samples were collected by spoons
and scoops aseptically into sterile Whirl-Paks with the collector wearing masks, apron,
and sterile gloves collected when facing the wind25. The rhizosphere domain is defined as
extending approximately 5 cm from the root surface in all directions. Some root nodules
were collected together with soils. Sieving, homogenizing and sample handling took
place in a station in Yungay. After some on-field preliminary experiments (culturing,
ATP measurements, DPA measurements), the soil samples were sealed in amber jars to
protect from sunlight and moisture, transported in coolers with ice packs/dry ice or placed
in dry shipper dewars for transport back for laboratory analysis.
9.3.3 Air sampling
Air sampling was carried out in places with minimal human activity using a SAS sampler.
The air sampler was positioned 20 cm above the ground and orientated such that the left
arm always faced the windward side and the right arm faced the leeward side. The
stainless steel receptacle part was disinfected by alcohol swabs in between each sampling.
100 L of air was collected 3 times (i.e., total of 6 samples) onto 1/10 R2A. 3 plates were
incubated aerobically and the other 3 were sealed and incubated inside GasPaks
anaerobically at room temperatures. Passive air sampling was also carried by placing
fallout plates on the ground next to the air sampler site, 3 facing upward and 3 mounted
20 cm upside down. The fallout plates were composed of a substrate made of
317
polydimethylsiloxane (PDMS) instead of nutrient agar lest all the moisture would be
evaporated under the dry weather. After exposure for various amount of time, the piece of
PDMS was peeled off and plated on top of 1/10 R2A for aerobic incubation.
9.3.4 Resistance experiment
106 endospores of two laboratory strains (B. subtilis, B. pumilis) and two Atacama
isolates from previous trip (B. subtilis and B. pumilis) were inoculated and sandwiched
between two pieces of 2 × 2 inch polydimethylsiloxane (PDMS). The PDMS pieces were
exposed to solar UV irradiation for various amount of time before separating and plated
on full strength TSA for enumerating the surviving population. The effective UV dosage
was measured by a radiometer discounted by the percent transmittance of the PDMS.
9.3.5 Water augmentation experiment
The water augmentation experiment was done in the Yungay region of the Atacama
Desert, Chile, approximately 10 kilometers northeast of the Yungay Experimental Station
operated by the University of Antofagasta. 10 Stainless steel 306 rings (60 mm height ×
49 mm ID, highly polished) were aseptically entrenched halfway into the soil and 200
mL of sterile deionized water was added over the surface enclosed in each ring
simulating a rain event of approximately 27 mm. 2 rings were sampled each day for a
total of 5 days. Water activity was measured. Microbial activity was measured by ATP
luciferin-luciferase assay, Tb-DPA luminescence assay and direct plate counts. Samples
were also analyzed of the anion content, carbon 14 dating and total organic carbon 2
weeks after sample return.
318
Upon sample return, the same water augmentation experiment was repeated under
simulated laboratory conditions. The amount of soil and augmented were the same.
Atacama soil sample and kilned soil sample were placed inside beakers exposed to sterile
air inside a level-1 biohazard safety cabinet for 5 days.
9.3.6 Measure of soil water activity, pH, EH, eC and temperature in field
Most of the instrumentation and procedure were outlined in Connon et al23. Briefly, water
activity was measured by a field compatible water activity meter (Decagon, Pullman,
WA). Soil hydrogen ion activity (pH), redox potential (EH), redox (EH) and conductivity
(eC) were performed in the field on a 1:5 solids:deionized water suspension. An IQ150
Handheld pH/mV/temperature meter (I.Q. Scientific Instruments) or similar was used to
measure pH and redox potential. Soil conductivity was measured in triplicate with an
Orion 4-cell conductivity probe model 125A+ (Thermo Electron, Beverly, MA) or
similar and calibrated using two traceable conductivity calibration solutions, 1413 µS
cm-1 and 12.9 mS cm-1 (Cole Palmer, Vernon Hills, IL). Soil samples were analyzed for
anion composition by anion exchange chromatograph (AEC) and total organic carbon
(TOC). AEC was performed following the protocols of the EPA’s Method 300.0 and
TOC followed a modified version of a Lloyd Kahn Method by Datachem Labs (Salt Lake
City, UT). A field compatible Pawkit water activity meter (Decagon, Pullman, WA) was
calibrated using standards of 6.0 M NaCl (aw = 0.76) and 13.41 M LiCl (aw = 0.25).
Following calibration, a thin layer of homogenized soil was placed along the bottom of a
disposable sample cup and placed in the instrument for measurement.
319
9.3.7 Anion exchange chromatography
Anion exchange chromatography was performed by Datachem Labs (Salt Lake City, UT)
using a Dionex Model DX 320 ion chromatograph following the protocols of EPA
Method 300.0.
9.3.8 Total organic carbon (TOC) measurement
Total organic carbon analysis was performed by Datachem Labs using a LECO
CHN-1000 Elemental Analyzer following a modified version of a Lloyd Kahn
Method26,27. The limit of detection (LOD) was 200 mg g-1 and the limit of quantification
(LOQ) was 1000 mg g-1.
9.3.9 Phospholipid fatty acid (PLFA) analysis
PLFA analyses on 50 g soil samples were performed by Microbial Insights (Knoxville,
Tenn.) using a modified method of Bligh and Dyer was used to extract microbial
lipids28-30, which were analyzed by gas chromatography-mass spectrometry. The limit of
detection (LOD) is 50 and the limit of quantification (LOQ) is 150 pmol of PLFA. PLFA
cell equivalent biomass was estimated from the total concentration of ester-linked
phospholipid fatty acids in the samples31. The conversion factor for obtaining cell
equivalents is 2 × 10⁴ cells pmol-1 of PLFA, which gives limits for LOD and LOQ of 2 ×
104 and 6 × 10⁴ cell equivalents gram-1, respectively, in a 50 g sample. A control sample
of Atacama soil was brought up to 485°C in a kiln for 4 h to pyrolize all PLFA before
submission to Microbial Insights for analysis.
320
9.3.10 Radioactive carbon dating
Radiocarbon dating was performed on the deep profile top and bottom samples by β
Analytics. The unsieved soil samples were acid-washed prior to an AMS-standard
delivery analysis.
9.3.11 Cell extraction from soils
Two different soil extraction procedures were used in this study: (I) a quick method used
for field work and culture-based analyses conducted in the laboratory and; (II) a
multi-step method for microscopy, spectroscopy and cytometry analyses conducted in the
laboratory.
Extraction method I was used in times of limited availability of instruments. The
goal was to maximize the recovery of microorganisms, rather than obtaining a suspension
with minimal turbidity. 30 mL of autoclaved phosphate-buffered saline (PBS) with 10
mM sodium pyrophosphate and 0.1% Tween-80 was added to 15 g of soil in a 50-mL
centrifuge tube. The tube was vortexed at maximum speed for 5 min, with intervening
1-min cooling in ice (when in laboratory) or water (when on the field). The tube was then
allowed to sediment for 20 – 40 min until a clear layer of supernatant was visible. The
supernatant was aliquoted into heat shock and non-heat shock portions. Heat shock
treatment was carried out in a water bath at 80°C for 15 min, followed by immediate
chilling in ice or water. A parallel control tube was set up attached with a data-logging
thermocouple (Fluke Corp., Everett, WA) to ensure the accuracy of temperature.
Extraction method II aims to obtain a maximum dispersion of soil microbes while
obtaining a final clear suspension with a minimum of soil particles. 15 mL of 0.2-µm
321
filter-sterilized PBS with 10 mM sodium pyrophosphate and 0.1% Tween-80 was added
to 30 g of soil in a sterile 50-mL centrifuge tube. The tube was vortexed at maximum
speed for 5 min, followed by 2 min of sonication (B-15 Brandon, Danbury, CT),
intercepted with 1-min cooling in ice. Cells were extracted using a buoyant density by the
nonionic Nycodenz® (Accurate Chemical and Scientific Corp., Westbury, NY) density
gradient centrifugation (10,000 × g, 1.3 g mL-1). Cells were collected in a layer on top of
a visible cushion, and the suspension (final volume = 10 mL) was subsequently aliquoted
into halves for heat-shock treatment outlined as above.
Extraction method II yields a higher microbial recovery rate and a cleaner
suspension than method I, but, it entails lots of preparatory time and effort. To optimize
productivity, extraction method I was used in cultivation assays which are immune to
interference and extraction method II was primarily used in interference-sensitive assays.
9.3.12 Cultivation
Aerobic and anaerobic spread plating of samples from sites A, E and augmentation
samples were performed on the field in the Atacama Desert. The rest of the cultivation
experiments were conducted in the laboratory within 2 weeks from sample collection. A
combination of cultivation techniques were used, namely spread plating, most probable
number, fluid thioglycollate culturing and multiplex 24-well microtiter plate for isolation
and enrichment of rare endospore-forming species (please see Chapter 7). 6 aerobic solid
media and 4 anaerobic solid media were used. Aerobic media included (1) full strength
R2A, (2) 1/10 R2A supplemented with Wolfe’s micronutrient solution (0.05%) (ATCC,
Manassas,VA) and cycloheximide (20 µg mL-1) as a fungal inhibitor, (3) salt agar32
322
(CaSO4 0.3 g L-1, NaCl 0.3 g L-1, MgCO3 0.1 g L-1, KNO3 0.1 g L-1, (NH4)2HPO4 0.1 g
L-1, FeCl3 0.01 g L-1, agar 15 g L-1, Wolfe’s micronutrient solution, 0.05% and
cycloheximide 20 µg mL-1, pH adjusted by 0.1 N NaOH to 7.6), (4) Actinomycetes
isolation agar (nutrient agar 0.6 g L-1, agar 15 g L-1, novobiocin 50 µg mL-1,
cycloheximide 20 µg mL-1), (5) Frankiae isolation agar (KH2PO4 1.0 g L-1, MgSO4 ·
7H2O 0.1 g L-1, CaCl2 · 2H2O 0.01 g L-1, sodium propionate 1.2 g L-1, agar 15 g L-1,
FeSO4 · EDTA 0.18%, Wolfe’s micronutrient solution, 0.05% and cycloheximide 20 µg
mL-1, pH adjusted by 0.1 N NaOH to 7.6). (6) The neutralized acid soil extract agar33 was
prepared using the actual Atacama soil. 25 g of soil was extracted with 100 mL of 0.1 N
H2SO4. It was then neutralized with 1.0 N NaOH. 15 g L-1 agar and water was added to
fill up to 1 L. 0.2-µm filter sterilized Wolfe’s micronutrient solution (0.05%) was added
to the autoclaved media cooled down to 60°C. 1/10 R2A, salt agar and soil agar plates
were also incubated anaerobically. MM2 was the other anaerobic media designed for
isolating Clostridium, which consisted of 0.5 g of KH2PO4, 0.4 g of NaCl, 0.16 g of
NH4Cl, 0.05 g of MgCl2 · 6H2O, 0.01 g of CaCl2 · 2H2O, 7.5 g of NaHCO3, and 0. 01 mg
of resazurin per liter and 0.05% of Wolfe’s micronutrient solution, with pH adjusted to
7.0 using HCl. 100 µL of soil extract (extraction method I) was inoculated and spread
onto the agar surface by a disposable spreader. All incubations were carried out at room
temperature (22°C) with heat-shock and non heat-shock samples in triplicate. Anaerobic
plates were sealed inside GasPaks (BD Diagnostic Systems, Franklin Lakes, NJ). Plate
counts were made as soon as colonies were macroscopically viable.
Aerobic fluid thioglycollate medium, modified by glucose (10 mM L-1) and
cycloheximide (20 µg mL-1), was prepared and dispensed into screw-capped test tubes
323
(100 × 16 mm). 0.2 mL of soil extract (extraction method I) was inoculated into 4.8 mL
of fluid thioglycollate medium. Tubes were incubated at room temperature to assess the
proportion of aerobic, microaerophilic and anaerobic bacteria.
In the most probable number (MPN) technique, 10-fold dilutions of 50 µL soil
extract (extraction method I) in 200-µL medium broth consisting of 1/5 R2B and
cycloheximide (20 µg mL-1) were prepared in 96-well microtiter plates. MPN was carried
out across 5 orders of magnitude in triplicate. The plates were incubated for 3 months
aerobically under room temperature. Anaerobic MPN was conducted inside an anaerobic
chamber with an atmosphere supplied with nitrogen and hydrogen. Wells were scored
positive on the basis of the presence of ATP measured by the firefly luciferin-luciferase
bioluminescence assay. MPN samples were incubated for about 2 months until the
number of positive tubes was constant. MPNs were calculated using standard probability
charts34.
A 24-well microtiter plate method was developed to provide specific isolation and
enrichment media for maximum recovery of endospore-forming bacteria. The following
media were all minimal growth media. The 24 media consisted of (1) neutralized acid
fertile soil extract agar; (2) neutralized acid desert soil extract agar; (3) neutralized acid
rhizosphere soil extract agar; (4) 1/10 R2A adjusted to pH 3.0; (5) 1/10 R2A adjusted to
pH 11.0; (6) yeast extraction with biotin; (7) 10% NaCl; (8) lysozyme; (9) nalidixic acid;
(10) NH4SO4 and 5% urea; (11) novobiocin (25 µg mL-1); (12) Sporolactobacillus
isolation medium; (13) Sporosarcina halophila isolation medium and (14) Sporosarcina
ureae isolation medium. Each of the respective chemical was added as the sole carbon
and nitrogen source in a minimal medium, namely (15) trimethylamine, (16) benzoate,

324
(17) nitrate, (18) citrate, (19) propionate, (20) arginine, (21) allantoin, (22) succinate, (23)
urea and (24) control. Once growth was observed, colonies were re-streaked onto a more
nutrient-rich media for isolation.
S. halophila isolation medium consisted of 5.0 g of peptone, 3.0 g of meat extract,
30.0 g of NaCl, 5.0 g of MgCl2, 15.0 g of agar in 1 L of water, with pH adjusted to 7.5.
The soil suspension was treated with ethanol, 50% (v/v) for 1 hour to kill vegetative
bacterial cells. After 3 days of incubation at 3°C, mainly pigmented (yellow, orange, or
pink) colonies of various sizes of Bacillus species will have developed. S. ureae isolation
medium consisted of 30.0 g of L-asparagine ·H2O, 3.4 g of KCl, 0.25 g of K2HPO4, 0.2 g
of (NH)2SO4, 0.05 g of MgSO4 · 7H2O, 2.5 mg of FeSO4 · 7H2O, 0.25 mg of MnCl2 ·
4H2O, 1 mg of biotin, 5 mg of L-cysteine in 1 L of water, adjusted to pH 8.7 with1 M
NaOH and supplemented with NaCl to a final concentration of 50 mM Na+.
Sporolactobacillus isolation medium consisted of 10.0 g of glucose, 10.0 g of
polypeptone, 10.0 of yeast extract, 0.027 g of sodium citrate, 0.5 g of KH2PO4, 0.5 g of
K2HPO4, 0.3 g of MgSO4 · 7H2O, 0.01 g of NaCl, 10 mg of MnSO4 · 5H2O, 1.0 mg of
CuSO4 · 5H2O, 1.0 mg of CoC2 · 6H2O, 1.0 mg of FeSO4 · 7H2O, 100 mL soil extract and
900 distilled water. Soil extract was prepared by autoclaving 100 g of soil mixed with
200 mL distilled water for 20 min at 130°C. The mixture was centrifuged to obtain a
clear supernatant.
9.3.13 µEVA
200 µL of soil extract (extraction method II) was filtered onto 1.5-mm2 spots using a
96-well micro-sample filtration manifold (Schleicher & Schuell, Keene, NH). Details of
325
the procedure are outlined in previous chapters35. The filtered particles were transferred
onto Tb3+- and L-alanine-doped agarose by streaking the membrane filter across the
agarose surface. A piece of polydimethylsiloxane (PDMS) of 20-µm thickness was
placed on top of the agarose to prevent aerial contamination, minimize water loss and
DPA diffusion across the agarose substrate. Images were taken with a time-gated
microscope, which consists of a pulsed xenon flashlamp (Perkin-Elmer, Waltham, MA),
and a Nikon SMZ800 stereoscopic microscope (1 mm × 0.8 mm field of view at 63×
magnification), mounted with a time-gated camera system (Photonics Imaging System,
UK). The xenon flashlamp operated at a frequency of 300 Hz. After a 100-µs delay after
the lamp pulse, the CCD camera began collecting and integrating photons for 2 ms.
Time-lapse images were recorded for 60 min to capture the endospore germination
timecourse. Germination was carried out at 30°C on top of a heated microscope stage.
Each sample was analyzed in triplicate with 8 fields of view.
9.3.14 SpectroEVA
For the determination of DPA in soil samples, 2.0 g of freeze-dried sediment was
weighed into 10mL glass ampoules and suspended in 5 mL of 0.5 M HCl for extraction
of DPA. Standard addition was used for quantification, taking into account background
and possible quenching of terbium dipicolinate fluorescence, but also potential loss of
DA during extraction. Therefore, five additional samples were spiked with different
amounts of DPA by suspending the sediment aliquots in standard solutions with defined
DPA concentrations. DPA standard solutions (in the concentration range from 100 nmol
L-1 to 2 mmol L-1, corresponding to 0.25–5.0 nmol DPA g-1 sediment) were also prepared
326
in 0.5M HCl. For release of DPA from endospores in the sediment, samples were
autoclaved and filtered as described for the spore suspensions. Because of the high
background fluorescence, presumably caused by humic material in the sediment, DPA
had to be extracted from the filtrate. After cooling, the samples were transferred to 40mL
centrifugation tubes, and the glass ampoules were rinsed with 5 mL of 0.5 M HCl to
quantitatively transfer DPA. The pH was checked and adjusted to 0.5 by adding HCl
(35%), if necessary. The aqueous solution was extracted three times with 20 mL of ethyl
acetate. In each extraction step, the sample was vortexed for about 1 min and centrifuged
(4000 g, 10 min, 15°C), and the added ethyl acetate was removed with a disposable
pipette. The three ethyl acetate phases obtained were transferred into the same 100-mL
round-bottomed flask. The solvent was evaporated, and the extract was redissolved in
5mL of sodium acetate buffer (1 mol L-1, pH 5.6) and subsequently washed with diethyl
ether (10 mL) and ethyl acetate (5 mL). To the sodium acetate fraction containing the
DPA, 100 mL of an AlCl3 solution (2 mmol L-1) was added to minimize quenching of
terbium dipicolinate fluorescence by phosphate-containing substances36. As
organophosphates, e.g., NAD, have been shown reduce terbium dipicolinate fluorescence,
presumably by complexation of terbium37, addition of Al3+ was expected to saturate the
Tb3+-binding sites and reduce this effect. After addition of AlCl3, the samples were
passed through a 0.2 mm cellulose acetate filter.
For fluorescence measurements, 3 mL of the filtrate was transferred to a 3.5mL
quartz cuvette. First, emission spectra of the samples without addition of terbium were
recorded to obtain background spectra for baseline correction. For the fluorimetric
detection of DPA, 30 mL of a 1 mmol L-1 TbCl3 solution was added, and the samples
327
were mixed in the quartz cuvette by pipetting up and down several times before
measurement. To check for extraction efficiency, the residues of the diethyl ether and
ethyl acetate washing fractions were also dissolved in sodium acetate buffer and
subjected to fluorimetric detection of DPA as described above.
9.3.15 Extraction of DPA
DPA can be extracted with ethyl acetate from the aqueous phase after adjustment of the
solution to pH 1.838. However, our own experience from experiments with internal DPA
standards showed that the samples had to be acidified to as low as pH 0.5, which was
achieved by resuspending the sediment in 0.5 M hydrochloric acid prior to autoclaving.
Extraction efficiency is strongly influenced by pH. Therefore, it can be necessary to
adjust the pH after autoclaving, particularly if carbonate-rich sediments are being
analyzed. Three times extraction with twice the volume of ethyl acetate at pH 0.5
generally resulted in an extraction efficiency of more than 96%. Further purification was
achieved by redissolving the extract in 5 mL of sodium acetate buffer (pH 5.6) and then
washing with diethyl ether and ethyl acetate. At this pH, a loss of DPA caused by the
washing procedure was not observed.
Spore suspensions were extracted immediately after determination of spore counts to
avoid possible alteration of DPA content due to germination of spores and possible
subsequent microbial degradation of DPA. For extraction of DPA from endospores, 5mL
volumes of endospore suspension (with at least 108 spores mL-1, necessary for
quantification of DPA via HPLC) were placed into autoclavable 15 mL polypropylene
tubes with screw caps (Sarstedt, Germany) and autoclaved at 136°C for 45 min to
328
completely release DPA from endospores39. Impermeability of the tubes was confirmed
by weighing all samples before and after autoclaving. After cooling, the samples were
centrifuged (4000 g, 5 min, 15°C), and the supernatant was sterile-filtered (0.2 mm pores,
cellulose acetate) to remove spore debris.
9.3.16 ATP measurement
ATP was assay from soil extracts using a portable luminometer (New Horizon
Diagnostics). The ATP luciferin-luciferase was kept cold at 4°C until reconstitution with
buffer before use. The instrument was calibrated using reagent blanks and ATP standards
for initialization. 1000 µL of the soil extract was added into a disposable test device with
a permeable membrane filter disc, called Filtravette, equipped with a cell concentrator. 4
drops of somatic cell releasing agent were added to the Filtravette. The fluid was filtered
through the filter disc by applying positive pressure on top, thereby concentrating target
analytes and removing interfering substances. The filter retentate was further washed
with 4 more drops of somatic cell releasing agent and then 2 drops of bacterial cell
releasing agent. 50 µL of reconstituted luciferin-luciferase reagent was added to the
Filtravette immediately before bioluminescence reading was taken with the luminometer.
Light intensity would be integrated for 10 seconds and measured by a hand-held
microluminometer (model 3550i, New Horizon Diagnostics). Triplicate measurements
were made to determine the number of vegetative cells. To assay for the number of
bacterial endospores, the previously heat-shocked soil extract was aliquoted into 3 tubes
with an equal volume of 1/10 TSB and 50 mM L-alanine. The same ATP assay was
applied after 24 hours of incubation at 37°C.
329
9.3.17 Microscopic enumeration
The DNA-intercalating fluorescent dye, SYPRO® gold (Molecular Probes, Invitrogen)
was used to determine the number of total cells by epifluorescence microscopy. To
dislodge cells from soil particles, the protocol described by Epstein and Rossel was
modified40. Aliquots of fixed sediment samples were mixed with 0.2-µm filter-sterilized
and autoclaved water. The samples were sonicated three times for 1 min at the lowest
setting with a microtip. Aliquots of the sonicated soil samples or fixed pure cultures were
diluted in 5 mL of particles-free PBS and stained with SYBR-GOLD (1 µg of
SYBR-GOLD per mL of PBS). After 10 min of staining, the cells were concentrated by
filtration onto black polycarbonate filters (pore size , 0.2 µm; Nuclepore). The membrane
filters were mounted with immersion oil. Epifluorescence microscopy was performed
with a Nikon Optiplex microscope. For each filter no fewer than 400 cells were counted
in at least 10 microscopic fields.
The LIVE/DEAD BacLight kit (Molecular Probes, Invitrogen) was employed to
assess the viability of vegetative bacterial communities. Phase contrast microscopy was
performed to determine the total number of endospores present. Endospores are not
stainable but they can be observed as phase-bright oval bodies under phase contrast
optics. Malachite green staining was performed to identify the presence of endospores.
Endospores would be stained green while the rest would be stained red.
Metabolically active bacteria were enumerated using the fluorescent reagent
5-cyano-2, 3-ditoyl tetrazolium chloride (CTC). CTC was used a final concentration of 5
mM in 3-h incubations at 37°C to determine concentrations of actively respiring cells for
total and metabolically active cells41. CTC was used to test the respiratory activity during

330
germination and growth. Reduction of CTC was used to evaluate the respiratory potential
of freshly isolated endospores. Dehydrogenase activity in bacterial respiration was
measured with this dye, which has the ability to produce a red fluorescent molecule
(formazan) when reduced. A stock solution of 50 mM CTC was prepared in sterile
ultra-filtered water. 90 µL TSB and 10 µL CTC stock solution (final concentration of 5
mM) were incubated for an additional 2 hours at 37°C in the dark. The stained samples
were loaded on a filtration apparatus and pumped through a 0.22-µm nucleopore
polycarbonate filter. The filters were mounted on a slide and observed under a 100× oil
immersion objective.
9.3.18 Ecology study and strain identification
Bacterial spores were isolated on Rodac plates from the Atacama Desert in 2005. They
were stored in darkness at 4°C for 9 months before study. Thermophilic and
psychrophilic endospores were isolated from soils in Jet Propulsion Laboratory, Pasadena,
CA. Soil samples were collected with sterile metal scoops and dispersed in 0.1% sodium
pyrophosphate with 0.01% Tween-80 in a ratio of 1 g soil to 10 mL solution. The soil
slurry was vortexed at maximum speed for 5 minutes and then let settled down for 30
minutes when clear sedimentation was observed. The supernatant was extracted and heat
shocked at 80°C for 15 minutes to select for endospores, following by plating and
isolation on TSA. Thermophilic and psychrophilic endospores were selected by
incubating cultures at 60°C and 7°C, respectively. DNA amplifications were performed
in a reaction containing ~50 ng of pure culture genomic DNA, 2.5 U of Taq DNA
polymerase (Applied Biosystems), 5 µL of 10× PCR buffer, 2.5 mM MgCl2, 200 µM
331
each deoxynucleotide triphosphate, 150 ng µL-1, 1 µM each forward and reverse primers,
and sterile water to a total volume of 50 µL. Reaction mixtures were irradiated with
ultraviolet light for 5 min at 254 nm (1000 J/m2) before the addition of template and Taq
DNA polymerase to eliminate potential contamination42. All negative controls with water
instead of DNA template were tested.
9.3.19 Sporulation
Spores were prepared in 2 x SG sporulation agar43. All ingredients were obtained from
Sigma unless otherwise stated. 16.0 g nutrient broth (Difco), 2.0 g KCl, 0.5 g MgSO4 and
16.0 g agar in 1 litre of water were suspended in water with pH adjusted to 7.0. The
medium was autoclaved and let cool down. 1.0 ml 1 M Ca(NO3)2; 1.0 ml 1 M
MnCl2·4H2O, 1.0 ml 0.001 M FeSO4 and 2.0 ml 5% L-glucose (w/v) were freshly made,
filter-sterilized and added after cooling of the media. Vegetative bacteria in exponential
growth phase were inoculated onto agar plates. Thermophilic spores were incubated at
60°C for 10 days, mesophilic spores were incubated at 37°C for 10 days; and
psychrophilic spores were prepared using the protocol outlined in Chapter 7. Percent
sporulation was monitored by observing phase-brightness under a phase contrast
microscope (Nikon). Spores and cells were collected by adding 5 mL of sterile deionized
water into each agar plate and cell scrappers. The resultant suspension was sonicated for
5 minutes (Branson) and then washed 4 times at 13,200 rpm for 20 minutes. Lysozyme
(50 µg mL-1) was added and the suspension was incubated at 30°C for 2 hours.
Subsequent washing (6-12 times) using sterile deionized water performed until the
suspension was more than 95% spores. The spore suspension was then stored in water at
332
4°C in the dark. Psychrophilic endospores were prepared in the way outlined in Chapter
7.
9.3.20 Spore size measurement
Cell volume is calculated from simple length and width measurements and the
application of simple geometrical formula under a phase contrast microscope.
Transmission electron microscope was performed at the imaging center at Caltech. Spore
counts were determined by phase contrast microscopy using a hemocytometer counting
chamber. At least 24 randomly chosen squares with about 100 cells were counted.
Suspensions were diluted to an appropriate spore density of about 108 spores mL-1. For
volume determination, the shape of the endospores was approximated as a cylinder with
hemispherical ends. Volume (V) was calculated from the length (l) and width (w) of the
spores using the following formula44,45:
V π l w π.
This formula can be used for rod-shaped as well as coccoid spores, as for cocci the term
(l–w) becomes zero. For calculation of spore volume, the length and width of at least 100
spores were determined. Associated errors were estimated by consideration of error
propagation on the basis of SDs of length and width measurements.
9.3.21 Hydrophobicity
Spore surface hydrophobicity is measured using a modified BATH assay by Rosenberg et
al.46 Spores are suspended in 100 µL of water with an initial A660 around 0.4 to 0.5. 10
µL of n-hexadecane (MP Biomedicals, Solon, OH) is added. The mixture is vortexed for
333
1 minute and then let settle for 15 minutes before pipetting out the organic hydrocarbon
layer. Absorbance measurements are done on the aqueous layer using a NanoDrop
spectrophotometer. Percent hydrophobicity is calculated by 100 – (A600 after / A600before) ×
100.
9.3.22 Germination
DPA measurement is equivalent to the measurement of germination propensity. 1.5 mL
of extract was pipetted into methylcrylate cuvettes at each time interval. 1.5 mL of 50 µM
TbCl3 supplemented with 10 mM aluminum chloride buffered with 10 mM sodium
acetate to pH 5.5 was added. The luminescence intensity was measured using the
following home-made spectrometer: the spectrometer consists of a 24 W pulsed xenon
flashlamp (FWHM ~5 µs and tailing out to ~50 µs), a photomultiplier tube (Hamamatsu
R6353P, Bridgewater, NJ), 2 concave aluminum mirrors and 2 bandpass filters. Pulsed
excitation light at 10Hz was focused on samples with a concave aluminum turning mirror
and band-limited by an interference filter (50% pass bandwidth 255–280 nm, 23%
maximum transmittance). Luminescence from the sample traversed through a bandpass
filter (50% pass bandwidth 538–553 nm, 70% maximum transmittance) and another
concave aluminum mirror to enter the PMT. The filter set was chosen to overlap with the
excitation and emission spectra of Tb-DPA. Time gating was achieved by a delayed
detection of the sample luminescence after each flash, according to a chosen delay time.
Throughout all measurements in this study, the PMT was operated at 950 V,
photocathode aperture set to be 15 mm × 10 mm, delay and integration time was 100 µs
and 2 ms, respectively. The entire assembly was shielded from ambient light using a
334
black anodized aluminum enclosure. The spectrometer was custom constructed by
Jobin Yvon, Edison NJ. Cuvettes and tape matrix were measured at a distance of 15 mm
from the spectrometer.
9.3.23 UV inactivation
A low-pressure handheld mercury arc UV lamp (model UVG-11; UVP) was placed over
a sample, and the UV flux at the surface of the spore suspension was measured using a
UVX digital radiometer (UVP). The exposure time required to produce 1,000 J m–2 of
energy at the sample surface was determined to be 167 s at 600 µW cm–2. The spore
suspension was placed in an uncovered 100 mm glass Petri dish containing a magnetic
stir bar and was exposed to UV254 irradiation under sterile conditions. In a
qualitative screening analysis, strains surviving 1,000 J m–2 irradiation were selected for
quantitative lethal dose curve analysis. Samples (100 µL) were removed after specific
periods of time, serially diluted, and plated on TSA. The dose at which 90% of the spores
were inactivated (LD90) was >200 J m–2.
Spores resistant to UV254 irradiation were exposed to UVA (315 to 400 nm),
UVA+B (280 to 400 nm), or total UV (200 to 400 nm) at a simulated Mars constant level
of total solar irradiance of 590 W m–2 (190 nm to 3 µm) using an X-25 solar simulator
(Spectrolab) equipped with a xenon arc lamp located at the Environmental Test
Laboratory, JPL. The intensity of UV irradiation was approximately 10% of the
intensity of the full spectrum (59.0 W m–2). The total level of irradiance in these
simulations matched the actual Mars constant level of solar irradiance, 590 W m–2..47-49
The intensity of the irradiation was constantly adjusted by fine-tuning the lamp power to
335
achieve ±5% variability, as indicated by an Optronics Laboratories OL754
spectroradiometer. The various bandwidths were generated by using Corning glass (UVA)
or plastic Petri dish lids (UVA+B; Fisher Scientific) as filters in front of the sample
cuvettes. The lethal doses were calculated for each strain in order to estimate LD50, LD90,
and LD100 UV dosages. LD100 was defined as the UV dose at which no cultivable
spores were recovered using the procedures described here.
9.4 Results & Discussion
Understanding the boundary conditions for survival in extreme environments and
subsequent revival with water will aid the NASA effort for preparing to search for life on
Mars. Bacterial spores are highly resistant to both dehydration and high temperatures and,
for this reason; endospore-forming bacteria are extremely common in soils. Exospores
produced by micro fungi and Actinomycetes are generally considered to be a means of
dispersal rather than of survival. There is strong evidence, however, that exospores are of
significantly greater resistance to desiccation. It is also possible that exospores are able to
respond faster to an improvement in conditions than surviving but stressed bacterial cells.
The Atacama Desert serves as a proving ground for future life detection instrumentation,
and characterizing the environmental microbiology will provide an important context for
data sets to be obtained by future instruments slated for flight. Finally, understanding
which phylogenetic groups and species of microorganisms are most likely to grow in
Mars special regions will aid in establishing planetary protection requirements to help
prevent forward contamination. We have performed a series of culture-based and
culture-independent methods to analyze the microbial, in particular endospore,
336
abundance and diversity, along with measurements of PLFA, TOC, anion concentrations,
soil reduction potential, conductivity, temperature and water potential for surface (0-20
mm) and subsurface (20 – 200 mm) samples from Site A, Site E and other interesting
locations. A list of all sample collection sites are tabulated in Table 9.1. The
corresponding microbiological results are shown in Table 9.2. In this results section, we
will focus on (1) Site A & E characterization, (2) water augmentation experiment, (3) air
sampling, (4) depth profile and (5) other interesting sites.
9.4.1 Spatial and temporal heterogeneity in Site A and Site E
Hyper-arid and highly oxidizing soil in Atacama Desert, the habitat predominantly
studied to date as a proxy for extraterrestrial life, differs from other extreme
environments on Earth, such as permafrost, deep-sea hydrothermal vent, ice cores, in its
absence of culturable bacteria and zero water activity, which precludes metabolism of all
types of bacteria. The total organic carbon content varies from 0.05% to 0.1% in the soil.
The pH is acidic. The redox potential (Eh) of the investigated samples varied from +260
to +480. The water activity recorded ranged from 0.01 to 0.08 during the day and peaked
at 0.52 in the early predawn hours, which is also below the lowest reported aw for
microbial growth. The total organic carbon content was between 880 and 1700 µg g-1,
which was around the borderline of the limit of quantitation (1000 µg g-1). Most desert
soils contain significantly more organic carbon. For example, the TOC for samples
obtained from the Mojave in Eureka Valley, California was 7,000 µg g-1. There were no
significant differences in water activity, soil chemistry and TOC levels between surface
and subsurface samples from sites A and E.
337
Navarro-Gonzalez et al. has report in the Science journal in 2003 that site A is a
near-sterile region with no recoverable DNA and extremely low culturable counts22. And
my research group has investigated the soil chemistry and microbial diversity in site in
previous trips to Atacama. So, it will be interesting to track the temporal change in
microbial counts. Normal soil contains around 107 – 108 culturable bacteria per gram and
normal desert soil contain around 104 culturable bacteria per gram. However, in the
Atacama Desert, we have observed a very low count from 0 to about 400 vegetative cells
per gram. And the recovery of spores is even lower. Top means the surface 3-6 cm layer
of soil. SUB means the 12-cm layer underneath the surface. While commonly used
medium, R2A, recover only a low number of bacteria, the 2 media that I used, namely
salt agar and soil agar, are much better in recovering soil-borne bacteria. Salt agar is
made to mimic the salt concentration in Atacama Desert soil; and the soil agar is made
directly from the native soil. The nutrient level in these two media was kept very low to
give microorganisms enough time to recover; otherwise too much nutrient will simply
kill them instantly. Soil extract plated on rich media, such as full strength R2A, resulted
in fewer colonies than 1/10 R2A (Figure 9.1). The rapid increase in nutrient availability
was considered stressful to bacteria50. Although PLFA analysis has suggested the
presence of large relative numbers of Actinobacteria, no colonies were observed in the
Actinomycetes isolation media, suggesting most of them were either dead or
nonculturable. Total microbial counts on spread plates ranged from 102 to 103 cfg g-1.
Heat shock survivor counts were between 0 and 1 cfu g-1, indicating 0.1% to 1% of the
culturable soilborne microorganisms were endospores. However, incubation in a liquid
medium using the MPN number for enumerated resulted in cell counts that were 1 – 2
338
orders of magnitude more. This may suggest that water was more amiable to the
microbes. Using paired t-test, no significant difference was observed between the surface
(0 – 20 mm) and subsurface samples (20 – 200 mm), between site A and site E.
Patchiness is a fundamental attribute of soil ecosystem Presence of patchiness and
importance in maintaining bacterial diversity51-54. In order to quantify microbial
abundance over an area, one needs to interpolate values between sampling sites. In doing
so, one may be able to identify hot spots or high residence numbers. Mapping can be
done using conventional geostatistical methods such as construction of a variogram to
model the correlation that exists as a function of distance between stations to calculate
predicted values for locations in an area. The heterogeneity of soilborne bacteria can be
thought of discontinuities in space and time (i.e., patchiness). Zhou et al. observed that
soils which were saturated with water had both fewer bacterial taxa and a more uneven
distribution of bacteria taxa than unsaturated soils54. They suggested that this difference
was the result of patchiness in the unsaturated soil (i.e., the lack of water reduced
migration between soil particles), which allowed the coexistence of a larger number of
bacterial taxa and produced a more uniform community composition. Complexity in
environmental conditions can vary at multiple spatial scales and could potentially
influence bacterial diversity. Microscale heterogeneity (e.g., at the scale of a soil particle)
can be very high and potentially allows for high microbial diversity in a relatively small
area. For example, within a single soil particle, oxygen concentrations can range from
21% to 0% over only a few millimeters55.
Some interesting observations can be observed when compared this dataset with the
previous 2 trips in 2003 and 2005. The culturable biomass in 2003 were determined to

339
range from 2 × 10² to 5 × 10³ cfu g-1 and the heat shock survivors were around 101 - 102
cfu g-1. While we have comparable total cell counts, the 2007 heat shock survivor counts
were lower by at least an order of magnitude. Other than patchiness and slight differences
in the extraction protocol, a plausible reason may be the difference in effect heat shock
temperature. In 2003, heat shock was performed inside a small air incubator at 80°C for
15 minutes on agar plates inoculated with soil extract. A later study found out that the
effective temperature experienced by the microbes was merely around 60°C. Our current
heat-shock protocol involves heating soil slurry contained in tubes inside a 80°C water
bath with a large heat capacity for 15 min. Yet, most of the heat-shock survivors
recovered from the 2003 trip were found to be spore-forming species. In addition,
bacteria isolated from the Atacama Desert have exhibited resemblance to psychrophilic
counterparts in terms of germination behavior, DPA content, heat tolerance and
hydrophobicity. These bacteria also demonstrated preference to grow in liquid media than
solid plates, suggesting their hydrophilic origin. We postulate that the endospores
residing in the Atacama Desert soils have a cold origin, possibly brought by wind from
Antarctica. This hypothesis will be tested in the coming sections.
The 2005 data, however, showed extremely low counts. 7 months prior to the 2005
sampling, there was a rare rainfall even accounting for 20 mm of precipitation in these
areas. We have a hypothesis that transient water revived dormant life forms but the
subsequent harsh environment killed them immediately. The top layer (0 – 200 mm) of
the Atacama Desert soils represented a dynamic contributed not by microbial activities
but the action of wind. Since the perennial low water activity in the hyperarid area did not
support any microbial activities, the resident microbes were brought in by the action of
340
wind from neighboring areas, including Antarctica, giving rise to the psychrophile-like
bacteria in Atacama.
9.4.2 Water augmentation
The availability of water (often expressed as water activity, aw) is of major importance to
microorganisms as to other forms of life. Fluctuations in the osmolarity of the
environment immediately surrounding an organism are the source of considerable stress
and there must be a strategy to permit growth and survival56. Growth requires the
maintenance of positive turgor pressure; the pressure differential between the internal
osmotic pressure and that of the environment. The Atacama Desert is permanently arid
and select a specialized microflora. This requires survival rather than growth and
microorganisms produce a variety of desiccation-resistant bodies including endospores
and exospores, many of which can persist for extended periods of time. Coccal-shaped
are more resistant than rod shaped and drying out of an environment can change the
balance of the population after rehydration.
A water augmentation experiment was carried out to mimic the effect of rainfall by
adding sterile water into different patches of soil, confined by these stainless steel rings.
We had added 200 mL of water into each of the 15 rings, simulating a 26 mm rainfall.
We added water at day 0 and sampled a set of 3 rings per day for a total of 5 days. Upon
addition of water, we noticed a spike in microbial activity, germination propensity of
endospores, and an increased in culturable counts, which quickly died off within the next
2 days. Water activity was monitored and undisturbed soils were sampled on a daily basis.
The level of nutrients, associated with these changes, the anion composition, total organic
341
carbon and PLFA were also measured before and after water augmentation. Microbial
activity as measured by ATP luciferase assay increased sharply after the addition of water
and rapidly decreased to background levels as the soil dried (Figure 9.2). Soil water
activity correlated with microbial activity and endospore germination on the first day
after addition of water. Non-augmented soil did not exhibit any measurable microbial
activity or endospore germination. All these experiments were performed on the field. To
verify our results, an analogous experiment was conducted under simulated laboratory
conditions. A similar trend was observed in the culturable, metabolizable and germinable
results with a slight shift in time (Figure 9.3), which may be due to the age of soil, and
differences in environmental factors. But the bottom line is that we still observed a bloom
in microbial activity after water addition. This finding is in favor of our hypothesis that
water revives microorganisms in the soil but they are killed subsequently.
Kieft et al. used a chloroform-fumigation biomass assay to study a similar water
augmentation effect on dry soils19. They have reported a sharp pulse of respiration during
the first 2 days, followed by a gradual decline to background or control rates of soil,
similar to what we have observed. But caution has to be taken in analyzing our in situ
data collected in the desert because we did not decouple the microbial response to wetting
effect from other effects such as increase solute diffusion or increased microbial mobility.
We repeated the same experiment under simulated arid condition by drying the same soil
and control kilned soil. The slight difference between the two analyses increases our
confidence in the authenticity of our in situ data.
Adenosine 5’-triphosphate (ATP), the central molecule of bioenergetic reactions,
occurs in all terrestrial microorganisms. In this study, we try to develop a way to measure

342
ATP in soil. This procedure is based on the use of the firefly luciferin-luciferase
bioluminescence reaction. The amount of light emitted is proportional to the amount of
ATP. Efficient extraction of ATP from soils requires reagents which will lyze cells,
disrupt other organic complexes and release ATP chemically bound to soil, but will not
destroy luciferase activity in the time required for measuring the peak luminescence
intensity.
9.4.3 Air sampling
Following the previous hypothesis that deposition of airborne endospores is the source of
soilborne microorganisms, we have carried out an active and passive air sampling to
study the interaction of microbial exchange between the air and surface, in relation to the
various environmental factors such as UV irradiation, relative humidity, temperature and
wind velocity. Airborne transport of microbes was more prevalent during the night than
daytime, as reflected by active and passive air sampling results. Almost nil culturable
counts were recorded during the day using the SAS air sampler, while nighttime sampling
gave an airborne bacterial concentration between 0.1 and 0.5 cfu L-1 (Figure 9.4). This is
consistent with the fall-out plate results in which 0 microbial deposition rate was
recorded during the day but 0.01 cfu hr-1 was recorded during the night. The higher
relative humidity, absence of UV radiation and higher wind speed at night may have
contributed to these observations. Since the absence of water in the Atacama Desert does
not allow microbial activity, most of the resident bacteria are likely brought by winds
from the neighboring environments taking place during the night. During the day, UV
radiation inactivates all microbes exposed to the sun, particularly the microbes traveling
343
in the air. Airborne microbes have been reported to possess a lower resistance to stressors
than bacteria attached to surfaces. This fits into our hypothesis of the aerial dispersal of
endospores via wind57. In fact, the intercontinental transfer of endospores has been
reported in the literature58. This model may also shed light on the scenario in Mars,
whereby the cosmic and UV radiations sterilize all exposed surfaces. Subsurface
microbes, if there are any, may be aerosolized at night by winds to colonize different
niches of Mars.
9.4.4 Depth profile
The Atacama Desert has remained stable and arid for the past 150 Ma, containing a
sedimentary record of deposition from Late Jurassic to present days. The upper soil layers
are dry and weathered, precluding any downward infiltration. The possibility of
penetration of microorganisms into the soil subsurface is highly unlikely. For this reason,
we hypothesize that airborne endospores from the past deposited on the soil surface were
entombed into sedimentary layers in a dormant form due to the continual low water
activity. And the bacteria along this depth transect will exhibit a trends reflecting their
survival strategy, longevity and the dry limit of dormancy. In this experiment, following a
vertical transect of 6 depths in a soil pit from 80 cm to 220 cm underneath the surface soil,
we have determined he biomass in terms of colonies, germinable counts, TOC and PLFA
contents. Culturable counts were obtained using spread plating and MPN methods.
Similar the sites A and E, the bacteria elicited preferences in growing in the liquid media
than the solid plates. Actinobacteria constituted around 20% of the culturable biomass,
which ranged from 101 – 5 × 10² cfu g-1. A slight increase in CFU was observed along the
344
depth profile (Figure 9.5). µEVA has successfully recovered 110 – 15 spores g-1,
following a decreasing trend toward deeper samples (Figure 9.6).
Phospholipid fatty acid (PLFA) is a measure of viable biomass in soil. Normally,
once a bacterium dies, its PLFA content will be rapidly degraded by other bacteria.
However, the soil water activity rarely rises above the metabolic activity. So, in the
absence of metabolic activities, PLFA may be preserved on the timescales of chemical
oxidation. So, a lot of the PLFA is presumably derived from dead bacteria accumulated
for thousands and millions of years. Both TOC and PLFA analyses showed an increasing
trend of total biomass along the depth transect. At 217 cm underneath the surface, a total
organic carbon of 34500 mg kg-1 of soil was measured and a PLFA content
corresponding to 92000 cell g-1 was measured. In addition to nitrate, composite analyses
of the soil pit indicate substantial amounts of chloride and sulfate59,60. The age of the soil
samples were estimated by carbon 14 dating. The measured radiocarbon age of the
bottom sample as 35080 ± 320 BP and the top sample was 25640 ± 180 BP. The 13C to
12C ratio was -27.3 for both cases. These results suggest that the organics and dead
remnants of microbes were preserved over years, presumable due to aerial deposition of
microbes. Some intact plant root remains were discovered towards the bottom of the soil
pit, indicating a minimal biological degradation and preservation of ancient organics in
the hyperarid region.
9.4.5 Determination of DPA by terbium dipicolinate fluorescence assay
Hindle and Hall reported the limit of detection of the Tb-DPA luminescence assay to be 2
nM61, which is theoretically equivalent to 105 spores g-1 soils. By optimizing the protocol,
345
we are able to detect 200 nM of DPA within the limit of quantitation, corresponding to
104 spores g-1 soils. The Atacama Desert soils, however, contained a much lower
concentration of soilborne endospores. In addition to this, potential interference and
quenching effect by humic substances in the soils makes spectroscopic detection of DPA
an even more challenging task. So, prior to spectro-EVA analysis, a DPA extraction
protocol based on ethyl acetate phase separation has been performed. Using this method,
the dual-peak spectral characteristics of DPA can be observed in the excitation spectrum
with an improved Euclidean cosine squared correlation coefficient from 0.23 to 0.80.
This is the first application of Tb-DPA luminescence assay on the analysis of soil
samples (Figure 9.7).
9.4.6 Other interesting sampling locations
In general, 2 sampling strategies were employed in this study. One was the sampling
along transects of certain interesting characteristics (depth profile and Ponce Hill water
runoff). In the depth profile sampling, zigzag sampling along the depth transect was
performed. The unit of sampling distance is the distance underneath the ground level in
the soil pit depth transect along which the depth profile samples were taken. If the
sampling distance was too large, potentially useful information about the distribution of
the depth would be lost. If it was too small, successive samples would be correlated, in
which case it would be difficult to determine the confidence interval for the microbial
abundance estimate. The second was sampling in special isolated sites, such as site A,
site E, the rhizosphere and copper mine soils, and ground water. Random sampling was
carried out in this case. Therefore, herein, the sampling sites were chosen to allow the
346
unbiased reconstruction of an original distribution field. Figure 9.8 shows a comparison
of heat-shock culturable and germinable endospores quantified by µEVA across all the
sampling sites in Atacama.
Most aerobic endospore-formers are saprophytes widely distributed in the natural
environment. Based on µEVA and cultivation experiments, endospores constitute
approximately 40% of the total heterotrophic biomass in the Atacama Desert, eliciting a
large degree of heterogeneity. We would like to reconstruct the distribution field of
endospores in the Atacama Desert. Patchiness is a fundamental attribute of ecosystem
and geostatistical tools were used to help with the sampling strategies. The soil contains a
considerable quantity of organic matter as well as mineral constituents accumulated for
thousands of years because the low water activity does not support any microbial
decomposition. The autochthonous microflora of the soil is always present in significant
numbers, irrespective of the nutrient status. In contrast, the allochthonous microflora is
dependent on a periodic increase in nutrient status and, under normal conditions, is
present only in very small numbers or present as either exospores or endospores.
Response to a local increase in nutrient level is rapid and colonization of organic material
by allochthonous microorganisms can occur immediately.
The rhizosphere is the region of soil immediately surrounding the root hairs of
plants together with the surface of the roots themselves. In the rhizosphere region, which
effectively extends a few millimeters from the surface of each root, microorganisms are
directly influenced by the biochemical activities of the plant. Some bacteria are able to
live in ores containing high metal concentrations. These endospores are highly tolerant of
high concentrations of metals. An unusual relationship occurs between
347
penicillin-producing fungi and B. cereus in areas containing high metal concentrations.
Penicillin-producing fungi are highly resistant as a consequence of the breakdown of
penicillin into the metal-complexing substance penicillamine. B. cereus is not inherently
resistant to metals but is highly penicillin resistant and is able to use the fungal defense
mechanism against metal toxicity.
9.4.7 Ecological Study
It has been reported that sporulation condition will, to a certain extent, affect spore
properties62. So, we have adopted a very close sporulation protocol among all the spores,
except for differences in sporulation temperatures for thermophilic and psychrophilic
spores. We have also picked the properties that are reported to be invariant to sporulation
conditions, namely DPA content per unit volume, spore size and hydrophobicity63,64. Size
of some small spores (<0.5 µm3) from Atacama Desert remain small after 1 generation
and sporulation. Similarities are observed between spores isolated from Atacama Desert
and psychrophilic spores. Neither the spore nor vegetative form is hydrophobic. Both of
them have high DPA per unit volume ratios. DPA is one of the contributory factors for
UV resistance. It has a very high molar absorption coefficient in the UV wavelength and
therefore acts as an effective UV shield for spores. Psychrophilic bacteria are usually
more UV resistant and it makes sense for them to have a spore core more densely packed
with DPA. In addition, Atacama Desert is a place with intense solar radiation. In the
1960s, Cameron has found psychrophilic bacteria, but no thermophilic bacteria, in
Atacama Desert65,66. The fact that Atacama spores behave close to psychrophilic spores
may suggest the presence of cold-living spores in the desert. Though counterintuitive, this
348
hypothesis will be tested in our future trip to Atacama Desert.
A total of 18 spore-forming species were studied in this case (Table 9.3). All
negative controls with water instead of DNA template showed no amplification. We have
also tested several of the reagents we used and confirmed that there was no contamination.
The results of PCR were reproducible. Figure 9.9 shows the hydrophobicity of the
different species. Insights into properties of endospores residing in extreme habitats are
of great importance in the exobiological life detection technological development. We
tested endospores from several Bacillus strains isolated from the Atacama Desert for their
endospore properties, heat, UV, oxygen plasma resistance, germination kinetics and
compared these characteristics with the laboratory Bacillus strains. Endospores from the
Atacama Desert showed a large variation in heat resistance, UV resistance. Most of the
isolates were less sensitive than the laboratory strains to the germinants tested. A clear
link between DPA content and degree of resistance cannot be established.
9.4.8 Germination model
A germination model based on optical density drop has long been proposed by
McCormick in the 1960s67. In this study, we have formulated a parallel mathematical
model based on DPA released measured by Tb-DPA luminescence assay. Experiments
show that OD600 measurement correlate very well with Tb-DPA luminescence
measurement in monitoring the initial germination timecourse of various types of
mesophilic lab-strain spores. Both assays measure the events taking place in the stage I of
germination. As a control experiment, the firefly luciferin-luciferase assay has been
employed simultaneously. A delayed release of ATP has been observed. This is
349
consistent with the germination timecourse because ATP synthesis occurs in the second
stage of germination. D-alanine has also been used to study its inhibitory effect on
L-alanine and AGFK-induced germination.
Table 9.4 lists the germination parameters and some other properties of all 18
species of spore-forming bacteria. Figure 9.10 shows the modeling the L-alanine induced
germination kinetics based on Chapter 7. For instance, Lab-strain B. cereus demonstrated
no lag period and finished germination in less than 60 min, giving a mircrolag period, t0 =
0 min, germination time, α = 1 min, and transition probabilities λa = 0.6 min-1 and λb =
0.08 min-1. Another Lab-strain B. atrophaeus endospores demonstrated a lag period
before a synchronous germination event, giving t0 = 4 min, α = 8 min, λa = 0.4 min-1 and
λb = 0.10 min-1. B. pumilus XJU-3 endospores isolated from the Atacama reaching
plateau after 24 hours. The parameters are t0 = 260 min, α = 850 min, λa = 0.4 min-1 and
λb = 0.008 min-1. All endospores demonstrated sigmoidal kinetics in the exception that
one of the Atacama isolate had a biphasic sigmoidal kinetics. In general, the microlag
period and rate of germination of environmental spores were longer than their lab strain
counterparts. This delayed response to germinants presents a strategic advantage of
environmental spores. Commitment to germination is an irreversible process and it means
the concomitant loss of resistance. This property prevents environmental endospores
from responding to transient favorable conditions.
9.4.9 Germinability and culturability between lab strains and environmental strains
One of the driving forces behind this project is to examine differences between laboratory
strain and environmental strain endospores. Some of the current methods that we have
350
developed involve fluorimetric determination of dipicolinic acid (DPA), a spore
core-specific compound, after reaction with terbium chloride. The concentration of DPA
in natural samples is converted into endospore numbers using lab-strain pure cultures
such as B. atrophaeus as standards. This assumption only holds when the DPA content of
environmental endospores and laboratory growth endospores are comparable. In this
study, we carried out a systematic study comparing these endospores.
High temperature environments are widely distributed and of many different types.
The best known are probably hot springs, geysers and surrounding sulfur-containing soils.
Equivalent hydrothermal environemnts, such as vents and seamounts (underwater
volcanoes), have also received considerable recent attention. Thermophilic bacteria are
defined as microorganisms having an optimum growth temperature in excess of 45°C.
The psychrophiles, or the cold loving organisms, are on the other side of the temperature
scale from the thermophiles. Psychrophiles are organisms that have optimum growth at
temperatures of approximately 15°C, a maximum growth temperature of about 20°C and
a minimum of 0°C or lower68. They live in cold soils and water and even in sea ice.
In this study, the effect of L-alanine has been explored as a universal germinant for
Bacillus endospores. On the other hand, D-alanine will be examined as an inhibitor for
germination69. Different chemical germinants such as inosine and AGFK were found to
facilitate the germination of certain species. For instance, B. cereus endospores
germinated much better in L-alanine with the presence of inosine. B. megaterium
endospores germinated best in the presence of AGFK only.
It has been well established that bacterial spore properties are affected by the
conditions during sporulation. In most studies, spores are routinely produced from
351
fortified agar or rich liquid media, which results in heterogeneous sporulation conditions
for the individual cells70. This prevents careful analysis of the metabolism during growth
and sporulation. Recent studies describing the effect of sporulation conditions on spore
properties involved modulation of sporulation temperature71-73 or compared spores
produced from different media74-76 and under different environmental conditions77. The
two strains of B. subtilis used in this study were germinated under the same conditions to
minimize sources of variation. Most of the properties are similar except for their
aerosolization property. The bacterial strain isolated from Mojave Desert is more
susceptible to aerosolization.
Germination timecourse was monitored by looking at optical density drop, DPA
release and ATP release simultaneously using B. atrophaeus spores. A complementary
kinetics pattern was observed between OD600 drop and Tb-DPA intensity increase, which
presumably illustrates the course of events taking place during germination stage I. Water
influxes into the spore, displacing DPA and other exudates out of the spore, thus leading
to a loss in refractility, i.e., a drop in optical density. ATP is being synthesized afterwards
entering germination stage II, which is illustrated as a delayed curve in the graph.
A 50% decrease in A660 correspond to 99% germination as observed under
phase-contrast microscopy. Laboratory strains responded well to all of the germinants
tested. Heat inactivation enhanced the germination response, by increasing the specific
germination rate and decreasing the germination lag time. The only strains showed highly
variable responses; 5 strains did not respond to any of the germinants; 6 strains showed
responded only the combination of L-alanine and inosine, and four strains showed
352
response to L-alanine as a single germinant. Heat activation resulted in efficient
germination of twelve out of fifteen isolates.
Although DPA has long been implicated in spore resistance to wet heat and spore
stability, definitive evidence on the role of this abundant molecule in spore properties has
generally been lacking78. A clear link between germination capacity and heat resistance
cannot be found. Several strains with a relatively high D-value had a low colony forming
capacity, which may be due to a low germination capacity. However, when these strains
were tested in a germination assay, no clear correlation between germination capacity and
colony forming capacity was apparent.
9.4.10 Role of DPA on spore resistance
While the exact role of Ca-DPA is still unclear, it is highly implicated in the resistance
and stability of endospores78,79. Mutant endospores lacking Ca-DPA demonstrated
instability and elevated germination propensity without the need of heat activation78-80.
One plausible role of Ca-DPA in spore resistance is the lowering of core water content,
thereby protecting DNA integrity from UV irradiation and other deleterious
agents78,79,81-84, as well as the proteins from thermal denaturation79,85.
Large variation in spore DPA levels is well observed in the literature as a result of
differences in species, sporulation conditions and the heterogeneity of
endospores62,78,79,82,85-89. Non-definitive and sometimes controversial dependence of heat
resistance of endospores on their DPA content has been reported by Church et al.82,90,91 In
this study, we measured the DPA content and density in thermophilic, mesophilic and
psychrophilic endospores from laboratory cultures and from the environment and
353
correlate with their thermal and UV resistances. Figure 9.11 show a plot of DPA density
vs. spore volume. Isolates from the Atacama Desert exhibited the greatest degree of
variation among other environmental isolates. One of them has a size of 8.5 µm3 while
have a normal DPA density of around 0.2 fmol µm3. Some of the Atacama isolates,
however, exhibited a small size, ~ 0.5 – 1 µm3 packed with a high density of DPA, from
0.8 -1.2 fmol µm-3. This phenomenon is similar to the psychrophilic spores, which also
packed a high density of DPA (~ 1.0 fmol µm-3). Other mesophilic and thermophilic
lab-strains and environmental strains elicited very little variations in terms of volume and
DPA density, with the exception of the large volume of B. megaterium. Resistance plots
Figure 9.12 shows one of the thermal and UV resistance plots. Figure 9.13 shows the
correlation of DPA density with thermal D-values and UV D-values. In the thermal
inactivation, no significant differences are observed between lab-strain and
environmental-strain endospores. It is driven, to a larger extent, by the intrinsic growth
temperature of the endospores. For instance, thermophilic endospores have D-values over
50 min and psychrophilic endospores have D-values less than 5 min. A higher DPA
density suggests a higher UV resistance, but this correlation is not apparent. A lot of
factors contribute to the UV resistance of endospores, namely the small acid soluble
proteins, spore coat, degree of core hydration.
9.4.11 Inheritance of properties in spores
It has been indicated that DPA content as well as volume might be affected by growth
conditions62. In contrast to this, a more detailed study on the spore size distribution of
Bacillus species by Carrera et al. showed that the choice of medium seems to have a
354
relatively small impact on spore volume64. Also, temperature does not seem to affect the
DPA content of spores, as B. subtilis spores prepared at temperatures from 22 to 48°C by
Melly et al. (2002) contained almost identical amounts of DPA (variations < 10%)72. In
this study, all endospores were prepared in the same way, with the exception of some of
the psychrophilic species. Because of their slow growth and sporulation rate, active
aeration was applied and germination inhibitors, such as D-alanine, was added to
synchronize sporulation and enhance the spore yield. We have observed that spore size
and DPA density were the two properties that were carried along generations as long as
an ample supply of calcium and manganese ions were provided during sporulation,
consistent with other reported findings.
9.5 Conclusion
Bacterial spores are dormant structures formed during the resting stage in the life cycle of
genera such as Bacillus and Clostridium. They are formed within vegetative cells during
sporulation, which is frequently triggered in response to adverse changes in the
environment. The spore DNA is protected from the environment by a surrounding spore
coat comprised of calcium ions, DPA and protein layers. DPA is a unique chemical
marker found only in bacterial spores and can be released from the core into the
surrounding by inducing germination (e.g., with L-alanine92,93) or physical lysing (e.g.,
autoclaving, microwave94).
When DPA binds with Tb3+, highly selective DPA-to-Tb3+ binding triggers bright
green luminescence when viewed under UV light, featuring an interchelate energy
transfer from DPA to the resonance energy level of Tb3+. DPA has a high molar
355
extinction coefficient and can transfer the excitation energy to terbium effectively, thus
enhancing the emission luminescence by more than 20,000 times. Lifetime gating is
enabled due to the long luminescent lifetime (τ ~ 1 ms) of Tb3+, which effectively
removes all background fluorescence (i.e., interferent fluorophores with nanosecond
lifetimes), thus rendering the background intensity for measuring silent. Terbium
dipicolinate photoluminescence assay was first proposed by Sacks. After several
iterations of improvements, it is by far the most sensitive assay in DPA detection. The
limit of detection has been further pushed down over the years, from 1.2 × 10⁵ spores
mL-1 (1998), 104 spores mL-1 (1999) to 1100 spores mL-1 (2004).
Endospore-forming bacteria are subject to stress as a result of changes in
environmental conditions. Stress factors are typically unfavorable temperature, pH value,
nutrient supply, water availability, and the like. Members of microbial populations can,
within limits, adapt (habituate) to changing environmental parameters and changes over
protracted periods may have relatively limited effects. All bacteria, however, have a point
at which exogenous nutrients can no longer be obtained and are thus effectively
exhausted. At this point cells may enter a dormant, abiotic state that permits them to
survive for long periods without reproduction, development and repair95. In arid habitats,
bacteria may enter a state of anhydrobiosis as a survival strategy to tolerate extreme
desiccation, where cells cease to metabolize. During this state, cells are considered to be
nonculturable. It also seems likely that in some situations at least true dormancy is
preceded by a “nutritionally opportunistic” state in which endogenous metabolism is
sufficient to maintain the ability of the cell to respond very rapidly to nutrient availability.
A low level of endogenous metabolism, together with a low maintenance energy
356
requirement, would therefore appear to be of considerable importance not only in
determining the capacity of micro-organisms to survive, but also in responding rapidly to
the advent of more favorable conditions.
Spore germination is an essential step to endospores. Most of our knowledge of
germination is based on studies on the derivatives of the B. subtilis 168 laboratory strain
of B. subtilis. In the present study we provide a comprehensive comparison of the
germination capacity of spores from naturally occurring Bacillus isolates. As anticipated,
we observed a large variation in heat resistance and germination capacities among
different strains, and more than half of the isolates were more resistant than the lab strains.
Such variability in heat resistance among Bacillus isolates has been reported before96-98.
We found large differences in germination capacity. Spore germination in response
to nutrients is initiated by the binding of germinants to germination receptors. An
important factor affecting the germination response was the age of the spores. Prolonged
storage enhanced germination, a phenomenon that is known as ageing activation99.
Therefore, care should be taken to make sure that all the spore-batches have
approximately the same age, when performing comparative analyses. Furthermore, in
some cases inconsistency and variability was observed in the germination response of
spores from the same batch measured at the same time. Such findings were reported
previously100, and may be avoided by measuring germination parameters other than the
decrease in absorbance.
Overall, many of the environmental isolates germinated relatively poorly without
heat activation. Nevertheless, we clearly showed that after heat activation and with a
strong germinant, all of the strains demonstrated various degrees of germinations, albeit

357
in a few cases to a relatively small extent. Apart from nutrient germinants, cationic
surfactants such as dodecylamine101-103 were studied. Furthermore, ammonia may be
included in the mixture, as it has been reported that ammonia can stimulate germination
of B. cereus spores without the need for heat activation104.
L-alanine is a common, though not universal, germinant for aerobic bacterial
spores103,105,106. It is, however, not true in the case of anaerobic and environmental spores.
For instance, spores of C. sporogenes require the addition of sodium bicarbonate as a
potentiator for germination. None of the thermophilic or psychrophilic spores germinate
well in the presence of L-alanine only. Combination of L-alanine and AGFK results in a
higher percentage of germination measured by the Tb-DPA luminescence assay in most
of the mesophilic lab-strain spores and spores from Atacama Desert. Spores of B. cereus
respond poorly to the germinants provided probably because inosine is missing. Inosine
has been reported to be important for B. cereus germination but it adds interference to the
Tb-DPA excitation spectrum. In future experiments, apart from germinant combination,
heat activation and temperature should also be explored to optimize spore germination.
Effective germination for psychrophilic spores will be very helpful in the investigation of
germinable spores in the Atacama Desert soils.
The results of our study in the Atacama Desert have interesting implications
concerning spatial, temporal distribution of microbes, long-term preservation of organics
in arid environment, microbial response to water and viability of endospores in the
Atacama Desert. The aim of the research reported here was to determine the effect of a
hyper-arid environment on the distribution, viability, prevalence, interactions and
persistence of the most resistant living organism on Earth, bacterial endospores.
358
Endospores were isolated and recovered in media prepared under different nutrients and
environments. In most cases, bacteria did not manifest themselves as colony forming
units, but appear by producing ATP, releasing DPA and could be stained by metabolic
dyes. The water augmentation experiment demonstrates a way in which native soilborne
microorganisms interact with their environment. In situ activities of a mixed population
of vegetative cells and endospores were assessed to extrapolate the role of water in the
most hyper-arid regions on Earth. Our data indicate the aerial transfer of microbes during
the night in the Atacama Desert. We have been able to isolate and characterize
endospores from the hyper-acid Atacama Desert, there are, however, challenges to
scrutinize their ecological role. Thermophilic and psychrophilic, as well as mesophilic
spore-forming bacteria, have been isolated from the hyper-arid habitat. Although they
serve as excellent experimental materials for use in probing the basis of particular
temperature dependence, we still have a paucity of information about what activities
these endospores carry out in their native habitat. In conclusion, study of endospores
from environments with temperature extremes gleans valuable information for optimizing
spore detection protocols in extreme environments on Earth.
9.6 References
1. Rech, J.A., Currie, B.S., Michalski, G., and Cowan, A.M. Neogene climate change and uplift in the Atacama Desert, Chile. Geology 34, 761-764 (2006).
2. Houston, J. and Hartley, A.J. The central andean west-slope rainshadow and its potential contribution to the origin of hyper-aridity in the Atacama desert. International Journal of Climatology 23, 1453-1464 (2003).
3. Hartley, A.J., Chong, G., Houston, J., and Mather, A.E. 150 million years of climatic stability: evidence from the Atacama Desert, northern Chile. Journal of the Geological Society 162, 421-424 (2005).
4. Rech, J.A., Quade, J., and Hart, W.S. Isotopic evidence for the source of Ca and S in soil gypsum, anhydrite and calcite in the Atacama Desert, Chile. Geochimica et Cosmochimica Acta 67, 575-586 (2003).
359
5. Clarke, J.D.A. Antiquity of aridity in the Chilean Atacama Desert. Geomorphology 73, 101-114 (2006).
6. Keith, S.M., Russ, M.A., Macfarlane, G.T., and Herbert, R.A. The ecology and physiology of anaerobic bacteria isolated from Tay estuary sediments. Proceedings of the Royal Society of Edinburgh 92B, 323-333 (1987).
7. Gould, G.W. and Hurst, A., The Bacterial Spore. (Academic Press, New York, 1969). 8. Nicholson, W.L., Munakata, N., Horneck, G., Melosh, H.J., and Setlow, P. Resistance of
Bacillus endospores to extreme terrestrial and extraterrestrial environments. Microbiology and Molecular Biology Reviews 64, 548-572 (2000).
9. Setlow, P. Mechanisms which contribute to the long term survival of spores of bacillus species. Journal of Applied Bacteriology 76, 49S-60S (1994).
10. Setlow, P. Resistance of bacterial spores. Bacterial Stress Response ed. Storz, G., Hengge-Aronis, R., 217-230 (2000).
11. Cano, R. Characterizing ancient bacteria. Analytical Chemistry 68, A609-A611 (1996). 12. Cano, R.J. and Borucki, M.K. Revival and identification of bacterial spores in
25-million-year-old to 40-million-year-old Dominican amber. Science 268, 1060-1064 (1995).
13. Vreeland, R.H., Rosenzweig, W.D., and Powers, D.W. Isolation of a 250 million-year-old halotolerant bacterium from a primary salt crystal. Nature 407, 897-900 (2000).
14. van Elsas, J.D., Jansson, J.K., and Trevors, J.T., Modern Soil Microbiology. (CRC Press, 2006).
15. Skopp, J., Jawson, M.D., and Doran, J.W. Steady-state aerobic microbial activity as a function of soil water content. Soil Science Society of America Journal 54, 1619 (1990).
16. Orchard, V.A. and Cook, F.J. Relationship between soil respiration and soil moisture. Soil Biology and Biochemistry 15, 447-453 (1983).
17. van Loosdrecht, M.C., Lyklema, J., Norde, W., and Zehnder, A.J. Influence of interfaces on microbial activity. Microbiological Reviews 54, 75 (1990).
18. Davidson, E.C.A., Belk, E., and Boone, R.D. Soil water content and temperature as independent or confounded factors controlling soil respiration in a temperate mixed hardwood forest. Global Change Biology 4, 217-227 (1998).
19. Kieft, T.L., Soroker, E., and Firestone, M.K. Microbial biomass response to a rapid increase in water potential when dry soil is wetted. Soil Biology and Biochemistry 19, 119-126 (1987).
20. Stevenson, I.L. Some observations on the microbial activity in remoistened air-dried soils. Plant and Soil 8, 170-182 (1956).
21. Birch, H.F. The effect of soil drying on humus decomposition and nitrogen availability. Plant and Soil 10, 9-31 (1958).
22. Navarro-Gonzalez, R. et al. Mars-like soils in the Atacama Desert, Chile, and the dry limit of microbial life. Science 302, 1018-1021 (2003).
23. Connon, S.A. and Connon, S.A. Bacterial diversity in hyperarid Atacama Desert soils. Journal of geophysical research 112, G04S17 (2007).
24. Lester, E.D., Satomi, M., and Ponce, A. Microflora of extreme arid Atacama Desert soils. Soil Biology and Biochemistry 39, 704-708 (2007).
25. Cameron, R.E., Blank, G.B., and Gensel, D.R. Sampling and handling of desert soils. JPL Technical Report 32-908, 1-42 (1966).
26. Kahn, L., 1988. 27. Kahn, L. Lloyd Kahn Method, Determination of Total Organic Carbon in Sediment. U.S.
Environmental Protection Agency Standard Operating Procedure (1988). 28. White, D.C., Davis, W.M., Nickels, J.S., King, J.D., and Bobbie, R.J., Determination of the
sedimentary microbial biomass by extractible lipid phosphate. (Springer-Verlag, 1979).
360
29. White, D.C., in Methodology for Biomass Determinations and Microbial Activities in Sediments, edited by C. D. Litchfield and P. L. Seyfreid (American Society for Testing and Materials, Philadelphia, PA., 1979), Vol. ASTM STP 673, pp. 87-103.
30. Bligh, E.G. and Dyer, W.J. A rapid method of total lipid extraction and purification. Canadian Journal of Biochemistry and Physiology 37, 911-917 (1959).
31. White, D.C. and Ringelberg, D.B., in The Microbiology of the Terrestrial Deep Subsurface, edited by P. S. Amy and D. L. Haldeman (CRC Press, New York, NY, 1997), pp. 119-136.
32. Cameron, R.E. Abundance of microflora in soils of desert regions. NASA Technical Report 32, 1-16 (1969).
33. Cameron, R.E., Gensel, D.R., and Blank, G.B. Soil studies - desert microflora. XII. Abundance of microflora in soil samples from the Chile Atacama Desert. JPL Space Programs Summary IV, 140-147 (1966).
34. Eaton, A.D., Clesceri, L.S., Greenberg, A.E., and Franson, M.A.H., Standard Methods for the Examination of Water and Wastewater. (American Public Health Association, Washington, D.C., 1999).
35. Yung, P.T., Kempf, M.J., and Ponce, A., presented at the IEEE Aerospace Conference, Big Sky, Montana, 2006 (unpublished).
36. Fell, N.F., Pellegrino, P.M., and Gillespie, J.B. Mitigating phosphate interference in bacterial endospore detection by Tb dipicolinate photoluminescence. Analytica Chimica ACTA 426, 43-50 (2001).
37. Pellegrino, P.M., Fell, N.F., Rosen, D.L., and Gillespie, J.B. Bacterial endospore detection using terbium dipicolinate photoluminescence in the presence of chemical and biological materials. Analytical Chemistry 70, 1755-1760 (1998).
38. Warth, A.D. Liquid chromatographic determination of dipicolinic acid from bacterial spores. Applied and Environmental Microbiology 38, 1029-1033 (1979).
39. Shafaat, H.S. and Ponce, A. Applications of a rapid endospore viability assay for monitoring UV inactivation and characterizing Arctic ice cores. Applied and Environmental Microbiology 72, 6808-6814 (2006).
40. Epstein, S.S. and Rossel, J. Enumeration of sandy sediment bacteria: Search for optimal protocol. Marine Ecology Progress Series. Oldendorf 117, 289-298 (1995).
41. Hurwitz, S.J. and McCarthy, T.J. 2, 3, 5-Triphenyltetrazolium chloride as a novel tool in germicide dynamics. Journal of Pharmaceutical Sciences 75, 912-916 (1986).
42. Sarkar, G. and Sommer, S.S. Parameters affecting susceptibility of PCR contamination to UV inactivation. Biotechniques 10, 590-594 (1991).
43. Nicholson, W. and Setlow, P., in Molecular Biology Methods for Bacillus, edited by S. M. Cutting (John Wiley and Sons, Sussex, England, 1990), pp. 391-450.
44. Norland, S., Heldal, M., and Tumyr, O. On the relation between dry matter and volume of bacteria. Microbial Ecology 13, 95-101 (1987).
45. Loferer-Krossbacher, M., Klima, J., and Psenner, R. Determination of bacterial cell dry mass by transmission electron microscopy and densitometric image analysis. Applied and Environmental Microbiology 64, 688 (1998).
46. Rosenberg, M., Gutnick, D., and Rosenberg, E. Adherence of bacteria to hydrocarbons: A simple method for measuring cell-surface hydrophobicity. FEMS Microbiology Letters 9, 29-33 (1980).
47. Schuerger, A.C., Richards, J.T., Newcombe, D.A., and Venkateswaran, K. Rapid inactivation of seven Bacillus spp. under simulated Mars UV irradiation. Icarus 181, 52-62 (2006).
48. Newcombe, D.A. et al. Survival of spacecraft-associated microorganisms under simulated Martian UV Irradiation. Applied and Environmental Microbiology 71, 8147 (2005).
49. Nicholson, W.L., Schuerger, A.C., and Setlow, P. The solar UV environment and bacterial spore UV resistance: considerations for Earth-to-Mars transport by natural processes and
361
human spaceflight. Mutation Research-Fundamental and Molecular Mechanisms of Mutagenesis 571, 249-264 (2005).
50. Christner, B.C. Recovery and identification of viable bacteria immured in glacial ice. Icarus 144, 479-485 (2000).
51. Korona, R., Nakatsu, C.H., Forney, L.J., and Lenski, R.E. Evidence for multiple adaptive peaks from populations of bacteria evolving in a structured habitat. Proceedings of the National Academy of Sciences of the United States of America 91, 9037-9041 (1994).
52. Rainey, P.B., Buckling, A., Kassen, R., and Travisano, M. The emergence and maintenance of diversity: insights from experimental bacterial populations. Trends in Ecology & Evolution 15, 243-247 (2000).
53. Treves, D.S., Xia, B., Zhou, J., and Tiedje, J.M. A two-species test of the hypothesis that spatial isolation influences microbial diversity in soil. Microbial Ecology 45, 20-28 (2003).
54. Zhou, J. et al. Spatial and resource factors influencing high microbial diversity in soil. Applied and Environmental Microbiology 68, 326 (2002).
55. Madigan, M.T., Martinko, J.M., and Parker, J., Brock Biology of Microorganisms. (Prentice Hall, Upper Saddle River, NJ, 2000).
56. Booth, I.R., Cairney, J., Sutherland, L., and Higgins, C.F. Enteric bacteria and osmotic stress: an integrated homeostatic system. Journal of Applied Microbiology 65, 35-49 (1988).
57. Gammack, S.M., Paterson, E., Kemp, J.S., Cresser, M.S., and Killham, K. Factors affecting the movement of microorganisms in soils. Soil Biochemistry 7, 263-305 (1992).
58. Close, R.C., Moar, N.T., Tomlinson, A.I., and Lowe, A.D. Aerial dispersal of biological material from Australia to New Zealand. International Journal of Biometeorology 22, 1-19 (1978).
59. Ericksen, G.E. The Chilean Nitrate Deposits. American Scientist 71, 366-374 (1983). 60. Ericksen, G.E., in Geological Survey Professional Paper 1188 (US Government Printing
Office, Washington DC, 1981), pp. 1-37. 61. Hindle, A.A. and Hall, E.A.H. Dipicolinic acid (DPA) assay revisited and appraised for spore
detection. Analyst 124, 1599-1604 (1999). 62. Hitchins, A.D., Greene, R.A., and Slepecky, R.A. Effect of carbon source on size and
associated properties of Bacillus megaterium spores. Journal of Bacteriology 110, 392 (1972).
63. Wiencek, K.M., Klapes, N.A., and Foegeding, P.M. Hydrophobicity of Bacillus and Clostridium spores. Applied and Environmental Microbiology 56, 2600-2605 (1990).
64. Carrera, M., Zandomeni, R.O., Fitzgibbon, J., and Sagripanti, J.L. Difference between the spore sizes of Bacillus anthracis and other Bacillus species. Journal of Applied Microbiology 102, 303-312 (2007).
65. Cameron, R.E. and Blank, G.B. Soil studies - microflora of desert regions. VIII. Distribution and abundance of desert microflora. JPL Space Programs Summary IV, 193-202 (1965).
66. Cameron, R.E. and Gensel, D.R.e.a. Soil studies - desert microflora. XII. Abundance of microflora in soil samples from the Chile Atacama Desert. National Aeronautics and Space Administration, Jet Propulsion Laboratory Pasadena, CA, 140-147 (1966).
67. McCormick, N.G. Kinetics of spore germination. Journal of Applied Bacteriology 89, 1180-1185 (1965).
68. Morita, R.Y. Psychrophilic bacteria. Bacteriological Reviews 39, 144-167 (1975). 69. Hills, G.M. Chemical factors in the germination of spore-bearing aerobes - observations on
the influence of species, strain and conditions of growth. Journal of General Microbiology 4, 38-47 (1950).
70. Rose, R. et al. Comparison of the properties of Bacillus subtilis spores made in liquid or on agar plates. Journal of Applied Microbiology (2007).
362
71. Atrih, A. and Foster, S.J. Analysis of the role of bacterial endospore cortex structure in resistance properties and demonstration of its conservation amongst species. Journal of Applied Microbiology 91, 364-372 (2001).
72. Melly, E. et al. Analysis of the properties of spores of Bacillus subtilis prepared at different temperatures. Journal of Applied Microbiology 92, 1105-1115 (2002).
73. Palop, A., Manas, P., and Condon, S. Sporulation temperature and heat resistance of Bacillus spores: a review. Journal of Food Safety 19, 57-72 (1999).
74. Hornstra, L.M., de Vries, Y.P., de Vos, W.M., and Abee, T. Influence of sporulation medium composition on transcription of ger operons and the germination response of spores of Bacillus cereus ATCC 14579. Applied and Environmental Microbiology 72, 3746-3749 (2006).
75. Cazemier, A.E., Wagenaars, S.F.M., and ter Steeg, P.F. Effect of sporulation and recovery medium on the heat resistance and amount of injury of spores from spoilage bacilli. Journal of Applied Microbiology 90, 761-770 (2001).
76. Mazas, M., Gonzalez, I., Lopez, M., Gonzalez, J., and Sarmiento, R.M. Effects of sporulation media and strain on thermal resistance of Bacillus cereus spores. International Journal of Food Science and Technology 30, 71-78 (1995).
77. Baweja, R.B. et al. Properties of Bacillus anthracis spores prepared under various environmental conditions. Archives of Microbiology 189, 71-79 (2008).
78. Setlow, B., Atluri, S., Kitchel, R., Koziol-Dube, K., and Setlow, P. Role of dipicolinic acid in resistance and stability of spores of Bacillus subtilis with or without DNA-protective α/β-type small acid-soluble proteins. Journal of Bacteriology 188, 3740-3747 (2006).
79. Paidhungat, M., Setlow, B., Driks, A., and Setlow, P. Characterization of spores of Bacillus subtilis which lack dipicolinic acid. Journal of Bacteriology 182, 5505-5512 (2000).
80. Setlow, P. Spore germination. Current Opinion in Microbiology 6, 550-556 (2003). 81. Berg, P.E. and Grecz, N. Relationship of dipicolinic acid content in spores of Bacillus cereus
to ultraviolet and gamma radiation resistance. Journal of Bacteriology 103, 517-519 (1970). 82. Church, B.D. and Halvorson, H. Dependence of the heat resistance of bacterial endospores on
their dipicolinic acid content. Nature 183, 124-125 (1959). 83. Slieman, T.A. and Nicholson, W.L. Role of dipicolinic acid in survival of Bacillus subtilis
spores exposed to artificial and solar UV radiation. Applied and Environmental Microbiology 67, 1274-1279 (2001).
84. Yamazaki, K., Kawai, Y., Inoue, N., and Shinano, H. Influence of sporulation medium and divalent ions on the heat resistance of Alicyclobacillus acidoterrestris spores. Letters in Applied Microbiology 25, 153-156 (1997).
85. Gerhardt, P. and Marquis, R.E., in Regulation of Prokaryotic Development, edited by I. Smith, R. A. Slepecky, and P. Setlow (American Society for Microbiology, Washington, D.C., 1989), pp. 43-63.
86. Murrell, W.G., in The Bacterial Spore, edited by G. W. Gould (Academic Press, New York, 1969), pp. 245-270.
87. Huang, S. et al. Levels of Ca2+-dipicolinic acid in individual Bacillus spores determined using microfluidic Raman tweezers. Journal of Bacteriology 189, 4681-4687 (2007).
88. Brehm-Stecher, B.F. and Johnson, E.A. Single-cell microbiology: Tools, technologies, and applications. Microbiology and Molecular Biology Reviews 68, 538 (2004).
89. Dubnau, D. and Losick, R. Bistability in bacteria. Molecular Microbiology 61, 564-572 (2006).
90. Mallidis, C.G. and Scholefield, J. The release of dipicolinic acid during heating and its relation to the heat destruction of Bacillus stearothermophilus spores. Journal of Applied Microbiology 59, 479-486 (1985).
363
91. Mallidis, C.G. and Scholefield, J. Relation of the heat resistance of bacterial spores to chemical composition and structure. I. Relation to core components. Journal of Applied Bacteriology 62, 65-69 (1987).
92. Foster, S.J. and Johnstone, K. Pulling the trigger: the mechanism of bacterial spore germination. Molecular Microbiology 4, 137-141 (1990).
93. Johnstone, K. The trigger mechanism of spore germination. Journal of Applied Bacteriology 76, 17S-24S (1994).
94. Vaid, A. and Bishop, A.H. The destruction by microwave radiation of bacterial endospores and amplification of the released DNA. Journal of Applied Microbiology 85, 115-122 (1998).
95. Kaprelyants, A.S., Gottschal, J.C., and Kell, D.B. Dormancy in non-sporulating bacteria. FEMS Microbiology Letters 104, 271-286 (1993).
96. Dufrenne, J., Bijwaard, M., te Giffel, M., Beumer, R., and Notermans, S. Characteristics of some psychrotrophic Bacillus cereus isolates. International Journal of Food Microbiology 27, 175-183 (1995).
97. Dufrenne, J., Soentoro, P., Tatini, S., Day, T., and Notermans, S. Characteristics of Bacillus cereus related to safe food production. International Journal of Food Microbiology 23, 99-109 (1994).
98. Delignette-Muller, M.L. and Rosso, L. Biological variability and exposure assessment. International Journal of Food Microbiology 58, 203-212 (2000).
99. Keynan, A. and Evenchik, Z., in The Bacterial Spore, edited by G. W. Gould and A. Hurst (Academic Press, London, England, 1969), Vol. 1, pp. 359-396.
100. Welkos, S.L., Cote, C.K., Rea, K.M., and Gibbs, P.H. A microtiter fluorometric assay to detect the germination of Bacillus anthracis spores and the germination inhibitory effects of antibodies. Journal of Microbiological Methods 56, 253-265 (2004).
101. Setlow, B., Cowan, A.E., and Setlow, P. Germination of spores of Bacillus subtilis with dodecylamine. Journal of Applied Microbiology 95, 637-648 (2003).
102. Rode, L.J. and Foster, J.W. Germination of bacterial spores with alkyl primary amines. Journal of Bacteriology 81, 768 (1961).
103. Foerster, H.F. and Foster, J.W. Endotrophic calcium strontium and barium spores of Bacillus megaterium and Bacillus cereus. Journal of Bacteriology 91, 1333-1345 (1966).
104. Preston, R.A. and Douthit, H.A. Stimulation of germination of unactivated Bacillus cereus spores by ammonia. Journal of General Microbiology 130, 1041-1050 (1984).
105. Strange, R.E. and Dark, F.A. Cell-wall lytic enzymes at sporulation and spore germination in Bacillus species. Journal of General Microbiology 17, 525-537 (1957).
106. Hills, G.M. Chemical factors in the germination of spore-bearing aerobes - the effects of amino acids on the germination of Bacillus anthracis, with some observations on the relation of optical form to biological activity. Biochemical Journal 45, 363-370 (1949).

364
Designation Site description GPS coordinates Sample type Depth (cm) Cl-, µg/g F-, µg/g SO42-, µg/g NO3
-, µg/g PO43-, µg/g
A1 Site A – surface 1
S 24° 04.147’
W 069° 51.866’ Soil
A2 Site A – surface 2 0 – 2 68.7 15.5 3050 60.2 3.65
A3 Site A – surface 3
A4 Site A – subsurface 1
A5 Site A – subsurface 2 2 – 20 102 7.45 8160 23.1 < LOD
A6 Site A – subsurface 3
E1 Site E – surface 1
S 24° 00.685’
W 069° 52.013’ Soil
E2 Site E – surface 2 0 – 2 859 13.3 11400 319 < LOD
E3 Site E – surface 3
E4 Site E – subsurface 1
E5 Site E – subsurface 2 2 – 20 24.4 8.89 8280 15.7 0.807
E6 Site E – subsurface 3
D1 Depth profile 1, bottom
S 24° 06.102’
W 070° 01.096’ Soil
214 3850 < LOD 11000 1420 < LOD
D2 Depth profile 2 189 ND ND ND ND ND
D3 Depth profile 3 163 2440 < LOD 9850 1010 < LOD
D4 Depth profile 4 139 ND ND ND ND ND
D5 Depth profile 5 115 ND ND ND ND ND
D6 Depth profile 6, top 88 5150 19.3 4200 2730 < LOD
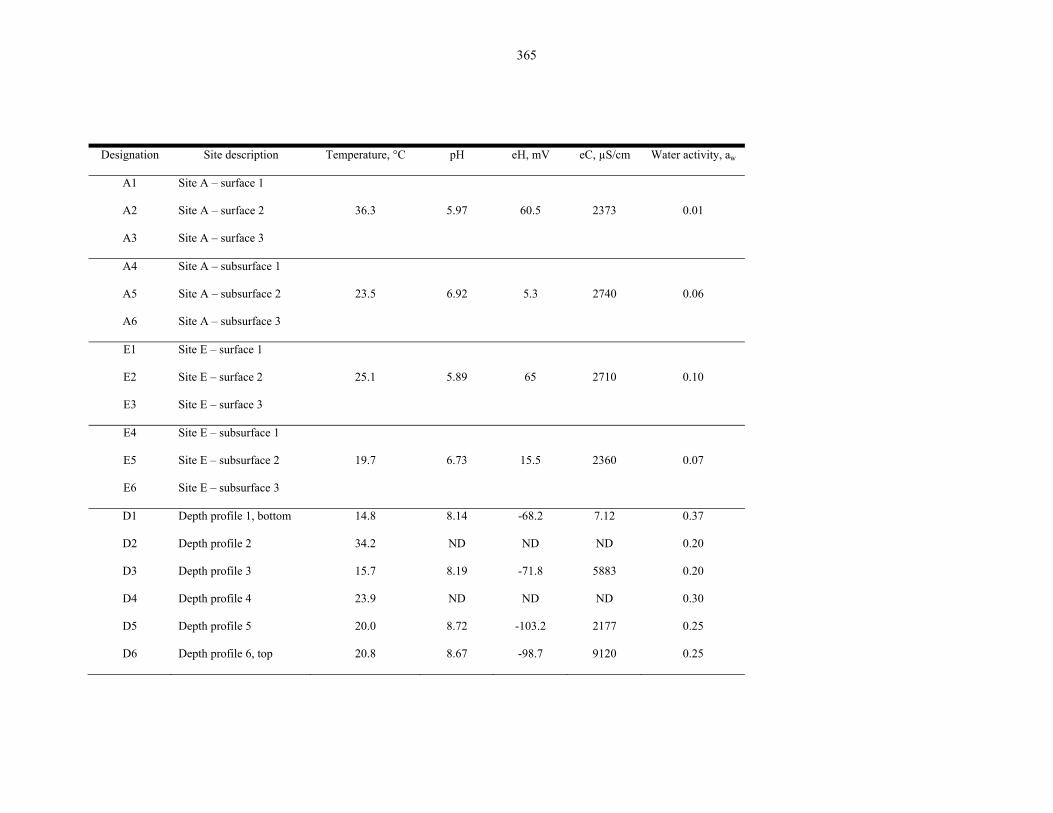
365
Designation Site description Temperature, °C pH eH, mV eC, µS/cm Water activity, aw
A1 Site A – surface 1
A2 Site A – surface 2 36.3 5.97 60.5 2373 0.01
A3 Site A – surface 3
A4 Site A – subsurface 1
A5 Site A – subsurface 2 23.5 6.92 5.3 2740 0.06
A6 Site A – subsurface 3
E1 Site E – surface 1
E2 Site E – surface 2 25.1 5.89 65 2710 0.10
E3 Site E – surface 3
E4 Site E – subsurface 1
E5 Site E – subsurface 2 19.7 6.73 15.5 2360 0.07
E6 Site E – subsurface 3
D1 Depth profile 1, bottom 14.8 8.14 -68.2 7.12 0.37
D2 Depth profile 2 34.2 ND ND ND 0.20
D3 Depth profile 3 15.7 8.19 -71.8 5883 0.20
D4 Depth profile 4 23.9 ND ND ND 0.30
D5 Depth profile 5 20.0 8.72 -103.2 2177 0.25
D6 Depth profile 6, top 20.8 8.67 -98.7 9120 0.25
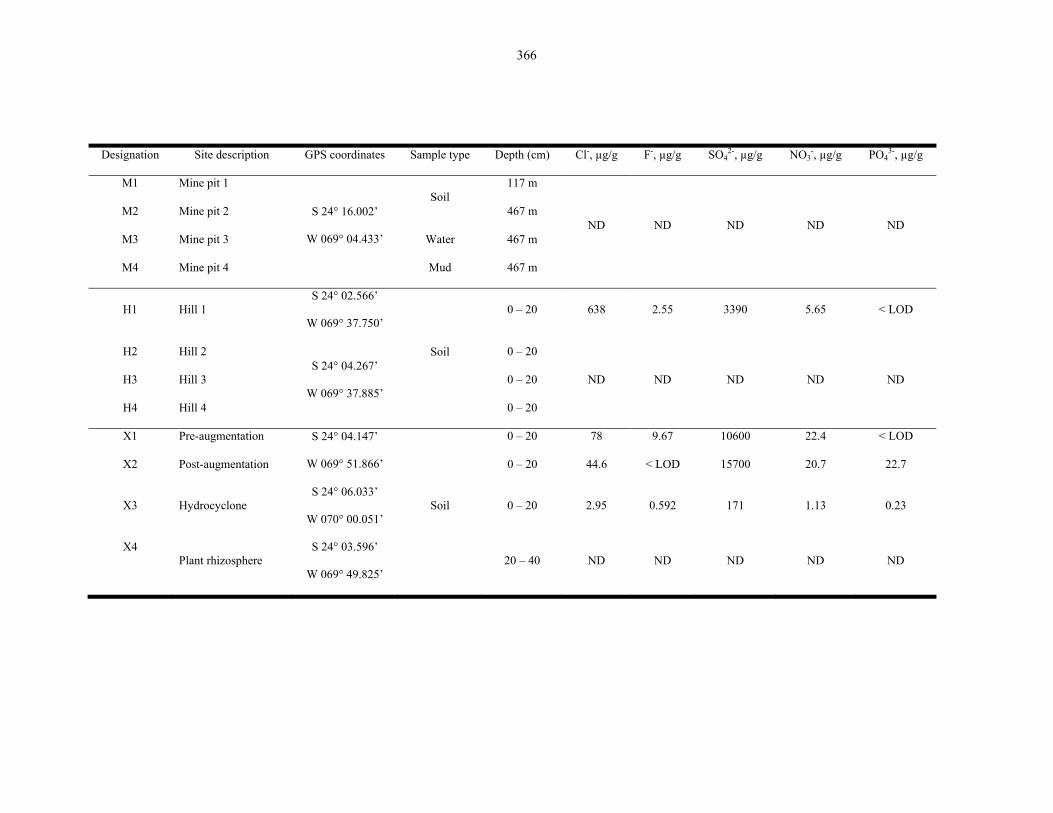
366
Designation Site description GPS coordinates Sample type Depth (cm) Cl-, µg/g F-, µg/g SO42-, µg/g NO3
-, µg/g PO43-, µg/g
M1 Mine pit 1
S 24° 16.002’
W 069° 04.433’
Soil 117 m
ND ND ND ND ND M2 Mine pit 2 467 m
M3 Mine pit 3 Water 467 m
M4 Mine pit 4 Mud 467 m
H1 Hill 1 S 24° 02.566’
W 069° 37.750’
Soil
0 – 20 638 2.55 3390 5.65 < LOD
H2 Hill 2 S 24° 04.267’
W 069° 37.885’
0 – 20
ND ND ND ND ND H3 Hill 3 0 – 20
H4 Hill 4 0 – 20
X1 Pre-augmentation S 24° 04.147’
W 069° 51.866’
0 – 20 78 9.67 10600 22.4 < LOD
X2 Post-augmentation 0 – 20 44.6 < LOD 15700 20.7 22.7
X3 Hydrocyclone S 24° 06.033’
W 070° 00.051’ Soil 0 – 20 2.95 0.592 171 1.13 0.23
X4 Plant rhizosphere
S 24° 03.596’
W 069° 49.825’ 20 – 40 ND ND ND ND ND
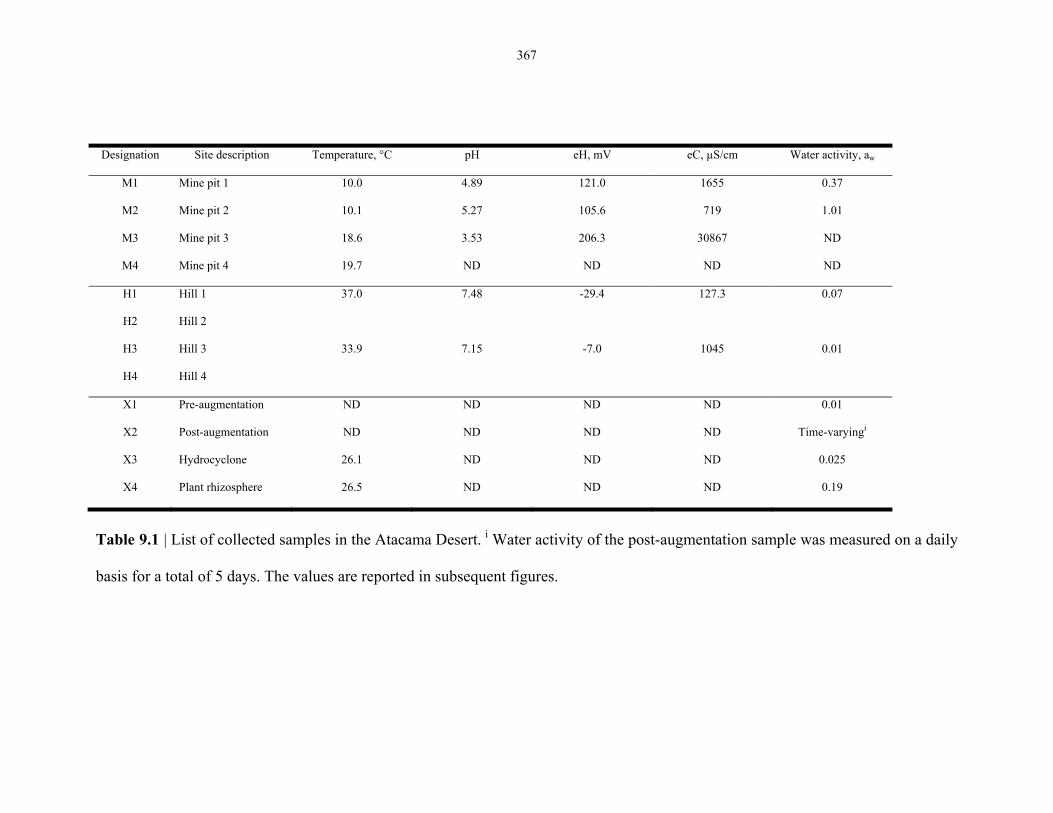
367
Designation Site description Temperature, °C pH eH, mV eC, µS/cm Water activity, aw
M1 Mine pit 1 10.0 4.89 121.0 1655 0.37
M2 Mine pit 2 10.1 5.27 105.6 719 1.01
M3 Mine pit 3 18.6 3.53 206.3 30867 ND
M4 Mine pit 4 19.7 ND ND ND ND
H1 Hill 1 37.0 7.48 -29.4 127.3 0.07
H2 Hill 2
H3 Hill 3 33.9 7.15 -7.0 1045 0.01
H4 Hill 4
X1 Pre-augmentation ND ND ND ND 0.01
X2 Post-augmentation ND ND ND ND Time-varyingi
X3 Hydrocyclone 26.1 ND ND ND 0.025
X4 Plant rhizosphere 26.5 ND ND ND 0.19
Table 9.1 | List of collected samples in the Atacama Desert. i Water activity of the post-augmentation sample was measured on a daily
basis for a total of 5 days. The values are reported in subsequent figures.
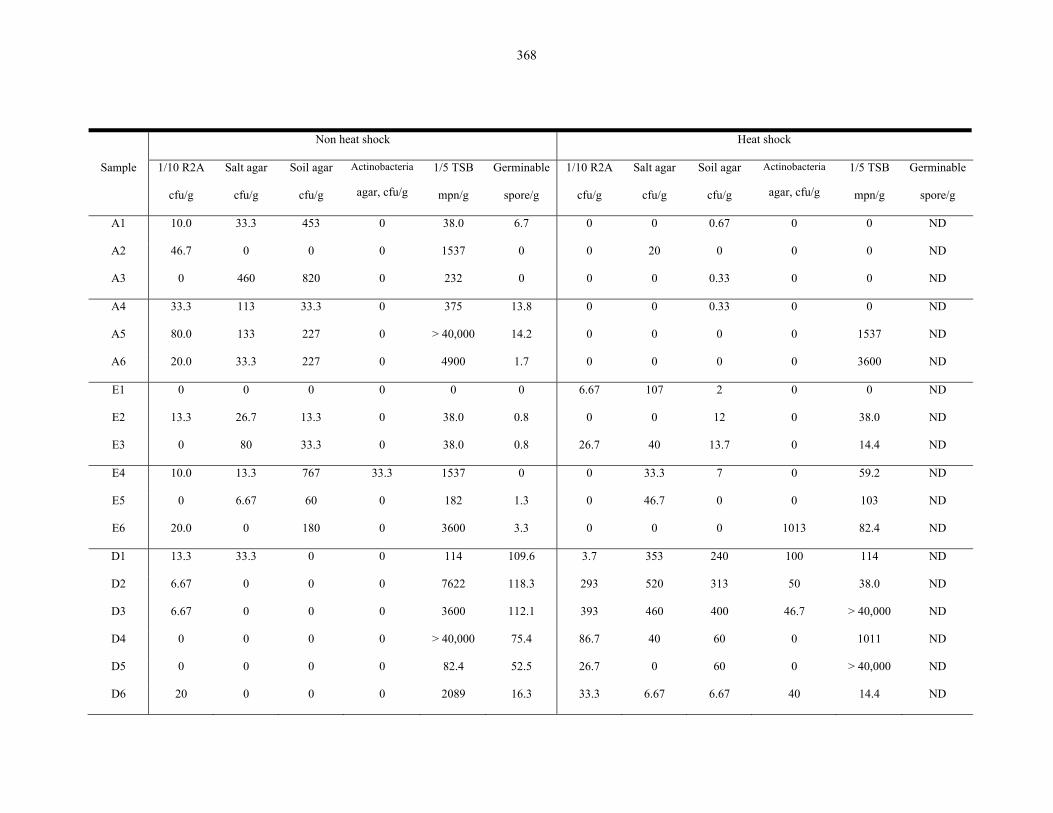
368
Non heat shock Heat shock
Sample 1/10 R2A
cfu/g
Salt agar
cfu/g
Soil agar
cfu/g
Actinobacteria
agar, cfu/g
1/5 TSB
mpn/g
Germinable
spore/g
1/10 R2A
cfu/g
Salt agar
cfu/g
Soil agar
cfu/g
Actinobacteria
agar, cfu/g
1/5 TSB
mpn/g
Germinable
spore/g
A1 10.0 33.3 453 0 38.0 6.7 0 0 0.67 0 0 ND
A2 46.7 0 0 0 1537 0 0 20 0 0 0 ND
A3 0 460 820 0 232 0 0 0 0.33 0 0 ND
A4 33.3 113 33.3 0 375 13.8 0 0 0.33 0 0 ND
A5 80.0 133 227 0 > 40,000 14.2 0 0 0 0 1537 ND
A6 20.0 33.3 227 0 4900 1.7 0 0 0 0 3600 ND
E1 0 0 0 0 0 0 6.67 107 2 0 0 ND
E2 13.3 26.7 13.3 0 38.0 0.8 0 0 12 0 38.0 ND
E3 0 80 33.3 0 38.0 0.8 26.7 40 13.7 0 14.4 ND
E4 10.0 13.3 767 33.3 1537 0 0 33.3 7 0 59.2 ND
E5 0 6.67 60 0 182 1.3 0 46.7 0 0 103 ND
E6 20.0 0 180 0 3600 3.3 0 0 0 1013 82.4 ND
D1 13.3 33.3 0 0 114 109.6 3.7 353 240 100 114 ND
D2 6.67 0 0 0 7622 118.3 293 520 313 50 38.0 ND
D3 6.67 0 0 0 3600 112.1 393 460 400 46.7 > 40,000 ND
D4 0 0 0 0 > 40,000 75.4 86.7 40 60 0 1011 ND
D5 0 0 0 0 82.4 52.5 26.7 0 60 0 > 40,000 ND
D6 20 0 0 0 2089 16.3 33.3 6.67 6.67 40 14.4 ND
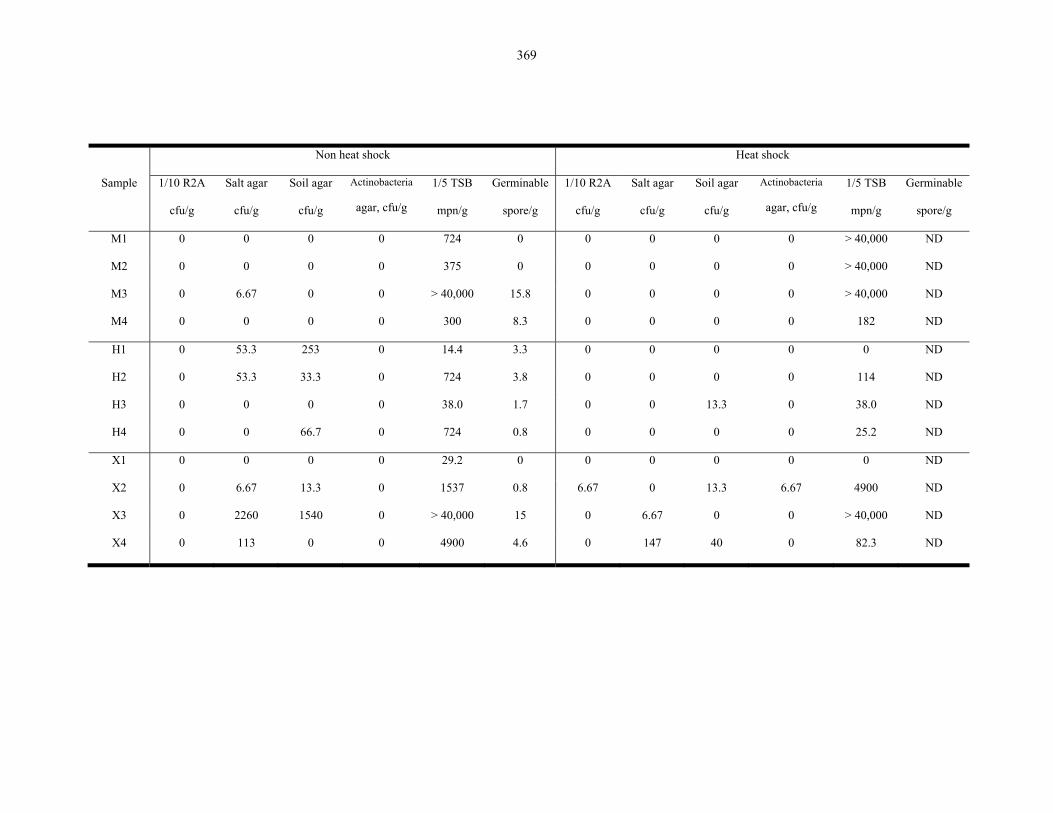
369
Non heat shock Heat shock
Sample 1/10 R2A
cfu/g
Salt agar
cfu/g
Soil agar
cfu/g
Actinobacteria
agar, cfu/g
1/5 TSB
mpn/g
Germinable
spore/g
1/10 R2A
cfu/g
Salt agar
cfu/g
Soil agar
cfu/g
Actinobacteria
agar, cfu/g
1/5 TSB
mpn/g
Germinable
spore/g
M1 0 0 0 0 724 0 0 0 0 0 > 40,000 ND
M2 0 0 0 0 375 0 0 0 0 0 > 40,000 ND
M3 0 6.67 0 0 > 40,000 15.8 0 0 0 0 > 40,000 ND
M4 0 0 0 0 300 8.3 0 0 0 0 182 ND
H1 0 53.3 253 0 14.4 3.3 0 0 0 0 0 ND
H2 0 53.3 33.3 0 724 3.8 0 0 0 0 114 ND
H3 0 0 0 0 38.0 1.7 0 0 13.3 0 38.0 ND
H4 0 0 66.7 0 724 0.8 0 0 0 0 25.2 ND
X1 0 0 0 0 29.2 0 0 0 0 0 0 ND
X2 0 6.67 13.3 0 1537 0.8 6.67 0 13.3 6.67 4900 ND
X3 0 2260 1540 0 > 40,000 15 0 6.67 0 0 > 40,000 ND
X4 0 113 0 0 4900 4.6 0 147 40 0 82.3 ND
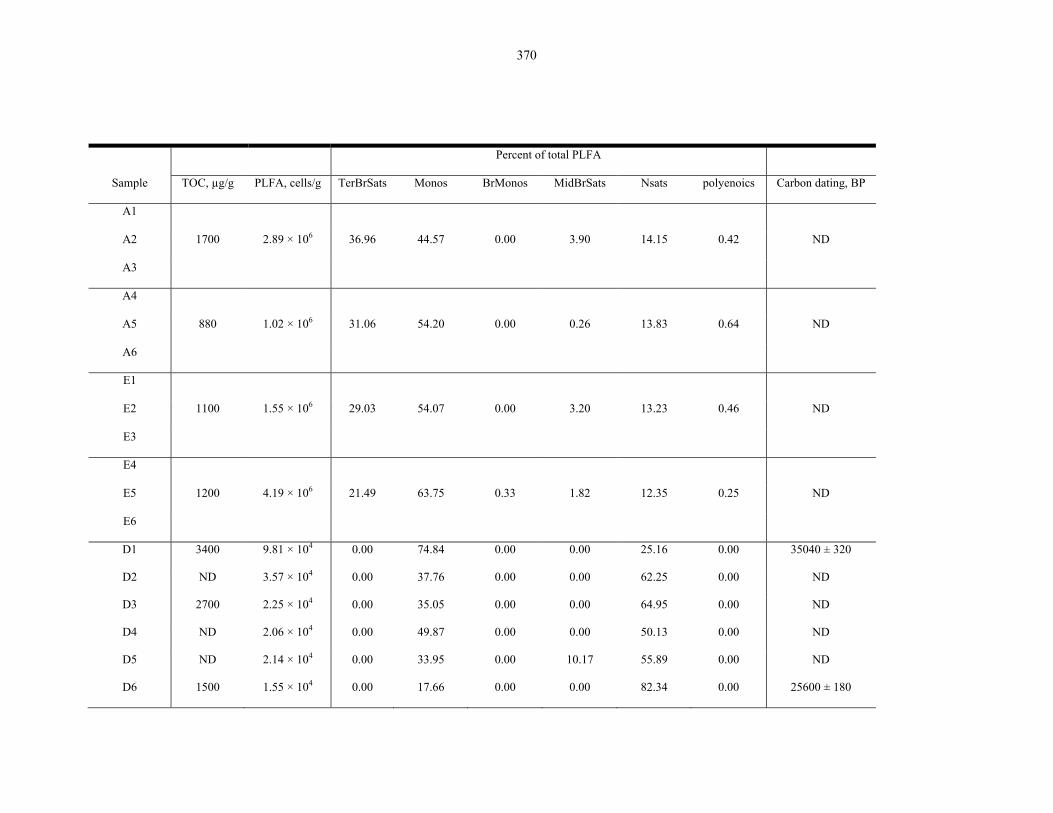
370
Percent of total PLFA
Sample TOC, µg/g PLFA, cells/g TerBrSats Monos BrMonos MidBrSats Nsats polyenoics Carbon dating, BP
A1
1700 2.89 × 10⁶ 36.96 44.57 0.00 3.90 14.15 0.42
A2 ND
A3
A4
880 1.02 × 10⁶ 31.06 54.20 0.00 0.26 13.83 0.64
A5 ND
A6
E1
1100 1.55 × 10⁶ 29.03 54.07 0.00 3.20 13.23 0.46
E2 ND
E3
E4
1200 4.19 × 10⁶ 21.49 63.75 0.33 1.82 12.35 0.25
E5 ND
E6
D1 3400 9.81 × 10⁴ 0.00 74.84 0.00 0.00 25.16 0.00 35040 ± 320
D2 ND 3.57 × 10⁴ 0.00 37.76 0.00 0.00 62.25 0.00 ND
D3 2700 2.25 × 10⁴ 0.00 35.05 0.00 0.00 64.95 0.00 ND
D4 ND 2.06 × 10⁴ 0.00 49.87 0.00 0.00 50.13 0.00 ND
D5 ND 2.14 × 10⁴ 0.00 33.95 0.00 10.17 55.89 0.00 ND
D6 1500 1.55 × 10⁴ 0.00 17.66 0.00 0.00 82.34 0.00 25600 ± 180
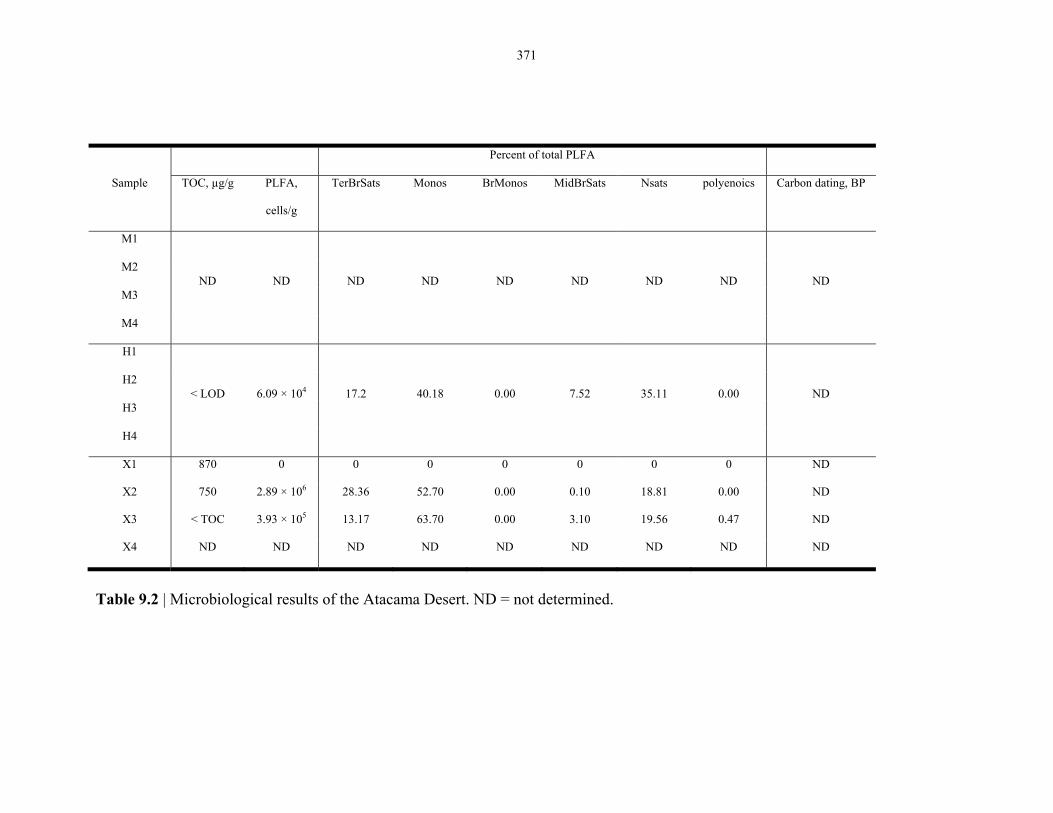
371
Percent of total PLFA
Sample TOC, µg/g PLFA,
cells/g
TerBrSats Monos BrMonos MidBrSats Nsats polyenoics Carbon dating, BP
M1
ND ND ND ND ND ND ND ND ND M2
M3
M4
H1
< LOD 6.09 × 10⁴ 17.2 40.18 0.00 7.52 35.11 0.00 ND H2
H3
H4
X1 870 0 0 0 0 0 0 0 ND
X2 750 2.89 × 10⁶ 28.36 52.70 0.00 0.10 18.81 0.00 ND
X3 < TOC 3.93 × 10⁵ 13.17 63.70 0.00 3.10 19.56 0.47 ND
X4 ND ND ND ND ND ND ND ND ND
Table 9.2 | Microbiological results of the Atacama Desert. ND = not determined.
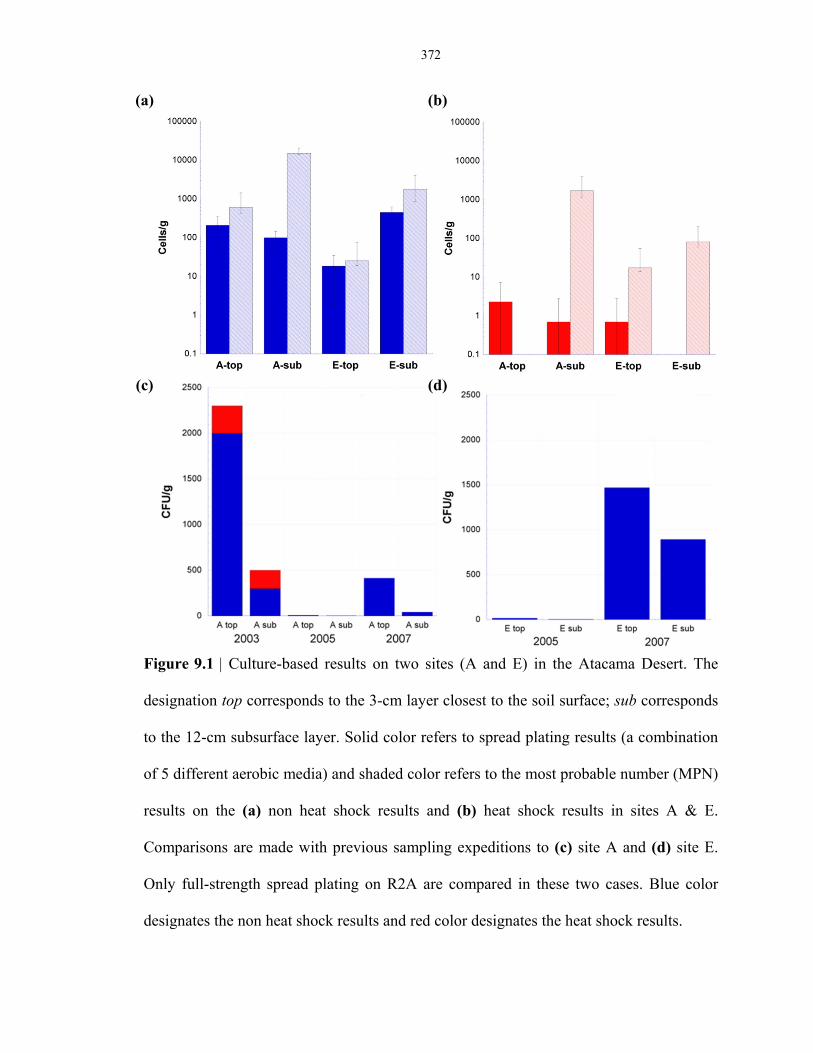
372
Figure 9.1 | Culture-based results on two sites (A and E) in the Atacama Desert. The
designation top corresponds to the 3-cm layer closest to the soil surface; sub corresponds
to the 12-cm subsurface layer. Solid color refers to spread plating results (a combination
of 5 different aerobic media) and shaded color refers to the most probable number (MPN)
results on the (a) non heat shock results and (b) heat shock results in sites A & E.
Comparisons are made with previous sampling expeditions to (c) site A and (d) site E.
Only full-strength spread plating on R2A are compared in these two cases. Blue color
designates the non heat shock results and red color designates the heat shock results.
(a)
(c)
(b)
(d)
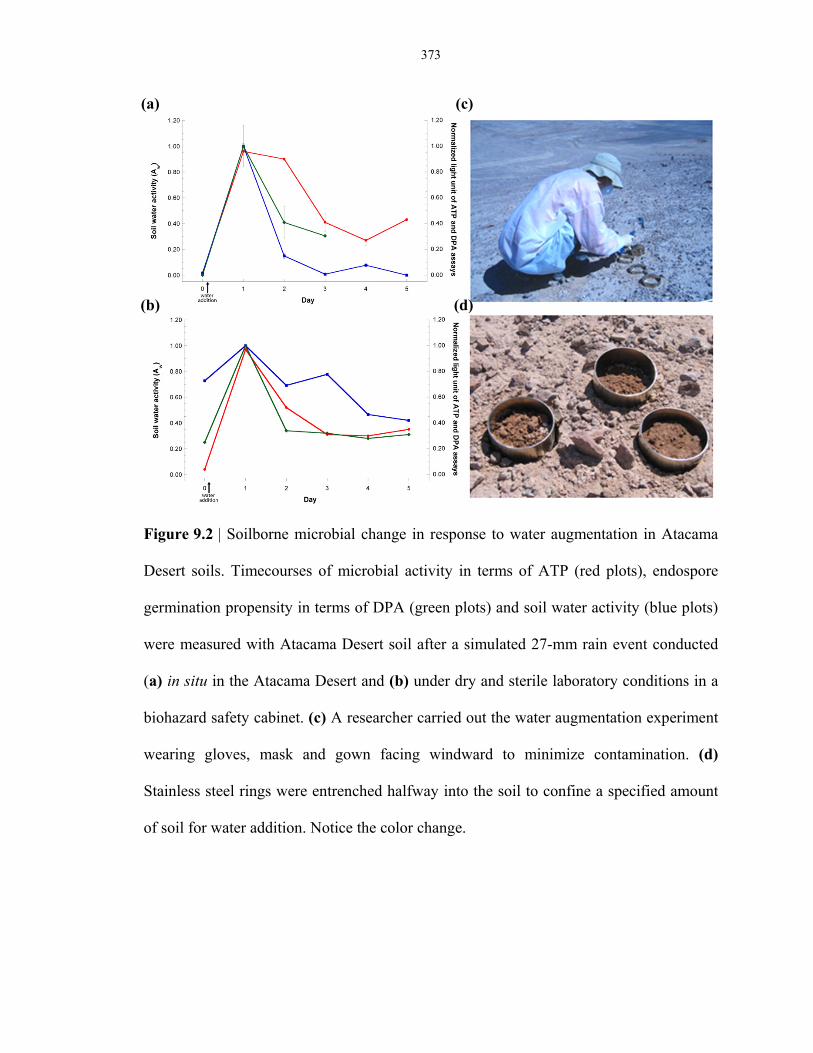
373
Figure 9.2 | Soilborne microbial change in response to water augmentation in Atacama
Desert soils. Timecourses of microbial activity in terms of ATP (red plots), endospore
germination propensity in terms of DPA (green plots) and soil water activity (blue plots)
were measured with Atacama Desert soil after a simulated 27-mm rain event conducted
(a) in situ in the Atacama Desert and (b) under dry and sterile laboratory conditions in a
biohazard safety cabinet. (c) A researcher carried out the water augmentation experiment
wearing gloves, mask and gown facing windward to minimize contamination. (d)
Stainless steel rings were entrenched halfway into the soil to confine a specified amount
of soil for water addition. Notice the color change.
(a) (c)
(b) (d)

374
Figure 9.3 | (a) The table shows the water augmentation results obtained using
culture-based spread plating and MPN methods, as well as the culture-independent
µEVA. Numbers in brackets represent the standard deviation based on 12 plates for cfu
enumeration and 24 field of views for germinable spore enumeration. The confidence
interval associated with the MPN method is not shown for brevity. Only non-heat shock
results were obtained using µEVA because this assay probes for the presence of
endospores only. Water augmentation performed on 500°C-kilned soil samples under
laboratory conditions showed negative results in all of the analyses. (b) Changes in the
number of culturable bacteria (non heat shock, blue bars; heat shock, red bars) before and
after water augmentation preformed under laboratory conditions. Error bars represent
95% confidence interval.
(a) (b)
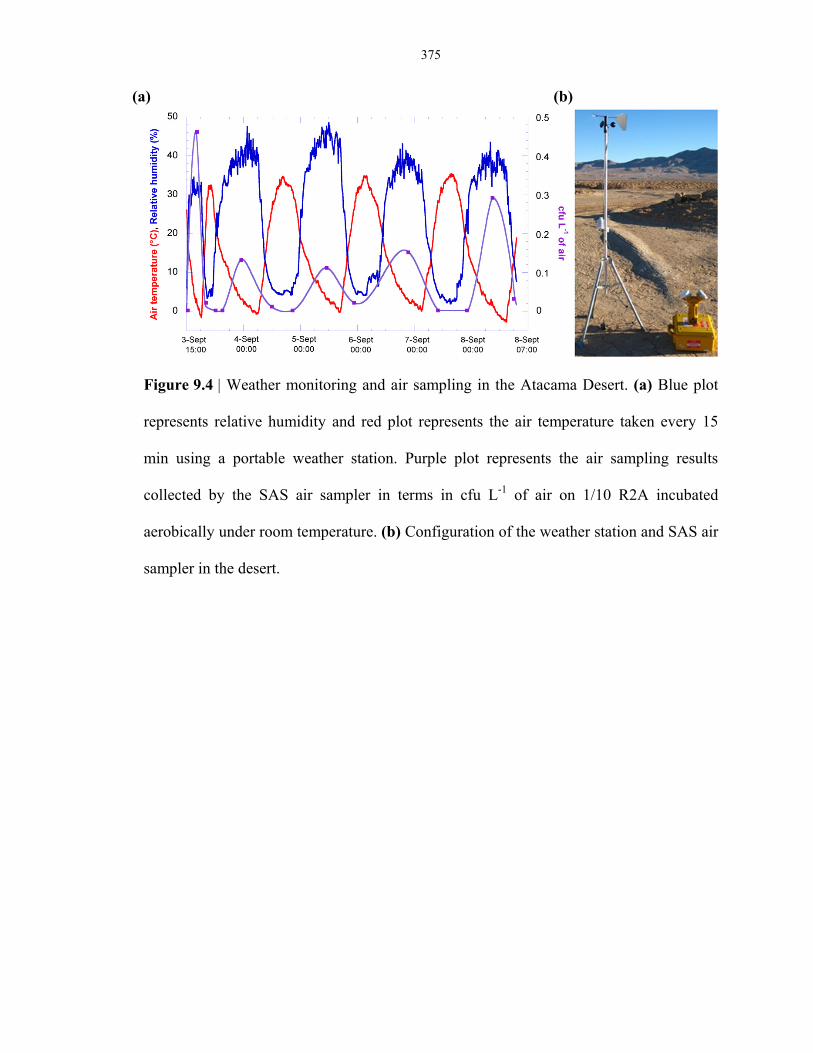
375
Figure 9.4 | Weather monitoring and air sampling in the Atacama Desert. (a) Blue plot
represents relative humidity and red plot represents the air temperature taken every 15
min using a portable weather station. Purple plot represents the air sampling results
collected by the SAS air sampler in terms in cfu L-1 of air on 1/10 R2A incubated
aerobically under room temperature. (b) Configuration of the weather station and SAS air
sampler in the desert.
(a) (b)

376
Figure 9.5 | Microbial numbers along a transect of depth profile in a soil pit in the
Atacama Desert. Culturable counts were obtained using spread plating and MPN methods
on (a) non-heat shock and (b) heat shock samples. Culture independent methods were
also employed, namely (c) µEVA, (d) phospholipid fatty acid analysis and (e) total
organic carbon analysis, as different proxies for microbial abundance. Error bars show
the 95% confidence interval (n = 12 for CFU enumeration, n = 3 for MPN and n = 24
fields of view for µEVA). (f) Picture of the soil pit where which the depth profile data
were measured.
(a)
(d)
(b) (c)
(e) (f)
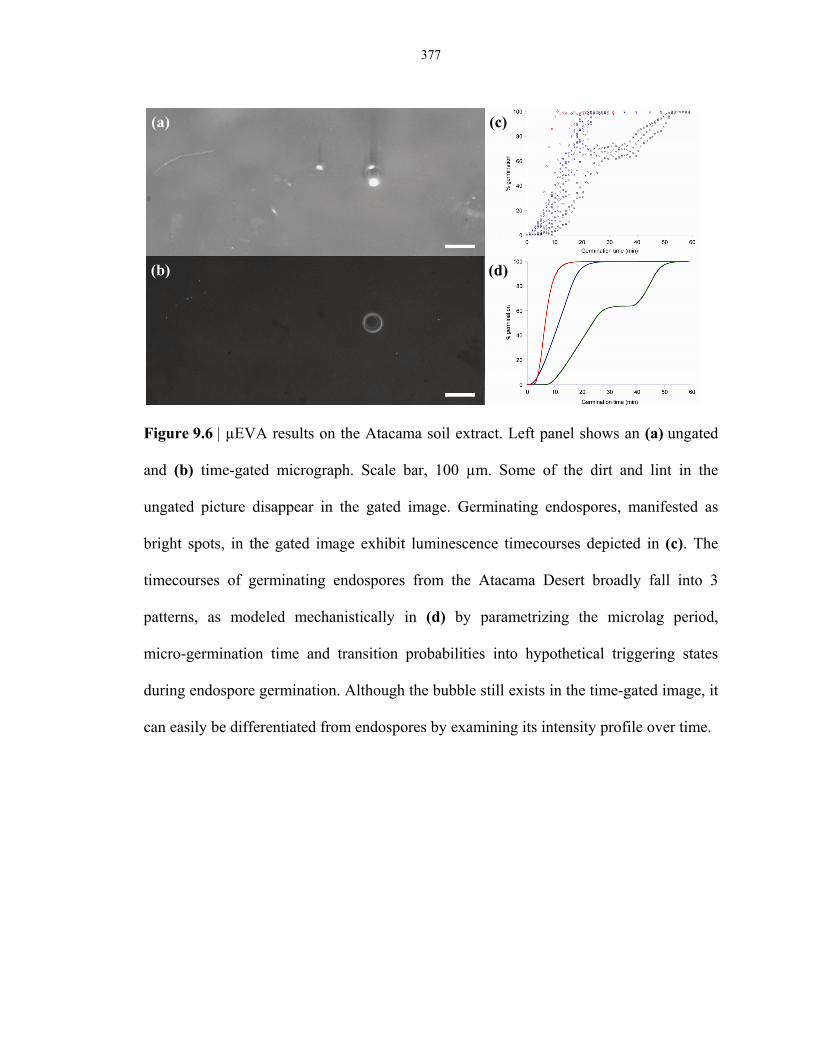
377
Figure 9.6 | µEVA results on the Atacama soil extract. Left panel shows an (a) ungated
and (b) time-gated micrograph. Scale bar, 100 µm. Some of the dirt and lint in the
ungated picture disappear in the gated image. Germinating endospores, manifested as
bright spots, in the gated image exhibit luminescence timecourses depicted in (c). The
timecourses of germinating endospores from the Atacama Desert broadly fall into 3
patterns, as modeled mechanistically in (d) by parametrizing the microlag period,
micro-germination time and transition probabilities into hypothetical triggering states
during endospore germination. Although the bubble still exists in the time-gated image, it
can easily be differentiated from endospores by examining its intensity profile over time.
(a) (c)
(d)(b)
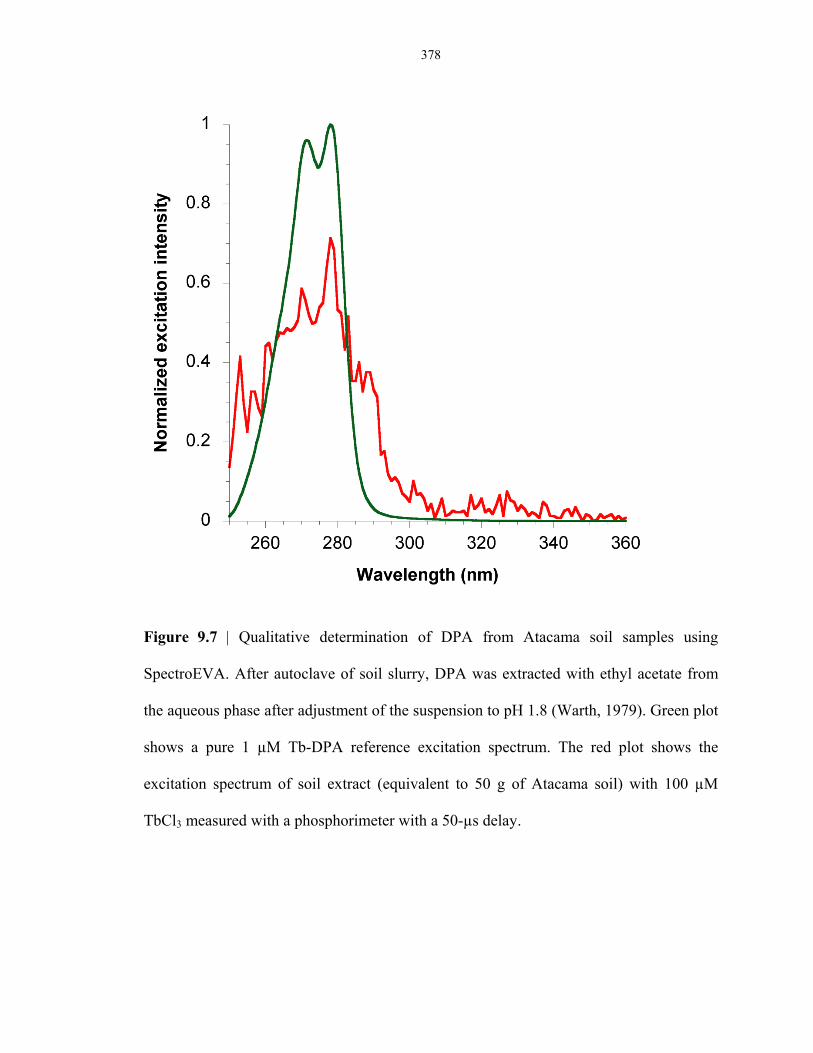
378
Figure 9.7 | Qualitative determination of DPA from Atacama soil samples using
SpectroEVA. After autoclave of soil slurry, DPA was extracted with ethyl acetate from
the aqueous phase after adjustment of the suspension to pH 1.8 (Warth, 1979). Green plot
shows a pure 1 µM Tb-DPA reference excitation spectrum. The red plot shows the
excitation spectrum of soil extract (equivalent to 50 g of Atacama soil) with 100 µM
TbCl3 measured with a phosphorimeter with a 50-µs delay.
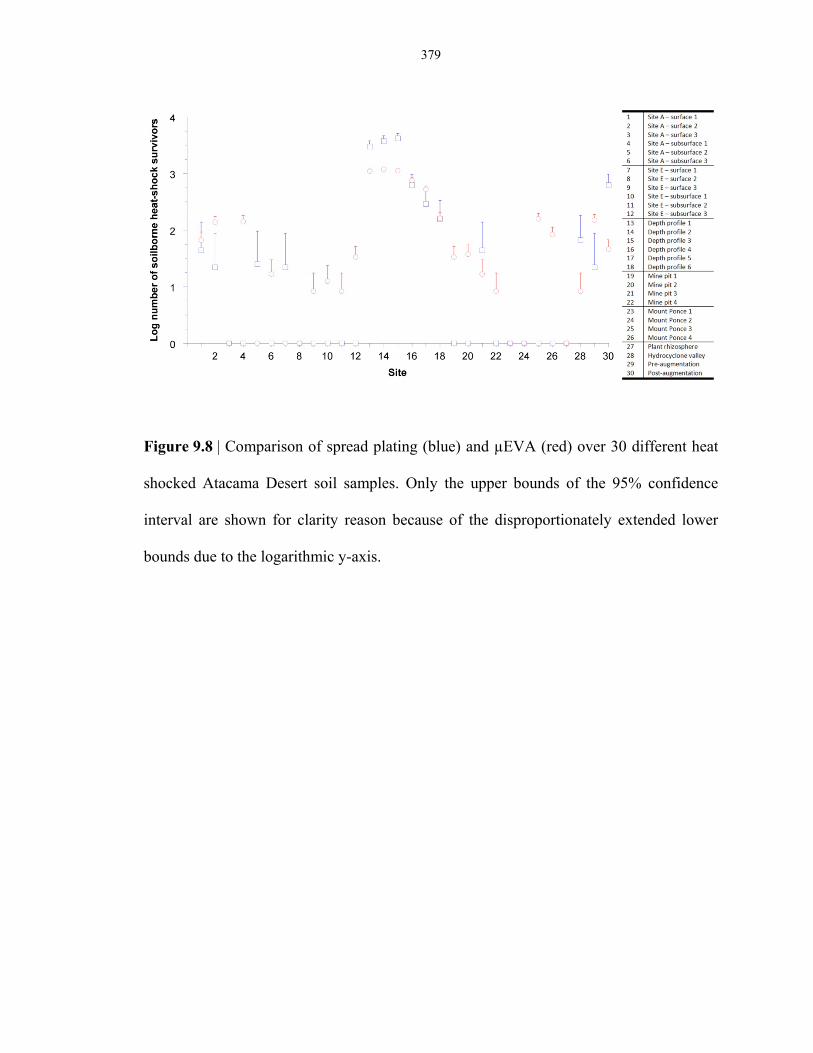
379
Figure 9.8 | Comparison of spread plating (blue) and µEVA (red) over 30 different heat
shocked Atacama Desert soil samples. Only the upper bounds of the 95% confidence
interval are shown for clarity reason because of the disproportionately extended lower
bounds due to the logarithmic y-axis.

380

381
Table 9.3 | Species for ecology study. ATCC standards for American Type Culture and
Collection. DSMZ stands for German Collection of Microorganisms and Cell Cultures.
JPL stands for Jet Propulsion Laboratory.
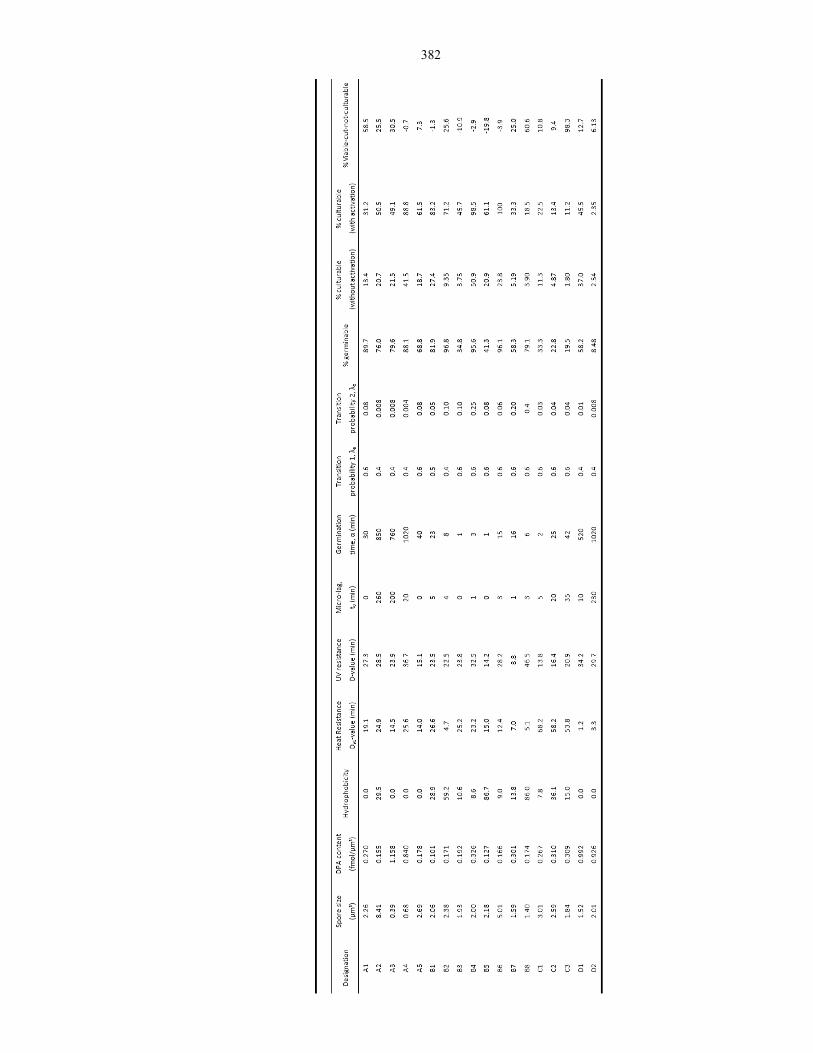
382
383
Table 9.4 | Data of the different thermophilic, mesophilic, psychrophilic laboratory and
environmental strain endospores. In the germination section, the best germinant
combination was used in the modeling and calculation of percent germinable. A
combination of L-alanine and AGFK was usually the best germinant, and sometimes
AGFK itself worked optimally for B. megaterium endospores and L-alanine plus inosine
worked optimally for B. cereus and psychrophilic endospores.
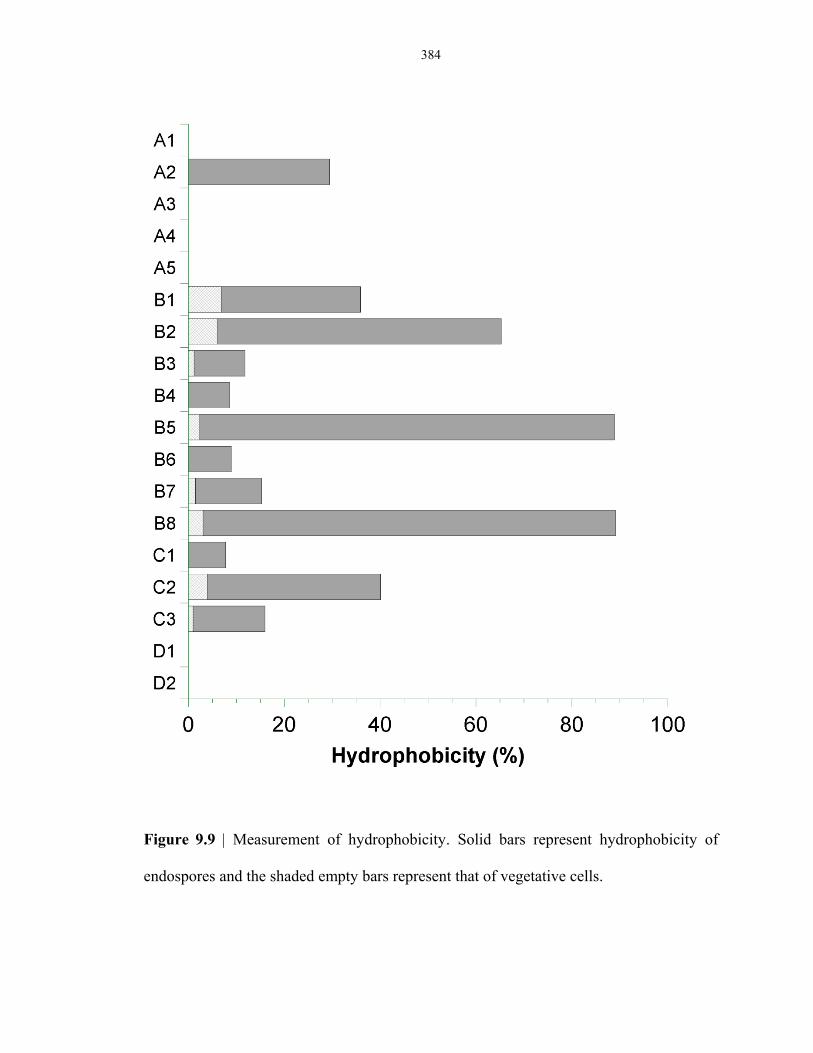
384
Figure 9.9 | Measurement of hydrophobicity. Solid bars represent hydrophobicity of
endospores and the shaded empty bars represent that of vegetative cells.
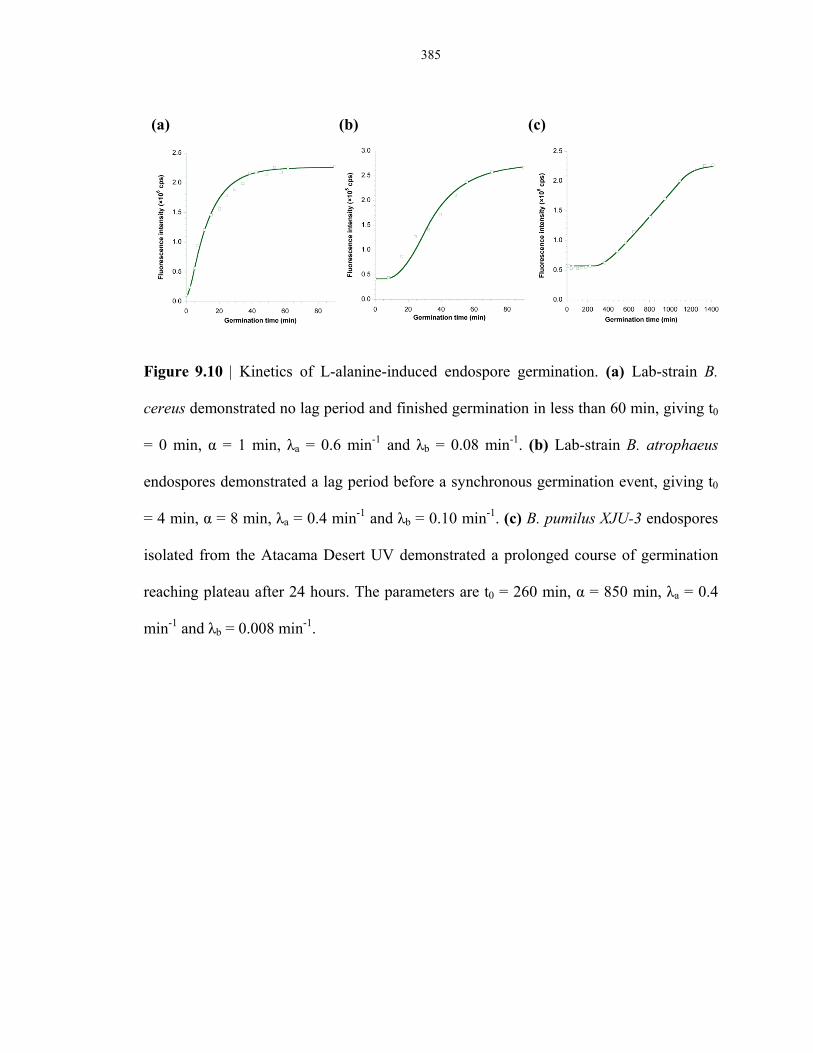
385
Figure 9.10 | Kinetics of L-alanine-induced endospore germination. (a) Lab-strain B.
cereus demonstrated no lag period and finished germination in less than 60 min, giving t0
= 0 min, α = 1 min, λa = 0.6 min-1 and λb = 0.08 min-1. (b) Lab-strain B. atrophaeus
endospores demonstrated a lag period before a synchronous germination event, giving t0
= 4 min, α = 8 min, λa = 0.4 min-1 and λb = 0.10 min-1. (c) B. pumilus XJU-3 endospores
isolated from the Atacama Desert UV demonstrated a prolonged course of germination
reaching plateau after 24 hours. The parameters are t0 = 260 min, α = 850 min, λa = 0.4
min-1 and λb = 0.008 min-1.
(a) (b) (c)

386
Figure 9.11 | (a) DPA density vs. spore volume plot. Solid data points represent
environmental strains and empty data points represent laboratory-grown strains.
Thermophiles are represented in red, mesophiles in green and psychrophiles in blue.
Phase contrast image of the endospores of (b) B. amyloquedaciens isolated from Atacama
Desert; (c) lab-strain B. subtilis 168; and (d) B. pumilus XJU-3 isolated from Atacama
Desert. Scale bar, 1 µm.
(a) (b)
(c)
(d)
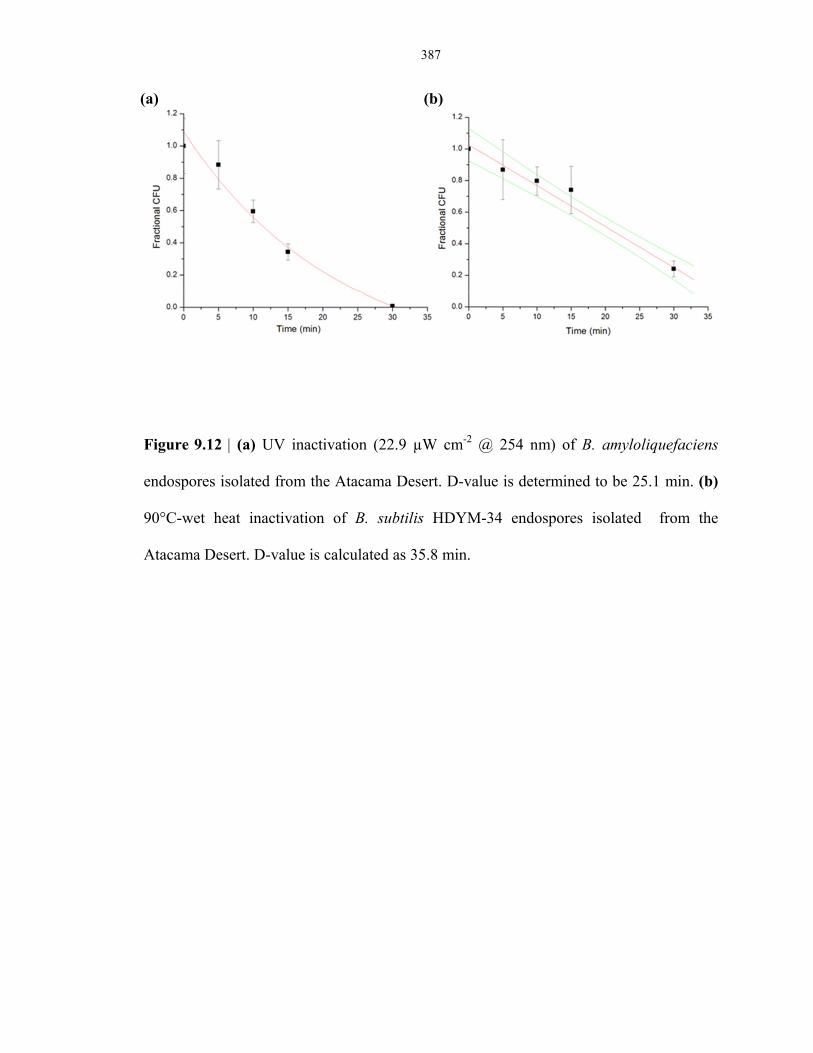
387
Figure 9.12 | (a) UV inactivation (22.9 µW cm-2 @ 254 nm) of B. amyloliquefaciens
endospores isolated from the Atacama Desert. D-value is determined to be 25.1 min. (b)
90°C-wet heat inactivation of B. subtilis HDYM-34 endospores isolated from the
Atacama Desert. D-value is calculated as 35.8 min.
(a) (b)
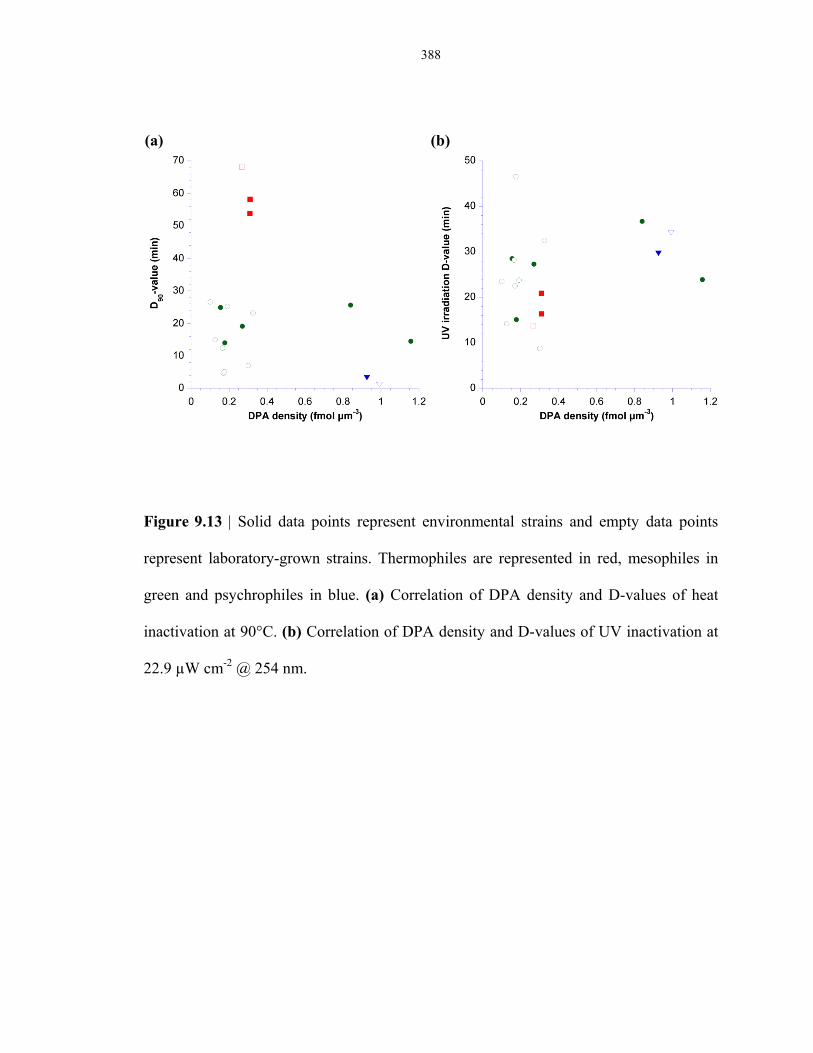
388
Figure 9.13 | Solid data points represent environmental strains and empty data points
represent laboratory-grown strains. Thermophiles are represented in red, mesophiles in
green and psychrophiles in blue. (a) Correlation of DPA density and D-values of heat
inactivation at 90°C. (b) Correlation of DPA density and D-values of UV inactivation at
22.9 µW cm-2 @ 254 nm.
(a) (b)
389
CHAPTER 10: CONCLUSION
Ever since endospores had been discovered independently by Cohn, Koch and Tyndall
in the latter part of the 19th century1-4, their extreme resistance and hardy structure
have fascinated the field of microbiology. They are one of the most differentiated and
evolutionary capable living organisms on Earth. They are omnipresent and
omnipotent, integrating survival capabilities from halophiles, mesophiles,
psychrophiles, thermophiles, etc. They inhabit the air, soil, deep-sea sediments,
permafrost and ice cores. They are the airborne carrier agent for anthrax attack and
bio-insecticide. They determine the expiration dates in pasteurized products. They can
remain dormant in soil and amber for millions of years before waking up and
germinate back to vegetative form. They are even postulated to have traveled billions
of light years from other planets to the Earth via meteorites.
The multifaceted world of endospores has been explored in this thesis project.
It is not difficult at this point of our study to reach the conclusion that while each of
the individual habitats for endospores are different, endospores themselves are highly
conserved in terms of their sporulation, germination and outgrowth properties,
varying to some extent.
I conclude this thesis by assessing the capacity of endospores in fulfilling the
roles of acting as surrogate for total biomass in a closed system, reflecting key
390
environmental variables and providing early warning signs of an anticipated stressor.
The assessment has been carried out comprehensively from sampling in the air,
validating bioburden level on surfaces and ecological systems in extreme habitats.
Sharing a concerted similarity, spacecraft air, spacecraft surfaces and extreme
environments are all good examples of a closed system. The air inside a space station
or spacecraft is no doubt a closed system. Spacecraft hardware has to be assembled in
highly controlled clean rooms in designated facilities. And we can also find closed
systems in environmental extremes such as the ice cores in which the microbes are
frozen, and the subsurface soil habitat the Atacama Desert where the absence of
moisture makes dormant life forms undisturbed. Endospores have been found to be a
good and reliable biological indicator to suit the aforementioned roles because (1)
they are responsive to indicate impending changes in key changes in the ecosystem,
e.g., they react to the presence of water and nutrients; (2) they are ubiquitous in
almost all terrestrial environments; (3) they can readily be monitored continuously by
the technology developed in our lab over a wide range of environments; (4) the
detection technology is highly specific to endospores because of the uniqueness of
DPA in the natural environment; (5) the detection technology is an automated and
cost-effective approach; (6) the detection principle is highly versatile and can be
amenable to be integrated into comprehensive monitoring systems. In conclusion, an
391
effective germination-based endospore detection tool has been developed to
complement the current cultivation and nucleic acid approaches to answer basic
questions in microbiology, ecology and astrobiology.
10.1 Development of Automated Bacillus Spore Viability Instrumentation for
Sterilization Validation, Biodefense and Astrobiology
Previously, a luminescence time-gated microscopy technique called Rapid Bacillus
Spore1 Viability Assay (Rapid BSVA) was developed and validated in Dr. Ponce’s
laboratory. Rapid BSVA enables the enumeration of single germinable Bacillus spores
in less than an hour. The method is based on direct counting of individual endospores
under a time-gated microscope, where the image contrast is generated by a highly
luminescent complex that forms between dipicolinic acid (DPA) released via spore
germination and terbium ions previously doped into the substrate. The highly
luminescent and long-lived terbium dipicolinate complex, acting as an intrinsic
luminescence probe for each endospore, can be resolved spatially and temporally
under pulsed UV excitation. Currently, Rapid BSVA consists of a bench-top
instrument. Under NPP funding, I will develop a second generation prototype of
Rapid BSVA by miniaturizing the bench-top instrument into a portable,
1 In this document, references to spores denote bacterial spores/endospores.
392
high-throughput and automated device that will find application in (1) monitoring the
efficiency of post anthrax attack decontamination, (2) quantifying germinable spore
population in spacecraft assembly facilities, (3) astrobiology by evaluating
germinability of the most durable form of life in the most extreme environments (e.g.,
Atacama Desert, Chile), and (4) the effect of spore injury and repair on germination
system subjected to different inactivation regimens.
10.1.1 Statement of problem
Currently, the effectiveness of a sterilization regime is monitored by spores in the
form of biological indicators, frequently requiring incubation periods in excess of 48
hours for a detectable level of colony formation5. In hospitals and spacecraft assembly
facilities, such a long quarantine period is undesirable due to the high cost of having
devices inactive and the possibility of secondary contamination. The shorter the
analysis time, the faster the processed devices can be returned to use with a higher
degree of confidence in sterility and fidelity of life detection. In particular,
inhalational anthrax is curable if antibiotics are given promptly after infection6. A
rapid, automated and high-throughput spore-detection method thus grants precious
time for emergency management to mitigate catastrophic anthrax attack by
appropriate medical care and timely decontamination. Rapid BSVA has therefore been
393
developed to address the aforementioned issues.
10.1.2 Background and relevancy to previous work
Endospores are highly differentiated cell types in the life cycle of sporeforming
genera of Bacillus and Clostridium. They are formed within vegetative cells during
sporulation, which is frequently triggered in response to adverse environments, such
as starvation and desiccation. Spore DNA is protected from the environment by a
surrounding spore coat comprised of calcium ions, dipicolinic acid (DPA) and protein
layers. DPA was first discovered in spores by Powell in 19537. It is present in the
protoplast of spores and constitutes 5% - 15% of the dry weight. DPA is synthesized
during sporulation and is a unique chemical found only in bacterial spores and
amounts to a high local concentration of 1 molar, thereby serving as a confirmatory
biomarker for spores. With no detectable metabolism, bacterial spores are ubiquitous
in environmental extremes, such as freezing, boiling, pressure and desiccation. Once
favorable conditions return, spores undergo germination and outgrowth to return to
vegetative cells that can actively multiply to cause food spoilage, contaminations,
diseases, etc.
Sterilization has been known since historic times as a cleansing and purifying
agent. In 1832 William Henry found that contaminated garments treated with
394
pressurized steam could be worn with impunity by others; Louis Pasteur also used a
pressure vessel with safety valve for contagion inactivation. Their work laid the
foundation for the sterilization efforts nowadays, such as autoclave, radiation and
ethylene oxide. Although the concept of sterility is simple and straightforward, the
verification of a sterile state is very complex. The inability of a sterility test to detect
low levels of contamination with a reasonable number of samples has been recognized
since early 1970s8. Validation of sterilization is a critically important topic on
planetary protection, homeland security and health care.
Dr. Adrian Ponce’s research team at JPL pioneers in spore detection
methodologies ranging from traditional cultivation, to molecular biology methods and
novel techniques such as DPA-triggered terbium luminescence assay9-14. As a
graduate student, I am part of the team in the development and implementation of
anthrax smoke detector, endospore viability assay, and the 1st generation Rapid BSVA
in the past 4 years15. With this proposed work, I would like to apply my experience
gained on my thesis with that of my bioengineering graduate curriculum to build a
portable, high-throughput and automated 2nd generation Rapid BSVA instrument to
investigate spore viability in extreme environments, and to perform on-site sterility
assessments (e.g., spacecraft assembly facilities).
395
10.1.3 General methodology and procedures to be followed
Currently, Rapid BSVA involves a 3-step procedure: swab-rinse, sample preparation
and imaging. First, spores are collected by sterile cotton applicators from surfaces,
resuspended into water, subsequently filtered, concentrated and immobilized onto
membrane filters. Spore-laden filters are placed on top of a germination agarose
substrate comprised of terbium and L-alanine as a spore germinant. When triggered
by L-alanine, spores germinate and release ~108 DPA molecules. Individual spores, or
more specifically the resultant Tb-DPA luminescence halos surrounding the
germinated spore bodies, are imaged with a time-gated microscope, with a distinct
intensity profile from minutes to an hour based on characteristic germination kinetics
of the species. Figure 10.11 shows the working principle of the assay16,17. Each of
these bright spots is assigned as a germinable spore unit (GSU), in analogous with
colony-forming unit (CFU).
DPA acts as a light-harvesting antenna to transfer the energy to Tb3+ in the
proximity upon UV excitation. Luminescence can be observed due to energy transfer
from the lowest-lying DPA triplet excited state to the emissive 5D4 state of Tb3+.
Significant luminescence enhancement can be observed because of the large energy
gap between the Tb3+ ground state and emissive states (20,500 cm-1). In addition,
terbium dipicolinate (Tb-DPA) is characterized by a long millisecond luminescence
396
lifetime18-21. Therefore, a microsecond time gating can effectively eliminate
background interference, whose lifetimes are usually on the order of 1-10
nanoseconds22.
10.1.4 Proposed work
Task 1 - Design and test an automated, field portable and high-throughput Rapid
BSVA instrument
The current Rapid BSVA is a benchtop instrument consisting of bulky components
such as a xenon flashlamp and stereoscopic microscope. Figure 10.2 illustrates the
design for the next generation instrument, which is automated, field portable and able
to handle parallel sample processing. The excitation light source will be miniaturized
using solid-state, deep UV LEDs, and the microscope will be reduced to a focusing
objective for magnification and piezoelectric actuators for focusing. The LED
controller will serve as the master oscillator that controls the overall repetition rate of
data acquisition. The camera will be synchronized with the LED pulses via a control
box that is triggered by TTL-inputs from the LED control system. The entire
assembly will be put inside a light-tight enclosure. To enable high sample throughput,
we will employ a 96-well assay plate that will be mounted on a 3D stage, such that
each well can be assayed in series. Each reading of germinable spores by instrument
397
will require less than 20 seconds, thus enabling 96 wells to be read out in
approximately 30 minutes.
Spore germination on agarose surface follows the reported micro-germination
kinetics23,24. DPA released from single B. atrophaeus and B. subtilis spores manifest
as individual bright spots in 15 minutes under time-gated microscopy due to local
formation of Tb-DPA (figure 10.3). Current image analysis is done in ImageJ based
on simple image segmentation and thresholding. The 2nd generation will switch to
Matlab to handle the large number of images. Assignment of germinable spores will
be based on intensity and size using a neural network system. Adaptive thresholding
will be applied to segment pixels that are 3 times brighter than the background with a
characteristic rising intensity. Each bright spot must exhibit a continuous rising
intensity over the course of germination in order to register a spore count. This
criterion will reduce the probability of false positives. The 8-connected adjacent
pixels will be analyzed to screen for spore clumps. The number of spores present will
be calculated by dividing the squared sum of neighboring pixel brightness by the
mean brightness of an individual spore determined empirically. This will be done in a
recursive way until all of the pixels are counted and marked. Hardware control and
image analysis will be executed using LabVIEW.
398
Task 2 - Construct spore biological indicator modules for high-throughput monitoring
of spore inactivation
In the event of a biological attack, we envision that spore biological indicator modules
be distributed to witness the effectiveness of a sterilization regimen applied for
building restoration (e.g., vaporized hydrogen peroxide, ethylene oxide, or chlorine
dioxide). Each module contains a PDMS strip with 4 spots, 3 spots loaded with 107
CFU of spores and 1 control negative spot. After distributing 24 individual modules in
the contaminated environment (e.g., in drawers, HVAC units, cabinets, etc.) and
following the sterilization procedure, the modules can be collected and readily
assembled into 96-spot array. The array can be constructed by linking modules as
shown in figure 10.4.
The 96-spot array is then inverted and placed onto a 96-well fixture. This
presses the spores against the Tb/L-alanine doped agarose and triggers the
germination process for any surviving, germinable spores. The spore-laden PDMS is
then secured into place with two clips that allows the removal of the biological
indicator array minus the PDMS strips. After 10 minutes of germination, the 96-well
assay plate is ready for analysis by the Rapid BSVA reader.
Task 3 - Employ high-throughput Rapid BSVA for analysis of environmental surfaces
399
sampled with cotton swab method
Stainless steel coupons (2 × 2 in) inoculated with spore populations ranging from 0 to
107 spores will be swabbed to remove spores from the surfaces. Spores will be
resuspending by sonication and shaking. Extracts from 96 samples will be pipetted, 12
at a time with a multi-pipettor, into a 96-well filtration device (Figure 10.5) and
filtered onto a 0.2 µm polycarbonate membrane filter. The membrane filter with 96
filtration spots will then be placed, spore-side up, onto the 96-well assay plate and
covered with a PDMS layer. After 20 minutes of germination, the 96-well assay plate
is ready for germinable spore analysis by the Rapid BSVA reader. Rapid BSVA will be
employed to evaluate the cleanliness of spacecraft assembly facilities.
As a preliminary test, Rapid BSVA yields comparable results as cultivation in
evaluating bioburden in a spacecraft assembly facility, with entrance samples showing
negative results and floor metal plate samples showing 3.6 germinable endospores
cm-2 and 1.2 cfu cm-2, respectively. The new prototype will enable parallel processing
and expedite the analysis time in order to achieve rapid on-site monitoring of sterility.
Task 4 – Apply Rapid BSVA on samples collected form extreme environments.
One of the scientific goals for the Mars Science Laboratory mission is to assess the
biological potential of at least one selected site on Mars. The surface and subsurface
400
of Mars are characterized by intense UV radiation, presence of oxidizing compounds,
absence of water and low temperatures, collectively considered as inhospitable for life
as concluded by the Viking mission25. Yet the recent discovery of extremophiles
thriving in various extreme conditions on Earth has revived the interest in using
ecosystems on Earth as model systems for life detection in the past or even present
Mars.
By studying the germination characteristics of spores, we can inherently
determine the boundary conditions for survival and the longevity of life. We have
applied the 1st Rapid BSVA to detect and enumerate spores, the most resilient form of
life on Earth, under different extreme conditions, such as the Atacama Desert,
Greenland ice cores and Antarctica Lake Vida26-29. One limitation is, however, the
inability to study in situ spore properties in their native environments. The new
portable Rapid BSVA prototype will enable field analysis on extreme environments
on Earth and potential future missions looking for trace number of spores on the
surface or subsurface of Mars and Europa.
Task 5 - Study spore injury mechanism using high-throughput Rapid BSVA instrument
Spore injury is a temporary damage to spores when they are exposed to physical or
chemical treatment30. Spore repair is a process by which injured spores revert to their
401
original state. When placed in growth media incubated at the optimal temperature,
untreated spores usually germinate very rapidly, a process to be completed within 30
min. On the other hand, injured spores invariably require longer periods for repair,
and for this reason it is prudent to prolong the incubation time well beyond the usual
period. This imposes a time constraint to the 1st generation Rapid BSVA because
samples are processed serially. Deployment of the 2nd generation device enables
high-throughput parallel processing and thus expedites the germination analysis of a
large number of samples. Studies on the injury and repair of spore germination system
will shed light on the assessment of sterility, which must take into account conditions
for repair of injured, but still viable and potentially harmful, bacterial spores31.
The expression of injury may take many forms but previous research has
primarily focused on the loss of ability to form colonies. We have tested the feasibility
of measuring the release of DPA as a probe for spore inactivation. The survival curves
of various Bacillus spores subjected to wet heat, UV and vaporized hydrogen
peroxide treatment has been reported in Chapters 5, 6 and by other people32,33. On the
basis of these observations, we are going to optimize the recovery growth and
germination media, determine the repair time and study the differences in the decimal
reduction times (D values). We will develop a quantitative model that describes the
effect of these inactivating agents on germinability and culturability.
402
10.1.5 Expected results
Once I have built the automated and high-throughput Rapid BSVA instrument (task 1),
I expect to obtain results in the areas of biodefense (task 2), surface hygiene (task 3),
spore survival in extreme environments (task 4) and in delineating mechanisms of
spore inactivation (task 5). Specifically, I will build and design a miniaturized
integrated imaging system described in the previous section capable of analyzing 300
samples/hour with single spore resolution and full automation under a LabVIEW
interface. The instrument will firstly be applied in a series of validation tests using
different sterilization agents. Spore biological indicator module will be constructed
for high-throughput processing. In particular, the instrument will be used to assess the
decontamination efficiency of ethylene oxide in a post-anthrax attack cleanup. Second,
the instrument will be used to collect data on bioburden measurements on flight
hardware surfaces and spacecraft assembly facilities. As outlined in the milestone, this
portable 2nd Rapid BSVA unit will also be used to measure in situ spore germination
characteristics in different extreme environments. The effect of spore injury and repair
mechanisms on germination will be investigated and will be useful in understanding
the actual effectiveness of different inactivation regimens.
10.1.6 Significance and application
403
The proposed 2nd generation Rapid BSVA has deliverables synergistic with the goals
of NASA research on astrobiology, planetary protection and biodefense. NASA is
committed to protecting solar system bodies from contamination by Earth life and to
avoid contamination that would obscure the credibility of life detection missions.
Stringent standards are imposed in assessing the degree of microbiological
contamination of spacecraft hardware and assembly facilities, broadly known as
planetary protection. Currently, the major methodology is the counting of viable
colony-forming units on various defined media after 3 days, a time frame not in
concert with the rigid schedule of spacecraft assembly. Rapid BSVA obviates the need
of cultivation by enumerating spores based on germination events, a process that takes
30 minutes to complete. Preliminary results have demonstrated that Rapid BSVA
yielded comparable yet more rapid assessment of clean room bioburden than
cultivation techniques. The second generation will enable on-site and near real-time
measurement.
Rapid BSVA, coupled with the 96-well biological indicator modules, provides a
quick and convenient solution to validate various sterilization methods, such as heat,
UV, vaporized hydrogen peroxide and ethylene oxide. It can be used in hospitals to
ensure utensils are devoid of spores. It is useful in validating the efficiency of
post-anthrax attack decontamination. The Rapid BSVA device can also be
404
incorporated into rovers to be sent to other planets. The assay is fully automated and
reagent-free to provide an easy platform to investigate earth-borne spore germination
characteristics under outer space conditions.
Spore germination is a process whereby spores change from dormancy to a
metabolically active state. The process of spore germination involves a rapid sequence
of degradative events. It is through germination and subsequent outgrowth that spores
cause food spoilage and toxin formation, which may ultimately give rise to
food-borne disease and bioterrorist attack34. Furthermore, since resistance properties
of spores are concomitantly lost, the mechanism of germination may hold clues to
more efficient methods for spore inactivation. Therefore, apart from being
scientifically interesting, the process of spore germination is of great importance from
the application aspect.
By applying time-resolved luminescence microscopy on bacterial spores, we
are able to study spore germination and perform rapid enumeration from a different
perspective from the current cultivation methods. We have demonstrated the ability to
enumerate single spores within 30 minutes using both lab and environmental strains.
Rapid BSVA is a powerful tool for basic science research, environmental
microbiology and astrobiology. In particular, it elucidates the behavior of viable
endospores because one has the ability to work with smaller sample volumes, shorter
405
analysis times with higher throughput. Miniaturization and portability has direct
relevance to bacterial spore detection in food hygiene and sterility control, as well as
great implications in life detection missions. The work proposed here opens up new
avenues for exploring the rich biology of bacterial spores and gleans us important
information on the longevity of life.
10.2 Development of a Rapid Endospore Detector
This proposal describes the development of a microfluidic device for the rapid
detection of viable bacterial endospores by time-gated fluorescence and
bioluminescence spectroscopy. Endospores are detected based on a series of unique
physiological changes during germination, exemplified by dipicolinic acid release,
ATP synthesis, protein degradation and membrane stainability. Total endospore
population is determined by monitoring dipicolinic acid release upon electroporation.
Sample handling, processing and analyses are all incorporated into a microfluidic
circuit to offer the ability to work with smaller reagent volumes, shorter reaction times,
and the possibility of parallel operations. Here we propose integrating an entire suite
of bacterial endospore detection regimen onto a single chip, which will be deployed
and field tested under various extreme environments, such as desert, ice cores and
permafrost. The effects of germinants and temperature on viable spore germination
406
can be studied with full automation and high throughput in less than one hour on the
field that closely mimic in vivo environment of endospores by coupling spectroscopy
with microfluidics.
10.2.1 Statement of problem
Endospore formation is a very successful survival and dispersal strategy. Endospores
are found in nearly every conceivable natural habitat on Earth and persist for long
times due to their resistance. Therefore, endospores have long been fascinating
subjects of investigation for a number of important applications, from sterilization
validation, biodefense to astrobiology. Detection of low levels of dormant endospores
under various extreme environments presents great challenges to researchers. The
current microbiological gold standard is to culture endospores on agar plate, which is
lengthy and labor intensive. A limitation of cultivation is the inability to correlate
results to in vivo endospore behavior because of the difficulty to implement lots of
culturing work on the field. This limits the ability to accurately understand endospore
dormancy, viability and germination occurring in vivo. Here we propose a rapid,
automated and handheld device to determine endospore viability from different
perspectives, namely germination propensity, metabolic activity, protein degradation
and membrane integrity. The lab-on-a-chip design enables portability and on-field
407
analysis to probe the in situ viability state of endospores in their native environments,
providing us valuable information in homeland security, food industry and the search
for extraterrestrial life.
10.2.2 Background
Bacterial spores, or endospores, are highly specialized structures formed primarily
from Bacillus and Clostridium genera that are designed for the survival of adverse
conditions. Spores are metabolically dormant and can withstand harsh physical
environments, including ultraviolet (UV) and gamma radiations, extreme (high and
low) atmospheric and hydrostatic pressures and desiccation. The remarkable
resistance of bacterial spores is highlighted with the examples of spores surviving
space travel and multi-million-year spore longevity. The current record for longevity
is claimed by isolate 2-9-3, a salt-tolerant organism related to Bacillus marismortui,
viable spores of which have been isolated from a primary salt crystal 250 million
years old. The routine monitoring of bacterial spores is of great interest because some
of them may cause food poisoning, diseases, and perhaps more importantly can
constitute deadly agents of biowarfare and bioterrorism. Among the numerous
biowarfare agents, B. anthracis, a spore-forming bacterium causing anthrax, is of the
greatest concern. Especially after the anthrax attack in 2001, the rapid detection of

408
bacteria spores including B. anthracis has been a focus area. Bacterial spores are a
major nuisance in the food industry, being omnipresent, thus occurring frequently in
food ingredients and raw materials. Their high resistance enables survival of food
processing treatments designed to inactivate bacteria.
Spore germination is a process whereby spores change from dormancy to a
metabolically active state. It can be induced by nutrients or a variety of non-nutrient
agents. Nutrient germinants bind to receptors in the spore’s inner membrane and this
interaction triggers the release of the spore core’s huge depot of dipicolinic acid (DPA)
and cations, and replacement of these components by water. The spore becomes
partially stainable due to degradation of the spore coat and membrane, known as
germination stage I. Stage II is marked by the onset of metabolism and
macromolecular biosynthesis, giving rise to the production of ATP. Further water
influx hydrolyzes and expands the cortex. Germinated spore are fully stainable and
there is rapid protein degradation and in the first minutes of spore germination.
Germination process is specific to endospores. And the chemicals associated
with germination, dipicolinic acid (DPA) is unique chemical marker found only in
endospores35. Hence, being able to track germination are synonymous as detecting
viable endospores. Toward this end, an endospore viability assay has been developed
to quantify the number of total and germinable endospores13,16,29, where the ability to
409
germinate serves as an indicator for viability. It determines the total spore population
via DPA release by spore lysis. Consequently, the proportion of DPA released during
germination with respect to the DPA content of the whole spore population provides a
measure of the percentage of spores capable of germination. The process of endospore
germination can be initiated on the timescale of minutes by the addition of trigger
molecules such as L-alanine, L-asparagine, or glucose34-38. The firefly
luciferin-luciferase assay is used to monitor ATP increase during germination, SYPRO
Rose Plus staining is used to track protein degradation during germination and
acridine orange is used to monitor stainability upon germination.
To achieve the goal of investigating endospore viability in extreme
environments, there are three major tasks in this proposal:
(1) Miniaturize development of an endospore viability assay based on DPA
detection;
(2) development of field instrumentation for deployment in extreme
environments;
(3) optimize methods of viability assessment of endospores.
The entire suite of endospore detection, namely sample processing, treatment
and analyses, are all embedded into a microfluidic platform so that it is portable and
can be deployed as a field instrument in extreme environments. Different
410
spectroscopic techniques are adopted to miniaturize different excitation sources and
detectors onto the microfluidic platform. In addition to this, the lab-on-a-chip design
enables automated and high-throughput parallel processing of samples. A variety of
germinants and temperatures will be tested for optimal germination based on DPA,
ATP, membrane integrity and protein degradation, in an effort to characterize in situ
response of endospores to germination stimuli and consequently a better picture of
spore survival in extreme environments.
10.2.3 General methodology
We will design and build a microchannel network to perform on-chip endospore
preparation and luminescence detection. Upon germination, characteristic changes
associated with DPA, ATP, protein and spore membrane are monitored
spectroscopically to determine endospore viability.
Figure 10.6 shows a schematic and time table of the device. An endospore
suspension is injected into a heat shock chamber by a syringe pump. The sample will
be heat treated at 80 for 15 minutes to screen for spores by inactivating the
vegetative cells. Some of the heat shocked samples will be directed to the detector
chip to establish a baseline for subsequent measurements. The rest of the samples
enter either the electroporation chamber for endospore lysis by the pulsed electric

411
fields, or the germination chip for a 30 min incubation under customizable germinants
and temperatures. Lyzed endospore suspension is analyzed at the detector chip to
determine the total endospore population based on DPA release. During the 30 min
incubation period, 4 timecourse samples will be analyzed to track the physiological
changes as a function of germination. Terbium-DPA luminescence assay, firefly
luciferin-luciferase bioluminescence assay, SYPRO Rose Plus staining and BacLight
live/dead viability assay will be employed in the detector chip to study germination of
endospores, with details as shown below.
(1) Sample handling, transport, thermal control
(2) Electroporation
(3) Excitation & Emission
(4) Tb-DPA luminescence assay
(5) Firefly luciferin-luciferase bioluminescence assay
(6) SYPRO Rose Plus staining
(7) BacLight live/dead viability staining
(1) Fabrication, sample handling and thermal control
Chip layout made by AutoCAD is written onto a glass mask for UV photolithography,
through which a mask is further prepared in gold by elelctroplating for synchrotron
412
radiation lithography. Glass wafer is used as the substrate of a synchrotron
radiation-cured polymer mold for replication of the channel pattern to PDMS.
Channels are washed sequentially using methanol, water, 1 M NaOH, 0.1 M HCl, 0.1
M NaOH and water. Between runs, channels are rinsed in order with 0.1 M NaOH,
water and 20 mM PBS buffer (pH 7.8) to ensure reproducibility. Gated injection mode
will be employed for injections and pumping will be provided by peristaltic pumps.
Commercial heaters and thermocouples will be manually applied to the back side of
the glass chip to control temperature of the heat shock and germination chambers.
We will look into the possibility of building microfabricated heaters and detectors
within the chambers if more precise temperature control is needed.
(2) Electroporation
Electroporation is a significant increase in the electrical conductivity and permeability
of the cell plasma membrane caused by an externally applied electric field. Hamilton
and Sale discovered that the application of high electric field pulses at typical field
strengths of 10 kV cm-1 also affects the viability of bacterial cells39,40. We hypothesize
that spore coat will be pored or ruptured at high pulsed electrical fields (20-80 kV
cm-1). Damage to be spore coat causes inactivation and release of DPA. We
hypothesize that method is effective in releasing all the DPA in an endospore
population. Therefore, we can determine the total number of spores as a baseline for
413
assessing viability ratio.
A micro-electroporation flow-through unit can readily be implemented in a
microfluidic chip by placing electrodes at the bottom of microchannels perpendicular
to the fluid flow. The electrode structure consists of interdigitated gold electrodes with
a saw tooth structure to enhance the electric field structure gradient. The microdevice
can be operated at more advantageous conditions than conventional systems: small
voltages and power consumptions, continuous flow, small sample volume, and
negligible heating. By shrinking the inter-electrode distance to a few tens of microns,
it is possible to reduce the voltage requirement to a few volts (three orders of
magnitude smaller than typical voltages required in a macroscopic apparatus).
Consequently, the power consumption becomes six orders of magnitude smaller and
heat generation is minimal. A micro-electroporation device will be designed to lyze
endospores to determine the total DPA present. The electroporation unit can easily be
integrated with other microfluidic devices.
(3) Excitation and Emission
A 4-LED array provides excitation light at selectable wavelengths (280 nm, 320 nm,
470 nm, 530 nm) with half bandwidths lying between 12 and 36 nm. These 4
wavelengths are suitable for exciting DPA, SYPRO Rose Plus, SYTO-9 and
propidium iodide, respectively. A microcontroller (BASIC Stamp II, Parallax, Rocklin,

414
CA) receives commands sent from the host PC through the COM port, then interprets
the commands and controls a specific LED to turn on or turn off via MOSFET logic
switches. Only one LED that provides maximum emission light is turned on. The
LED array will be placed close to the microchannel (at a distance of <1 mm). This
simple arrangement and ready coupling to a receiver fiber without additional optics
makes for a very rugged and robust fluorescence detector with excellent sensitivity
and little need for monochromators to reject the excitation light from the emitted light.
A CCD spectrometer detector will provide a fluorescence spectrum for terbium,
SYPRO Rose Plus, SYTO-9 and propidium iodide detection. Time-gated circuit will
be developed for the fluorescence output of terbium and europium. The LEDs with be
coupled to the LabVIEW program that controls the detectors. For ATP measurement, a
miniature photomultiplier tube powered with a voltage of -950 V will be mounted to
the microfluidic channel. Bioluminescence light is collected by a 20x objective. No
filter is used in the optical path. A JFET operational amplifier is used to further
amplify and offset the signal and filter the high-frequency noise of the signal from
PMT. The PMT current is converted and amplified into a voltage by a
picoamperiometer.
(4) Tb-DPA luminescence assay
There is a universal constitute of bacterial spores: dipicolinic acid (DPA). DPA
415
constitutes %5-15% of the total mass of the spores. Detection of DPA based on the
terbium enhanced fluorescence provides a promising low-cost detection method for
bacterial spores. DPA can be easily extracted from the spores by treatment with low
concentrations of surfactants such as dodecylamine. The dipicolinate ion rapidly
chelates various rare earth metals. In particular, the weak native fluorescence of
terbium (Tb) (λex,max = 271, 279 nm) is enhanced more than 20,000 times upon
complexation with DPA. In addition, the already long fluorescence lifetime of Tb (III)
is further extended upon complexation (Tb(DPA)n3-2n, n = 1-3 τ = 0.6 – 2.0 ms). This
permits a time-gated fluorescence detection method, which greatly enhances
sensitivity and also improves selectivity over common fluorescent compounds that
exhibit much shorter fluorescence lifetimes in the ns range. The signals from scattered
lights and short-lived fluorescence from common interferences are excluded.
Without the gated approach, the weak signal of interested is always buried in the
signals from scattered lights and short-lived fluorescence. Similar to the scenario
when we attempt to see stars in daylight; it is nearly impossible to discriminate
between the lights from stars and the light from the sun. Gated detection is like the
same observation conducted at night. Without the strong background, the weak signals
can readily be observed. This points the way toward an exceptionally sensitive way of
fluorescence detection.

416
(5) Firefly luciferin-luciferase bioluminescence assay
Adenosine 5’triphosphate (ATP) is the primary source of chemical energy and a
ubiquitous energy currency in all living organisms. The use of a firefly (Photuris
pyralis) enzyme to quantify ATP in biological systems was first proposed by McElroy
in the 1940s41,42. The detection is based on the conversion of chemical energy to light
energy during the breakdown of ATP. Firefly luciferase catalyzes the ATP-dependent
oxidative decarboxylation of luciferin in the presence of oxygen and magnesium ions
into AMP and light. One photon of light is produced per molecule of ATP hydrolyzed
when ATP is the limiting component in the reaction43. Measurement of ATP is a
direct indication of cellular metabolism and is often reckoned as a metric for
viability44,45. To detect ATP in endospores, first of all, non-microbial ATP is
eliminated from the sample using somatic cell releasing agent (Figure 10.7). Bacterial
cells are then disrupted using chemicals such as benzalkonium chloride. The ATP
released is quantified using the luciferin-luciferase reaction. Hattori et al. have
achieved a detection limit of 7.7 cfu mL-1 using vegetative cells of Bacillus subtilis46.
Promega Corporation also reported a detection limit of 10 cfu mL-1 of vegetative
Bacillus cereus.
Challenges are encountered in the detection of spores using the
luciferin/luciferase system. While a vegetative bacterium contains approximately 10-17
417
mole of ATP per cell47, dormant spores of a number of Bacillus species have no
detectable biosynthetic or metabolic activity and contain low levels of ATP48-50.
Kodaka et al. reported that a spore contains about 10-21 mole ATP per cell, 4 orders of
magnitude lower than that of a vegetative bacterium51. Nevertheless, within the first
minute of germination, the large depot of 3-phosphoglyceric acid is catabolized into
ATP52. In additional to this, coat porosity increases after the onset of germination,
which permits easy extraction of intracellular ATP53.
(6) SYPRO Rose Plus staining
There is rapid protein degradation of dormant spore protein in the first minutes of
spore germination. 15%-20% of the dormant spore protein is degraded within 20 min
of the onset of germination. In Bacillus, the degradation products are free amino acids,
at least 17 of which are generated. The spore proteins degraded in this early process
are a group of up to eight low-molecular weight (6000-11000), acid-soluble proteins
located in the spore core.
SYPRO Rose Plus is a europium dye that has a high affinity with proteins.
Proteins stained with SYPRO Rose Plus dye have a broad excitation peak at ~350 nm
and a luminescence emission maximum at ~610 nm. Europium, another lanthanide
element, has a long luminescence emission lifetime, which allows time-resolved
measurements that greatly minimize interference from background fluorescence.

418
Initially, the non-porous spore coat will prevent proteins from binding to the dye. As
spore is germinating, its coat is becoming more porous and thus the dye can have
access to the proteins inside. The spore proteins are, however, under rapid degradation
at the same time and therefore a subsequent decrease in fluorescence intensity will be
expected. This characteristic initial increase following by a decrease in fluorescence
intensity is a good indication of germination.
(7) BacLight live/dead viability staining
Owing to their tough protein coats made of peptidoglycan and keratin, endospores are
highly resistant to normal staining procedures. During germination, spore coat
becomes more porous and hence the endospore becomes stainable by conventional
DNA-intercalating dyes. Both SYTO-9 and propidium iodide have high affinity
towards nucleic acid. SYTO-9 binds all types of cells whereas propidium iodide is
only permeable to compromised cell membrane, i.e., dead cells. The ratio of green
and red emission provides information on the viability of germinating spores.
Integrated fluorescence emission intensities of the green (510-540 nm) and red
(620-650 nm) are acquired and the green/red fluorescence ratio is calculated for the
viability ratio.
10.2.4 Expected results
419
Coupling spectroscopy and microfluidics is a powerful tool for elucidating the
behavior of viable endospores because one has the ability to work with smaller
reagent volumes, shorter reaction times, and greater sensitivity with high throughput.
The use of light-emitting diodes, advances in miniaturization and spectrometer design
has direct relevance to bacterial spore detection in food hygiene and sterility control,
as well as great implications in life detection missions.
The current detection limit for DPA using Tb-DPA luminescence assay in quartz
cuvettes with a fluorimeter is 1000 spores mL-1. Since the typical size of an elastomer
microfluidic channel is on the order of 50-250 µm wide by 10-20 µm deep, the
absorption path length is quite small compared to more conventional cuvette-based
absorption spectrometers with interaction lengths 100-1000 times larger. According to
the Beer-Lambert Law, the absorbance A is proportional to the concentration of the
absorbing material c and the absorption path length l, so that
A = εcl,
where ε is the molar absorptivity. Coupled with time gating, we expect to at least
improve the limit of detection down by 2 orders of magnitude down to 10 spores mL-1.
Similarly, detection of extracellular proteins using SYPRO Rose Plus can take
advantage of time gating and microfluidics architecture to improve the current
detection limit. ATP bioluminescence and live/dead viability staining also benefit
420
from the microfluidics platform by the same token. It can be validated using
endospores of Bacillus atrophaeus with direct on-chip lysis and germination. The
dynamic range is expected to be over 6 orders of magnitude for ATP, with a detection
limit down to 100 cells mL-1.
A major hurdle for in situ investigations of biomarkers is the availability of
robust and flexible sample-handling systems. Most measurements for biosignatures
require that the sample be pretreated in some fashion. Our device also enables in situ
measurement of endospore germination in the field. In particular, the device can be
augmented with air or water samplers for automated sampling and downstream
processing and analysis. A wide range of flexibility is associated with this device. The
analysis component is customizable and readily amenable to detecting other types of
bacteria. It can, in the near future, be incorporated as part of the life detection
missions.
Most of the electroporation microdevice research performed so far has focused
on analyzing and understanding the electroporation process itself. Integrating
electroporation and subsequent analysis of the cell content is still at its early stage of
development. This proposal will provide insight on the progressive integration of
electroporation, separation and analysis of bacterial cells in the near future and is
expected to add further value to the concept of the microfluidic chip.

421
Electroporation has started to be used in the food processing industry for the
pasteurization of liquid foods. The idea is to use pulsed electric field to cause
irreversible poration of bacteria and thus rendering them inactive. Reports can be
found on electroporation of mammalian and vegetative bacterial cells, but not much
on endospores. A side study of this proposal will focus on developing a model on
endospore electroporation. It will shed light on assessing and predicting sterilization
efficiency of electroporation.
10.2.5 Conclusion
Spore germination is a process whereby spores change from dormancy to a
metabolically active state. The process of spore germination involves a rapid sequence
of events in which the structure of the spore is degraded. It is through germination and
subsequent outgrowth that spores cause food spoilage and potential toxin formation,
which may ultimately lead to foodborne disease. Furthermore, because resistance
properties of spores are concomitantly lost, the mechanism of germination may hold
clues to more efficient methods for spore inactivation. Therefore, apart from being
scientifically interesting, the process of spore germination is of great importance from
an applied perspective.
We have presented applications of time-resolved fluorescence imaging to study
422
bioluminescence and mixing within microfluidic devices. We have demonstrated the
potential to implement these techniques in conventional wide-field imaging systems.
This coupled with the flexibility of soft lithography. Here, we have described one
such geometry, which satisfies some of the requirements of an integrated
measurement system, in which intelligent analysis of microscopic fluid volumes can
be undertaken. We believe that this approach, when optimized sensor arrays are used,
can offer similar performance to commercially available spectrophotometers with the
opportunity of optically monitoring many fluidic channels at the same time. It shows
promise toward the definition of a spectroscopic laboratory on a chip in which either
absorption or fluorescence can be measured.
10.3 References
1. Cohn, F. Untersuchungen uber Bacterien. IV. Beitrage zur Biologie der Bacillen. Beitr. Biol. Pflanz. 2, 249-276 (1876).
2. Koch, R. Untersuchungen uber Bakterien V. Die Atiologie der Milzbrandkrankheit, begrundet auf die Entwicklungsgeschichte des Bacillus anthracis. Beitr. Biol. Pflanz. 2, 277-310 (1876).
3. Koch, R. Untersuchungen uber Bakterien VI. Verfahren zur Untersuchung, zum Conservieren und Photographieren. Beitr. Biol. Pflanz. 2, 399-434 (1877).
4. Tyndall, J. Further researches on the department and vital persistence of putrefactive and infective organisms from a a physical point of view. Phil. Trans. Royal Soc. 167, 149-206 (1877).
5. Anonymous. NASA standard procedures for the microbiological examination of space hardware, NHB 5340.1D. Jet Propulsion Laboratory Communication, National Aeronautics and Space Administration (1980).
6. Tahernia, A.C. Treatment of anthrax in children. Archives of disease in childhood 42, 181-182 (1967).
7. Powell, J.F. Isolation of dipicolinic acid (pyridine-2-6-dicarboxylic acid) from spores of Bacillus megaterium. Biochem. J. 54, 210-211 (1953).
8. Bruch, C.W. Levels of sterility: probabilities of survivors vs. biological indicators. Bull Parenter Drug Association (1974).
9. Hindle, A.A., Hall, E. A. H. Dipicolinic acid (DPA) assay revisited and appraised for spore detection. Analyst 124, 1599-1604 (1999).
423
10. Pellegrino, P.M., Fell, N.F., Rosen, D.L., and Gillespie, J.B. Bacterial endospore detection using terbium dipicolinate photoluminescence in the presence of chemical and biological materials. Anal. Chem. 70, 1755-1760 (1998).
11. Rosen, D.L. Bacterial endospore detection using photoluminescence from terbium dipicolinate. Reviews in Analytical Chemistry 18, 1-21 (1999).
12. Sacks, L.E. Chemical germination of native and cation-exchanged bacterial-spores with trifluoperazine. Appl. Environ. Microbiol. 56, 1185-1187 (1990).
13. Shafaat, H.S. and Ponce, A. Applications of a rapid endospore viability assay for monitoring UV inactivation and characterizing Arctic ice cores. Appl. Environ. Microbiol. 72, 6808-6814 (2006).
14. Cable, M.L., Kirby, J.P., Sorasaenee, K., Gray, H.B., and Ponce, A. Bacterial spore detection by [Tb3+(macrocycle)(dipicolinate)] luminescence. Journal of the American Chemical Society 129, 1474-1475 (2007).
15. Yung, P.T., Lester, E.D., Bearman, G., and Ponce, A. An automated front-end monitor for anthrax surveillance systems based on the rapid detection of airborne endospores. Biotechnology and Bioengineering 98, 864-871 (2007).
16. Yung, P.T., Kempf, M.J., and Ponce, A., presented at the IEEE Aerospace Conference, Big Sky, Montana, 2006 (unpublished).
17. Yung, P.T. and Ponce, A. Rapid sterilization assessment by monitoring inactivation of germinable Bacillus endospores. Nature Methods (submitted) (2008).
18. Horrocks Jr., W.D. and Sudnick, D. Lanthanide ion luminescence probes of the structure of biological macromolecules. Accounts of Chemical Research 14, 384-392 (1981).
19. Sinha, S., Systematics and the Properties of the Lanthanides. (NATO ASI Series 109, 1983).
20. Balzani, V. Supramolecular photochemistry. Pure Appl. Chem. 62, 1099-1102 (1990). 21. Sabbatini, N., Guardigli, M., and Lehn, J.M. Luminescent lanthanide complexes as
photochemical supramolecular devices. Coord. Chem. Rev. 123, 201-228 (1993). 22. Lakowicz, J.R., Principles of Fluorescence Spectroscopy. (Plenum, New York, 1983). 23. Hashimoto, T., Frieben, W.R., and Conti, S.F. Germination of single bacterial spores.
Journal of Bacteriology 98, 1011-1020 (1969). 24. Hashimoto, T., Frieben, W.R., and Conti, S.F. Microgermination of Bacillus cereus
spores. Journal of Bacteriology 100, 1385-1392 (1969). 25. Margulis, L. et al. The Viking mission: Implications for life on Mars. Journal of
Molecular Evolution 14, 223-232 (1979). 26. McKay, C.P. et al. Temperature and moisture conditions for life in the extreme arid
region of the Atacama Desert: Four years of observations including the El Nino of 1997-1998. Astrobiology 3, 393-406 (2003).
27. Doran, P.T. Formation and character of an ancient 19-m ice cover and underlying trapped brine in an "ice-sealed" east Antarctic lake. Proceedings of the National Academy of Sciences of the United States of America 100, 26 (2003).
28. Navarro-Gonzalez, R. et al. Mars-like soils in the Atacama Desert, Chile, and the dry limit of microbial life. Science 302, 1018-1021 (2003).
29. Yung, P.T., Shafaat, H.S., Connon, S.A., and Ponce, A. Quantification of viable endospores from a Greenland ice core. FEMS Microbiology Ecology 59, 300-306 (2007).
30. Foegeding, P. and Busta, F. Bacterial spore injury - an update. Journal of Food Protection 44 (1981).
31. Hideharu, S. Importance of considering injured microorganisms in sterilization validation. Biocontrol Science 11 (2003).
32. Setlow, P., in Bacterial Stress Response, edited by G. Storz, Hengge-Aronis, R. (ASM Press, Washington, D.C., 2000), pp. 217-230.
33. Rogers, J.V. et al. Decontamination assessment of Bacillus anthracis, Bacillus subtilis, and Geobacillus stearothermophilus spores on indoor surfaces using a hydrogen peroxide gas generator. Journal of Applied Microbiology 99, 739-748 (2005).
34. Setlow, P. Spore germination. Current Opinion in Microbiology 6, 550-556 (2003). 35. Gould, G.W. and Hurst, A., The Bacterial Spore. (Academic Press, New York, 1969).
424
36. Hills, G.M. Chemical factors in the germination of spore-bearing aerobes - the effects of amino acids on the germination of Bacillus anthracis, with some observations on the relation of optical form to biological activity. Biochemical Journal 45, 363-370 (1949).
37. Hills, G.M. Chemical factors in the germination of spore-bearing aerobes - the effect of yeast extract on the germination of Bacillus anthracis and its replacement by adenosine. Biochemical Journal 45, 353-362 (1949).
38. Hills, G.M. Chemical factors in the germination of spore-bearing aerobes - observations on the influence of species, strain and conditions of growth. Journal of General Microbiology 4, 38-47 (1950).
39. Zhang, Q., Barbosa-Cánovas, G.V., and Swanson, B.G. Engineering aspects of pulsed electric field pasteurization. Journal of Food Engineering 25, 261-281 (1995).
40. Castro, A.J., Barbosa-Cánovas, G.V., and Swanson, B.G. Microbial inactivation of foods by pulsed electric fields. Journal of Food Processing and Preservation 17, 47-73 (1993).
41. McElroy, W.D. The energy source for bioluminescence in an isolated system. PNAS 33, 342-345 (1947).
42. McElroy, W.D. Factors influencing the response of the bioluminescent reaction to ATP. Archives of Biochemistry 22, 420 (1949).
43. Karl, D.D.M. Cellular nucleotide measurements and applications in microbial ecology. Microbiological reviews 44, 739-796 (1980).
44. Chappelle, E.W. and Levin, G.V. Use of the firefly bioluminescence reaction for rapid detection and counting of bacteria. Biochem. Med 2, 41-52 (1968).
45. Thore, A.A., Ansehn, S.S., Lundin, A.A., and Bergman, S.S. Detection of bacteriuria by luciferase assay of adenosine triphosphate. Journal of clinical microbiology 1, 1-8 (1975).
46. Hattori, N.N. et al. Enhanced microbial biomass assay using mutant luciferase resistant to benzalkonium chloride. Analytical biochemistry 319, 287-295 (2003).
47. Philip, E.S. A review of bioluminescent ATP techniques in rapid microbiology. Journal of Bioluminescence and Chemiluminescence 4, 375-380 (1989).
48. Church, B.D. and Halvorson, H. Intermediate metabolism of aerobic spores: I. Activation of glucose oxidation in spores of Bacillus cereus var terminalis. Journal of Bacteriology 73, 470-476 (1957).
49. Setlow, P. and Kornberg, A. Biochemical studies of bacterial sporulation and germination. XXII. Energy metabolism in early stages of germination of Bacillus megaterium spores. Journal of Biological Chemistry 245, 3637-3644 (1970).
50. Setlow, P. and Kornberg, A. Biochemical studies of bacterial sporulation and germination. XXIII. Nucleotide metabolism during spore germination. Journal of Biological Chemistry 245, 3645-3652 (1970).
51. Kodaka, H., Fukuda, K., Mizuochi, S., and Horigome, K. Adenosine triphosphate content of microorganisms related with food spoilage. Japanese Journal of Food Microbiology 13, 29-34 (1996).
52. Singh, R.P., Setlow, B., and Setlow, P. Levels of small molecules and enzymes in the mother cell compartment and the forespore of sporulating Bacillus megaterium. Journal of Bacteriology 130, 1130-1138 (1977).
53. Santo, L.Y. and Doi, R.H. Ultrastructural analysis during germination and outgrowth of Bacillus subtilis spores. Journal of Bacteriology 120, 475-481 (1974).
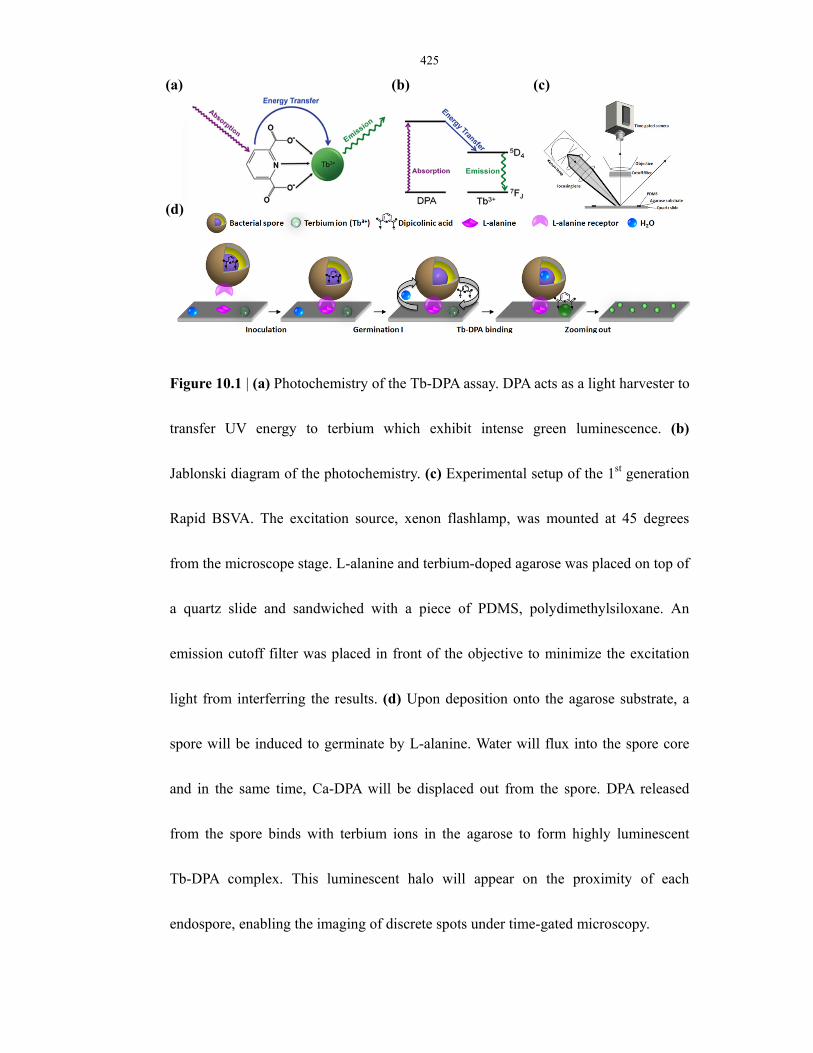
425
Figure 10.1 | (a) Photochemistry of the Tb-DPA assay. DPA acts as a light harvester to
transfer UV energy to terbium which exhibit intense green luminescence. (b)
Jablonski diagram of the photochemistry. (c) Experimental setup of the 1st generation
Rapid BSVA. The excitation source, xenon flashlamp, was mounted at 45 degrees
from the microscope stage. L-alanine and terbium-doped agarose was placed on top of
a quartz slide and sandwiched with a piece of PDMS, polydimethylsiloxane. An
emission cutoff filter was placed in front of the objective to minimize the excitation
light from interferring the results. (d) Upon deposition onto the agarose substrate, a
spore will be induced to germinate by L-alanine. Water will flux into the spore core
and in the same time, Ca-DPA will be displaced out from the spore. DPA released
from the spore binds with terbium ions in the agarose to form highly luminescent
Tb-DPA complex. This luminescent halo will appear on the proximity of each
endospore, enabling the imaging of discrete spots under time-gated microscopy.
(a) (b) (c)
(d)
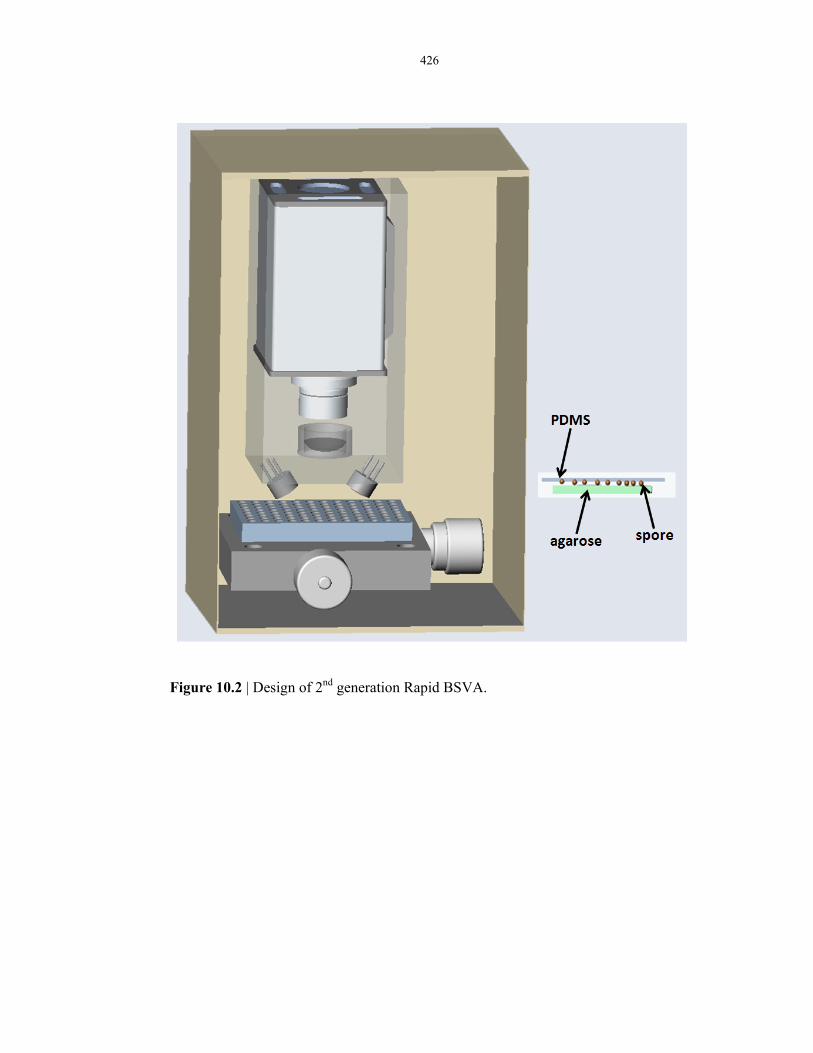
426
Figure 10.2 | Design of 2nd generation Rapid BSVA.
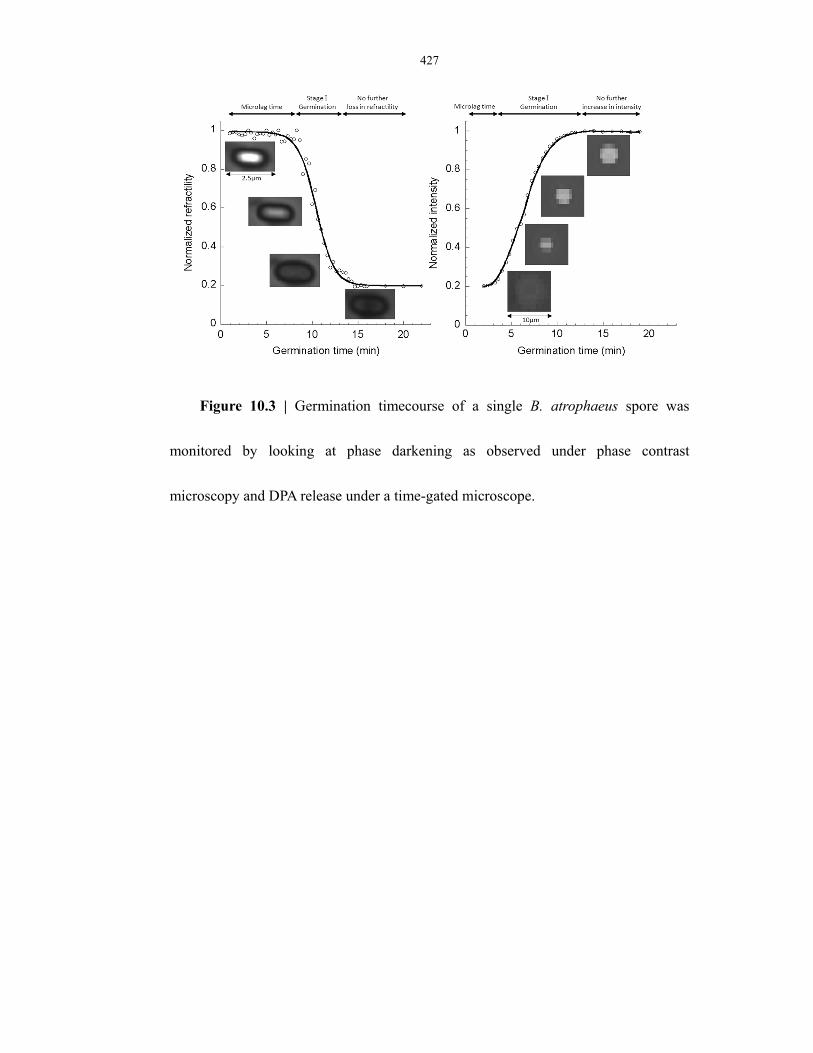
427
Figure 10.3 | Germination timecourse of a single B. atrophaeus spore was
monitored by looking at phase darkening as observed under phase contrast
microscopy and DPA release under a time-gated microscope.
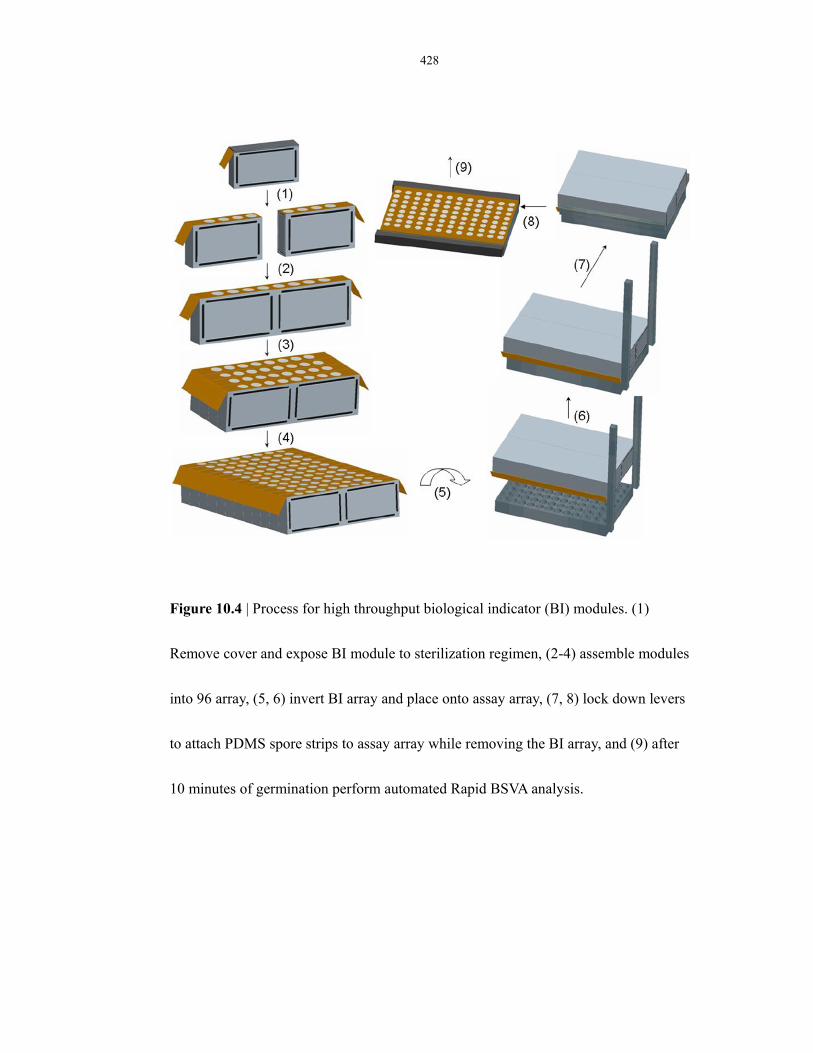
428
Figure 10.4 | Process for high throughput biological indicator (BI) modules. (1)
Remove cover and expose BI module to sterilization regimen, (2-4) assemble modules
into 96 array, (5, 6) invert BI array and place onto assay array, (7, 8) lock down levers
to attach PDMS spore strips to assay array while removing the BI array, and (9) after
10 minutes of germination perform automated Rapid BSVA analysis.
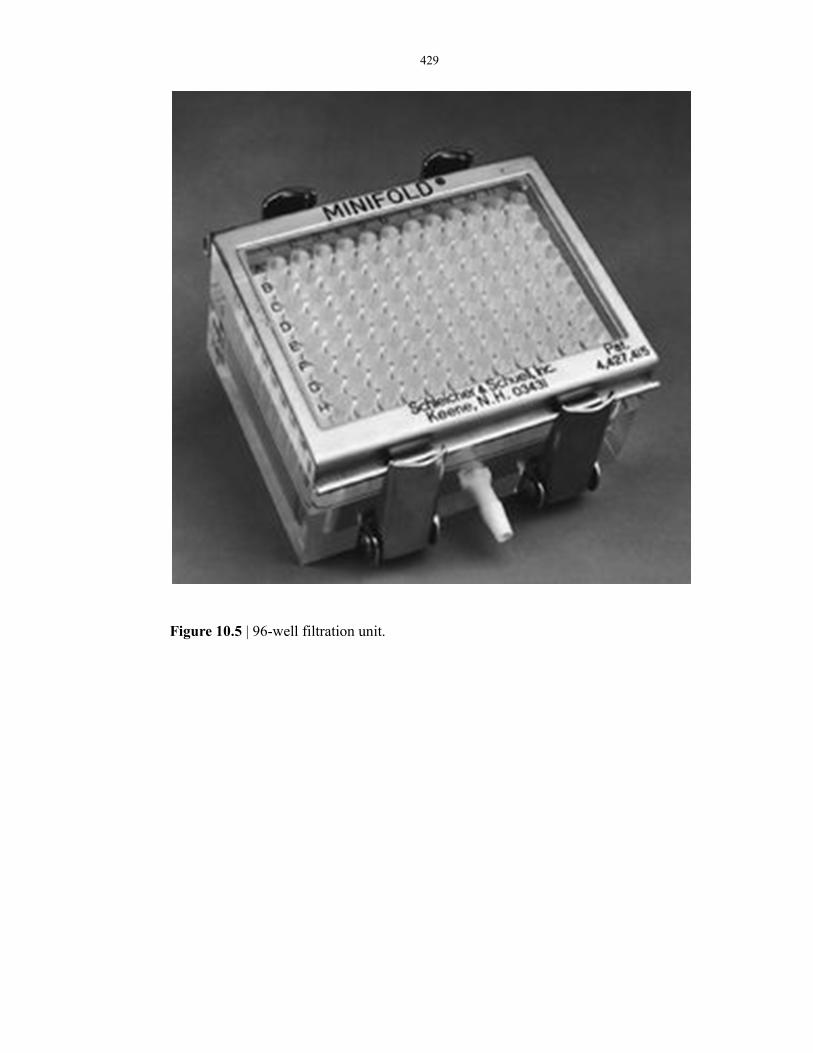
429
Figure 10.5 | 96-well filtration unit.
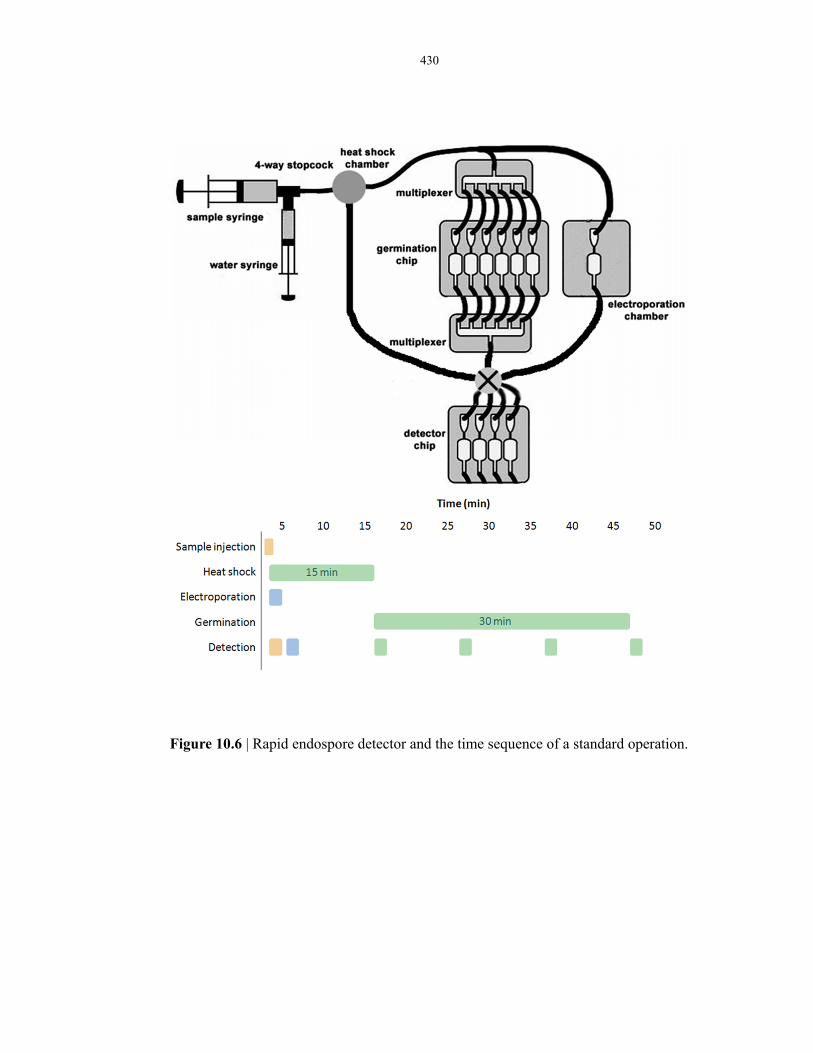
430
Figure 10.6 | Rapid endospore detector and the time sequence of a standard operation.

431
Figure 10.7 | Microfluidic schematic of the ATP luciferin-luciferase assay.