Embed Size (px)
Citation preview

ASPRS 2006 Annual Conference Reno, Nevada May 1-5, 2006
DETECTING GROUND SURFACE MOVEMENTS WITH DIFFERENTIAL INSAR TECHNIQUES
Yishuo Huang, Assistant Professor Cheng-Hsiu Lee, Graduate Student
Department of Construction Engineering Chaoyang University of Technology
Wufeng, Taiwan 413 [email protected]
ABSTRACT
Interferometric synthetic aperture radar, InSAR, is a technique to explore the ground truth of Earth. In general, synthetic aperture radar, SAR, primarily is designed for mapping the scattering properties of Earth’s surface. Many physical and geometric parameters of the imaged scene are recorded in SAR imagery. The ground truth of earth can be explored by extracting those parameters from SAR imagery. InSAR has been widely applied to generate the digital terrain model of an imaged area. The basic principle of InSAR is to measure the phase differences of at least two SAR images that are obtained at the same orbit position with two antennas or at different orbit positions with an antenna. Comparing the digital terrain models generated at different periods with InSAR technique provides a way to detect the ground surface movements in the imaged area, and this process is called differential InSAR, DInASR. This study tries to build up the ground surface movement model for north Taiwan with employing differential InSAR techniques. With differential interferometry, the area without ground surface movements will be canceled out. Those left areas can be used as an indicator to locate possible areas where ground surface movements will occur. The selected test areas do have landslide occurred according to the deformation monitoring of local government. This study employed ERS-2 radar images to build up the digital terrain model, and those areas with high possibility to have ground surface movements are located.
INTRODUCTION
Precisely detecting ground surface movement provides an initial indication for better understanding the phenomena of natural disasters. Natural disasters, like landslide, earthquake, and etc., causes lots of damage on the lives and properties of human beings, and if the ground surface movements can be recorded, it is possible for local government to provide the better strategies protecting people living in the disaster areas. There are many ways to detect ground surface movements, like GPS measurements, and, precise ground surface movement results are reported. However, the differential InSAR, DInSAR, provides another way to do this. In 1994, Alberti employed airborne TOPSAR to monitor Vesuvius Volcano, Italy, (Alberti, 1994). With comparing the digital terrain models generated at different periods with InSAR, the magma distribution paths were located, and a protection plan was proposed. Massonnet applied ERS-1 radar images to monitor the topographic changes after the eruption of Etna Volcano, Italy, (Massonnet, 1995). Strozzi employed differential InSAR to measure the elevation difference of Mexico, Mexico, (Strozzi, 1999). The area of Gardanne, France, is damaged with settlements caused by over-mining. With differential InSAR, Carnec successfully estimated the settlements, (Carnec, 2000). Differential InSAR technique demonstrates its capability of detecting ground surface movement with reasonable accuracy.
With DInSAR technique, those areas with ground surface movements can be identified, and, further, more sophisticated monitoring methods can be employed. The main idea of this paper is to assume that the ground surface movements are the sign for coming natural disasters. If the sign can be correctly interpreted, governments can adapt suitable strategies for public safety management. InSAR is a technique extending the applications of SAR imagery. Employing two SAR images collected at different positions with a same antenna to find image correspondences between two images is a key step for image registrations. Then, the amplitude and phase that are received from returned radar signal are calculated. With the interference of image registration results, the relative heights above the
ASPRS 2006 Annual Conference Reno, Nevada May 1-5, 2006
imaged surface is found. With the selected ground control points, the relative heights can be transformed to the topographic heights of the images areas. In doing so, the digital terrain model of the imaged area is generated. Eventually, the ground surface movements of imaged area are identified with comparing the digital terrain models generated with different SAR image pairs, (Gabriel, 1989; Massonnet, 1993; Zebker, 1994; Murakam, 1996; Hanssen, 2001).
The outline of the paper is as follows. In the next section, the basic principles of InSAR are briefly introduced. Also, DInSAR algorithm is illustrated. In the third section, the test area is chosen and some experiment results are shown. Finally, the discussions and future study are represented.
INSAR TECHNIQUE FOR GENERATING DTM Interference is a phenomenon of the linear superposition of two different waves. Wave is a way to transmit
energy. Two waves are overlapping such that the amplitudes of waves change. Interferometric SAR is a way to generating interference between two SAR images. For any radar imaging system, with measuring the traveling time of the transmitted and received signal, the distances between the satellite antenna and ground objects, SR , are described as follows,
2ct= SR -------------------------------------------------------------------------------------------------Eq. 1
where t is the signal traveling time, and c is the signal traveling speed, m/sec10×3 8≈ . The geometry of forming a SAR image is illustrated in the Figure 1. From the Figure 1, the satellite flight path is along the azimuth direction, and the signal is transmitted and received along the range direction. The topographic information of the imaged area is collected, when the satellite flies over the imaged area. InSAR applies two SAR images collected with two antennas at the same time or an antenna at different times. In general, there are three ways to generate InSAR; that are along-track, cross-track and repeat-pass. In this research, the repeat-pass model is employed. The repeat-pass is an approach employing two SAR images collected with an antenna at different times.
Figure 1. The geometry for forming a SAR image is presented, (Curlander, 1991).
In repeat-pass model, the base line between two positions when two SAR images were taken plays an important role. The base line should be short enough to make those two images have the same overlapped area. The topographic information will be slight different because different flight paths. With different paths, the phase difference between two satellite positions is given as follow. The geometry of InSAR is illustrated in Figure 2.

ASPRS 2006 Annual Conference Reno, Nevada May 1-5, 2006
RRR Δ=−=λπ
λπφ 4)(4
12 ------------------------------------------------------------------------Eq. 2
In eq.2, the λ represent the wavelength of microwave emitted and received from satellites. Hanssen introduced the relation between the phase difference,
Pφ , and ground height difference, (Hanssen, 2001). The relation is shown as follows.
⎥⎦
⎤⎢⎣
⎡−−−= ⊥
PP
PPPP H
RB
DB 01
0,0
sin)sin(4
θαθ
λπφ ------------------------------------------------Eq. 3
The PH shown in the Eq.3 is the specific topography height relative to the reference surface. The 0Pθ in the Eq.3 is the
initial look angle between satellite, reference surface and a specific height above the reference surface. In Eq.3, the PD is the surface displacement relative to the reference body, too. The DTM of an imaged area generated with InSAR algorithm needs several steps to accomplish.
Figure 2. The geometry of InSAR shows the geometric relation between satellites and ground objects. There are several steps to generate the DTM of an imaged area with InSAR technique. Those steps are image
registration, generating interferogram, phase unwrapping, geo-coding, and generating DTM. The whole processing algorithm is illustrated in Figure 3. A pair of SAR images is selected; one is chosen as the master image, and the other one is the slave image. Two SAR images should have their Doppler central frequencies close to generate interferogram. If the Doppler central frequencies of two SAR image is too far away, the interferogram of imaged area cannot be established. Then, the image co-registration, locating the pixel correspondences between the master image and the slave image, is employed. With the precise orbit information for the satellite flight path, the image co-registration can be efficiently implemented. If the pixels of the master SAR image and slave SAR image can be represented as jmmeM = and jsse S = respectively, the interference image, I, can be represented as follows
( )
( )s-mj
js-jm
*
mse seme
SM I
==
=----------------------------------------------------------------------------------------Eq. 4
where the ()* represents the complex conjugate. The phase of interference image is shown as follows
⎟⎟⎠
⎞⎜⎜⎝
⎛= −
I
II Re
Imtan 1φ -------------------------------------------------------------------------------------Eq. 5
Reference Body
HSat
Satellite Position at Orbit 2
P’
P
Hp
⊥B
0⊥B
θ∂
θ
B
RΔ
R2
R1

ASPRS 2006 Annual Conference Reno, Nevada May 1-5, 2006
where the IIm and
IRe are the imagery and real part of the interference image. In doing so, the Iφ will be limited in
the -� and �. Then, the constant that an integer multiplies 2�is added such that Iφ can be fully transformed as a
continuous phase to represent the relative topography information of the imaged area. Several ground control points are employed to transform the relatively topographic information to absolutely topographic information.
Figure 3. The algorithm of generating the DTM of imaged area with InSAR is shown.
DInSAR FOR GROUND SURFACE MOVEMENT
The ground surface movements can be identified with comparing the digital terrain models generated at different periods with InSAR. The DTM represent the topographic information of an imaged area. If the area without ground surface movement, the topographic information will be canceled out when another one subtracts one DTM. Zebker proposed a three-pass differential interferogram in 1994, (Zebker, 1994). The method makes the assumption that the interferogram generated with first SAR image pair does not contain any ground surface movement. The digital terrain model generated with second SAR image pair includes ground surface movements and topographic information. The information of ground surface movements can be extracted with subtracting one DTM with another. The whole process of three-pass differential interferogram is shown in Figure 4.
Figure 4. The three-pass differential interferogram is illustrated.
Slave-1 Master Slave-2
Topographic information
Topographic information +
Ground Surface Movement
Information for Ground Surface Movement

ASPRS 2006 Annual Conference Reno, Nevada May 1-5, 2006
EXPERIMENTS ON THE NORTH PART OF TAIWAN
This research uses ERS-2 SAR images to generate three-pass differential interferogram to identify those areas with ground surface movements. The image area is 100 Km × 100 Km, and is located at the intersection of the orbit number 461 and 3105. The relation between the geographic position of Taiwan and orbit number is illustrated in Figure 5. A SAR image is shown in Figure 6.
Figure 5. The relation of test area and the orbit number of satellite ERS2 is shown, (Wang, 2000).
Figure 6. The test area shown in the SAR image of satellite ERS-2 is presented.
ASPRS 2006 Annual Conference Reno, Nevada May 1-5, 2006
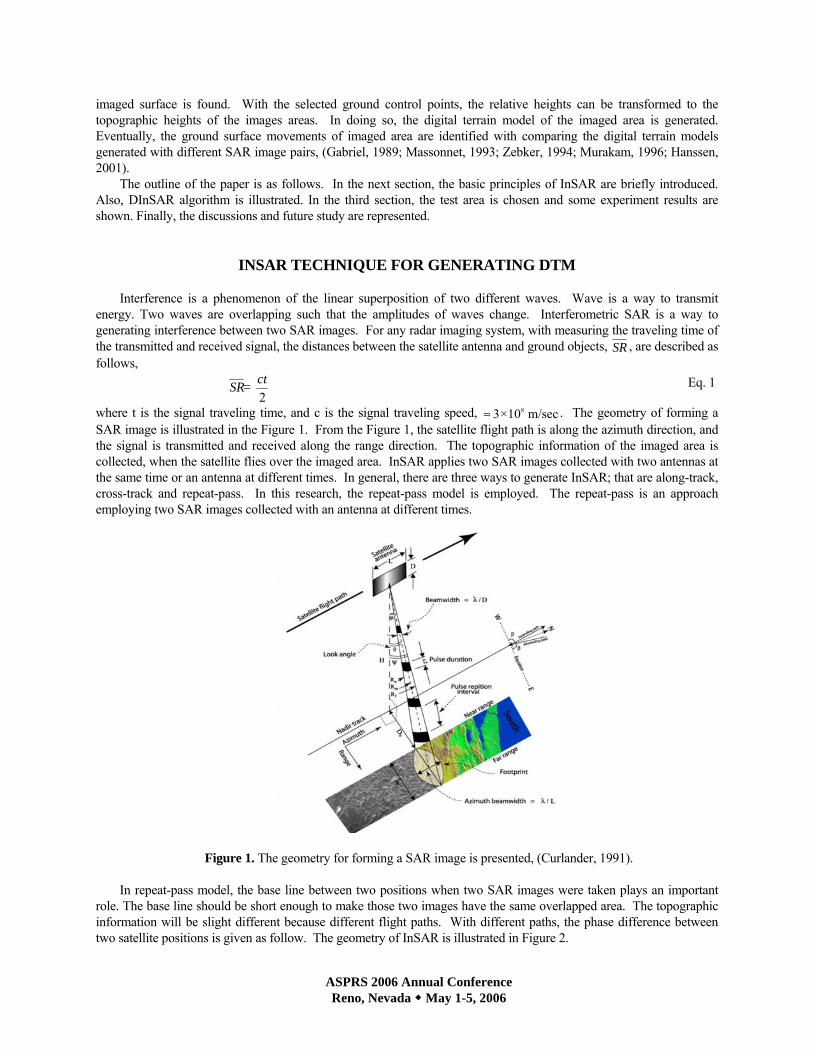
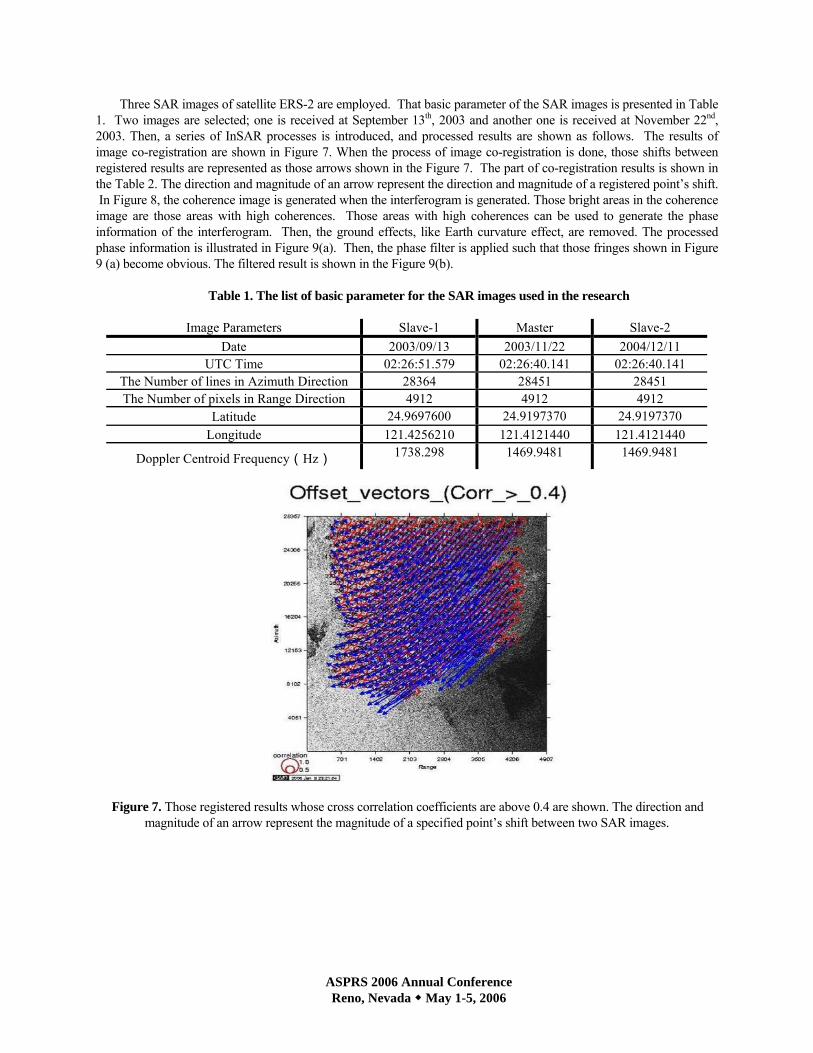
Three SAR images of satellite ERS-2 are employed. That basic parameter of the SAR images is presented in Table 1. Two images are selected; one is received at September 13th, 2003 and another one is received at November 22nd, 2003. Then, a series of InSAR processes is introduced, and processed results are shown as follows. The results of image co-registration are shown in Figure 7. When the process of image co-registration is done, those shifts between registered results are represented as those arrows shown in the Figure 7. The part of co-registration results is shown in the Table 2. The direction and magnitude of an arrow represent the direction and magnitude of a registered point’s shift. In Figure 8, the coherence image is generated when the interferogram is generated. Those bright areas in the coherence image are those areas with high coherences. Those areas with high coherences can be used to generate the phase information of the interferogram. Then, the ground effects, like Earth curvature effect, are removed. The processed phase information is illustrated in Figure 9(a). Then, the phase filter is applied such that those fringes shown in Figure 9 (a) become obvious. The filtered result is shown in the Figure 9(b).
Table 1. The list of basic parameter for the SAR images used in the research
Image Parameters Slave-1 Master Slave-2
Date 2003/09/13 2003/11/22 2004/12/11 UTC Time 02:26:51.579 02:26:40.141 02:26:40.141
The Number of lines in Azimuth Direction 28364 28451 28451 The Number of pixels in Range Direction 4912 4912 4912
Latitude 24.9697600 24.9197370 24.9197370 Longitude 121.4256210 121.4121440 121.4121440
Doppler Centroid Frequency(Hz) 1738.298 1469.9481 1469.9481
Figure 7. Those registered results whose cross correlation coefficients are above 0.4 are shown. The direction and magnitude of an arrow represent the magnitude of a specified point’s shift between two SAR images.
ASPRS 2006 Annual Conference Reno, Nevada May 1-5, 2006
Table 2. The list shows the shifts and correlation coefficients when image co-registration is done.
# Line Pixel Shift in Line Shift in Pixel Correlation Coefficient Error in Line Error in Pixel
122 6736 1081 1208.88 8.56 0.52 0.06 0.00
152 8256 2217 1209.62 9.00 0.65 0.03 -0.02
153 8256 2715 1209.88 9.19 0.56 -0.01 -0.03
. . . . . . . .
Figure 8. The coherence image is shown. Those bright areas in the image are those areas with high coherences.
ASPRS 2006 Annual Conference Reno, Nevada May 1-5, 2006
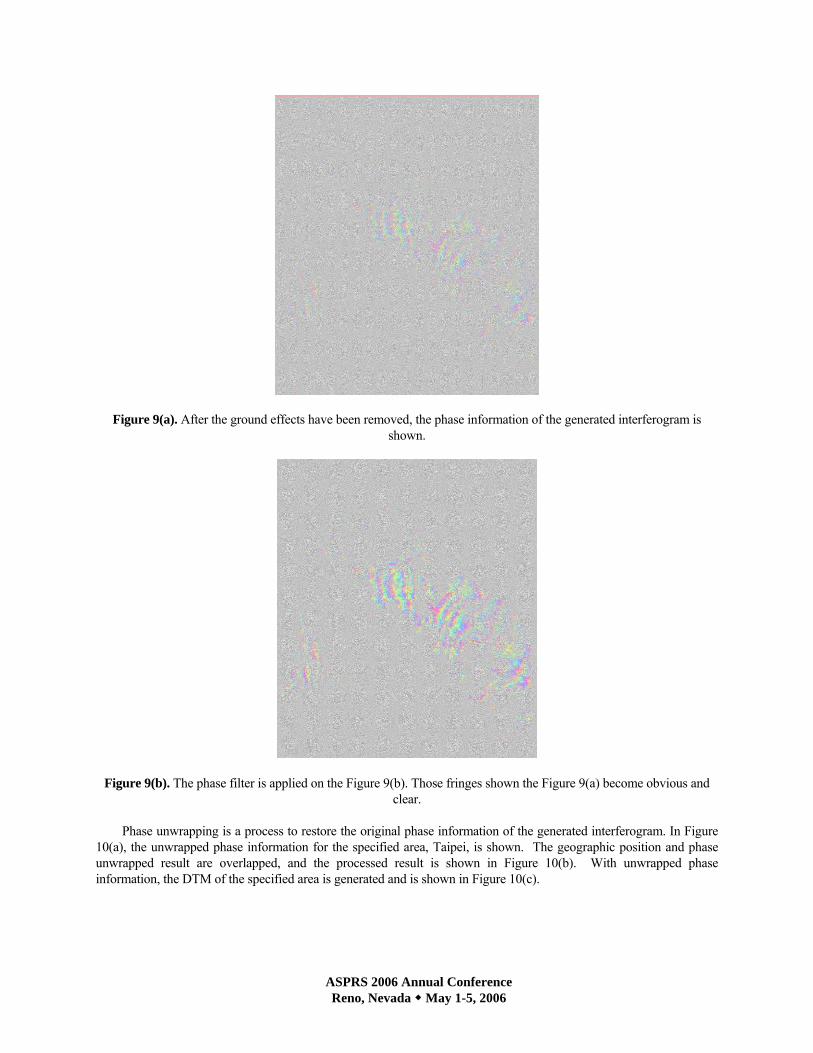
Figure 9(a). After the ground effects have been removed, the phase information of the generated interferogram is shown.
Figure 9(b). The phase filter is applied on the Figure 9(b). Those fringes shown the Figure 9(a) become obvious and clear.
Phase unwrapping is a process to restore the original phase information of the generated interferogram. In Figure
10(a), the unwrapped phase information for the specified area, Taipei, is shown. The geographic position and phase unwrapped result are overlapped, and the processed result is shown in Figure 10(b). With unwrapped phase information, the DTM of the specified area is generated and is shown in Figure 10(c).

ASPRS 2006 Annual Conference Reno, Nevada May 1-5, 2006
Figure 10(a). The result of phase unwrapped is shown. Figure 10(c). The DTM of the specified area shown in Figure 10(b) is shown.
Figure 10(b). The overlapped image of Figure 6 and Figure 10(a) is presented.
Eventually, the DInSAR is introduced to identify those possible areas with ground surface movements. The interferogram generated with the SAR image pair of slave-1 and master shown in the Table 1 is compared with the interferogram generated with the lave-2 and master SAR images. With the differential operation, the topographic information contained in the generated interferograms will be canceled out if the information is the same in the generated interefreograms. The processed results are illustrated in Figure 11.

ASPRS 2006 Annual Conference Reno, Nevada May 1-5, 2006
Figure 11. The possible areas with ground surface movements are identified with DInSAR.
ACKNOWLEDGEMENTS
Lots of the processed results shown in the paper are generated with Delft object-oriented radar interferometric
software, DORIS, developed Delft Institute of Earth Observation and Space System, Delft University of Technology. Some of the results presented in the paper are processed with Radar Tool, RAT, developed Computer Vision and Remote Sensing Group, Berlin University of Technology.
REFERENCES
Alberti, G.,Esposito, S., and Vetrella, S. (1994). The Vesuvius DEM: a test case for the TOPSAR system”, Proc. of the Final Workshop "MAC-Europe 1991".
Carne, C. and Delacourt, C. (2000). Three years of mining subsidence monitored by SAR interferometry, near Gardanne, France, Journal of Applied Geophysics, Vol. 43, pp43-54.
Gabriel, A.K., Goldstein, R. M., and Zebker, H. A. (1989). Mapping Small Elevation Changes over Large Areas: Differential Radar Interferometry, Journal of Geophysical Research, Vol.94, No.7, pp. 9183-9191.
Hanssen, R(2001). “Radar Interferometry:Data Interpretation and Error Analysis”, Kluwer Academic Publisher, Dordrecht, N.L.
Massonnet, D., Rossi, M., Carmona, C., Adragna, F., Peltzer, G., Fiegl, K., and Rabaute, T. (1993). “The Displacement Field of The Landers Earthquake Mapped By Radar Interferometry”, Nature, Vol. 364, pp. 138-142.
Massonnet, D., Briole,P., and Arnaud, A. (1995). Deflation of Mount Etna monitored by space borne radar interferometry, Letter To Nature, Vol. 375, pp. 567-570.
Murakam, M., Tobita, M., Fujiwara, S., Saito, T., and Masaharu, H. (1996). Coseismic crustal deformations of 1994 Northridge, California, earthquake detected by interferometric JERS 1 synthetic aperture radar, Journal of Geophysical Research, Vol. 101, No.4, pp. 8605-8614.
Strozzi, T., and Wegmuller, U. (1999). Land Subsidence in Mexico City Mapped by ERS Differential SAR Interferometry, IEEE Trans. Geosci. Remote Sensing, pp. 1940-1942.
Wang, X., Lia, L., Chan, G., and Chan, G. (2000). Employing differential InSAR to topographic change after an earthquake occurred, the 19th conference on surveying applications, pp. 741-750.
Zebker, H. A., Werner, C. L., Rosen, P. A., and Hensley, S. (1994). Accuracy of Topographic Maps Derived From ERS-1 Interferometric Radar, IEEE Transactions on Geoscience and Remote Sensing, Vol.32, No.4, pp. 823-836.