Embed Size (px)
Citation preview
Desktop Support MetricsWritten by Mike HansonData analysis by Jenny Rains
HDI Research Brief September 2013 | 1
SEPTEMBER 2013
At the beginning of my career as a desktop support manager I searched everywhere
for examples of industry-standard measurements for second-level support organi-
zations At that time my search was in vain because desktop support was in its
infancy There were plenty of metrics for help desks but nothing concrete for desktop support
teams or individuals
DESKTOP SUPPORT EDITION
Today Irsquom happy to report thatrsquos no longer the case The
support profession has matured and is now recognized
as an integral part of IT and the business There are
even organizations that specialize in measuring support
teams and there are now a number of common metrics
used across a variety of industries In this brief we
will focus on the metrics commonly used by desktop
support This data is based on the 2013 HDI Desktop Support Practices amp Salary Report From November
2012 through January 2013 HDI surveyed a cross-
section of more than thirty industries with the 978
respondents representing multinational organizations
that are either based in or provide support to end users
around the world
THE FOUNDATIONDepending on the size of an organization or the type
of business desktop support can mean different things
have different scopes or even have different names
(eg second-level support field services) For the
purposes of this paper desktop support refers to the
IT organization thatrsquos responsible for responding to
incidents questions and service requests that involve
desktop hardware software and operating systems
Theyrsquore also usually responsible for fulfilling service
requests related to desktop hardware and deploying or
updating software on a clientrsquos local workstation
Desktop support tickets are categorized as desktop
support based on the type of issue (64) the individual
assigned to handle the issue (45) and the manner
of resolution (17) Incident refers to a problem the
customer is having with hardware or software (ie
therersquos something broken that needs to be fixed)
Conversely service requests are scheduled events
If a customer needs a new computer or peripheral
or new or upgraded software then the service desk
would open a service request and desktop support
would schedule the work Forty-one percent of
organizations track these two ticket types separately
In these organizations on average 56 percent of tickets
are incidents and 42 percent are service requests
Thirty-five percent of organizations donrsquot differentiate
while the remaining 25 percent distinguish between
them but donrsquot track them separately
Desktop support organizations operate in almost
every industry serving a variety of business types and
supporting a range of client bases from very small to
very large Thus desktop support presents a unique
challenge Over the years certain metrics have bubbled
to the top as standards but the interpretation of those
metrics may not be as consistent as you might find in
a more structured environment like the service desk
Nonetheless a good baseline of organizational metrics
can help us manage our operations properly and
respond more effectively to the businessrsquos needs
THE METRICSDesktop support gets its work from a variety of sources
Depending on how large the organization is or how
mature the support teams are there may be multiple
avenues for work to make its way into the support
queue The support center is the primary channel with
46 percent of tickets assigned to desktop support
from there In some organizations customers are able
to contact desktop support directly via phone (22
of tickets) or email (14 of tickets) Web requests and
walk-upsdrive-bys constitute the remaining 17 percent
of tickets Regardless of intake channel there are some
metrics that are common across industries
56of organizations saw an increase in the number of tickets received by desktop support
Assigned by support center End user calls desktop support directly
463 223 144
102 0464OtherWalk-upsdrive-bysEnd user submits a web
request (ie does not involve the support center)
End user emails desktop support directly
Desktop Support Metrics
Percentage of tickets assigned to desktop support from each of the following channels
HDI Research Brief September 2013 | 2
VolumeFor forecasting purposes the most common metric is
volume or the number of incidents and service requests
(or both) assigned to the desktop support team This
is an important measure because it gives management
an idea of how much work is coming to the support
team and it allows them to staff the team appropriately
to deal with that incoming work Tracking this data
over time can provide historical perspective enabling
managers to identify certain times of the week month
or year that may require more resources In 2013 56
percent of organizations saw an increase in the number
of tickets received by desktop support
More than half of the organizations surveyed measure the
percentage of tickets handled by desktop support For
those organizations that separate incidents and service
requests 255 percent report that more than half of all
incidents are assigned to desktop support the median
is 25ndash30 percent The numbers are similar for service
requests with 305 percent reporting that more than half
are being by desktop support the median here is 41ndash45
percent As we might expect desktop support handles
more service requests than incidents This is even true
in organizations that donrsquot distinguish between the two
ticket types with 365 percent receiving more than half
of all tickets assigned (median = 41ndash45)
Volume is also important at the individual level as it
helps managers understand what individual desktop
support analysts can accomplish Almost 60 percent of
organizations surveyed measure the average number
of tickets resolved by a single technician in a month
In 21 percent of organizations analysts handle more
than 200 tickets each month but the median is 101ndash125
tickets per month
ResponsivenessResponsiveness is just as important as volume More than
half (53) of organizations measure responsiveness
which tells managers just how fast the support team
can get to a typical incident or request (not including
high-priority or urgent issues) This metric also helps
management understand how well the support team is
meeting customer expectations
The survey revealed that 48 percent of organizations
that measure responsiveness are able to respond to an
incident in an hour or less with the median response
time being 1ndash2 hours Service requests conversely donrsquot
follow a clear pattern with those response rates showing
a high degree of variability For example 159 percent of
organizations respond in 8ndash24 hours while 142 percent
get back to the client in 30ndash60 minutes (median = 2ndash4
of organizations report that desktop technicians handle more than 200 tickets each month
21
DESKTOP SUPPORT EDITION
HDI Research Brief September 2013 | 3
Desktop Support Metrics
hours) In organizations that donrsquot distinguish between
incidents and service requests 427 percent respond
in an hour or less 404 percent in 1ndash8 hours and the
remaining 138 percent in 8 hours or more (median = 1ndash2
hours) This variation is likely the result of the fact that
the definition of a service request is broader than that
of an incident The type of activity a service request
requires very much depends on the size and type of
organization whereas incidents are almost universally
considered to have priority
EfficiencyThere are a number of metrics that measure the
efficiency of the IT organization Some of these metrics
relate directly to desktop support while others focus on
the flow of incidents in and out of the support center
Depending on the complexity of an issue a support
ticket can move between several support groups before
being resolved to the clientrsquos satisfaction
In most organizations the service desk owns the issue
and determines who should be engaged to resolve the
problem Ideally the incident should be resolved by
the service desk because that gets the customer back
to work without delay and keeps costs down Some
organizations (34) actually track the incidents that
reach desktop support that should have been resolved
by the service desk (level 1)
For those that measure ticket types separately 32
percent of respondents reported that more than 20
percent of their incidents could and should have been
handled by the service desk Likewise 32 percent of
respondents indicated that more than 20 percent of
their service requests could and should have been level
1 issues In organizations that donrsquot distinguish between
incidents and service requests the number is higher
37 percent report that more than 20 percent of their
tickets should have been resolved before they reached
desktop support However the median for all three
groups is the same 11ndash15
of desktop support organizations measure average time to respond
53
of the tickets sent to desktop support should have been resolved by the service desk
11-15
Less than 1 hour
1 ndash 4 hours
4 ndash 8 hours
8 ndash 24 hours
1 ndash 2 days
3 ndash 5 days
More than 5 days
I donrsquot know
Less than 1 hour
1 ndash 4 hours
4 ndash 8 hours
8 ndash 24 hours
1 ndash 2 days
3 ndash 5 days
More than 5 days
I donrsquot know
INCIDENTS SERVICE REQUESTS
Percentage of organizations Percentage of organizations
89
89
207
186
181
169
198
194
152
152
84
63
13
0
76
72
68
64
107
119
115
115
214
136
167
157
184
213
81
38
64
68
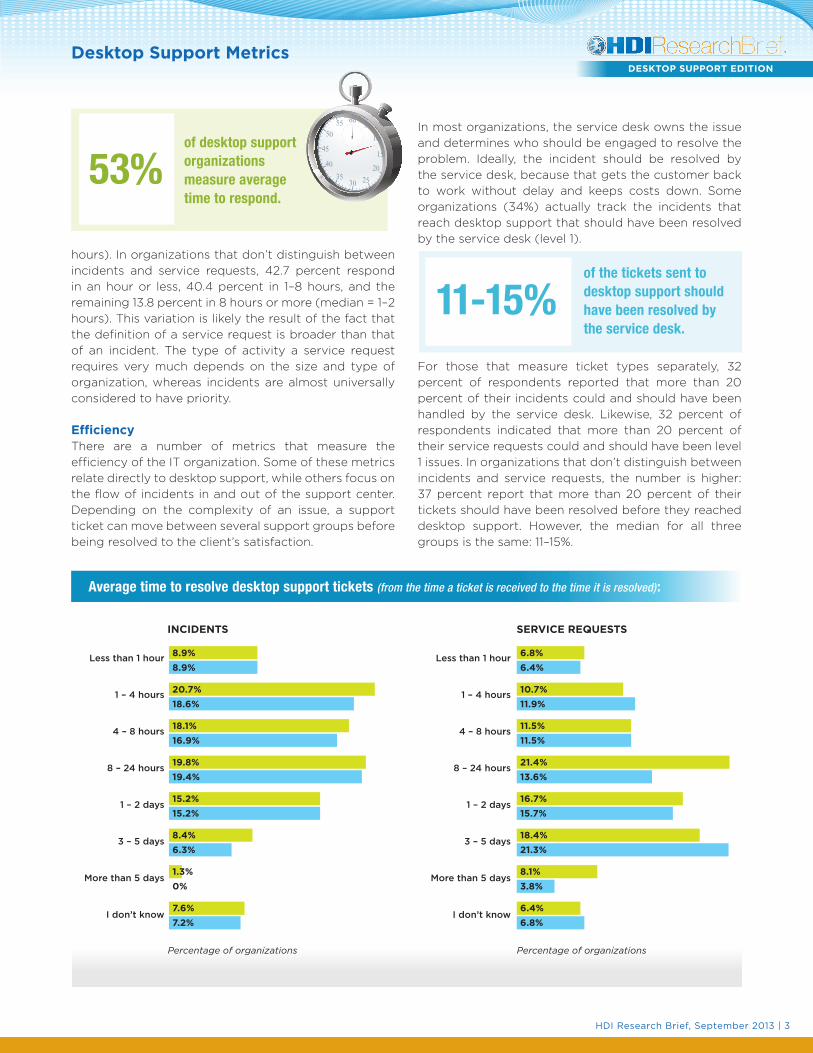
Average time to resolve desktop support tickets (from the time a ticket is received to the time it is resolved)
DESKTOP SUPPORT EDITION
HDI Research Brief September 2013 | 4
Desktop Support Metrics
Once an issue reaches desktop support it becomes
a question of how quickly and efficiently the desktop
support team can resolve the problem Of the
organizations surveyed 49 percent measure the
average time to resolve desktop support tickets
Predictably incidents are handled faster than service
requests since resolving a problem is not the same
as fulfilling a request Almost half of the respondents
(48) indicate that incidents are generally resolved
within one business day (8 hours) An additional 198
percent resolve incidents within 24 hours The remaining
respondents take 1ndash5 days or more
Service requests nearly always take longer with 214
percent taking 8ndash24 hours to resolve 167 percent
taking 1ndash2 days and 184 percent taking 3ndash5 days Only
29 percent are resolved in less than 8 hours Service
requests also impact those teams that combine their
tickets 175 percent of such requests are resolved in
8ndash24 hours while 183 percent take 1ndash2 days
Like the service desk the desktop support team may
also track how often a ticket is resolved on the first
attempt On the service desk this is usually called first
call resolution (FCR) For second-level support we swap
call for contact first contact resolution Regardless the
median for tickets resolved by the technician on the
first attempt is 70ndash80 percent
There are always circumstances that require desktop
support to engage other support teams which obviously
adds time to the duration of an incident For this reason
some teams also track ticket escalation Of the survey
respondents 39 percent say they measure this metric
and the median for escalations from desktop support to
other levels is 11ndash15 percent
However therersquos a clear difference between the amount
of time it takes to resolve an incident and the amount
of time or effort an analyst or technician puts into the
resolution of the incident Time to resolve is the duration
of the ticket how long it takes to reach a resolution
from the time the ticket is opened to the time itrsquos
closed Effort is the actual time the analysttechnician
spends working on the problem For example if an
issue requires a desktop computer to be reimaged the
entire reimage job may take several hours The actual
effort put in by the analysttechnician may be far less
(ie however long it takes to set up and kick off the
job) While that job is running the analysttechnician
can work on other tasks The effort measure represents
only the time they spent directly working on the issue
Whatrsquos surprising is how few organizations attempt to
measure effort Therersquos significant value in this metric
because it shows how much time the analysttechnician
is spending on core work It also allows managers to
gauge how much time and money specific types of
tickets require Of the organizations surveyed only 25
percent reported measuring effort For incidents 695
percent of organizations are spending 2 hours or less
on each ticket compared to the duration metric of 8
hours For service requests 62 percent of organizations
report that less than an hour of effort is typical In mixed
environments a little more than 50 percent show effort
of an hour or less
SatisfactionSupport organizations exist to resolve the customersrsquo
technical issues Most of the metrics noted above
objectively show how well desktop support is able to
handle its volume of work What they donrsquot speak to
the customerrsquos perception of desktop support Thatrsquos
where customer satisfaction metrics are valuable
Many organizations distribute customer surveys to get
feedback on individual and process performance Thirty-
five percent of the organizations surveyed have some
mechanism for capturing this information The survey
shows that 158 percent solicit feedback from a random
sampling of customers while almost 10 percent send
out surveys for all tickets The remaining respondents
collect data on a regular schedule
Very satisfied Satisfied
Neutral
Dissatisfied
Very dissatisfied
12
2652
31
Percentage of organizations
Average desktop support customer satisfaction rating
DESKTOP SUPPORT EDITION
HDI Research Brief September 2013 | 5
Desktop Support Metrics
For all available HDI Research Briefs visit wwwThinkHDIcomBePartOfTheCorner
Copyright copy 2013 UBM LLC All rights reserved
Sponsored by
By far email is the most common method for distributing
surveys (266) Customer-facing websites are the next
most common (131) followed by phone interoffice
mail postal mail and other methods
The good news is that across all industries 96 percent
of desktop support customers are either satisfied or
very satisfied just 32 percent of organizations have
customers who are dissatisfied or worse
ConclusionTherersquos an old saying that you canrsquot manage what you
canrsquot (or donrsquot) measure Thatrsquos very true in the world of
desktop support Effective metrics helps management
focus its attention on whatrsquos important They tell us
where wersquore going where wersquove been and how to
prepare for the future They allow us to set realistic
goals and they tell us when we achieve those goals
A meaningful program of metrics and measures is well
worth your time and energy
If yoursquore a desktop support professional I encourage
you to pick up a copy of the 2013 HDI Desktop Support Practices amp Salary Report It expands on the information
in this report and much much more
Median
Incidents Service Requests
Percentage of total tickets handled by desktop support 25-30 41-45
Average number of tickets resolved by one desktop support technician in a month 101-125
Average time to respond (includes only typical tickets not urgent or high-priority tickets)
1 - 2 hours 2 - 4 hours
Percentage of tickets sent to desktop support that could have been resolved by the support center (level 1)
11-15 11-15
Average time to resolve a desktop support ticket (from the time a ticket is received to the time it is resolved)
8 - 24 hours 8 - 24 hours
Percentage of tickets resolved by the technician on the first attempt 70-80 70-80
Percentage of tickets escalated to another department or level 11-15
Average amount of dedicated work time (effort) a desktop support technician spends on a ticket
1 - 2 hours 1 - 2 hours
Summary of desktop support metrics
Incidents Results for tickets for unplanned work required to fix something Service requests Results for tickets where nothing is broken but a service is needed
DESKTOP SUPPORT EDITION

Assigned by support center End user calls desktop support directly
463 223 144
102 0464OtherWalk-upsdrive-bysEnd user submits a web
request (ie does not involve the support center)
End user emails desktop support directly
Desktop Support Metrics
Percentage of tickets assigned to desktop support from each of the following channels
HDI Research Brief September 2013 | 2
VolumeFor forecasting purposes the most common metric is
volume or the number of incidents and service requests
(or both) assigned to the desktop support team This
is an important measure because it gives management
an idea of how much work is coming to the support
team and it allows them to staff the team appropriately
to deal with that incoming work Tracking this data
over time can provide historical perspective enabling
managers to identify certain times of the week month
or year that may require more resources In 2013 56
percent of organizations saw an increase in the number
of tickets received by desktop support
More than half of the organizations surveyed measure the
percentage of tickets handled by desktop support For
those organizations that separate incidents and service
requests 255 percent report that more than half of all
incidents are assigned to desktop support the median
is 25ndash30 percent The numbers are similar for service
requests with 305 percent reporting that more than half
are being by desktop support the median here is 41ndash45
percent As we might expect desktop support handles
more service requests than incidents This is even true
in organizations that donrsquot distinguish between the two
ticket types with 365 percent receiving more than half
of all tickets assigned (median = 41ndash45)
Volume is also important at the individual level as it
helps managers understand what individual desktop
support analysts can accomplish Almost 60 percent of
organizations surveyed measure the average number
of tickets resolved by a single technician in a month
In 21 percent of organizations analysts handle more
than 200 tickets each month but the median is 101ndash125
tickets per month
ResponsivenessResponsiveness is just as important as volume More than
half (53) of organizations measure responsiveness
which tells managers just how fast the support team
can get to a typical incident or request (not including
high-priority or urgent issues) This metric also helps
management understand how well the support team is
meeting customer expectations
The survey revealed that 48 percent of organizations
that measure responsiveness are able to respond to an
incident in an hour or less with the median response
time being 1ndash2 hours Service requests conversely donrsquot
follow a clear pattern with those response rates showing
a high degree of variability For example 159 percent of
organizations respond in 8ndash24 hours while 142 percent
get back to the client in 30ndash60 minutes (median = 2ndash4
of organizations report that desktop technicians handle more than 200 tickets each month
21
DESKTOP SUPPORT EDITION
HDI Research Brief September 2013 | 3
Desktop Support Metrics
hours) In organizations that donrsquot distinguish between
incidents and service requests 427 percent respond
in an hour or less 404 percent in 1ndash8 hours and the
remaining 138 percent in 8 hours or more (median = 1ndash2
hours) This variation is likely the result of the fact that
the definition of a service request is broader than that
of an incident The type of activity a service request
requires very much depends on the size and type of
organization whereas incidents are almost universally
considered to have priority
EfficiencyThere are a number of metrics that measure the
efficiency of the IT organization Some of these metrics
relate directly to desktop support while others focus on
the flow of incidents in and out of the support center
Depending on the complexity of an issue a support
ticket can move between several support groups before
being resolved to the clientrsquos satisfaction
In most organizations the service desk owns the issue
and determines who should be engaged to resolve the
problem Ideally the incident should be resolved by
the service desk because that gets the customer back
to work without delay and keeps costs down Some
organizations (34) actually track the incidents that
reach desktop support that should have been resolved
by the service desk (level 1)
For those that measure ticket types separately 32
percent of respondents reported that more than 20
percent of their incidents could and should have been
handled by the service desk Likewise 32 percent of
respondents indicated that more than 20 percent of
their service requests could and should have been level
1 issues In organizations that donrsquot distinguish between
incidents and service requests the number is higher
37 percent report that more than 20 percent of their
tickets should have been resolved before they reached
desktop support However the median for all three
groups is the same 11ndash15
of desktop support organizations measure average time to respond
53
of the tickets sent to desktop support should have been resolved by the service desk
11-15
Less than 1 hour
1 ndash 4 hours
4 ndash 8 hours
8 ndash 24 hours
1 ndash 2 days
3 ndash 5 days
More than 5 days
I donrsquot know
Less than 1 hour
1 ndash 4 hours
4 ndash 8 hours
8 ndash 24 hours
1 ndash 2 days
3 ndash 5 days
More than 5 days
I donrsquot know
INCIDENTS SERVICE REQUESTS
Percentage of organizations Percentage of organizations
89
89
207
186
181
169
198
194
152
152
84
63
13
0
76
72
68
64
107
119
115
115
214
136
167
157
184
213
81
38
64
68
Average time to resolve desktop support tickets (from the time a ticket is received to the time it is resolved)
DESKTOP SUPPORT EDITION
HDI Research Brief September 2013 | 4
Desktop Support Metrics
Once an issue reaches desktop support it becomes
a question of how quickly and efficiently the desktop
support team can resolve the problem Of the
organizations surveyed 49 percent measure the
average time to resolve desktop support tickets
Predictably incidents are handled faster than service
requests since resolving a problem is not the same
as fulfilling a request Almost half of the respondents
(48) indicate that incidents are generally resolved
within one business day (8 hours) An additional 198
percent resolve incidents within 24 hours The remaining
respondents take 1ndash5 days or more
Service requests nearly always take longer with 214
percent taking 8ndash24 hours to resolve 167 percent
taking 1ndash2 days and 184 percent taking 3ndash5 days Only
29 percent are resolved in less than 8 hours Service
requests also impact those teams that combine their
tickets 175 percent of such requests are resolved in
8ndash24 hours while 183 percent take 1ndash2 days
Like the service desk the desktop support team may
also track how often a ticket is resolved on the first
attempt On the service desk this is usually called first
call resolution (FCR) For second-level support we swap
call for contact first contact resolution Regardless the
median for tickets resolved by the technician on the
first attempt is 70ndash80 percent
There are always circumstances that require desktop
support to engage other support teams which obviously
adds time to the duration of an incident For this reason
some teams also track ticket escalation Of the survey
respondents 39 percent say they measure this metric
and the median for escalations from desktop support to
other levels is 11ndash15 percent
However therersquos a clear difference between the amount
of time it takes to resolve an incident and the amount
of time or effort an analyst or technician puts into the
resolution of the incident Time to resolve is the duration
of the ticket how long it takes to reach a resolution
from the time the ticket is opened to the time itrsquos
closed Effort is the actual time the analysttechnician
spends working on the problem For example if an
issue requires a desktop computer to be reimaged the
entire reimage job may take several hours The actual
effort put in by the analysttechnician may be far less
(ie however long it takes to set up and kick off the
job) While that job is running the analysttechnician
can work on other tasks The effort measure represents
only the time they spent directly working on the issue
Whatrsquos surprising is how few organizations attempt to
measure effort Therersquos significant value in this metric
because it shows how much time the analysttechnician
is spending on core work It also allows managers to
gauge how much time and money specific types of
tickets require Of the organizations surveyed only 25
percent reported measuring effort For incidents 695
percent of organizations are spending 2 hours or less
on each ticket compared to the duration metric of 8
hours For service requests 62 percent of organizations
report that less than an hour of effort is typical In mixed
environments a little more than 50 percent show effort
of an hour or less
SatisfactionSupport organizations exist to resolve the customersrsquo
technical issues Most of the metrics noted above
objectively show how well desktop support is able to
handle its volume of work What they donrsquot speak to
the customerrsquos perception of desktop support Thatrsquos
where customer satisfaction metrics are valuable
Many organizations distribute customer surveys to get
feedback on individual and process performance Thirty-
five percent of the organizations surveyed have some
mechanism for capturing this information The survey
shows that 158 percent solicit feedback from a random
sampling of customers while almost 10 percent send
out surveys for all tickets The remaining respondents
collect data on a regular schedule
Very satisfied Satisfied
Neutral
Dissatisfied
Very dissatisfied
12
2652
31
Percentage of organizations
Average desktop support customer satisfaction rating
DESKTOP SUPPORT EDITION
HDI Research Brief September 2013 | 5
Desktop Support Metrics
For all available HDI Research Briefs visit wwwThinkHDIcomBePartOfTheCorner
Copyright copy 2013 UBM LLC All rights reserved
Sponsored by
By far email is the most common method for distributing
surveys (266) Customer-facing websites are the next
most common (131) followed by phone interoffice
mail postal mail and other methods
The good news is that across all industries 96 percent
of desktop support customers are either satisfied or
very satisfied just 32 percent of organizations have
customers who are dissatisfied or worse
ConclusionTherersquos an old saying that you canrsquot manage what you
canrsquot (or donrsquot) measure Thatrsquos very true in the world of
desktop support Effective metrics helps management
focus its attention on whatrsquos important They tell us
where wersquore going where wersquove been and how to
prepare for the future They allow us to set realistic
goals and they tell us when we achieve those goals
A meaningful program of metrics and measures is well
worth your time and energy
If yoursquore a desktop support professional I encourage
you to pick up a copy of the 2013 HDI Desktop Support Practices amp Salary Report It expands on the information
in this report and much much more
Median
Incidents Service Requests
Percentage of total tickets handled by desktop support 25-30 41-45
Average number of tickets resolved by one desktop support technician in a month 101-125
Average time to respond (includes only typical tickets not urgent or high-priority tickets)
1 - 2 hours 2 - 4 hours
Percentage of tickets sent to desktop support that could have been resolved by the support center (level 1)
11-15 11-15
Average time to resolve a desktop support ticket (from the time a ticket is received to the time it is resolved)
8 - 24 hours 8 - 24 hours
Percentage of tickets resolved by the technician on the first attempt 70-80 70-80
Percentage of tickets escalated to another department or level 11-15
Average amount of dedicated work time (effort) a desktop support technician spends on a ticket
1 - 2 hours 1 - 2 hours
Summary of desktop support metrics
Incidents Results for tickets for unplanned work required to fix something Service requests Results for tickets where nothing is broken but a service is needed
DESKTOP SUPPORT EDITION