Embed Size (px)
Citation preview
DESIGN, SYNTHESIS AND CHARACTERIZATION OF
THE OXYGEN REDUCTION REACTION CATALYST FOR
POLYMER ELECTROLYTE MEMBRANE FUEL CELLS
by
Yanqi Zhang
A thesis submitted to the Faculty of the University of Delaware in partial
fulfillment of the requirements for the degree of Master in Chemical Engineering
Spring 2013
© 2013 Yanqi Zhang
All Rights Reserved

DESIGN, SYNTHESIS AND CHARACTERIZATION OF
THE OXYGEN REDUCTION REACTION CATALYST FOR
POLYMER ELECTROLYTE MEMBRANE FUEL CELLS
by
Yanqi Zhang
Approved: __________________________________________________________
Yushan Yan, Ph.D.
Professor in charge of thesis on behalf of the Advisory Committee
Approved: __________________________________________________________
Abraham M. Lenhoff, Ph.D.
Chair of the Department of Chemical and Biomolecular Engineering
Approved: __________________________________________________________
Babatunde Ogunnaike, Ph.D.
Interim Dean of the College of Engineering
Approved: __________________________________________________________
James G. Richards, Ph.D.
Vice Provost for Graduate and Professional Education

iii
ACKNOWLEDGMENTS
The author of the thesis appreciates her adviser Dr. Yushan Yan for all the
support, knowledge and advise he has kindly offered during her master’s study. The
author would like to specially thank Robert Forest from Dr. Jingguang Chen’s lab and
Dr. David Cullen for the kind help on XPS and TEM analysis of the sample. She also
thanks all her profesors, classmates and group members from graduate and
undergradute studies for the discussions, help and advise. I would like to specially
thank DOE EERE for the financial support. Last but not least, to all the ones she loved
and loved her, for leading her and supporting her to the day the thesis is finished.
iv
TABLE OF CONTENTS
LIST OF FIGURES ....................................................................................................... vi
ABSTRACT ................................................................................................................ viii
Chapter
1. INTRODUCTION .............................................................................................. 1
2. RESEARCH BACKGROUND .......................................................................... 4
ORR Mechanism .................................................................................... 4
ORR Activity on Pt Surface ................................................................... 5
Stability of Pt for ORR ........................................................................... 7
Selective Research Activities ............................................................... 11
3. CATALYST OF PT SUPPORTED ON SCANDIUM OXIDE
NANOSHEETS FOR PEMFC ......................................................................... 14
Background ........................................................................................... 14
Experiment ........................................................................................... 15
Synthesis of Pt/Sc2O3/C Catalyst .................................................... 15
Post-treatment ................................................................................. 16
Thermal Gravimetric Analysis ....................................................... 16
Transmission Electron Microscopy ................................................ 17
Surface Composition and Binding Strength ................................... 17
Electro-chemical Measurements .................................................... 17
Results and Discussions ....................................................................... 18
Morphology and Growth Mechanism of Pt/Sc2O3/C ..................... 18
ORR Activity and XPS ................................................................... 21
ORR Durability of Pt/Sc2O3/C ....................................................... 24
Summary ............................................................................................... 24
4. STUDY OF NANO-GOLD PARTICLES FOR ORR OF HEMFCS .............. 26
Background ........................................................................................... 26
v
Experiment ........................................................................................... 27
Catalyst Preparation ........................................................................ 27
Transmission Electron Microscopy ................................................ 28
Electrode Preparation ..................................................................... 28
Results and Discussions ....................................................................... 28
Morphology .................................................................................... 28
Cyclic Voltammetry ....................................................................... 29
ORR Activity and Durability .......................................................... 30
Summary ............................................................................................... 32
5. SUMMARY AND CONCLUSION ................................................................. 33
REFERENCES ............................................................................................................. 35
vi
LIST OF FIGURES
Figure 1 Scheme of PEMFC using hydrogen as fuel and oxygen as oxidant. ......... 2
Figure 2 ORR mechanisms of dissociative and associative mechanism. ................ 4
Figure 3 Free energy chart of oxygen reduction reaction on Pt surface of
dissociative reaction mechanism [13]. ...................................................... 6
Figure 4 Volcano plot of ORR activity on different metal surfaces [13]. ............... 6
Figure 5 Cell voltage (a) and Pt electrochemical surface area (b) as a function
of short-stack run time. Operating condition: Hydrogen/air
stoichiometric flow is 2/2, under 80 ℃, 150 kPaabs, 100% RH [16]. ........ 7
Figure 6 Proposed mechanisms of instability of Pt particles in low temperature
fuell cells [17]. ........................................................................................... 8
Figure 7 Microscopic images of PtCo/C sample with low resolution (a) before
(b)after the durability test and with high resolution (c) before, (d) after
and (e) overlay of the two [22]. ............................................................... 10
Figure 8 Hundreds of elemental mapping images of the PtCo particles, (a)
before and (b) after the durability test; (c) and (d) presents an example
of multi-core and single-core particle respectively [21]. ......................... 11
Figure 9 Accelerated stress test results of (a) Pt/TiO2 over 200 h and (b) Pt/C
over 80 h [39]. ......................................................................................... 13
Figure 10 Screening the activity and stability using DFT calculation. The
horizontal axis is the heat formation energy which can be related to
stability. The vertical axis is the bonding energy which is an indicator
of activity [41]. ........................................................................................ 15
Figure 11 (a) Bright field image of Pt/Sc2O3/C. the light grey area is free of C;
and (b) the EDAX mapping of the squared area. .................................... 19
Figure 12 Dark field and bright field images of (a) the voids on the Sc2O3
nanosheets; (b) adjacent area of the nanosheets marked in red and
carbon support marked in green; and (c) free standing nanosheets. ........ 20

vii
Figure 13 TEM images of (a) Pt nanoparticles obtained without Sc precursor; (b)
Pt supported on CeO nanosheets synthesized via similar method; and
(c) EDAX spectrum showing the presence of CexOy. ............................. 21
Figure 14 (a) CV of Pt/Sc2O3/C catalyst with clear Pt features; and (b) ORR
polarization curves of Pt/Sc2O3/C with and without IR correction. ........ 22
Figure 15 (a) Specific activity and (b) mass activity comparisons of Pt/C and P
Pt/Sc2O3/C at the beginning and after 6,000 cycles of test. ..................... 23
Figure 16 XPS measurement comparison of Pt/C and Pt/Sc2O3/C .......................... 23
Figure 17 ECSA loss during durability test for Pt/C and Pt/Sc2O3/C. ..................... 24
Figure 18 (a) TEM image of free Au particles without carbon support; (b)
histogram of Au particles; and (c) EDAX of the particles. ..................... 29
Figure 19 CV of Au/C in 0.1 M KOH with different upper potential, the
reduction peak size is proportional to the potential upper limit. ............. 30
Figure 20 (a) ORR polarization curves at different rotation speed with sweeping
rate 50 mV/s; (b) Levich-Koutecky Plots for the ORR on Au at
various potentials extracted from data in (a); current density
normalized to the geometric electrode area. ............................................ 31
Figure 21 ORR polarization curves of Au/C and Pt/C both at the beginning
(solid line) and at the end (dash line) of the durability test with ECSA
loss comparison inset. .............................................................................. 32

viii
ABSTRACT
The sluggish oxygen reduction reaction (ORR) kinetics remains the critical
technical barrier to fuel cell technology commercialization. In this thesis, the
mechanisms, critical problems, and current research activities are first discussed.
Then, with insights gained from literature, two different types of catalysts are explored
for the electrochemical reduction of oxygen.
Pt/Sc2O3 was synthesized using wet chemistry approach. Analysis under high-
resolution transmission electron microscopy (HRTEM) revealed the unique nanosheet
structure of the Sc2O3. Physical and chemical properties of the catalyst were examined
including the morphology, particle size, and chemical bonding strength. Rotating disk
electrode (RDE) measurement was carried out to evaluate the activity of the catalyst in
an acidic environment. The observed catalyst activity is three times higher than the
benchmark Pt/C. Furthermore, durability tests showed the electrochemical surface area
(ECSA) losses of the catalyst is only one third of that of Pt/C after 30,000-cycles of
durability test. The second catalyst explored iss designed for hydroxide exchange
membrane fuel cells. Specifically, a platinum-free nano-Au supported on C was also
produced under mild synthesis conditions. Ozone treatment was used to remove the
surfactant on the surface of the particle. The activity was determined via RDE in
alkaline medium. The specific activity of Au/C is remarkably approaching that of the
Pt/C. In addition, the Au/C loses 9 % of the initial surface while the Pt/C has a loss of
40 % after a modified stressful durability test. The results from this study provide
useful information and guidance to the research of future catalysts.
1
Chapter 1
INTRODUCTION
With the worldwide depletion of fossil fuels and the continually growing
energy demand of human society, finding sustainable and reliable next-generation
power source has been one of the critical topics of the past century. Fuel cells have
drawn great attention as an environmentally friendly and high-efficiency
electrochemical devices [1]. Fuel cells are generally categorized by their working
electrolyte: acid fuel cell, alkaline fuel cell, solid oxide fuel cell and so on. Among all
of these, the polymer electrolyte membrane fuel cell has been the most extensively
studied. It has the advantages of portability, mild operating conditions and
compatibility with a variety of fuels [2]. Polymer electrolyte membrane fuel cells can
be further divided into two types, proton exchange membrane fuel cells (PEMFCs)
and hydroxide exchange membrane fuel cells (HEMFCs) depending on the type of
membrane employed.
Figure 1 shows the structure and chemistry of operating PEMFC using
hydrogen as fuel and oxygen as oxidant. On the anode side, hydrogen is oxidized to
produce protons and electrons. While the protons are transferred through the
membrane, the electrons go through the external circuit to produce electricity. Upon
meeting again at the cathode, they will spontaneously react with oxygen to produce
water in the presence of a catalyst. For the HEMFC, the mechanism is similar, except
that the transferred ion is hydroxide rather than proton.

2
Figure 1 Scheme of PEMFC using hydrogen as fuel and oxygen as oxidant.
The commercialization of PEMFC has been inhibited by the high material cost
associated mainly with the Pt catalyst required for both the anodic hydrogen oxidation
reaction (HOR) and cathodic oxygen reduction reaction (ORR). For PEMFCs, Pt is so
far the only practical catalyst due to the device’s highly oxidative and acidic
environment during operation. Between the two half-cell reactions, the ORR is a
bigger concern since its large over-potential (300~400) severely limits performance
[3]. So far, the commercial catalyst of 2 ~5 nm Pt nanoparticles supported on carbon
still suffers from the poor activity and durability.
HEMFC has a much shorter history than PEMFC. The switch from PEM to
HEM makes the utilization of non-Pt or even non-precious-metal catalysts possible.
Recently, the research of high performance HEMs is advancing rapidly [4-6].
Nonetheless, finding a cheaper and more active catalyst for the device is still a big
concern. Studies show that even with the best catalyst (Pt), the HOR in HEMFC has a
much higher over-potential than in PEMFC. While there has been some success in

3
non-precious metals in alkaline fuel cells for ORR [7-9], such study in HEMFC is still
rare.
With the growing interest in both PEMFCs and HEMFCs, novel catalysts with
better activity and durability are in great demand.

4
Chapter 2
RESEARCH BACKGROUND
ORR Mechanism
The oxygen reduction reaction on a metal surface is a complex heterogeneous
catalytic reaction which involves several elementary steps. Two general reaction
mechanisms have been proposed, illustrated schematically in Figure 2.
Figure 2 ORR mechanisms of dissociative and associative mechanism.
Regardless of the details, it consists broadly of adsorption, reaction and
desorption steps. The reactivity of the metal surface is controlled by the activation
energy of the rate determining step, which in most cases is either the adsorption or
desorption step. According to study of T. Bligaard [10], the activation energy is
proportional to the bonding energy of metal and adsorbate which reflects the
interaction strength between them. This is a very significant result in heterogeneous
5
catalytic studies because it provides the relationship between a catalyst’s intrinsic
properties and reactivity.
More specifically, weak bonding corresponds to the adsorption-limited case, in
which large activation energy is required for the adsorbates to bond with the catalyst
surface. Conversely, strong bonding corresponds to the desorption-limited case, in
which the surface of the catalyst will be blocked by the strongly bonded reaction
intermediate and the active surface sites will continuously decrease with the
accumulation of the intermediates [11]. Accordingly, a good catalyst surface must be
reactive enough to form the bond and noble enough to release the product [12].
ORR Activity on Pt Surface
Figure 3 [13] shows the free energy change of oxygen reduction reaction on Pt
surface with different oxygen coverage under different potentials. The three black
lines compare different potential. At U=0 V, the free energy change of all steps is
downhill, indicating the forward reactions are all favorable. At higher potential, the
difference between the reactants and products becomes smaller, so driving force for
the forward reaction is much less. At U=1.23 V, which is the standard reduction
potential for oxygen, the last two steps become even more difficult showing an uphill
free energy change. The blue line of oxygen coverage of 0.5 illustrates that at higher
adsorbate coverage, the Pt surface is less active for both the adsorption and proton
transfer steps. This graph suggests that the Pt is bonding too strongly with the
adsorbed oxygen atom, making the following proton transfer step unfavorable. Similar
study of ORR on all other metals can be done and the results will provide a rough
screening for oxygen reduction catalysts.

6
Figure 3 Free energy chart of oxygen reduction reaction on Pt surface of
dissociative reaction mechanism [13].
Figure 4 Volcano plot of ORR activity on different metal surfaces [13].
In previous work, J. Nørskov and co-workers plotted the ORR activity of
different metal surfaces against the oxygen bonding energy [13, 14]. The plot has a

7
volcano shape as shown in Figure 4, with the strongly bonding elements on the left
side and the weakly bonding elements on the right side. Clearly, Pt is the closest to the
optimum and better activity is expected if we can tune the Pt-O bond to be weaker.
While other metals (silver, palladium, copper and so on) also show acceptable
activity, their strong tendency to dissolve in acid makes them less competitive in
practical applications [15].
Stability of Pt for ORR
Figure 5 Cell voltage (a) and Pt electrochemical surface area (b) as a function of
short-stack run time. Operating condition: Hydrogen/air stoichiometric
flow is 2/2, under 80 ℃, 150 kPaabs, 100% RH [16].
The conventional PEMFC catalyst consists of 2~5 nm Pt nanoparticles
dispersed on a high surface area carbon support. The particle size maximizes
utilization of the Pt surface. However, the electrochemically active surface greatly
diminishes during fuel cell operation. Figure 5 [16] shows clearly the potential and Pt
8
surface area losses as a function of time. A significant part of the losses can be
attributed to the slow cathodic kinetics.
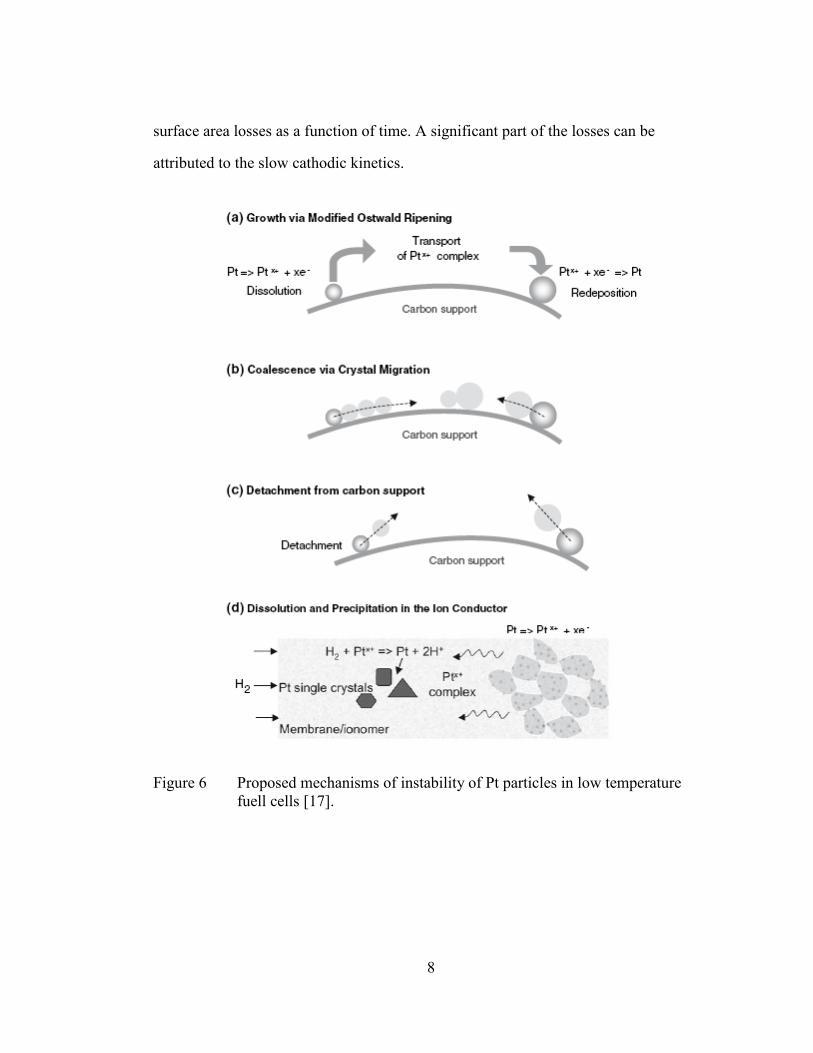
Figure 6 Proposed mechanisms of instability of Pt particles in low temperature
fuell cells [17].
9
In general, four main mechanisms for Pt degradation have been proposed in
previous literature [17, 18] as shown in Figure 6 [17]. Ostwald ripening is a
thermodynamically driven process, in which smaller Pt particles will dissolve and re-
deposited on larger particles. In this way, the particles grow larger at the expense of
high-surface-area small particles. The second mechanism describes the movement of
Pt particles on the carbon support and the coalescence when particles meet. In the third
mechanism, detachment of particles from carbon support becomes considerable during
start-up and shut-down due to severe carbon corrosion. The last mechanism mainly
refers to Pt loss in the catalyst layer due to the re-deposition in the ion conductor and
membrane layer.
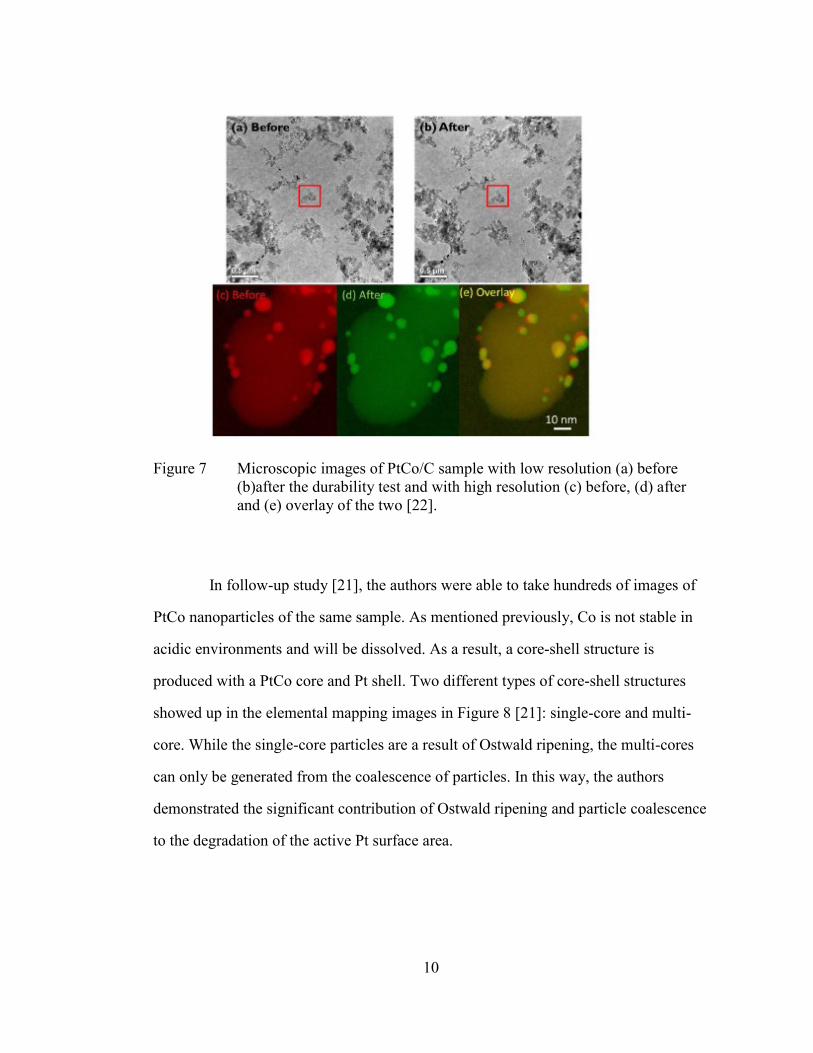
With the help of the advanced microscopy, a recent study revealed the
structure evolution during the degradation of Pt (and PtM) nanoparticles at the atomic
level [19-22]. By using an indexed gold grid, they were able to take images of exactly
the same part of the sample. We can clearly observe the movement and coalescence of
the particles on the carbon surface in Figure 7 (c), (d) and (e)[22].
10
Figure 7 Microscopic images of PtCo/C sample with low resolution (a) before
(b)after the durability test and with high resolution (c) before, (d) after
and (e) overlay of the two [22].
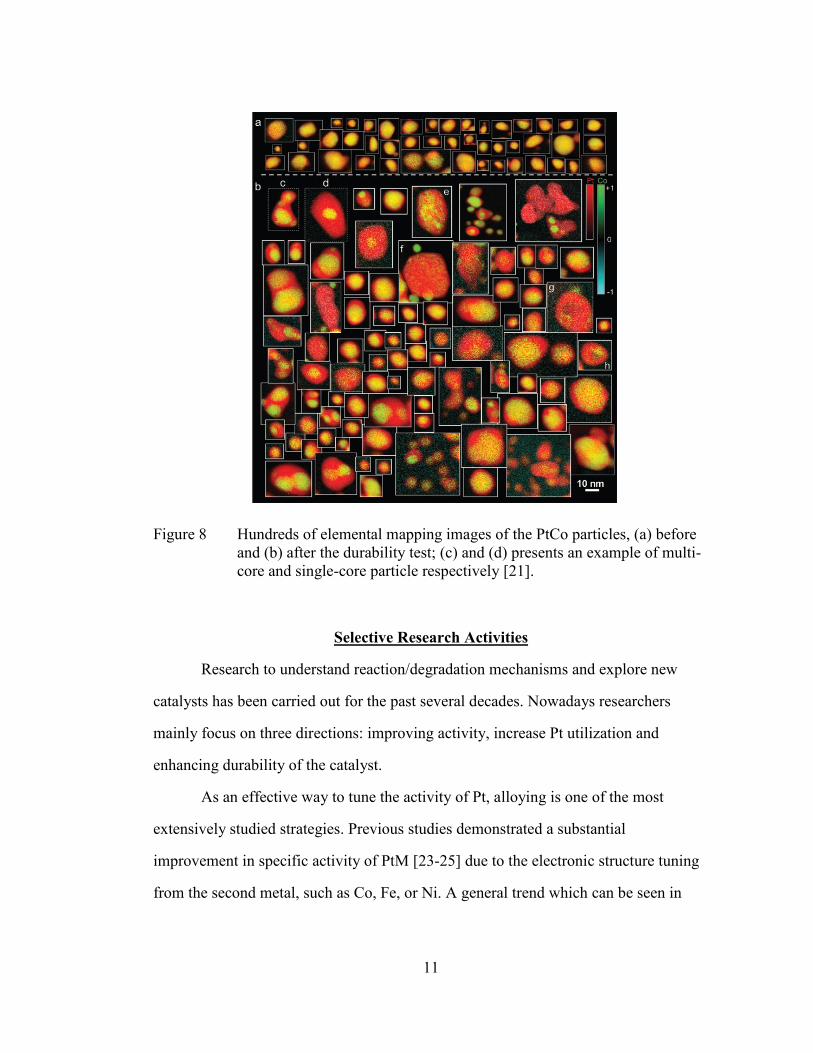
In follow-up study [21], the authors were able to take hundreds of images of
PtCo nanoparticles of the same sample. As mentioned previously, Co is not stable in
acidic environments and will be dissolved. As a result, a core-shell structure is
produced with a PtCo core and Pt shell. Two different types of core-shell structures
showed up in the elemental mapping images in Figure 8 [21]: single-core and multi-
core. While the single-core particles are a result of Ostwald ripening, the multi-cores
can only be generated from the coalescence of particles. In this way, the authors
demonstrated the significant contribution of Ostwald ripening and particle coalescence
to the degradation of the active Pt surface area.
11
Figure 8 Hundreds of elemental mapping images of the PtCo particles, (a) before
and (b) after the durability test; (c) and (d) presents an example of multi-
core and single-core particle respectively [21].
Selective Research Activities
Research to understand reaction/degradation mechanisms and explore new
catalysts has been carried out for the past several decades. Nowadays researchers
mainly focus on three directions: improving activity, increase Pt utilization and
enhancing durability of the catalyst.
As an effective way to tune the activity of Pt, alloying is one of the most
extensively studied strategies. Previous studies demonstrated a substantial
improvement in specific activity of PtM [23-25] due to the electronic structure tuning
from the second metal, such as Co, Fe, or Ni. A general trend which can be seen in
12
both experimental and computational modeling studies is that when Pt is alloyed (or
incorporated into a layered structure) with elements that bond strongly with oxygen,
like the ones on the left side of the volcano plot, the bonding between Pt and oxygen
weakens. Pt-based alloys can not only improve the intrinsic activity of Pt, but also
reduce the usage of Pt compared to particles of similar size.
The mechanism of ORR on Pt alloys has been studied for more than 20 years.
Some researchers attributed higher activity on bulk PtCr alloys to surface roughening
[26]. Others attributed the activity to particle termination with particular vicinal planes
on dispersed catalyst surfaces [27]. In a paper published 1983 [28], the authors
investigated the relationship between interatomic distance and catalytic activity for Pt
alloys in phosphoric acid. They used XRD to determine the nearest neighbor distance
of 10 different Pt alloys. A linear relation curve was observed upon plotting the
activity against nearest neighbor distance. Still others researchers attributed the
activity to the electronic tuning from the ligand effect (such as d-band vacancy) and
the strain effect caused by introducing other metal atoms into the Pt lattice [29, 30].
Despite their high activity, the stability of alloy catalysts is still a concern.
Studies [31] show that, since the second metal is much less stable than Pt, over long-
term fuel cell operation, the second metal will leach out, leading to a dramatic change
in catalyst composition and activity. The final structure of catalyst usually consists of
a skeleton Pt skin [32, 33] which is vulnerable to dissolution [34].
Another strategy to reduce Pt usage is to construct materials with novel nano-
structure, for instance, Pt monolayers supported on other metals. Adzic and co-
workers successfully generated Pt monolayer supported on both single-crystal [35]
and nanoparticulate metal surfaces [36, 37]. Results showed that when Pt is supported

13
on Pd, the activity can be improved. Due to the low amount of Pt being used, the mass
activity can be improved considerably. However, the stability is still under debate.
Theoretical studies [15, 38] claim that the monolayer structure is not
thermodynamically stable: the top layer will diffuse into the base metal to form a solid
solution.
Two strategies have been explored to improve durability. One is to replace the
carbon support with other materials, such as TiO2 [39]. As shown in Figure 9, with
comparable initial membrane electrode assembly (MEA) performance, the Pt/TiO2 has
a much longer lifetime than Pt/C. The other method is to construct free-standing Pt
catalyst without C support. As reported by S. Alia [40], the Pt nanotube degrades
much less than Pt/C after a 30,000 cycle durability test.
Figure 9 Accelerated stress test results of (a) Pt/TiO2 over 200 h and (b) Pt/C over
80 h [39].
Other studies concerning non-precious metal catalyst development are outside
the scope of this thesis.

14
Chapter 3
CATALYST OF PT SUPPORTED ON SCANDIUM OXIDE NANOSHEETS
FOR PEMFC
Background
Most of the early studies of the Pt alloy catalysts have been limited to late
transition metal (or group VIIB metals), such as Ni, Co, Fe group. . It is only recently
that studies have incorporated the early transition metals and rare earth, transition
metals. In 2009, J. Greeley [41] published results from density functional theory
(DFT) calculations for various PtM systems. Of particular interest were the resulting
predictions for Pt(Pd)3M and Pt(Pd)M systems. Specifically, relationships between
bonding energy and predicted activity, and alloy heat formation energy and resulting
stability were discussed. The useful result is summarized in Figure 10 [41]. The
calculations suggest that PtY and PtSc are two promising candidates for PEMFC
catalysts, due to their suitable bond energy and predicted.
Inspired by this finding, Dr. Chorkendorff and others have extended the study
to other rare metals, such as Gd, Hf and Zr [42-46]. In these studies, the authors have
reported activity, stability, and durability of various synthesized catalysts. For
example, durability tests of bulk Pt5Gd show nearly no decreases in activity after
30,000 cycles.
Given the favorable results of the previously synthesized materials above, and
the potentially good candidates PtY and PtSc as suggested by Figure 10, synthesis of

15
Pt with early transition metals are a promising next step. However, metals such as Sc,
Y, Hf, and Gd have very negative reduction potential, which indicate difficulty in
forming alloys. Up to now, no studies have been reported of these materials in nano-
scale.
In the following section, the author summarized her study on synthesis and
characterization of Pt/Sc2O3/C composite catalysts. The interesting observations and
results will be discussed in details as well.
Figure 10 Screening the activity and stability using DFT calculation. The horizontal
axis is the heat formation energy which can be related to stability. The
vertical axis is the bonding energy which is an indicator of activity [41].
Experiment
Synthesis of Pt/Sc2O3/C Catalyst
Pt supported on Sc2O3 was prepared by an organic solvothermal method. In a
typical synthesis, 68 mg scandium acetylacetonate (Alfa-aesar) and 129 mg 1,2-
hexanedecanediol (Sigma-Aldrich) were dissolved in 20 mL diphenyl ether(Sigma-
Aldrich) in the presence of 1 mL oleic acid (Sigma-Aldrich) and 1 mL oleylamine
16
(Sigma-Aldrich). The mixture was heated to 80 ℃, under Ar atmosphere, to get a
clear solution before being raised to 240 ℃. Next, 30 mg platinum acetylacetonate
(Sigma-Aldrich) in 0.5 mL dichlorobenzene (Sigma-Aldrich) was injected into the
solution, which immediately turned dark brown, indicating the formation of metal
nuclei. The reaction was maintained at 240 ℃ for 1 h before cooling down to room
temperature for collection.
Post-treatment
The Pt/Sc2O3 catalyst was loaded onto high surface area carbon support before
washing. Typically, 15 mg Ketjen carbon black was dispersed in 10 to 15 mL iso-
propanol. The as-synthesized catalyst was added to the mixture under vigorous stirring
at 80 ℃. After 30 min, the mixture was transferred to an ultrasound bath for another
30 min mixing. The product was collected by centrifuge and washed with hexane and
ethanol 3 times.
High temperature annealing was done to remove any residual organic
surfactant. Under these conditions, the catalyst has been shown to retain its particle
size and composition [47]. In this synthesis, the carbon supported catalyst was
transferred to a ceramic boat and placed in a tube furnace. The catalyst was then
annealed at 650 K or 700 K for 30 min in a H2 and Ar mixture prior to further
characterizations.
Thermal Gravimetric Analysis
The carbon to metal loading ratio was obtained from a thermal gravimetric
analyzer. For each test, approximately 2 mg of catalyst was loaded in an alumina
17
crucible. The temperature was raised to 900 ℃ under oxygen to burn off all the
carbon. The remaining residue is considered as carbon-free.
Transmission Electron Microscopy
TEM was carried out using JEM-2010 FX in the W.M. Keck Electron
Microscopy Facility Center at the University of Delaware. To prepare the sample
suspension for TEM, a small amount of dry powder was dispersed in methanol and
sonicated. Afterward, the Lacey Carbon copper grid was coated with a drop of the
sample suspension and dried thoroughly before being loaded into the TEM chamber.
The dark field images and Z-contrast images were obtained using JEOL 2200FS
STEM with a CEOS probe-corrector from Oak Ridge National Laboratory. The
STEM instrument is also equipped with a Bruker-AXS silicon drift detector for
recording EDS maps, which investigate the composition of the catalyst.
Surface Composition and Binding Strength
Surface composition was obtained with a Phi 5600 X-ray photoelectron
spectroscopy (XPS) system equipped with a multi-channel hemispherical analyzer and
Al anode X-ray source. The XPS was calibrated using binding energies of the primary
peaks from Au, Ag, and Cu reference samples. Samples were prepared by pressing the
powder into In foil before mounting on a sample holder. The Pt/Sc atomic ratio was
determined from the Pt 4f and Sc 2p photoelectron peaks.
Electro-chemical Measurements
Rotating disk electrode (RDE) measurements were used to evaluate the activity
of the catalyst. First, catalyst powder was dispersed in ultrapure DI water. 20 µL of the
suspension was dropped onto a glassy carbon electrode and dried in air at room

18
temperature to form a uniform thin film. Later, 10 µL of a 0.005% Nafion in ethanol
solution was dropped on top of the electrode as a conducting binder. The loading on
the electrode was adjusted to 10 to 20 µg Pt /cm2 of electrode surface for both the
synthesized catalyst and the commercial Pt/C. The electrochemical test was conducted
in a jacketed electrochemical glass cell. A saturated Calomel electrode and a Pt wire
were used as reference and counter electrodes. All measurements were carried out in
0.1 M HClO4 at room temperature (RT). The electrochemical surface area (ECSA)
was obtained from the Pt hydrogen adsorption and desorption region of the cyclic
voltammogram. This involved integration to find the total charge, and then dividing
the total charge by the charge density of Pt [48]. The ORR catalytic activity was
obtained from the ORR polarization curve. The current at 0.9 V vs. RHE was taken
from the curve using a sweep rate of 20 mV/s. Durability tests were carried out by
cycling the potential from 0.6 V to 1.1 V vs. RHE for 30,000 cycles at RT with a
sweep rate 50 mV/s. ECSA measurements were taken at the 6,000th, 12,000th,
18,000th, 24,000th and 30,000th cycle.
Results and Discussions
Morphology and Growth Mechanism of Pt/Sc2O3/C
Solvo-thermal method has been applied to successfully produce PtM (M=late
transition metals) alloy nano-crystals before [49-51]. Typically, the co-reduction of Pt
and Ni, Co or Fe will produce uniform PtM nanocrystals. But in the case of Pt-Sc
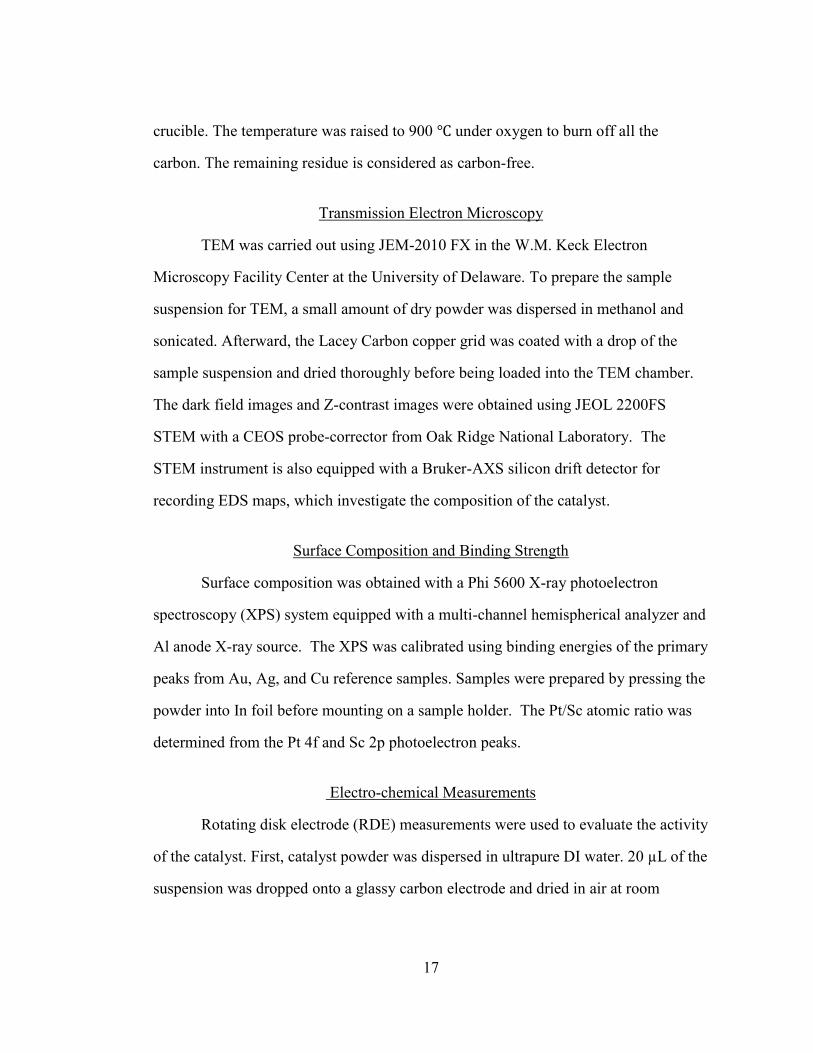
system, the product is quite different. Figure 11 (b) is the EDAX mapping image
corresponding to the squared region of (a) the bright field image. The Pt signal is
represented by red dots while the Sc signal is represented by green. A sheet-like
19
structure with strong Sc signal in the area is observed. From the elemental analysis,
the strong oxygen peak confirms the composite of Sc2O3. Rather than forming uniform
alloy nanocrystals, scandium oxide nanosheets were produced and serve as another
support for Pt nanoparticle dispersion. In Figure 12, there are three sets of bright field
and dark field images revealing the structure of Sc2O3 nanosheets explicitly. The oxide
nanosheets are not uniform in thickness. In Figure 12 (a) and (b), the voids and
differences in thickness of each nanosheet can be seen from the contrast. Under low
magnification, the nanosheets have similar morphology and cannot be clearly
distinguishable from carbon. However, at high magnification (d), the lattice of the
Sc2O3 (separated by red line) can be seen, compared to the amorphous carbon
(separated by green line). There also exist free standing Sc2O3 nanosheets in the
sample, which are fully unattached to any carbon support as shown in Figure 12 (e)
and (f).
Figure 11 (a) Bright field image of Pt/Sc2O3/C. the light grey area is free of C; and
(b) the EDAX mapping of the squared area.

20
Figure 12 Dark field and bright field images of (a) the voids on the Sc2O3
nanosheets; (b) adjacent area of the nanosheets marked in red and carbon
support marked in green; and (c) free standing nanosheets.
Studies were carried out to determine the effect of Sc on catalyst formation.
The first study involved a control synthesis without Sc precursor. Results showed that
Sc2O3 formation plays an essential role in separating the Pt particles and preventing
them from aggregating into larger entities. As illustrated in Figure 13 (a), the Pt
particle size is much larger without Sc precursor, compared to that of the original
recipe with Sc. When the Sc precursor was substituted with a Ce precursor, which has
similar chemical properties as Sc, interestingly, the nanosheet structure was again
generated as shown in Figure 13 (b). The EDAX indicated the presence of CexOy in
the light grey area of the nanosheets.

21
This simple method to produce metal oxide supported Pt catalyst has never
been reported before. Since elements like Sc and Ce are chemically too active to be
reduced to their zero valences, they are more likely to form oxides during the
synthesis.
Figure 13 TEM images of (a) Pt nanoparticles obtained without Sc precursor; (b) Pt
supported on CeO nanosheets synthesized via similar method; and (c)
EDAX spectrum showing the presence of CexOy.
ORR Activity and XPS
Since Sc2O3 is not stable in the electrochemical testing environment, the
nanosheets will be dissolved eventually. Pt/Sc2O3/C catalyst exhibits typical Pt
features in the CV as shown in Figure 14 (a). The ORR polarization curve was
obtained at room temperature with sweeping rate 20 mV/s. Both the original and IR-
corrected curves are shown in Figure 14 (b). The significant deviation between
original and IR-corrected curves suggests that the resistance from the support and/or
conducting binder cannot be ignored. For the sake of comparison, the commercial
catalyst, 20% Pt/C provided by EC-lab, was also tested. The results for both specific

22
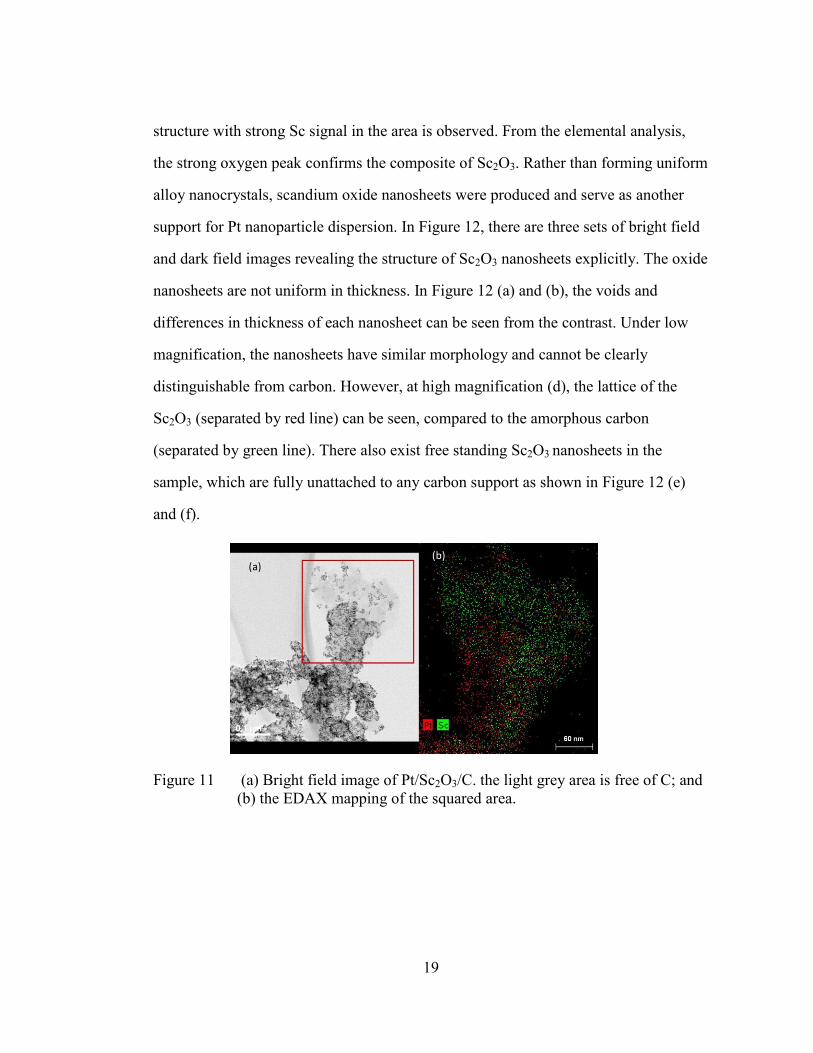
activity and mass activity are summarized in Figure 15. The lab-synthesized
Pt/Sc2O3/C catalyst exhibits about 3 times higher specific activity, which already
surpasses the DOE’s target for 2015 (marked by the blue dash line). Slight
improvements in specific activity were observed for both of the catalyst in the longer
run (6000 cycles), due to growth of Pt nanoparticles. The initial mass activity of
Pt/Sc2O3/C is 0.42 mA cm-2
, which is very close to the DOE target of 0.44 mA cm-2
.
Surprisingly, after 6000 cycles, the Pt/Sc2O3/C catalyst showed improvement in mass
activity of about 20 %. This can be explained by the “peel off” process of the catalyst.
During the synthesis, some of the Pt particles will be covered by the Sc2O3 nanosheets.
And these Pt particles do not provide active surface until the nanosheets are leached
away by the acid gradually. The author believes that this “peel off” process will
protect the Pt from dissolution at the early age of the test and slow down the
degradation process.
0.0 0.2 0.4 0.6 0.8 1.0 1.2
-1.4
-1.2
-1.0
-0.8
-0.6
-0.4
-0.2
0.0
0.2
0.4
0.6
I / m
A.c
m-2
dis
k
E / V vs RHE
CV at 50 mV/s
(a)
0.0 0.2 0.4 0.6 0.8 1.0 1.2
-1.4
-1.2
-1.0
-0.8
-0.6
-0.4
-0.2
0.0
I / m
A
E / V vs RHE
ORR curve without IR correcction
ORR curve with IR correction
(b)
Figure 14 (a) CV of Pt/Sc2O3/C catalyst with clear Pt features; and (b) ORR
polarization curves of Pt/Sc2O3/C with and without IR correction.
23
Initial after 6000
0.0
0.5
1.0
1.5
2.0
SA
/ m
A.c
m-2
Pt
Pt/C
Pt/Sc2O
3/C
1.57
1.84
cycles
(a)
Initial after 6000
0.0
0.1
0.2
0.3
0.4
0.5
0.6
MA
/ m
A.u
g-1
Pt
Pt/C
Pt/Sc2O
3/C
0.27
0.19
0.42
0.51
(b)
Figure 15 (a) Specific activity and (b) mass activity comparisons of Pt/C and P
Pt/Sc2O3/C at the beginning and after 6,000 cycles of test.
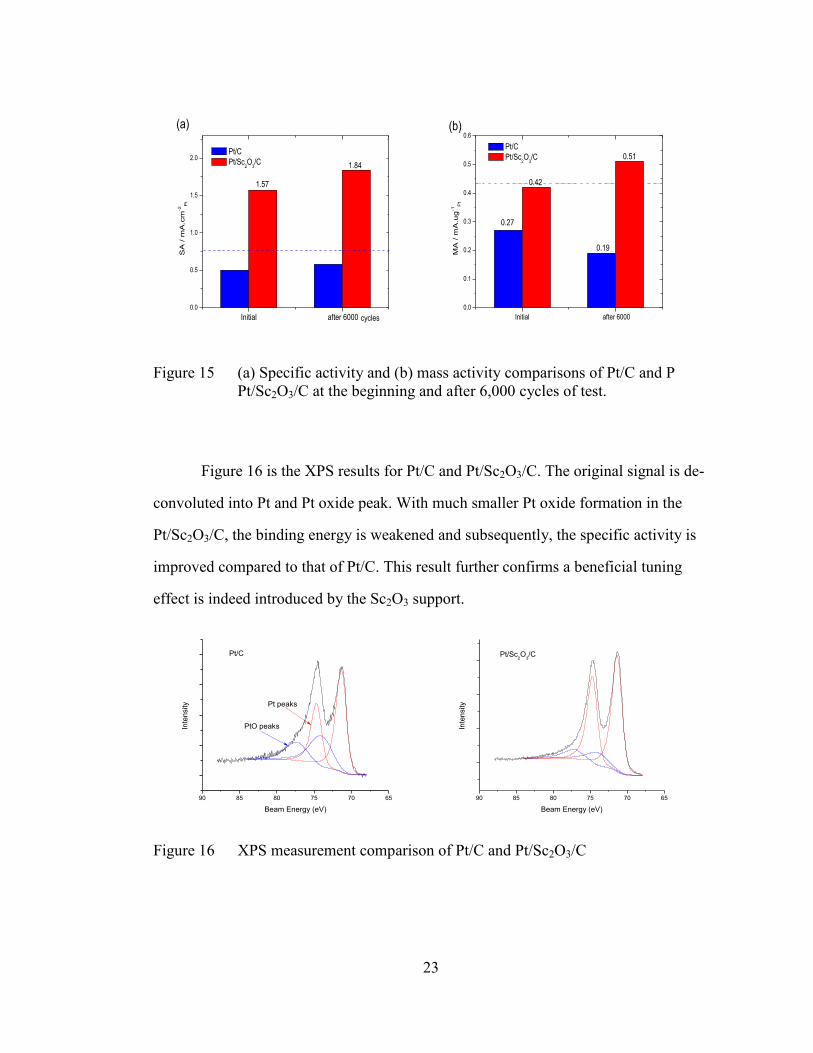
Figure 16 is the XPS results for Pt/C and Pt/Sc2O3/C. The original signal is de-
convoluted into Pt and Pt oxide peak. With much smaller Pt oxide formation in the
Pt/Sc2O3/C, the binding energy is weakened and subsequently, the specific activity is
improved compared to that of Pt/C. This result further confirms a beneficial tuning
effect is indeed introduced by the Sc2O3 support.
90 85 80 75 70 65
Inte
nsity
Beam Energy (eV)
Pt/C
Pt peaks
PtO peaks
90 85 80 75 70 65
Inte
nsity
Beam Energy (eV)
Pt/Sc2O
3/C
Figure 16 XPS measurement comparison of Pt/C and Pt/Sc2O3/C

24
ORR Durability of Pt/Sc2O3/C
A durability test was carried out over 30,000 cycles, with the potential ranging
from 0.6 to 1.1 V, which is slightly larger than reported in literatures [40, 52]. Larger
potentials correspond to harsher environments for durability testing. Figure 17
summarized the ECSA loss during the durability test. As proposed previously, the
“peel off” process of Pt/Sc2O3/C first results in an increase in the ECSA. By the end of
30,000 cycles, the ECSA gradually decreases to 77 % of the initial surface area. In
contrast, the commercial Pt/C sample lost about 40 % of the surface area within the
first 6,000 cycles, due strong dissolution and coalescence of tiny Pt particles. Only one
quarter of the initial surface area of Pt/C remains after the durability test.
0 6000 12000 18000 24000 30000
0.0
0.2
0.4
0.6
0.8
1.0
EC
SA
pe
rce
nta
ge
Cycles
Pt/Sc2O
3/C
Pt/C
0.77
0.26
Figure 17 ECSA loss during durability test for Pt/C and Pt/Sc2O3/C.
Summary
For the first time, metal oxide supported Pt catalyst (Pt/Sc2O3/C) has been
synthesized via a simple one pot reaction. The morphology and growth mechanism of
25
these oxide nanosheets have been discussed. The interaction between Pt nanoparticles
and Sc2O3 nanosheets result in a beneficial tuning effect on catalytic reaction of
oxygen. The lab-made catalyst exhibitsa ORR activity that is three times as high as
Pt/C. It also has much slower degradation rate. At the end of a 30,000 cycle durability
test, about 80 % of the electrochemical surface area remains. This is very promising
for practical application.

26
Chapter 4
STUDY OF NANO-GOLD PARTICLES FOR ORR OF HEMFCS
Background
Many studies have looked at designing catalysts with the intention of
minimizing the use of expensive and limited Pt. However, the ideal solution may be to
eliminate its use entirely. Efforts on non-Pt catalysts are currently a hot topic. For
example, Au has been looked at as an alternative catalyst, since it offers unique
properties. Compared to Pt, bulk Au has very poor catalytic performance because of
its less active surface. At the nanosale, however, Au metal becomes quite reactive.
Studies showed small particles of Au to have surprisingly high activity and selectivity
for CO oxidation, as well as other oxidation reactions involving small molecules [53].
Typically, the mechanism for oxygen reduction using a Pt surface occurs via a 4-
electron transfer pathway. In contrast, on bulk Au, oxygen reduction generally goes
through a 2-electron transfer mechanism due to the weak binding between the Au
surface and its reaction intermediates [54]. As a result, the efficiency for energy
conversion is lower, as evidenced by its decreased activity compared to Pt. When the
particle size decreases, there is an increase in the fraction of atoms with low
coordination number and high tendency for reaction. Thus, the activity and even the
mechanism of nanoscale materials can be very different from that of the bulk.
Therefore, there have been several studies about the size and facet dependence of Au
for the reduction of oxygen [54-56].

27
Even under similar particle size, however, studies have shown that the activity
of Au is quite dependent on the particular synthesis method, preparation procedure,
and/or treatment process [54-58]. Furthermore, the study of the stability of Au
catalysts for ORR is quite lacking. In this work, the author did a systematic study of
synthesis and characterization of ultra-small gold particles. Both the initial activity and
stability have been discussed and compared to standard Pt/C. The result will provide
useful information for further developing Au-based catalyst.
Experiment
Catalyst Preparation
The synthesis procedure can be found elsewhere [59] . In a typical synthesis of
ultra-small gold nanoparticles, 0.1 g HAuCl4·3H2O (Alfa) was dissolved in 10 mL
tetralin (Sigma-Aldrich) and 10 mL oleyalmine (Sigma-Aldrich), all in a three-neck
round-bottom flask. The solution was stirred under Ar for 10 min at 30 ℃. After
obtaining a clear solution, 0.5 mmol TBAB (Tetra-n-butylammonium bromide, Sigma-
Aldrich) dissolved in 1 ml tetralin and 1 ml oleyalmine was injected into the reactor.
The solution color quickly changed from transparent to dark brown, indicating the
formation of Au nuclei. Growth of the nanoparticles was carried out for 1 h before
washing with hexane and ethanol.
To load the particles on carbon support, 20 mg Ketjen carbon was dispersed in
50 mL isopropanol. The hexane suspension with Au particles was added dropwise into
the carbon suspension under vigorous stirring. After sonicating for 30 min, the carbon
supported sample was washed with isopropanol for three times before further
characterization.
28
Transmission Electron Microscopy
The size of gold nanoparticles was determined using JEM-2010 F TEM in the
W.M. Keck Electron Microscopy Facility Center at the University of Delaware. In
preparing the samples for TEM, the carbon loaded sample was dispersed in iso-
propanol and sonicated to form dilute suspension. Then the Lacey Carbon copper grid
was coated with a drop of the mixture and dried thoroughly before loaded into the
TEM chamber.
Electrode Preparation
The electrochemical measurement was carried out similarly as described in
Chapter 3, aside from the preparation of the working electrode. To prepare the Au
electrode, the carbon supported catalyst was dispersed in isopropanol at a
concentration of 0.3 mg/mL. After sonication, 5 μL of suspension was transferred to
the glassy carbon electrode and dried rapidly under infrared lamp. For continuous
coverage, this step was repeated at least five times. Later, the electrode was treated by
ozone under ultraviolet radiation lamp (0.9 W) overnight to remove the organic
surfactant before running electrochemical measurements. In this study, the author
intentionally avoided the use of thermal treatment to remove the surfactant, since high
heat is known to cause changes in particle size of nano Au.
Results and Discussions
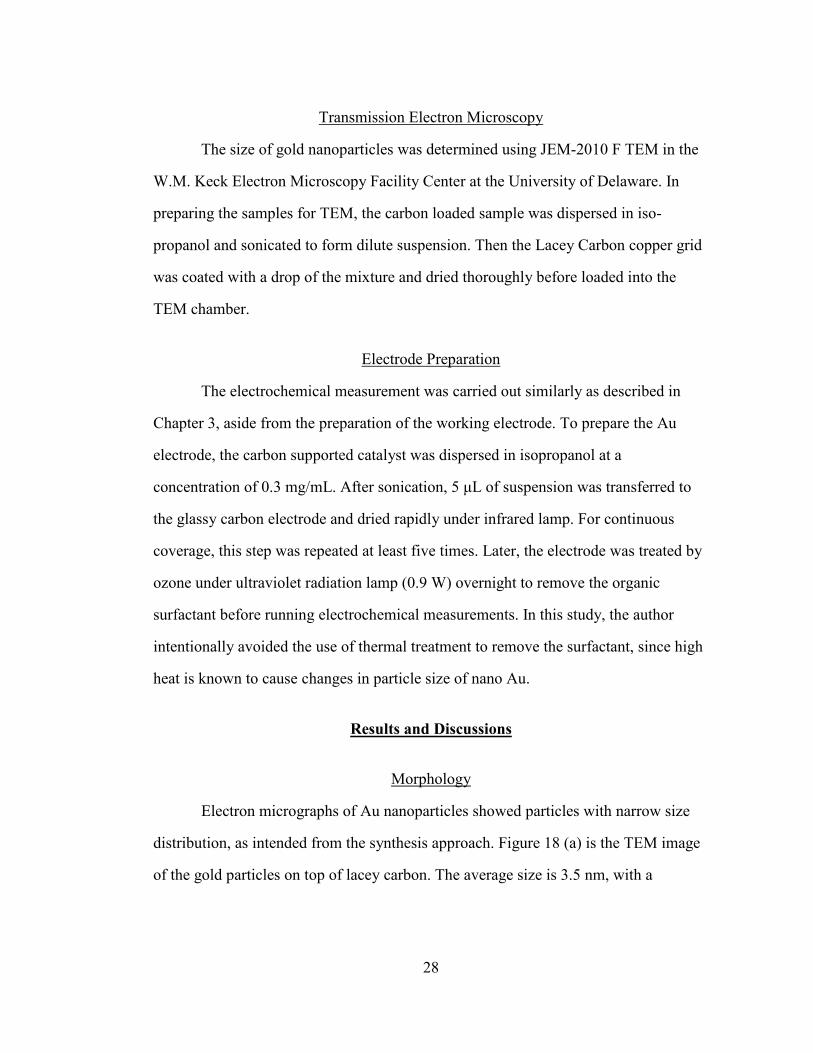
Morphology
Electron micrographs of Au nanoparticles showed particles with narrow size
distribution, as intended from the synthesis approach. Figure 18 (a) is the TEM image
of the gold particles on top of lacey carbon. The average size is 3.5 nm, with a

29
majority of particles ranging from 2.2 nm to 3.8 nm. EDAX shows no presence of
either N or Br, indicating the effective washing of the surfactant. The large Cu peak is
attributed to the TEM grid, as no Cu was used in the synthesis of the catalyst. For
brevity, the following discussions will be limited to Au particles of 3.5 nm.
Figure 18 (a) TEM image of free Au particles without carbon support; (b)
histogram of Au particles; and (c) EDAX of the particles.
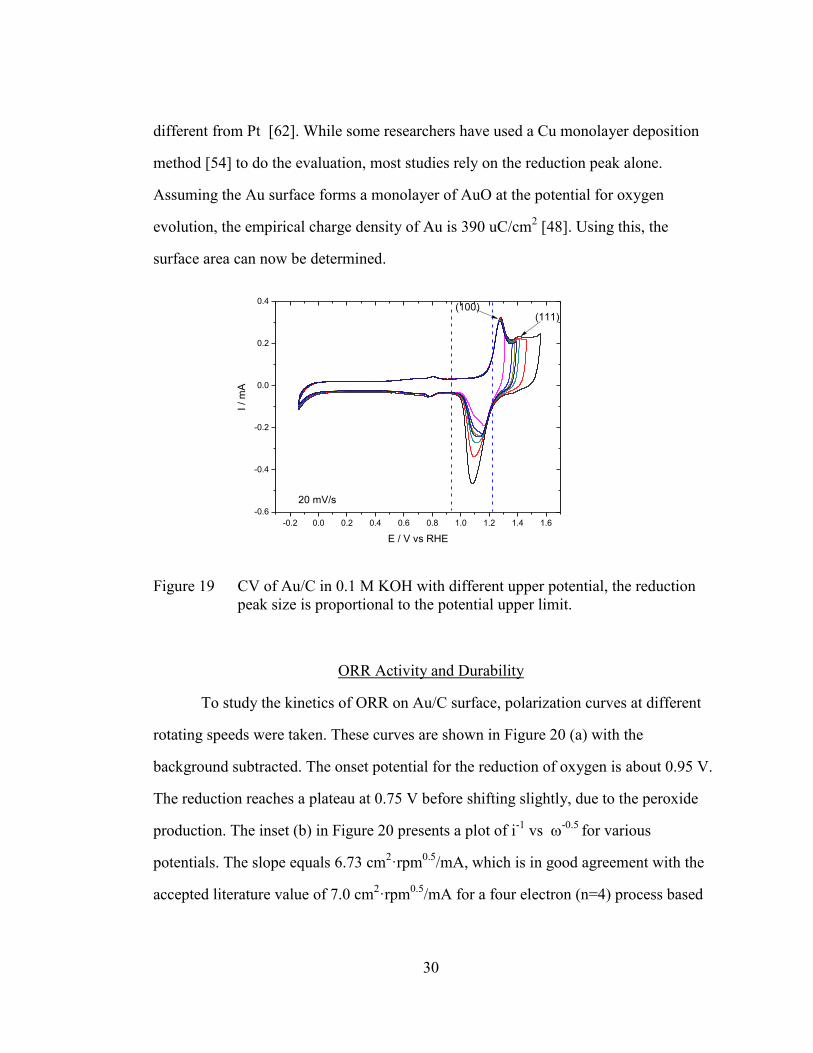
Cyclic Voltammetry
The cyclic voltammograms of Au/C with different scanning potential ranges
are summarized in Figure 19. The featureless region is apparent in the voltammogram
at potentials of 0.0 to 0.9 V, since Au has no response to hydrogen adsorption or
desorption under these conditions. From 0.9 to 1.2 V is the oxide reduction region, and
above 1.2 V is the oxide formation region. The degree of Au oxide formation is known
to be very sensitive to the sweeping potential [60, 61], and has been shown to correlate
to the size of the reduction peak, which is distinctly different when using different
sweeping potentials. In addition, the evaluation of active surface area of Au is quite
30
different from Pt [62]. While some researchers have used a Cu monolayer deposition
method [54] to do the evaluation, most studies rely on the reduction peak alone.
Assuming the Au surface forms a monolayer of AuO at the potential for oxygen
evolution, the empirical charge density of Au is 390 uC/cm2 [48]. Using this, the
surface area can now be determined.
-0.2 0.0 0.2 0.4 0.6 0.8 1.0 1.2 1.4 1.6
-0.6
-0.4
-0.2
0.0
0.2
0.4
I / m
A
E / V vs RHE
(100)(111)
20 mV/s
Figure 19 CV of Au/C in 0.1 M KOH with different upper potential, the reduction
peak size is proportional to the potential upper limit.
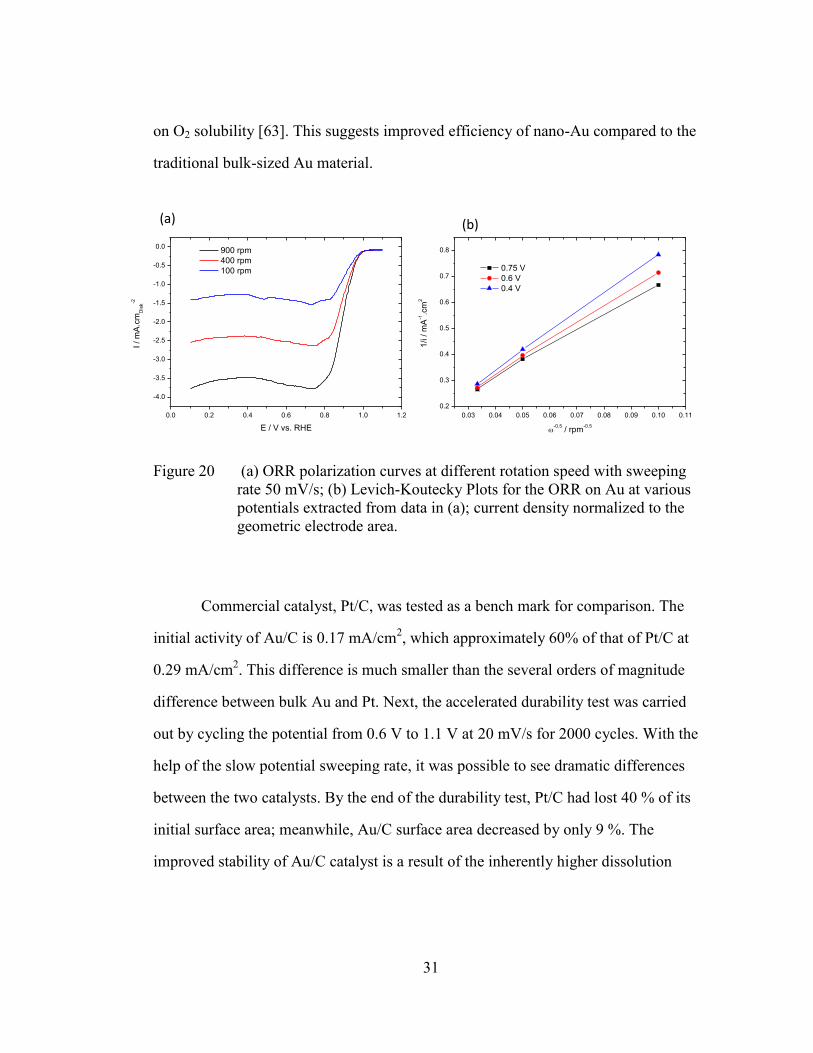
ORR Activity and Durability
To study the kinetics of ORR on Au/C surface, polarization curves at different
rotating speeds were taken. These curves are shown in Figure 20 (a) with the
background subtracted. The onset potential for the reduction of oxygen is about 0.95 V.
The reduction reaches a plateau at 0.75 V before shifting slightly, due to the peroxide
production. The inset (b) in Figure 20 presents a plot of i-1
vs -0.5
for various
potentials. The slope equals 6.73 cm2·rpm
0.5/mA, which is in good agreement with the
accepted literature value of 7.0 cm2·rpm
0.5/mA for a four electron (n=4) process based
31
on O2 solubility [63]. This suggests improved efficiency of nano-Au compared to the
traditional bulk-sized Au material.
Figure 20 (a) ORR polarization curves at different rotation speed with sweeping
rate 50 mV/s; (b) Levich-Koutecky Plots for the ORR on Au at various
potentials extracted from data in (a); current density normalized to the
geometric electrode area.
Commercial catalyst, Pt/C, was tested as a bench mark for comparison. The
initial activity of Au/C is 0.17 mA/cm2, which approximately 60% of that of Pt/C at
0.29 mA/cm2. This difference is much smaller than the several orders of magnitude
difference between bulk Au and Pt. Next, the accelerated durability test was carried
out by cycling the potential from 0.6 V to 1.1 V at 20 mV/s for 2000 cycles. With the
help of the slow potential sweeping rate, it was possible to see dramatic differences
between the two catalysts. By the end of the durability test, Pt/C had lost 40 % of its
initial surface area; meanwhile, Au/C surface area decreased by only 9 %. The
improved stability of Au/C catalyst is a result of the inherently higher dissolution
0.0 0.2 0.4 0.6 0.8 1.0 1.2
-4.0
-3.5
-3.0
-2.5
-2.0
-1.5
-1.0
-0.5
0.0
I / m
A.c
mD
isk
-2
E / V vs. RHE
900 rpm
400 rpm
100 rpm
0.03 0.04 0.05 0.06 0.07 0.08 0.09 0.10 0.11
0.2
0.3
0.4
0.5
0.6
0.7
0.8
1/i / m
A-1.c
m2
-0.5
/ rpm-0.5
0.75 V
0.6 V
0.4 V
(a) (b)

32
potential. With slower dissolution and redeposition kinetics, Au/C exhibits a much
smaller degradation than Pt/C as shown in Figure 21.
0.0 0.2 0.4 0.6 0.8 1.0 1.2
-6
-5
-4
-3
-2
-1
0
I / m
A.c
md
isk
-2 Au/C initial
Au/C after 2000 cycles
0.0 0.2 0.4 0.6 0.8 1.0 1.2
-6
-5
-4
-3
-2
-1
0
Pt/C initial
Pt/C after 2000 cycles
E / V vs RHE
ECSA Loss:
Au/C= 9%
Pt/C = 40%
Figure 21 ORR polarization curves of Au/C and Pt/C both at the beginning (solid
line) and at the end (dash line) of the durability test with ECSA loss
comparison inset.
Summary
Nanoscale Au on C catalyst has been studied in detail. During catalyst
synthesis, it was found that solvent washing and ozone treatment is an effective way to
remove the surfactant. The only drawbacks of this treatment are the uncertainty in the
mass loading of metal on the electrode, and difficulty in applying large amounts of
sample. Furthermore, Au/C exhibits activity approaching that of Pt/C, in addition to
exceptionally high stability under stressful test conditions. This result is very
encouraging for design of catalysts without Pt, as well as development of future Au-
based catalyst.

33
Chapter 5
SUMMARY AND CONCLUSION
In this thesis, the author first discussed and summarized the mechanism and
development of the electrochemical reduction of oxygen on Pt and Pt-based catalysts.
In the second part, two different types of catalysts were explored for fuel cell
application.
The author established a simple wet chemistry method to produce Pt/Sc2O3
catalyst via a one-pot synthesis approach. The sheet-like structure of Sc2O3 serves as
both a support and a protecting structure for Pt nanoparticles, at early stages of
durability testing. The tuning effect from the metal-support interaction was
demonstrated by XPS analysis. Remarkably, the Pt/Sc2O3/C catalyst shows three times
higher activity than the commercial Pt/C, under an acidic environment. Furthermore,
the ECSA loss of Pt/Sc2O3/C after a 30,000-cycles durability test is only one third of
Pt/C, demonstrating a much slower degradation rate.
The author also studied the activity of nano Au/C for fuel cell catalysis in
alkaline environments. Au/C with narrow size distribution was produced under mild
reaction conditions. Performance suggests that the catalyst utilized a 4-electron
transfer process during the reduction of oxygen. In addition, Au/C demonstrated
comparable activity to that of the commercial Pt/C. With a much higher dissolution
potential, the Au/C catalyst proved to be the more stable catalyst. Durability tests
showed only 9 % of the initial surface loss in Au/C, compared to that of 40 % in
commercial Pt/C.

34
The improved activity and enhanced stability of the catalysts just discussed
provide useful information for further research into fuel cell catalysis. Furthermore,
large scale catalyst synthesis should be carried out so that fuel cell MEA testing with
PEM or HEM can be performed, providing the stepping stones for commercialization.

35
REFERENCES
1. Steele, B.C.H. and A. Heinzel, Materials for fuel-cell technologies. Nature,
2001. 414(6861): p. 345-352.
2. Borup, R., et al., Scientific aspects of polymer electrolyte fuel cell durability
and degradation. Chemical Reviews, 2007. 107(10): p. 3904-3951.
3. Gasteiger, H.A., et al., Activity benchmarks and requirements for Pt, Pt-alloy,
and non-Pt oxygen reduction catalysts for PEMFCs. Applied Catalysis B-
Environmental, 2005. 56(1-2): p. 9-35.
4. Gu, S., et al., An efficient Ag-ionomer interface for hydroxide exchange
membrane fuel cells. Chemical Communications, 2013. 49(2): p. 131-133.
5. Gu, S., et al., Quaternary Phosphonium-Based Polymers as Hydroxide
Exchange Membranes. Chemsuschem, 2010. 3(5): p. 555-558.
6. Gu, S., et al., A Soluble and Highly Conductive Ionomer for High-Performance
Hydroxide Exchange Membrane Fuel Cells. Angewandte Chemie-International
Edition, 2009. 48(35): p. 6499-6502.
7. Gong, K.P., et al., Nitrogen-Doped Carbon Nanotube Arrays with High
Electrocatalytic Activity for Oxygen Reduction. Science, 2009. 323(5915): p.
760-764.
8. Spendelow, J.S. and A. Wieckowski, Electrocatalysis of oxygen reduction and
small alcohol oxidation in alkaline media. Physical Chemistry Chemical
Physics, 2007. 9(21): p. 2654-2675.
9. Liang, Y.Y., et al., Co3O4 nanocrystals on graphene as a synergistic catalyst
for oxygen reduction reaction. Nature Materials, 2011. 10(10): p. 780-786.
10. Bligaard, T., et al., The Bronsted-Evans-Polanyi relation and the volcano
curve in heterogeneous catalysis. Journal of Catalysis, 2004. 224(1): p. 206-
217.
11. Hammer, B. and J.K. Norskov, Theoretical surface science and catalysis -
Calculations and concepts. Advances in Catalysis, Vol 45, 2000. 45: p. 71-
129.
12. Greeley, J., et al., Alloys of platinum and early transition metals as oxygen
reduction electrocatalysts. Nature Chemistry, 2009. 1(7): p. 552-556.
13. Norskov, J.K., et al., Origin of the overpotential for oxygen reduction at a fuel-
cell cathode. Journal of Physical Chemistry B, 2004. 108(46): p. 17886-17892.
14. Greeley, J. and J.K. Norskov, Combinatorial Density Functional Theory-Based
Screening of Surface Alloys for the Oxygen Reduction Reaction. Journal of
Physical Chemistry C, 2009. 113(12): p. 4932-4939.

36
15. Greeley, J.P., J. Rossmeisl, and J.K. Norskov, Structure sensitivity and
stability of oxygen reduction reaction catalysts from first principles. Abstracts
of Papers of the American Chemical Society, 2007. 233.
16. Ferreira, P.J., et al., Instability of Pt/C electrocatalysts in proton exchange
membrane fuel cells - A mechanistic investigation. Journal of The
Electrochemical Society, 2005. 152(11): p. A2256-A2271.
17. Shao-Horn, Y., et al., Instability of Supported Platinum Nanoparticles in Low-
Temperature Fuel Cells. Topics in Catalysis, 2007. 46(3-4): p. 285-305.
18. Zhongwei Chen, et al., Supportless Pt and PtPd Nanotubes as Electrocatalysts
for Oxygen-Reduction Reactions. Angew Chem Int Ed Engl, 2007. 46(22): p.
4060-4063.
19. Liu, Z., et al., Atomic-Scale Compositional Mapping and 3-Dimensional
Electron Microscopy of Dealloyed PtCo3 Catalyst Nanoparticles with Spongy
Multi-Core/Shell Structures. Journal of The Electrochemical Society, 2012.
159(9): p. F554-F559.
20. Mundy, J.A., et al., Atomic-resolution chemical imaging of oxygen local
bonding environments by electron energy loss spectroscopy. Applied Physics
Letters, 2012. 101(4): p. 042907.
21. Yu, Y., et al., Three-dimensional tracking and visualization of hundreds of Pt-
Co fuel cell nanocatalysts during electrochemical aging. Nano Lett, 2012.
12(9): p. 4417-23.
22. Xin, H.L., et al., Atomic-resolution spectroscopic imaging of ensembles of
nanocatalyst particles across the life of a fuel cell. Nano Lett, 2012. 12(1): p.
490-7.
23. Toda, T., et al., Enhancement of the electroreduction of oxygen on Pt alloys
with Fe, Ni, and Co. Journal of The Electrochemical Society, 1999. 146(10): p.
3750-3756.
24. Paulus, U.A., et al., Oxygen reduction on carbon-supported Pt-Ni and Pt-Co
alloy catalysts. Journal of Physical Chemistry B, 2002. 106(16): p. 4181-4191.
25. Stamenkovic, V.R., et al., Improved oxygen reduction activity on Pt3Ni(111)
via increased surface site availability. Science, 2007. 315(5811): p. 493-7.
26. Paffett, M.T., J.G. Beery, and S. Gottesfeld, Oxygen Reduction at
Pt0.65cr0.35, Pt0.2cr0.8 and Roughened Platinum. Journal of The
Electrochemical Society, 1988. 135(6): p. 1431-1436.
27. Beard, B.C. and P.N. Ross, The Structure and Activity of Pt-Co Alloys as
Oxygen Reduction Electrocatalysts. Journal of The Electrochemical Society,
1990. 137(11): p. 3368-3374.
28. Jalan, V. and E.J. Taylor, Importance of Interatomic Spacing in Catalytic
Reduction of Oxygen in Phosphoric-Acid. Journal of The Electrochemical
Society, 1983. 130(11): p. 2299-2301.
29. Mukerjee, S., et al., Role of Structural and Electronic-Properties of Pt and Pt
Alloys on Electrocatalysis of Oxygen Reduction - an in-Situ Xanes and Exafs

37
Investigation. Journal of The Electrochemical Society, 1995. 142(5): p. 1409-
1422.
30. Stamenkovic, V.R., et al., Trends in electrocatalysis on extended and
nanoscale Pt-bimetallic alloy surfaces. Nature Materials, 2007. 6(3): p. 241-
247.
31. Greeley, J. and J.K. Nørskov, Electrochemical dissolution of surface alloys in
acids: Thermodynamic trends from first-principles calculations.
Electrochimica Acta, 2007. 52(19): p. 5829-5836.
32. Stamenkovic, V., et al., Surface composition effects in electrocatalysis:
Kinetics of oxygen reduction on well-defined Pt3Ni and Pt3Co alloy surfaces.
Journal of Physical Chemistry B, 2002. 106(46): p. 11970-11979.
33. <effect of surface composition on electronic structure.pdf>.
34. Greeley, J., Structural effects on trends in the deposition and dissolution of
metal-supported metal adstructures. Electrochimica Acta, 2010. 55(20): p.
5545-5550.
35. Zhang, J.L., et al., Controlling the catalytic activity of platinum-monolayer
electrocatalysts for oxygen reduction with different substrates. Angewandte
Chemie-International Edition, 2005. 44(14): p. 2132-2135.
36. Zhang, J.L., et al., Mixed-metal Pt monolayer electrocatalysts for enhanced
oxygen reduction kinetics. Journal of the American Chemical Society, 2005.
127(36): p. 12480-12481.
37. Zhang, J., et al., Platinum monolayer on nonnoble metal-noble metal core-shell
nanoparticle electrocatalysts for O-2 reduction. Journal of Physical Chemistry
B, 2005. 109(48): p. 22701-22704.
38. Ruban, A.V., H.L. Skriver, and J.K. Norskov, Surface segregation energies in
transition-metal alloys. Physical Review B, 1999. 59(24): p. 15990-16000.
39. Huang, S.Y., et al., Development of a Titanium Dioxide-Supported Platinum
Catalyst with Ultrahigh Stability for Polymer Electrolyte Membrane Fuel Cell
Applications. Journal of the American Chemical Society, 2009. 131(39): p.
13898-+.
40. Alia, S.M., et al., Platinum-Coated Palladium Nanotubes as Oxygen Reduction
Reaction Electrocatalysts. Acs Catalysis, 2012. 2(5): p. 858-863.
41. di Paola, C. and F. Baletto, Oxygen adsorption on small PtNi nanoalloys.
Physical Chemistry Chemical Physics, 2011. 13(17): p. 7701-7707.
42. Jong Yoo, S., et al., Enhanced stability and activity of Pt-Y alloy catalysts for
electrocatalytic oxygen reduction. Chem Commun (Camb), 2011. 47(41): p.
11414-6.
43. Nesselberger, M., et al., The particle size effect on the oxygen reduction
reaction activity of Pt catalysts: influence of electrolyte and relation to single
crystal models. Journal of the American Chemical Society, 2011. 133(43): p.
17428-33.

38
44. Escudero-Escribano, M., et al., Pt5Gd as a highly active and stable catalyst for
oxygen electroreduction. Journal of the American Chemical Society, 2012.
134(40): p. 16476-9.
45. Stephens, I.E.L., et al., Oxygen Electroreduction Activity and X-Ray
Photoelectron Spectroscopy of Platinum and Early Transition Metal Alloys.
ChemCatChem, 2012. 4(3): p. 341-349.
46. Stephens, I.E.L., et al., Understanding the electrocatalysis of oxygen reduction
on platinum and its alloys. Energy & Environmental Science, 2012. 5(5): p.
6744.
47. Bezerra, C.W.B., et al., A review of heat-treatment effects on activity and
stability of PEM fuel cell catalysts for oxygen reduction reaction. Journal of
Power Sources, 2007. 173(2): p. 891-908.
48. Trasatti, S. and O.A. Petrii, Real Surface-Area Measurements in
Electrochemistry. Pure and Applied Chemistry, 1991. 63(5): p. 711-734.
49. Wang, C., et al., Synthesis of Homogeneous Pt-Bimetallic Nanoparticles as
Highly Efficient Electrocatalysts. Acs Catalysis, 2011. 1(10): p. 1355-1359.
50. Wang, C., et al., Design and Synthesis of Bimetallic Electrocatalyst with
Multilayered Pt-Skin Surfaces. Journal of the American Chemical Society,
2011. 133(36): p. 14396-14403.
51. Wang, C., et al., Monodisperse Pt3Co nanoparticles as electrocatalyst: the
effects of particle size and pretreatment on electrocatalytic reduction of
oxygen. Physical Chemistry Chemical Physics, 2010. 12(26): p. 6933-6939.
52. Alia, S.M., et al., Porous Platinum Nanotubes for Oxygen Reduction and
Methanol Oxidation Reactions. Advanced Functional Materials, 2010. 20(21):
p. 3742-3746.
53. Haruta, M., Size- and support-dependency in the catalysis of Gold. Catalysis
Today, 1997.
54. Wei Tang, Galen D. Stucky, and E.W. McFarland, Size-Dependent Activity of
Gold Nanoparticles for Oxygen Electroreduction in Alkaline Electrolyte. J.
Phys. Chem. C, 2008.
55. Hernandez, J., et al., Electrochemistry of Shape-Controlled Catalysts: Oxygen
Reduction Reaction on Cubic Gold Nanoparticles. J. Phys. Chem. C, 2007.
56. Chen, W. and S. Chen, Oxygen electroreduction catalyzed by gold
nanoclusters: strong core size effects. Angew Chem Int Ed Engl, 2009. 48(24):
p. 4386-9.
57. El-Deab, M.S., T. Okajima, and T. Ohsaka, Electrochemical Reduction of
Oxygen on Gold Nanoparticle-Electrodeposited Glassy Carbon Electrodes.
Journal of The Electrochemical Society, 2003. 150(7): p. A851.
58. Yagi, I., T. Ishida, and K. Uosaki, Electrocatalytic reduction of oxygen to
water at Au nanoclusters vacuum-evaporated on boron-doped diamond in
acidic solution. Electrochemistry Communications, 2004. 6(8): p. 773-779.
59. Peng, S., et al., A facile synthesis of monodisperse Au nanoparticles and their
catalysis of CO oxidation. Nano Research, 2008. 1(3): p. 229-234.

39
60. Hamelin, A., Cyclic Voltammetry at Gold Single Crystal Surfaces. Journal of
Electroanalytical Chemistry, 1996.
61. Burke, L.D., J.M. Moran, and P.F. Nugent, Cyclic voltammetry responses of
metastable gold electrodes in aqueous media. Journal of Solid State
Electrochemistry, 2003. 7(9): p. 529-538.
62. Trasatti, S. and O.A. PeterII, Real Surface Area Measurements in
Electrochemistry. .I. Electroanal. Chem., 1992.
63. Gubbins, K.E. and R.D. Walker, Solubility and Diffusivity of Oxygen in
Electrolytic Solutions. Journal of The Electrochemical Society, 1965. 112(5):
p. 469-&.