Embed Size (px)
Citation preview

SYNTHESIS AND CHARACTERIZATION OF HIGH OXYGEN
STORAGE CAPACITY NANOPARTICLES DISPERSED DIESEL
FOR THE EMISSION REDUCTION AND PERFORMANCE
ENHANCEMENT OF A DIRECT INJECTION ENGINE
A thesis submitted in partial fulfillment of the requirements
for the award of the degree of
DOCTOR OF PHILOSOPHY
by
N. SHANMUGA PRIYA
(Roll No. 11610327)
Department of Mechanical Engineering
Indian Institute of Technology Guwahati
Guwahati – 781039
INDIA
December 2015

Department of Mechanical Engineering
Indian Institute of Technology Guwahati
Guwahati-781039, Assam, India
______________________________________________________________________________
CERTIFICATE
It is certified that the work contained in the thesis entitled “Synthesis and characterization of
high oxygen storage capacity nanoparticles dispersed diesel for the emission reduction and
performance enhancement of a direct injection engine” submitted by Mrs. N. Shanmuga
Priya to the Indian Institute of Technology Guwahati for the award of degree of Doctor of
Philosophy has been carried out under our supervision in the department of Mechanical
Engineering, Indian Institute of Technology Guwahati. This work has not been submitted
elsewhere for the award of any other degree or diploma.
Dr. S. Kanagaraj
Associate professor
Department of Mechanical Engineering
Indian Institute of Technology Guwahati
Dr. Chandramohan Somayaji
Assistant professor
Department of Mechanical Engineering
Indian Institute of Technology Guwahati

Dedicated to
My Parents (Late) Mr.P.Natesan and
Mrs.N.Vasavi
and
My Grand Parents (Late) Mr.M.Marappan
and Mrs.M.Rangammal

Acknowledgement
I would like to express my gratitude to my supervisor Dr. S. Kanagaraj for his confidence,
kindness, and patience with me for all these years. I would also thank my co-supervisor Dr.C.
Somayaji for his timely suggestions. I would also thank my Doctoral committee members Prof.
P. Mahanta, Dr. Amaresh Dalal, Dr. Anil Verma and Dr. K. Pakshirajan for continually
reviewing the progress of my work with valuable suggestions and constructive criticism to
improve the quality of the thesis. I also deeply acknowledge Prof. D. Chakraborty, Prof. P.
Mahanta and A. K. Dass for extending various facilities in the department of mechanical
engineering during the tenure of my research work.
I wish to express my sincere thanks to the technical staff from the department of Mechanical and
Chemical Engineering, Department of physics and Central instruments facilities for their timely
help. I am greatly indebted to Prof. D. K. Mahanta, The faculty in-charge of heat engine Lab,
Mechanical department, Assam Engineering College, Guwahati, for his permission and
cooperation to carryout engine related studies in ACE. I would like to acknowledge Assam
pollution control board, Assam, for exhaust emission analyzer. I also thank Dr. Sakthivel,
Postdoc fellow, Israel Institute of Technology, Israel, for the chemical stoichiometry calculation.
I would like to thank Dr. Sree Sree Shivakumara Swamiji Head of Sree Siddaganga Mutt, for his
blessings with holiness for the completion of this thesis in addition with Dr. M.N.
Channabasappa, Director of Siddaganga Institute of Technology, and Dr. Shivakumaraiah,
Principal SIT, Tumkur for their kind help and support from the college. I also thank the staff
members and colleagues for helping me in various fields.

Acknowledgement
The support received from the summer Internship students Petchammal, Balasubramaniam,
wishely, Vishal and Hareesh at different stages of my work is also acknowledged. I would like to
thank my labmates and friends Sreekanth, Vignesh, Avanish, Devarshi, Urmila, Saumes,
Maharana, Barsha, Pushpendra, Naresh, Charan, Sridhar, Muthuraja, Jonney, Santosh, Manish,
Suresh and Srevanthi who made my work memorable. A special thanks to Arun and Satheesh for
their support during various experimentations.
I would like to thank my husband Shanmuga Sundaram and my son Deekshith Balaji for
supporting me in the completion of this thesis in various ways by taking all the responsibility.
Their unconditional love and support inspired me to do hard work with dedication. I am also
thankful for my sisters Vadivu and Usha for their moral support. I extend my thanks to my
cousins and relatives, who filled my absence in various needs.
Finally, I express my sincere thanks to all who helped me in whatever form during my stay at IIT
Guwahati and successful completion of this thesis.
I gratefully thank the supreme Almighty God, who has showered his blessings on me in various
ways to make me stand for what I am today.
N. Shanmuga Priya
19th
December, 2014 IIT Guwahati

i
Abstract
In order to meet the increase in stringent regulation for exhaust gas emission from diesel vehicles,
an exhaust-gas-after-treatment has become an essential process in most of the countries leading to
use diesel particulate filters and catalytic converters as a treatment device. The effective utilization
of the fuel is one of most essential requirements by considering the depletion of fossil fuel. Hence,
there is a need to increase the effective utilization of different types of fuel in an engine without
making any changes in the system. The objective of present work is to improve the performance and
reduce the harmful emission of a diesel engine by homogenously dispersing the nanosized high
oxygen storage capacity (OSC) materials of CZY (C=Ce; Z=Zr; Y= Al, Mn, Bi, La, Nd) oxides in
diesel, named as a nanofuel. An attempt was made to synthesize nanoparticles having the improved
OSC, which were homogenously dispersed in diesel with the help of oleic acid as a surfactant in
order to meet the objectives. Cerium based solid solutions were prepared by sol-gel process and
characterized. It is observed that the synthesized solid solutions had stable cubic fluorite structure,
higher OSC, lattice defects and <10 nm crystallite size. The quantitative and qualitative studies on
OSC of different solid solutions were done using suitable characterization techniques. It was
observed that the cerium based solid solutions of Ce0.6Zr0.2Al0.26O2, Ce0.6Zr0.2Al0.39O2 and
Ce0.6Zr0.2Mn0.2O2 were found to have the higher OSC in a decreasing order, where the CeO2 and
Ce0.6Zr0.4O2 were considered as base materials. The OSC of base materials was increased if the
doping element has lower ionic radius than the cerium. A tip sonicator, magnetic stirrer and a
combination of both were used systematically to verify their versatility for the preparation of stable
nanofuel. Though different types of surfactant based on anionic, cationic and nonionic were
attempted, the ceria based nanofuel synthesized using Tween 80 as a surfactant and the combined
preparation technique yielded a more stable nanofuel with the dispersion stability of 100 % for the
period of 24 hrs and 99 % stability for 48 hrs. An accelerated sedimentation technique using
centrifuge was also proposed to study the influence of ageing on the dispersion stability of nanofuel
and it was found that the nanoparticles were settled completely after 620 hrs. The optimum
concentration of nanoparticles to be dispersed in diesel was selected as 0.06 wt. % based on the
performance enhancement study using CeO2 based nanofuel, where the brake thermal efficiency and
mechanical efficiency of an engine were increased by 12.8 and 9.2 %, respectively. In addition, the

Abstract
ii
brake specific fuel consumption and frictional power were decreased by 11.3 and 20.8 %,
respectively. The relative stability of CeO2, Ce0.6Zr0.4O2, Ce0.6Zr0.2Al0.26O2, Ce0.6Zr0.1Al0.39O2 and
Ce0.6Zr0.2Mn0.2O2 dispersed diesel was found to be 87, 88, 88, 91 and 89.5 %, respectively, at 0.06
wt. % after 168 hrs of synthesize. It was found that the properties of diesel were not varied
significantly by dispersing different types of nanoparticle at 0.06 wt. %. When highest OSC material
Ce0.6Zr0.2Al0.26O2 was dispersed in diesel and tested, it was observed that the brake thermal
efficiency and mechanical efficiency of an engine were found to be increased by 20.7 and 8.2 %,
respectively with respect to diesel at 100 % loading conditions and the brake specific fuel
consumption and frictional power were decreased by 17.1 and 15.3 %, respectively. If only
mechanical efficiency is considered, Ce0.6Zr0.4O2 dispersed diesel was observed to show 11 %
enhancement in comparison to that of diesel at 100 % loading condition. The highest reduction of
NOx, CO and hydrocarbon was found to be 68, 60 and 44 %, respectively, when 0.06 wt. % of
Ce0.6Zr0.2Al0.26O2 based nanofuel was used in an IC engine at 100 % loading. A field study was also
carried out with high OSC nanoaprticles dispersed diesel, where the utilization period of
Ce0.6Zr0.2Al0.26O2 based nanofuel was increased by 25±1 % compared to that of pure diesel. In
addition, the maximum utility time of CeO2, Ce0.6Zr0.4O2, Ce0.6Zr0.2Mn0.2O2 and Ce0.6Zr0.1Al0.39O2
dispersed diesel was noted to be 5±1, 17±1, 20±2 and 22 %, respectively. Thus, the
Ce0.6Zr0.2Al0.26O2 based nanofuel is recommended to be effectively used in an IC engine in order to
enhance the performance of an engine and to reduce its emission, which can be commercially
explored.

CONTENTS
Page No.
ABSTRACT……………………………………………………………………………………...i
CONTENTS………………………………………………………………………….…….........iii
LIST OF FIGURES…………………………………………………………………………......vi
LIST OF TABLES………………………………………………………………………............xi
Chapter 1. INTRODUCTION
1.1 Indian energy and emission scenario in world context ....................................................... 1
1.2 Emission and its standards ................................................................................................ 2
1.3 Effects of exhaust pollution............................................................................................... 4
1.4 Solutions to meet energy demand and emission issues ...................................................... 4
1.5 Advantages and limitations of a diesel engine ................................................................... 4
1.6 Biodiesel and its limitations .............................................................................................. 5
1.7 Diesel additives and combustion catalysts ......................................................................... 5
1.8 Ceria as an oxidation catalyst ............................................................................................ 7
1.9 Possible effects of nanoparticles deposition emission and environmental implications ...... 8
1.9 Organization of thesis ..................................................................................................... 10
Chapter 2. LITERATURE REVIEW
2.1 High oxygen storage capacity (OSC) materials ............................................................... 11
2.1.1 Ceria- zirconia solid solutions ............................................................................... 12
2.1.2 Ceria – zirconia with other metals.......................................................................... 16
2.1.3 Evaluation of OSC of a material ............................................................................ 18
2.2. Nanoparticles characterization ....................................................................................... 25
2.2.1 Structural characterization ..................................................................................... 25
2.3 Synthesis of nanofluid..................................................................................................... 26
2.4 Quality characterization of nanofluid .............................................................................. 28
2.4.1 Dispersion stability of nanofluid ............................................................................ 29
2.4.2 Fuel properties....................................................................................................... 30
2.5 Experimental studies on engine performance and emission level ..................................... 30
2.6 Technical gap ................................................................................................................. 33
2.7 Objectives of the work .................................................................................................... 33
iii

Contents
iv
Chapter 3. MATERIALS AND METHODS
3.1 Raw materials ................................................................................................................. 35
3.2 Synthesis of nanoparticles ............................................................................................... 36
3.3 Synthesis of nanofuel ...................................................................................................... 38
3.4 Characterization of nanoparticles .................................................................................... 41
3.4.1 Structural analysis - X-Ray diffractometer (XRD) ................................................. 41
3.4.2 Lattice vibration studies- Raman spectroscopy ...................................................... 43
3.4.3 Image studies - Transmission electron microscope (TEM) ..................................... 43
3.4.4 Oxygen storage capacity studies- Thermogravimetric analyzer (TGA) .................. 44
3.4.5 Thermal expansion studies – Thermomechanical analyzer (TMA) ......................... 45
3.5 Quality characterization of nanofuel ............................................................................... 46
3.5.1 Dispersion stability studies- UV-Vis Spectrophotometer ....................................... 46
3.6 Characterization of nanofuel ........................................................................................... 48
3.6.1 Surface tension study - Tensiometer ...................................................................... 48
3.6.2 Flash and Fire point temperature measurement - Pensky-Martens open type
apparatus ............................................................................................................... 49
3.6.3 Thermal conductivity measurement - KD 2 pro Thermal properties analyzer ......... 50
3.6.4 Viscosity measurement- Rheometer ...................................................................... 50
3.7 Performance and emission studies in an Internal Combustion Engine ............................. 51
3.7.1 IC engine Test rig .................................................................................................. 51
3.7.2 Emission studies - Gas Analyzer and emission monitor ......................................... 52
3.8 Field Study ..................................................................................................................... 53
Chapter 4. RESULTS AND DISCUSSION
4.1 Synthesize of ceria based high oxygen storage capacity (OSC) materials ........................ 55
4.1.1 Selection of a suitable technique to synthesize CexZr1-xO2 (0.4≤ x≤0.8) solid
solutions based on their OSC ................................................................................. 55
4.1.2 Structural analysis of Ce0.6Zr0.4-xY1.3xO2 (CZY) and Ce0.6Zr0.4-xMnxO2 (CZM)
(x=0.0, 0.1, 0.2, 0.3, 0.4; Y=Al, Bi, La, Nd) .......................................................... 59
4.1.3 Quantitative studies on oxygen storage capacity (OSC) of CZY and CZM solid
solutions by thermogravimetric analysis ................................................................ 74

Contents
v
4.1.4. TEM studies on high OSC solid solutions ............................................................. 83
4.1.5 Qualitative confirmation of OSC ........................................................................... 87
4.1.5.1 Lattice vibration studies............................................................................ 87
4.1.5.2 Studies on thermal expansion ................................................................... 91
4.1.5.3 Lattice defects confirmation ..................................................................... 95
4.2 Optimization of surfactant and synthesis technique to prepare nanofuel .......................... 99
4.2.1 Influence of surfactant on the stability of nanofuel................................................. 99
4.2.2 Influence of preparation technique on the relative stability of nanofuel ................ 103
4.2.3 Accelerated relative stability study ...................................................................... 109
4.3 Optimization of ceria concentration for the performance enhancement of an
IC engine ..................................................................................................................... 111
4.4 Studies on high OSC nanoparticles dispersed diesel ...................................................... 119
4.4.1 Studies on the dispersion stability of nanofuel ..................................................... 119
4.4.2 Characterization of nanofuel ................................................................................ 122
4.5 Engine performance with high OSC nanoparticle (0.06 wt. %) dispersed diesel
(Nanofuel) and emission studies .................................................................................... 127
4.5.1 Engine performance studies ................................................................................. 127
4.5.2 Exhaust gas analysis using high OSC nanoparticles (0.06 wt. %) dispersed diesel
(Nanofuel) ........................................................................................................... 135
4.6 Field trial on nanofuels ................................................................................................. 145
Chapter 5. CONCLUSIONS AND FUTURE SCOPE
5.1 Conclusions……………………………………………………………………………...149
5.2 Scope of future work…………………………………………………………………….152
References……………………………………………………………………………………..155
List of Publications…………………………………………………………………………….165
Annexure – I……...…………………………………………………………………………….168

vi
List of Figures
Page No.
Figure 1.1 World energy consumption by region during 1990-2030 [source: EIA] ..................... 1
Figure 1.2 Global energy related emission as on 2009 [source: EIA] .......................................... 2
Figure 1.3 Stringent Euro norms for automobile vehicle [source: EIA] ....................................... 3
Figure 1.4 Dependence of Ceria toxicity on particle size [Shcherbakov et al. 2011] .....................9
Figure 3.1 Flow chart for the Co-precipitation preparation technique to synthesize CexZr1-xO2
solid solutions ......................................................................................................... 36
Figure 3.2 Flow chart for the sol-gel preparation technique to synthesize CexZr1-xO2 ................ 37
Figure 3.3 A setup to synthesize the nanoparticles as per COP and sol-gel technique
(a) Microfluidics pump, b) Magnetic stirrer, c) pH meter ........................................ 38
Figure 3.4 Tip sonicator ........................................................................................................... 39
Figure 3.5 Different samples prepared using tip sonicator ........................................................ 40
Figure 3.6 Preparation of nanofuel using magnetic stirrer ......................................................... 41
Figure 3.7 Bruker D8 advance powder X-Ray diffractometer ................................................... 42
Figure 3.8 Laser micro Raman spectroscopy ............................................................................ 43
Figure 3.9 Transmission electron microscope ........................................................................... 44
Figure 3.10 Thermogravimetric analyzer .................................................................................. 45
Figure 3.11 Thermomechanical Analyzer ................................................................................. 46
Figure 3.12 UV - Vis spectrophotometer .................................................................................. 47
Figure 3.13 Tensiometer........................................................................................................... 48
Figure 3.14 Flash and Fire point temperature measuring instrument ......................................... 49
Figure 3.15 KD 2 Pro - Thermal conductivity measuring instrument ........................................ 50
Figure 3.16 Anton-Paar Rheometer .......................................................................................... 51
Figure 3.17 IC engine test rig ................................................................................................... 52
Figure 3.18 Exhaust gas analyzer and emission monitor ........................................................... 52
Figure 3.19 Suction and drained nanofuel line in the nanofuel reservoir ................................... 53
Figure 3.20 Three diesel generators used for field trial ............................................................. 54

List of Figures
vii
Figure 4.1 XRD patterns of CexZr1-xO2 (0.4≤x≤0.8) solid solutions prepared by (a) COP and
(b) Sol-gel method .................................................................................................. 56
Figure 4.2 Raman spectra of CexZr1-xO2 prepared by (a) COP and (b) Sol-gel method .............. 58
Figure 4.3 TEM images of Ce0.6Zr0.4O2 prepared by (a) COP and (b) Sol-gel method ............... 58
Figure 4.4 XRD patterns of fresh Ce0.6Zr0.4-xAl1.3xO2 samples................................................... 60
Figure 4.5 XRD patterns of aged Ce0.6Zr0.4-xAl1.3xO2 solid solutions ......................................... 61
Figure 4.6 XRD patterns of fresh Ce0.6Zr0.4-xMnxO2 samples .................................................... 63
Figure 4.7 XRD patterns of aged Ce0.6Zr0.4-xMnxO2 samples ..................................................... 64
Figure 4.8 XRD patterns of fresh Ce0.6Zr0.4-xBi1.3xO2 samples ................................................... 66
Figure 4.9 XRD patterns of aged Ce0.6Zr0.4-xBi1.3xO2 samples ................................................... 67
Figure 4.10 XRD patterns of fresh Ce0.6Zr0.4-xLa1.3xO2 samples ................................................ 69
Figure 4.11 XRD patterns of aged Ce0.6Zr0.4-xLa1.3xO2 samples ................................................. 70
Figure 4.12 XRD patterns of fresh Ce0.6Zr0.4-xNd1.3xO2 samples ................................................ 72
Figure 4.13 XRD patterns of aged Ce0.6Zr0.4-xNd1.3xO2 samples ................................................ 72
Figure 4.14 Weight loss of the CZY and CZM solid solutions during the second heating cycle:
(a) Ce0.6Zr0.4-xAl1.3xO2, (b) Ce0.6Zr0.4-xMnxO2, (c) Ce0.6Zr0.4-xBi1.3xO2,
(d) Ce0.6Zr0.4-xLa1.3xO2, (e) Ce0.6Zr0.4-xNd1.3xO2 ................................................. 76
Figure 4.15 OSC of Ce0.6Zr0.4-xY1.3xO2 and Ce0.6Zr0.4-xMnxO2 (Y= Al, Nd, La, Bi; 0≤x≤0.04)
samples ................................................................................................................. 80
Figure 4.16 Comparison of OSC and specific surface area (SSA) of different solid solutions with
respect to Ce0.6Zr0.4O2............................................................................................ 82
Figure 4.17 (i-iv) TEM images of fresh Ce0.6Zr0.2Al0.26O2 at different magnification ................ 84
Figure 4.18 (i-iv) TEM images of fresh Ce0.6Zr0.2Mn0.2O2 at different magnification ................ 85
Figure 4.19 (i-ii) TEM images of fresh Ce0.6Zr0.2Bi0.39O2.......................................................... 85
Figure 4.20 TEM image of fresh Ce0.6Zr0.2La0.26O2 ................................................................... 86
Figure 4.21 TEM image of fresh Ce0.6Zr0.2Nd0.13O2 .................................................................. 87
Figure 4.22 Raman spectra of fresh Ce0.6Zr0.4-xAl1.3xO2 solid solutions ..................................... 88
Figure 4.23 Raman spectra of aged Ce0.6Zr0.4-xAl1.3xO2 solid solution ....................................... 89
Figure 4.24 Raman spectra of fresh Ce0.6Zr0.4-xMnxO2 samples ................................................. 90

List of Figures
viii
Figure 4.25 Raman spectra of aged Ce0.6Zr0.4-xMnxO2 samples ................................................. 91
Figure 4.26 Thermal expansion behavior of Ce0.6Zr0.4-xAl1.3xO2 samples.................................. 92
Figure 4.27 A schematic representation about transverse thermal vibration of M-O-M Bond,
Evans et al. [1998] ................................................................................................. 92
Figure 4.28 Coefficient of thermal expansion (CTE) of Ce0.6Zr0.4-xAl1.3xO2 at different
temperature range .................................................................................................. 93
Figure 4.29 Thermal expansion behavior of Ce0.6Zr0.4-xMnxO2 samples .................................... 94
Figure 4.30 Coefficient of thermal expansion of Ce0.6Zr0.4-xMnxO2 at different
temperature range .................................................................................................. 94
Figure 4.31 HRTEM image and filtered image of CeO2 without significant lattice defect ......... 95
Figure 4.32 HRTEM images of Ce0.6Zr0.4O2, (i) filtered image without lattice defect,
(ii) Filtered image with lattice defect-edge dislocation and (iii) Filtered image with
lattice defect- edge dislocation ............................................................................... 96
Figure 4.33 HRTEM images of Ce0.6Zr0.2Al0.26O2 (i) - (v) Filtered image with lattice defects .. 97
Figure 4.34 HRTEM image of Ce0.6Zr0.2Mn0.2O2 (i-iv) Filtered image with lattice defects ........ 98
Figure 4.35 Influence of different surfactants on the relative stability of nanofuel having 0.06 wt.
% of CeO2 ........................................................................................................... 100
Figure 4.36 Electrostatic stabilization mechanism of (a) CTAB and (b) SDS surfactant on
Nanofuel ............................................................................................................. 101
Figure 4.37 Steric stabilization mechanism of Non-ionic surfactant ........................................ 102
Figure 4.38 Relative stability of nanofuel prepared by magnetic stirrer for 72 hrs ................... 104
Figure 4.39 Relative stability of nanofuel prepared by tip sonicator for 168 hrs ...................... 105
Figure 4.40 Comparison of relative stability of 0.06 wt. % nanofuel ....................................... 106
Figure 4.41 XRD patterns of derived CeO2 nanoparticle from nanofuel .................................. 108
Figure 4.42 TEM images of nanofuel drop synthesized by the a) Magnetic stirring, b) Tip
sonication, c) Combined technique in 20nm scale, d) Combined technique in 50nm
scale .................................................................................................................... 109
Figure 4.43 Predicted relative stability of nanofuel up to 620 hrs period of time- nanofuel
synthesized by combined technique ..................................................................... 110

List of Figures
ix
Figure 4.44 Accelerated relative stability with curve fitting for CeO2 nanofuel
at 0.06 wt. % ....................................................................................................... 110
Figure 4.45 Effect of ceria concentration and load on BTE of an IC engine ............................ 113
Figure 4.46 Increase in BTE while nanofuel usage compared to diesel in an IC engine at different
concentration of CeO2 nanoparticles .................................................................... 114
Figure 4.47 Effect of concentration of ceria nanoparticles on BSFC of an engine ................... 114
Figure 4.48 Decrease in BSFC compared to diesel with respect to CeO2 concentration........... 115
Figure 4.49 Effect of CeO2 concentration on frictional power of an IC engine ........................ 116
Figure 4.50 Decrease in frictional power of an engine with respect to diesel ........................... 117
Figure 4.51 Effect of CeO2 concentration on mechanical efficiency of an IC engine ............... 118
Figure 4.52 Increase in mechanical efficiency compared to diesel with respect to CeO2
concentration ....................................................................................................... 118
Figure 4.53 Relative stability studies on nanofuel based on (a) CeO2, (b) Ce0.6Zr0.4O2, (c)
Ce0.6Zr0.2Al0.26O2, (d) Ce0.6Zr0.1Al0.39O2, (e) Ce0.6Zr0.2Mn0.2O2 ............................. 120
Figure 4.54 Effect of concentration and duration on relative stability of high OSC nanoparticle
dispersed diesel ................................................................................................... 122
Figure 4.55 Effect of high OSC nanoparticles on the surface tension of diesel ........................ 123
Figure 4.56 Effect of high OSC nanoparticles on the flash point temperature of diesel ........... 124
Figure 4.57 Effect of high OSC nanoparticles on the fire point temperature of diesel ............. 124
Figure 4.58 Effective thermal conductivity of nanofuel having different concentration of
nanoparticles ....................................................................................................... 125
Figure 4.59 Effect of 0.06 wt. % OSC nanoparticles on viscosity of nanofuel at room
temperature ......................................................................................................... 126
Figure 4.60 Effect of high OSC nanoparticles in diesel at 0.06 wt. % on BSFC ...................... 128
Figure 4.61 Decrease in BSFC of an engine using 0.06 wt. % nanofuel with respect
to diesel ............................................................................................................... 129
Figure 4.62 Effect of high OSC nanoparticles in diesel at 0.06 wt. % on BTE of an engine .... 130
Figure 4.63 Increase in BTE of an engine using 0.06 wt. % nanofuel with respect to diesel .... 130

List of Figures
x
Figure 4.64 Effect of high OSC nanoparticles in diesel at 0.06 wt. % on frictional power of an
engine ................................................................................................................. 131
Figure 4.65 Effect of high OSC nanoparticles in diesel at 0.06 wt. % on mechanical efficiency of
an engine ............................................................................................................. 132
Figure 4.66 Increase in mechanical efficiency of an engine using 0.06 wt. % nanofuel with
respect to diesel ................................................................................................... 133
Figure 4.67 Effect of nanoparticles in diesel at 0.06 wt. % on CO emission ............................ 135
Figure 4.68 Decrease in CO emission with different types of nanofuel at 0.06 wt. % in
comparison with diesel ........................................................................................ 136
Figure 4.69 Effect of nanoparticles in diesel at 0.06 wt. % on hydrocarbon emission .............. 137
Figure 4.70 Decrease in hydrocarbon emission with different nanofuel at 0.06 wt. % in
comparison with diesel ........................................................................................ 138
Figure 4.71 Effect of nanoparticles in diesel at 0.06 wt. % on NOx emission .......................... 139
Figure 4.72 Decrease in NOx emission with different types of nanofuel at 0.06 wt. % in
comparison with diesel ........................................................................................ 140
Figure 4.73 Effect of nanoparticles in diesel at 0.06 wt. % on CO2 emission........................... 141
Figure 4.74 Increase in CO2 emission with different types of nanofuel at 0.06 wt. % in
comparison with diesel ........................................................................................ 142
Figure 4.75 Effect of nanofuel at 0.06 wt. % on running time of different capacity of diesel
generators at no load condition ............................................................................ 146
Figure 4.76 Increase in running time of different capacity of diesel generators using nanofuel at
0.06 wt. % compared to diesel ............................................................................. 147

xi
List of Tables
Page No.
Table 2.1 Influence of preparation methods and precursors on the size of Ce-Zr solid
solution .................................................................................................................... 14
Table 2.2 Comparative studies on different OSC measurement techniques ............................... 19
Table 2.3 Influence of different catalysts and specific surface area on OSC from selected
literatures ................................................................................................................. 24
Table 4.1 Structural parameters and OSC of CexZr1-xO2 solid solutions prepared by COP and sol-
gel (SOL) method ..................................................................................................... 57
Table 4.2 Crystallite size, d-spacing and lattice constant of fresh and aged Ce0.6Zr0.4-xAl1.3xO2
(CZA) solid solutions ............................................................................................... 62
Table 4.3 Crystallite size, d-spacing and lattice constant of fresh and aged Ce0.6Zr0.4-xMnxO2
(CZM) solid solutions .............................................................................................. 65
Table 4.4 Crystallite size, d-spacing and lattice constant of fresh and aged Ce0.6Zr0.4-xBi1.3xO2
(CZB) solid solutions ............................................................................................... 68
Table 4.5 Crystallite size, d-spacing and lattice constant of fresh and aged Ce0.6Zr0.4-xLa1.3xO2
(CZL) solid solutions................................................................................................ 71
Table 4.6 Crystallite size, d-spacing and lattice constant of fresh and aged Ce0.6Zr0.4-xNd1.3xO2
(CZN) solid solutions ............................................................................................... 73
Table 4.7 BET specific surface area for high OSC nanoparticles .............................................. 83
Table 4.8 Relative stability of nanofuel based on the synthesis technique ............................... 107
Table 4.9 One week relative stability studies on nanofuels ..................................................... 121
Table 4.10 Engine performance parameters of an engine and their changes with respect to diesel
using high OSC nanoparticles at 0.06 wt. % ........................................................... 134
Table 4.11 Engine exhaust emission of high OSC nanoparticles dispersed diesel against loading
and different type of nanofuel ............................................................................... 144
1
Chapter 1
Introduction
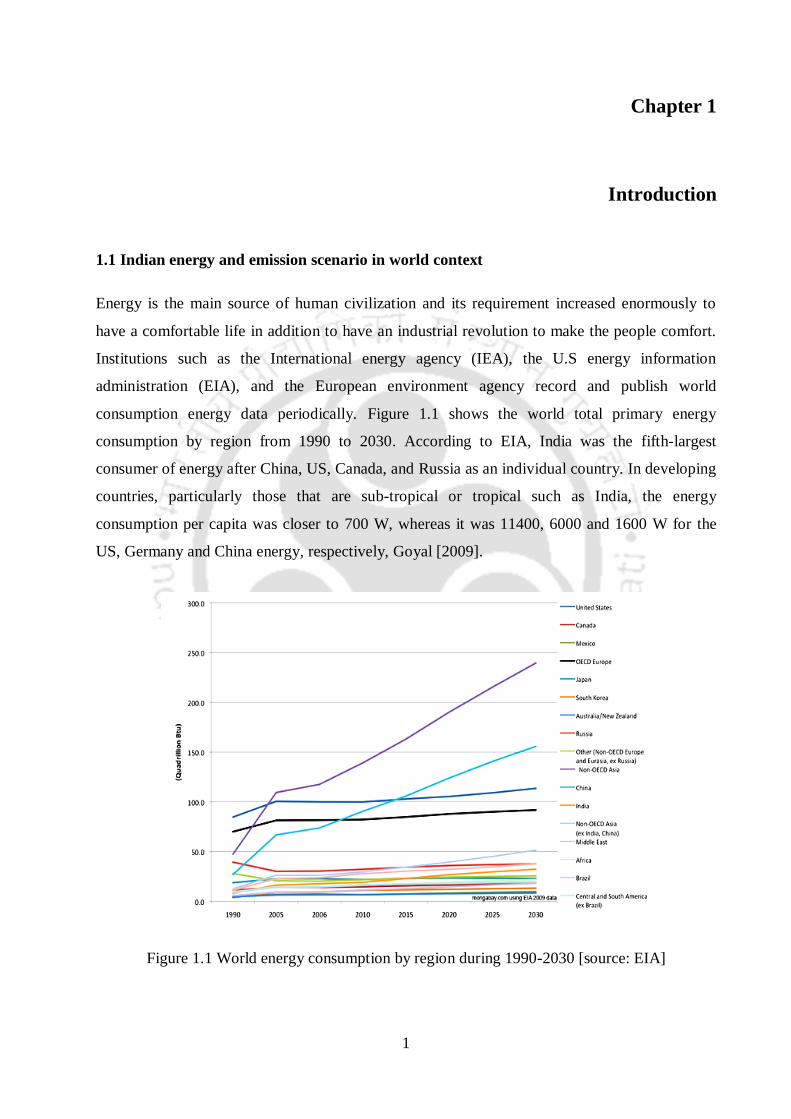
1.1 Indian energy and emission scenario in world context
Energy is the main source of human civilization and its requirement increased enormously to
have a comfortable life in addition to have an industrial revolution to make the people comfort.
Institutions such as the International energy agency (IEA), the U.S energy information
administration (EIA), and the European environment agency record and publish world
consumption energy data periodically. Figure 1.1 shows the world total primary energy
consumption by region from 1990 to 2030. According to EIA, India was the fifth-largest
consumer of energy after China, US, Canada, and Russia as an individual country. In developing
countries, particularly those that are sub-tropical or tropical such as India, the energy
consumption per capita was closer to 700 W, whereas it was 11400, 6000 and 1600 W for the
US, Germany and China energy, respectively, Goyal [2009].
Figure 1.1 World energy consumption by region during 1990-2030 [source: EIA]

Chapter 1 Introduction
2
In case of global energy related emissions, India was the fifth largest emitter by region as on
2009, which is shown in Figure 1.2. The developed countries like Japan, Canada and Australia
stood after India in energy related emission. In India, nearly 29.5% of energy was produced from
crude oil source after the coal source. According to EIA, as on 2013, the oil consumption by
India was around 3.7 million barrels per day, whereas the total oil production was less than 1
million barrels per day. The increased gap between production and consumption led to energy
imbalance in India, which is one of the most important developing countries in the world.
Figure 1.2 Global energy related emission as on 2009 [source: EIA]
1.2 Emission and its standards
The environmental protection agency of USA designates size criteria pollutants for determining
the air quality. These are carbon monoxide (CO), nitrogen oxides (NO/NO2/NOx), sulfur dioxide
(SO2), ground level ozone (O3), and a particulate matter. Petroleum-fueled vehicles, engines and
industrial processes directly produce the majority of CO and NOx in the atmosphere. They are
also principal sources of gases such as hydrocarbon, which combine with NOx in sunlight to
create O3. Petroleum- fueled transportation and coal-burning power plants are considered to be
the main causes of global warming. Excess amounts of carbon dioxide, methane and NOx,
among other gases trap the heat in the atmosphere and create the green house effect. The
emission target protocol was adopted at Kyoto in 1997 and came into force in 2005. According
to Kyoto protocol, carbon dioxide, methane, nitrous oxide, fluorinated gases, hydrofluorocarbon
(HFC), perfluorocarbon (PFC) and sulphur hexafluoride (SF6) were named as green house gases.
Carbon dioxide (CO2) is a main constituent of petroleum fuel exhaust. As it is not toxic, it is not

Chapter 1 Introduction
3
classified as a pollutant. About one-third of CO2 emitted into the atmosphere every year comes
from the vehicle exhaust. Methane (CH4), although usually associated with natural gas, is also
emitted whenever crude oil is extracted, transported, refined, or stored. Under Kyoto protocol,
37 industrialized and developed countries accepted to cap carbon production from power stations
and industrial installation, while developing countries such as India and China were mandated to
take measures but without caps. As per Kyoto protocol, the countries must reduce total green
house gas emission by 2012 in comparison to 1990 level.
European emission standards define the acceptable limits for exhaust emission from vehicles.
The emission standards are defined as a series of European Union directives staging the
progressive introduction of increasingly stringent standards. For each vehicle type, different
standards were applicable according Euro norms. For diesel vehicle, as per Euro V standards, the
CO, particulates, nitrogen oxides and combined emission of hydrocarbon and nitrogen oxides
were 500, 5 (80 % reduction of emission in comparison to the Euro IV standard), 180 (20 %
reduction of emission in comparison to the Euro IV standard), 230 mg/km, respectively. Figure
1.3 shows the stringent emission standards started from Euro I to Euro VI. According to the
Euro VI norms, the combined emission of hydrocarbon and nitrogen oxide was found to be
reduced completely.
Figure 1.3 Stringent Euro norms for automobile vehicle [source: EIA]

Chapter 1 Introduction
4
1.3 Effects of exhaust pollution
Problems generated due to engine exhaust can be divided as follows:
1. Local effects - e.g. poisoning human breathing air
2. Regional effects - fallout from airborne pathogens-infection, particles, chemicals
3. Global effects - changing the interaction among the atmosphere, ocean and sun, weather
effects, effects on plants and the ocean biosphere.
For human, the exhaust pollution contributes to an increased risk of death, non-allergic
respiratory symptoms and disease. Hydrocarbon has the potential to cause cancer. NOx forms
nitric acid, and irritates the eyes, throat and respiratory system. Carbon monoxide reduces the
flow of oxygen in the blood stream and is particularly dangerous to persons with heart disease.
However, carbon dioxide does not directly impair human health, but it is a green house gas that
traps the earth heat and contributes to the potential for global warming.
1.4 Solutions to meet energy demand and emission issues
The awareness is increased by the public and government towards human health hazards
presented by the atmospheric pollution from the combustion products of fossil fuels. Added to
the pollution caused by the automobile industries, stringent emission norms and the increase in
crude oil prices due to rapid industrial growth are forced to think about the energy efficient,
environmental friendly and combustion enhanced fuel in terms of bio fuel and/or the fuel added
with additives and catalysts.
1.5 Advantages and limitations of a diesel engine
The major use of a diesel engine is found in the area of power production, commercial
transportation, industrial sectors and agricultural machineries due to its ease of operation and
more power per unit of fuel i.e. higher fuel economy. Added to the above, the diesel engine has
several advantages over other fuel engines, which are as follows:
1. The specific fuel consumption of a diesel engine is better than the petrol engine.
2. The cost of diesel is lower than the petrol, which is helpful to have reduced running cost.
3. Due to low vapour pressure, the fuel is considered to be safer than the petrol in many
applications including marine engines, and it is immune to vapor lock.

Chapter 1 Introduction
5
4. Waste heat through the cooling water jacket and exhaust is less
Though the diesel engine has the above advantages in addition to high thermal efficiency,
rigidity, simplicity in structures and fuel economy, its use in an automobile industry is limited
due to the generation of high emission level compared to that of a petrol engine. It has motivated
the researchers to come up with new technologies to control the emission generated from a
diesel engine in different possible ways.
1.6 Biodiesel and its limitations
Though one of the major alternatives for above discussed problems is the biofuel, its acceptance
level is very low because of different factors including the lack of supply, economic constraints,
etc. As an alternative to diesel or diesel blend, the biodiesel is expected to meet the present and
future energy demand. Biodiesel is derived from the renewable domestic sources such as
vegetable oil and animal fat, which are non-toxic, biodegradable, eco-friendly and more reliable
compare to fossil fuel as it forms low level of carbon and smoke, which are responsible for the
global warming. On the other hand, biodiesel has higher molecular weight, density, viscosity,
cold flow and pour point than the conventional diesel. The characteristics of biodiesel cause low
volatility, poor fuel atomization, injector choking, piston ring sticking and incomplete
combustion. The characteristics and properties of biodiesel limit its use in cold or chill weather.
Depending on the blend ratio of biodiesel in diesel, NOx emission is reported to be higher with
respect to pure diesel.
1.7 Diesel additives and combustion catalysts
A large variety of fuel additives is added to the diesel to improve the engine efficiency and
reduce the emission. The various fuel characteristics such as the volatility and sulfur content in
the fuel, which affect the particulate emission can be altered by the use of fuel additives. It
helped to reduce the high temperature leading to short ignition delay in a diesel engine. Many
research activities on the influence of fuel additives on the performance of an engine and its
emission level were focused, Keskin et al. [2008]. The emission of NOx was also controlled by
adding suitable additives in the fuel.
There are two groups of catalysts such as metal containing catalysts and ash free catalysts being
studied in a diesel engine. Metal containing compounds are claimed to be more effective than the

Chapter 1 Introduction
6
ash free catalysts, which are used as combustion catalysts for hydrocarbon fuels. These are
proved to be most effective not only for reducing the CO or hydrocarbon but also adsorption of
particulate matter and reduction of NOx.
The metal based catalysts are manganese, iron, sodium, copper, barium, cerium, calcium and
platinum, which have the high catalytic activity in combustion process. The metal based
catalysts reduced the diesel engine emission and fuel consumption. The reason for emission
reduction is that the metal based catalyst reacted with water to produce hydroxyl radicals to
enhance the soot oxidation or it reacted with the carbon atoms in the soot lowering its oxidation
temperature, Yang et al. [1998]. In order to perform the above required functions, the catalysts
are required to have the following characteristics, Zhu et al. [2012]:
1) They must be soluble or insoluble in diesel homogenously without settling or agglomeration
during its application, storage, and on-board consumption.
2) They must have excellent catalytic activity to promote the hydrocarbon combustion.
3) The characteristics of fuel should not change significantly and it should not generate the
secondary pollution by adding the catalysts in fuel.
The metal based catalysts are either manufactured in the form of the organometallic compounds
or nanoparticles. The nanoparticles are in the range of 0.1 to 100 nm, which are small enough to
approach molecular dimension, and their properties are significantly different from those of
larger, and micrometer sized particles. At such dimension, the surface area to volume ratio of the
particles increased considerably and using of them enhanced the contact between the fuel and
oxidizer, Luca et al. [2005]. One of the major reasons for the efficiency improvement of an
engine is the high surface area to volume ratio of nanoparticles compared to conventional
powder, as the catalytic reaction is essentially a surface phenomenon. As the nanoparticles affect
the rate of chemical reactions, the ignition delay period is expected to decrease. It has also been
reported that dispersing nanoparticles in diesel increased the ignition probability of the mixture,
Tyagi et al. [2008] and it was proposed to disperse them in the high temperature zone for direct
oxidation reaction, rapid energy release and enhanced propulsive performance with increased
density impulse. In addition to that the nanoparticles enhanced the thermal conductivity and
mass diffusivity, Shafii et al. [2011].

Chapter 1 Introduction
7
1.8 Ceria as an oxidation catalyst
In recent years, a special attention has been given to synthesize and characterize the solid
solutions based on cerium oxide (CeO2) for the cleaning of automotive emission including diesel
exhaust, because the redox properties of the catalysts can contribute to lower the emission,
Masui et al. [2006]. CeO2 is found to be widely used as an automotive three-way catalyst (TWC)
for exhaust gas treatment device because of its attractive characteristics such as low temperature
reduction, large specific surface area and cubic structure. It enables to operate the after-
combustion-device more efficiently irrespective of the fuel mixture in an IC engine, Kaspar et al.
[2003]. Because of its redox and acido-basic surface characteristics, it is also employed in fluid
catalytic cracking, Trovarelli et al. [2001], SOx removal, Cao et al. [2010], ethylbenzene
dehydro-generation, Hirano [1986] and the water gas shift reaction, Wang et al. [2006]. Due to
wide range of applications of rare-earth metal oxides like ceria, more emphasis is being given by
many research scientists in the related area of research. The inherent attractive characteristics
such as an elevated oxygen transport capacity, which is also called as oxygen storage capacity
(OSC), associated with the ability of changing the valency state from Ce3+
to Ce4+
or vice versa
made ceria for the many different applications, Egchi et al. [2011]. The redox characteristics of
ceria were more effective when the particles were in the range of nanosize, Yetter et al. [2009].
The main role of ceria in catalytic applications is to provide oxygen buffering capacity during
the rich/lean oscillation of exhaust gases. Ceria has the ability to donate its oxygen for the
oxidation of CO and hydrocarbon during the oxygen deficient portion and absorb excess oxygen
for the reduction of NOx. The required oxygen for complete combustion of the fuel can be
supplied by the ceria when it was used during the combustion stage.
Ceria nanoparticles dispersed in biodiesel increased the total combustion heat, while the
concentration of smoke and NOx was decreased in the exhaust of a diesel engine, Sajith et al.
[2010]. Another important advantage of nanoparticles in liquid fuel is their size, because there is
no chance for fuel injector and filter clogging as in the case of micron sized particles, Ganesh et
al. [2011]. Addition of low boiling point component in diesel also promoted the spray
evaporation and mixture formation processes, Li et al. [2009a]. The dispersion of ceria in diesel
caused significant changes in light-off temperature, and kinetics of oxidation. The oxidation rate
was also increased with the addition of ceria in diesel, Jung et al. [2005]. In order to ensure the
same characteristics of ceria dispersed diesel and pure diesel, the nanoparticles are always

Chapter 1 Introduction
8
dispersed in tiny amounts at ppm level in diesel. It was found that the use of ceria as a TWC was
explored in automobile applications. In order to reduce the engine exhaust emission and improve
its enhanced performance, an attempt is being made to enhance the oxygen storage capacity of
ceria and its application in engine performance as a nanofuel, nanoparticles dispersed diesel.
1.9 Possible effects of nanoparticles deposition emission and environmental implications
Humans have been exposed to nanoparticles throughout their evolutionary phases; however, this
exposure has been increased to a great extent in the past century because of the industrial
revolution. Nanoparticles constitute a part of particulate matter (PM). Epidemiological studies
have shown that urban pollution with airborne PM deriving from combustion sources such as
motor vehicle and industrial emissions contributes to respiratory and cardiovascular morbidity
and mortality [Pope et al. 2001, Peters et al. 2002, Brook et al. 2004). Thus, combustion-derived
nanoparticles and their characteristics have been largely by Medina et al. [2007]. In addition, the
relevance of health effects of those particles is as follows:
Size – In addition to being able to cross cell membranes, they can reach the blood and
various organs because of their very small size. Due to their high surface area to volume
ratio, more molecules of the chemicals are expected to present on the surface. It may be
one of the reasons why nanoparticles are generally more toxic than larger particles of the
same composition.
Chemical composition and surface characteristics – The toxicity of nanoparticles depends
on the chemical composition of nanoparticles and the composition of chemicals adsorbed
on their surfaces. However, the surfaces of nanoparticles can be modified in order to
make them less harmful to health.
Shape – Although there is little definitive evidence, the health effects of nanoparticles are
likely to depend also on their shape. A significant example is nanotubes, which may be
of a few nanometres in diameter but with a length that could be several micrometres. A
recent study showed a high toxicity of carbon nanotubes which seemed to produce
harmful effects by an entirely new mechanism, different from the normal model of toxic
dusts

Chapter 1 Introduction
9
However the ceria based nanoparticles dispersed in diesel were found to reduce the particulate
matter (PM) from the engine exhaust. Cassee et al. [2012] exposed the Atherosclerosis-prone
apolipo protein E knockout (APOE-/-)
mice in the CeO2 engine exhaust and observed that
addition of CeO2 nanoparticles to fuel decreased the number of particles in exhaust and may
reduce atherosclerotic burden associated with exposure to standard diesel fuel. From the
extensive assessment of biological parameters performed, the only concerning effect of cerium
addition was a slightly raised level of cytokines in a region of the central nervous system.
Figure1.4 Dependence of Ceria toxicity on particle size [Shcherbakov et al. 2011]
Shcherbakov et al. [2011] studied the physical and chemical properties of CeO2, which was
suggested to be a highly bioactive material. Fig. 1 indicates the dependence of Ceria toxicity on
particle size. As it is observed from Fig. 1.4, the dependence of toxicity of ceria on particle size
must have a nonmonotonic character. With decreasing the size of nanocrystalline ceria
nanoparticles below an anomalous decrease of toxicity of ceria nanoparticles was observed. The
given fact is connected with a sharp increase in the oxygen nonstoichiometry of particles and
growth of the content of Ce3+
in its composition. The decrease in toxicity of ceria particles and
growth of antioxidant (reductive) activity continue up to particles of subnanometer sizes.
Overall, the use of cerium as a fuel catalyst is potentially useful way to limit the health effects of
vehicle exhaust. However, further testing is required to ensure that such an approach is not
associated with a chronic inflammatory response which may eventually cause long-term health
effects.

Chapter 1 Introduction
10
1.10 Organization of thesis
The present thesis is organized into five chapters. Chapter 1 gives an idea about the energy
requirement for India, the stringent pollution norms, human health issues due to pollution and
global environment issues. The solution was explored in detail and presented its feasibility to use
as an alternate for diesel fuel. Fuel additives and fuel catalyst in the form of metal were
introduced along with their advantages. Metal based ceria catalyst and its various applications
are also briefly described. The overall organization of thesis was also described.
Chapter 2 presents a literature review in the field of ceria as high oxygen storage materials and
its limitation. The literature was also given in support to the high OSC ceria based material, OSC
evaluation techniques, nanoparticles characterization, synthesis of nanofluid, quality
characterization of nanofluid, and experimental studies on engine performance and emission
reduction.
Chapter 3 gives the detailed description of the techniques involved in the nanoparticles and
nanofuel preparation and their characterization. It also gives the methodology to measure OSC,
thermal expansion studies, engine performance and field study. All the methodologies were
explained with the help of pictorial views of the relevant equipments / instruments.
Chapter 4 describes the results and discussion on the optimization of ceria based solid solution
composition through quantitative and qualitative studies. Reasons for the enhanced fuel
characteristics, performance and reduced emission were also presented. Field study using diesel
generators and their enhanced performance were discussed with the help of experimental
findings.
Chapter 5 presents a gist of overall work, prominent results obtained and salient findings from
the thesis work. A conclusion note and the future direction for the present work were also
briefed.

11
Chapter 2
Literature review
Metals in combustion received large interest as a result of the ability to produce oxygen while
heating. The ability of a material to reversibly accept or contribute oxygen to its surrounding is
the basis of use of a metal or its solid solution in catalytic applications, and it is referred as the
oxygen storage capacity (OSC). It is the notable and highly desirable characteristic of nanosized
metals during the heating.
The OSC of Three-way catalyst (TWC) enables great reduction of more harmful products of
exhaust emission such as unburned hydrocarbon, CO, NOx and CO2. The TWC provides oxygen
to CO and hydrocarbon under rich fuel conditions and extract oxygen from NOx under lean fuel
conditions. Though the use of TWC in the exhaust manifold has been explored significantly, the
use of cerium based oxides as a catalyst in fuel to improve its combustion efficiency and reduce
the emission level is yet to be explored in detail.
2.1 High oxygen storage capacity (OSC) materials
Cerium based oxides continue to attract researchers and industries, because of their potential use
in catalytic applications in various fields. Ceria is especially interesting among the rare earth
metal oxides because of its ability to change the valency state from Ce4+
to Ce3+
or vice versa. In
cerium based oxides, the electronic re-configuration is associated with loss or addition of
oxygen, which can be triggered at relatively low temperature in the range of 300-800 °C by the
changes in the partial pressure of oxygen in gas with solid contact, Ozawa et al. [2000] and
Crozier et al. [2008]. When oxygen vacancies are present in a metal, these ions can move
through the lattice easily giving rise to oxygen ion conductivity. It plays an important role in the
catalytic applications because the oxygen vacancies can move rapidly from surface to bulk or
vice versa.
When ceria is used as a catalyst, it stores excess oxygen during the reduction process of NOx and
releases oxygen for the oxidation of CO and unburned hydrocarbon, which was due to its ability
to switchover between Ce4+
and Ce3+
oxidation states depending on the partial pressure of

Chapter 2 Literature review
12
oxygen in the exhaust gas composition. The redox property of ceria is more effective if it is in
the range of nanometer size, Sayle et al. [2005].
Hirano et al. [1999] synthesized the ultrafine CeO2 (cerium (IV) oxide) powder in the range of
10-25 nm under hydrothermal condition in the presence of urea with a precursor of cerium (IV)
sulfate and cerium (IV) ammonium sulfate. They investigated the effect of concentration of urea
and hydrothermal treatment temperature on the morphology and crystallite size of the
synthesized particles and reported that the crystallinity and particle size of ceria were observed
to be decreased with an increase of urea concentration.
Hirano et al. [2000] prepared the crystalline cerium (IV) oxide nanoparticles by thermal
hydrolysis with cerium di-ammonium nitrate as a precursor. The prepared nanoparticles were
mixed with H2SO4 or (NH4)2SO4 to find the effect of SO42-
on the ceria particles. The obtained
nanoparticles were in the range of 10 nm size. In the presence of H2SO4, the nanosized crystals
were found to be agglomerated into large spherical particles of 150-180 nm.
Rao et al. [2003] studied the structural and redox properties of ceria and ceria based materials. It
was reported that the fluorite structure of ceria was retained up to 900 K under reduced
atmosphere. The lattice constant was found to be increased with reduction temperature
indicating the lattice expansion of its crystal structure, which was attributed to the reduction of
Ce4+
ions into Ce3+
.
Though the low temperature reduction, large specific surface area and cubic structure are the
inherent attractive characteristics of ceria for the higher OSC, the change of cubic structure of
CeO2 into hexagonal Ce2O3 and the reduction of specific surface area observed in the
temperature range of 1017-1170 K are the major limitations of using CeO2 as a fuel catalyst.
2.1.1 Ceria- zirconia solid solutions
In order to overcome the inherent limitations of CeO2 as discussed above, the Zr4+
was doped in
the cubic CeO2 structure resulting the enhanced thermal stability, redox property and catalytic
activity. It was observed that the reducible Ce4+
and its thermal stability were increased with
Zr/Ce ratio, Vlaic et al. [1997].

Chapter 2 Literature review
13
Ceria- zirconia solid solution exits in three different structures namely monoclinic, tetragonal,
and cubic. Cubic and monoclinic structure are thermally stable below 1300 K, whereas the
tetragonal phase is a metastable structure and it is prepared by high temperature ceramic method,
which is a solid state reaction in the composition range of 10-50 mol% of ceria. It was also
observed that the kinetics of redox process was favorable for the cubic phase compared to
tetragonal and monoclinic, Vlaic et al. [1999].
Rossignol et al. [1999] compared the OSC of synthesized CexZr1-xO2 material by co-
precipitation and sol-gel method using different precursors and it was confirmed that the
maximum value of OSC was not obtained for the same composition prepared by sol-gel and co-
precipitation technique. Sol-gel prepared CexZr1-xO2 had the highest OSC in case of
0.75≤x≤0.98, whereas co-precipitated oxides showed a plateau at x ≥ 0.5.
Deshpande et al. [2004] synthesized highly stable Ce1-xZrxO2 nanoparticle solid solutions (x=
0.0, 0.1, 0.2, 0.3... 1) by hydroxide co-precipitation method with cerium ammonium nitrate and
zirconyl chloride as precursors. The size of the nanoparticles obtained from their study was 3.5
nm for CeO2 and 2.5 nm for ZrO2. Dhage et al. [2004] synthesized Ce0.75Zr0.25O2 at 100 °C by
the sol-gel technique with the precursors of ceric nitrate and zirconium oxychloride, where the
particle size was observed to be 5 nm whereas the same obtained from glycine nitrate process
and microwave hydrothermal technique was noted to be 35 and 6 nm, respectively. They also
suggested that the microstructural stability of the sample could be improved by doping suitable
cations such as Zr 4+
, Al3+
and Si4+
.
Wang et al. [2006] synthesized Ce0.5Zr0.5O2 by spray freezing method and calcined at different
temperature. It was observeded that the crystallite size and reduction temperature of the sample
were increased from 6 to 12 nm and 486 to 731 °C, respectively, when the calcination
temperature of the sample was increased from 500 to 1000 °C. Gateshki et al. [2007] synthesized
CeO2-ZrO2 by sol-gel technique with the starting precursor of ammonium cerium nitrate and
zirconyl chloride.
Table 2.1 gives the information about different preparation techniques, types of precursor used
and the particle size of Ce-Zr solid solutions. Since the size of the solid solution depends on the
preparation technique and its starting precursor, various synthesize routes were explored.

Chapter 2 Literature review
14
Table 2.1 Influence of preparation methods and precursors on the size of Ce-Zr solid solution
Synthesize
method
Material
composition
Starting
Precursors
Size
(nm)
Remarks Reference
Combustion
Emulsion
Method
ZrO2-CeO2 Nitrates of
zirconium and
cerium
10 A single phase solid
solution of ZrO2-CeO2
with wide range of
composition
Takatori et
al. [1999 ]
Direct
precipitate -
hydrothermal
condition
CeO2-ZrO2 Ammonium
cerium nitrate,
zirconium oxy
chloride
8-10 Decrease in crystallite size
and increase in specific
surface area with an
increase of Zr/Ce ratio
Hirano et
al. [2003]
Sol- gel Ce0.7 Zr0.3O2 Nitrates of
cerium and
zirconium
7.3
Solid solution provided
more active oxygen
species
Ping et al.
[2008]
Sol- gel ZnO:CeO2 Ethanolic
suspension of
Zn(CH3COO)2.
2H2O, Cerium
nitrate
- Ultrafine material for
optical UV filters
Lima et al.
[2009]
Co-precipitation Mesostructured
Ce0.6 Zr0.4O2
zirconium
n-propoxide,
ammonium
cerium (IV)
nitrate
4 Mesostructure collapsed
after 1000 °C
Changlin et
al. [2009 a]
Ultrasonic-
assisted
membrane
reaction
Ce1-xZrxO2 (x=
0.4, 0.5, 0.6,
0.8)
Nitrates of
cerium and
zirconium
4.7 -
6
Lower Ce/Zr ratio
showed better texture
characteristics and high
OSC
Meng et al.
[2010]

Chapter 2 Literature review
15
Modeshia et al. [2007] studied cerium titanate pyrochlore (Na1/3Ce2/3)2Ti2O7 prepared by
hydrothermal precipitation reaction. It was observed that the prolonged exposure of the sample
at above ambient temperature was attributed to the growth of the particle size, which was not
having any influence on the reduction temperature of the sample. They confirmed that the
fluorite type structure was largely responsible for low temperature reduction rather than the high
specific surface area of nanocrystalline material.
Zhang et al. [2007] synthesized Ce0.6Zr0.4O2 by co-precipitation, sol-gel, solution combustion
and surfactant-assistant method. It was concluded that (i) CexZr1-xO2 obtained by co-
precipitation technique had high specific surface area which was decreased with temperature, (ii)
CexZr1-xO2 prepared by solution combustion technique had highest activity, and the particle size
was increased by thermal treatment at 900 °C.
OSC was influenced by textural, morphological and structural modification of CeO2-ZrO2,
Xiaodong et al. [2007]. A thin zirconia coated ceria was not promoting or degrading the OSC of
the enveloped ceria core. Ceria-zirconia solid solution prepared by co-precipitation technique
showed better OSC than the physical preparation or ceria coating on zirconium or vice versa.
Prasad et al. [2009] reported that the replacement of cerium ions by cations modified the ion
mobility, and the change in lattice resulted the formation of a defective fluorite structured solid
solution. Such modifications in the defect structure of ceria are able to confer new properties to
the material, such as better resistance to sintering at high temperature. They synthesized
CexZr1-xO2 (x= 1, 0.7, 0.4, 0.2, 0) solid solution using nitrates of cerium and zirconium by sol-gel
method. The obtained nanoparticles had the cubic fluorite structure, a mixture of monoclinic and
tetragonal phases and size of 15-30 nm diameter. They also suggested that the stabilization of
cubic structure at intermediate composition was achieved with decrease in particle size of the
mixed oxide.
From the above literature, it is concluded that the ceria doped with Zr4+
ions enhanced the
oxygen mobility, OSC and the reduction or oxidation at low temperature. The method of
preparation of the sample also influenced the dispersion/incorporation of Zr4+
in ceria. It was
observed that the thermal stability of CeO2-ZrO2 was increased with Zr/Ce ratio. The cubic
structure, which favored for high oxygen mobility in CeO2-ZrO2 was maintained at high Zr/Ce
ratio.

Chapter 2 Literature review
16
2.1.2 Ceria – zirconia with other metals
From the recent studies, it is observed that the formation of mixed oxides of ceria with 3+
vacancy element increased the oxygen mobility, Trovarelli [1999]. Jia et al. [2008] suggested
that the doping of Al3+
and Zr4+
with ceria lattice enhanced the OSC and thermal stability.
Chang et al. [1996] observed that MnOx supported LaAlO3 had good O2 uptake (oxidation) and
O2 release (reduction) rate at temperature below 600 °C, which was confirmed by the
temperature program reduction (TPR) studies and it was significantly better than the ceria-
stabilized alumina.
Kozlov et al. [2002] observed the effect of different synthesize method on the redox properties
of CeO2-ZrO2-Al2O3. They prepared ZrO2/CeO2/Al2O3, ZrO2-CeO2/Al2O3 and ZrO2-CeO2-Al2O3
by sequential impregnation technique, co-impregnation technique and sol-gel technique,
respectively. It was concluded that the sol-gel technique was found to be the most effective
method to facilitate the intimate interaction, which resulted in Zr-rich cubic mixed oxide, and it
was thermally stable upto 900 °C without segregation of the components.
When Pd supported Ce-Zr mixed oxide was used as a catalyst, the sintering process was
expected to reduce the number of active sites, Arias et al. [2002]. It was observed that the
catalytic activity of the test material was influenced by the ageing process. They also found the
superior catalytic activity of Pd supported (Ce, Zr)Ox/Al2O3.
Masui et al. [2006] prepared CeO2-ZrO2-Bi2O3 by co-precipitation method and confirmed that
the OSC of the catalysts was increased with Bi3+
content. The reduction temperature of CeO2-
ZrO2-Bi2O3 catalysts was reduced considerably by 52% compared to that of Ce0.86Zr0.14O2.
Furthermore, the OSC of CeO2-ZrO2-Bi2O3 catalysts was more than twice that of the
conventional CeO2-ZrO2 catalysts (482 µmol O2/g) at 350 °C. The reason was that Bi2O3 was
reduced to Bi ions easily and both Ce4+
and Bi3+
were reduced simultaneously. The low
temperature reduction behavior was promoted by the addition of silver to the lattice and the
deposition on the surface of CeO2-ZrO2-Bi2O3 solid solution and formed the
0.84Ce0.68Zr0.18Bi0.14O1.93 -0.16AgCl.
Mikulova et al. [2006] prepared cerium-zirconium with neodymium ions and praseodymium
ions by sol-gel and co-precipitation method. It was concluded that the praseodymium ions were

Chapter 2 Literature review
17
able to promote the oxygen mobility. The solubility of Sm3+
and Nd3+
ions in Ce1-xMxO2 (M=
Sm, Pr, Nd) was limited to x= 0.4, whereas the same was found to be 0.75 for Pr4+
(praseodymium). Moreover, the coefficient of thermal expansion of the solid solution was
increased with the substitution concentration of the dopant, which is expected to create greater
formation of oxygen vacancy.
Xiaodong et al. [2006] synthesized manganese doped ceria-zirconia mixed oxides by co-
precipitation method and found that Mn doped CeO2-ZrO2 sample has increased OSC compared
to CeO2-ZrO2 sample. Jia et al. [2008] synthesized Mn0.1Ce0.9Ox (MC) and Mn0.1Ce0.6Zr0.9Ox
(MCZ) by sol-gel method. It was concluded that the manganese doped with cerium and
zirconium was found to have good redox and structural properties at higher temperature. The
fresh MC sample had more absorbed oxygen species than the MCZ samples. Though the
crystallite size of MC (5 nm) was lower than that of MCZ (5.6 nm), the increase in particle size
for MCZ catalysts was less than that of MC, when the temperature was raised.
Zhang et al. [2009] prepared the CeO2-ZrO2-La2O3-Al2O3 catalyst by co-precipitation method
which was found to have high thermal sintering effect, OSC improvement and reduction
temperature. Introducing La3+
in CeO2-ZrO2-Al2O3 catalysts created more defective structure
and enhanced the mobility of bulk oxygen, where the OSC of the test sample was found to be
increased from 100.5 to 118.4 μmol/g at 1000 °C.
Hongmei et al. [2010] suggested that the CeO2-ZrO2-Al2O3 solid solution was expected to
maintain the excellent textural properties, and thermal stability in addition to its attractive OSC,
when the sample was prepared by co-precipitation method. It was observed that the CeO2-ZrO2-
Al2O3 catalysts with 10 – 75 wt.% of Al2O3 had excellent structural stability and improved OSC.
Ming et al. [2010] confirmed that the OSC of ceria was increased with concentration of ZrO2 in
Ce0.4Zr0.5-xY0.1Mn0.1O2 and Ce0.4Zr0.5-xY0.1Mnx-0.025O2 mixed oxide. The reversible reduction of
ceria was significantly modified by the addition of ZrO2 with 0.025 mol%, which increased the
OSC of CeO2-ZrO2-Y2O3 compounds. Doping a small amount of Mn ion in the Ce0.4Zr0.5Y0.1O2
sample increased the OSC, and decreased the reduction temperature. The Ce0.4Zr0.5-xY0.1Mn0.1O2
and Ce0.4Zr0.5-xY0.1Mnx-0.025O2 formed the cubic structure of CeO2-ZrO2 solid solution. It is
observed that Mn ions were incorporated into the ceria-zirconia lattice, which created more
defectives leading to higher mobility and diffusion ability of bulk oxygen. When Mn content in

Chapter 2 Literature review
18
cerium- zirconium-yttrium (CZYM) was 0.025%, the OSC and the particle size of the sample
were observed to be 561 μmol/gram, and 5.5 nm, respectively.
From the above discussion, it is concluded that the selection of an appropriate precursor, the
preparation method, composition, and textural properties played an important role in the success
of the preparation of the high OSC material.
2.1.3 Evaluation of OSC of a material
The OSC was indicated by denoting the amount of O2 absorption/release per unit weight of the
catalyst, (O2) μmol/g of catalyst, Gupta et al. [2010]. The valency change of Ce4+
to Ce3+
or vice
versa and the O2 release mostly occurred on the surface at relatively low temperature and it was
possible at moderate temperature that could be observed from the temperature reduction program
(TPR) profiles. Suitable redox property, i.e, the reduction at low temperature, is the desirable
characteristics for oxygen storage materials, and it was supported by Wang et al. [2006].
Xiaodong et al. [2006] introduced CO step pulses in place of H2 and O2 to study the OSC. The
total production of CO2 per gram of catalyst in the first ten CO pulses was calculated and it
provided the information on complete OSC of the catalyst. Jia et al. [2008] also proposed H2 or
CO pulse injection method for the measurement of OSC of a catalytic material.
Zhang et al. [2009] indicated that the ceria has two reduction peaks at 500 and 830 °C during
TPR, which are associated with the release of surface oxygen and bulk oxygen, respectively. In
case of CeO2-ZrO2 mixed oxide, only one peak was observed, which was ascribed to the
simultaneous release of oxygen from the surface and bulk owing to its high oxygen mobility.
Meng et al. [2010] obtained the OSC of ceria-zirconia by the integrated area of up-take H2
before reaching 600 °C in TPR. The average H2 consumption peak area of two TPR profiles was
used to calculate the OSC of a catalyst. Hongmei et al. [2010] measured the OSC by injecting
pulses of oxygen into the sample bed until no oxygen consumption was detected by a thermal
conductivity detector. Table 2.2 shows the different OSC measurement techniques noted from
various literatures.

Chapter 2 Literature review
19
Table 2.2 Comparative studies on different OSC measurement techniques
Sl.
No
Method of
measurement
of OSC
Methodology followed Material used Reference
1 TPR Thermal decomposition of cerium-
zirconyl oxalate under Ar flow at 1273
K and subsequent reoxidation at 673 K.
H2 reduction at 1273 K and subsequent
reoxidation at 873 K. The TPR was
carried out up to 1173 K at 10 K/min.
under H2 environment
CeO2 –ZrO2
powder
Masui et al.
[2000]
2 H2-TPR for
redox
treatment
Heating the sample from 30 to 300 °C
(30 min. O2, 70 ml/min.); cooling from
300 – 30 °C and purge Ar for 20 min.
TPR heating 30-980 °C (10 °C/min.
H2-Ar mixture 30 ml/min.)
CeO2-ZrO2-Al2O3,
CeO2-ZrO2/Al2O3
CeO2-ZrO2-Al2O3
Kozlov et
al. [2002]
3 TPR–re
oxidation
O2–H2
Pretreated the sample from 30 to 500
°C (1 hr, 50% O2- 50% N2, 50
ml/min.); purged with N2 for 0.5 hr;
cooling to 30 °C (N2); TPR-
reoxidation heating up to 850 °C (1 hr,
50% O2-50% N2). The above cycle was
repeated for 4 times
RE0.6Zr0.4−xYxO2
(RE= Ce, Pr)
He et al.
[2003]
4 TPR
Reduction in H2 at 450 °C for 1 hr
(30 ml/min.). After purging reducing
gas with Helium, a stream of 5% O2/He
at 30 ml/min. was admitted in the
reactor at 350 °C. The oxygen
consumption was monitored by an on-
line quadrupole mass spectrometer.
CeO2–ZrO2 Letichevsky
et al. [2005]

Chapter 2 Literature review
20
5 TPR Samples were heated from RT to 600
°C in TPR (10 K/min under flowing
5% H2/Ar gas). Hold for 20 min., &
switch the flow of Ar, (20 min.). The
OSC was measured by injecting
impulse O2 gas at 600 °C. The amount
of consumed O2 was identified as OSC
CeO2-Al2O3
powder
Ozawa et al.
[2008]
6 TPR 5.49% H2/Ar with 30 sccm flow rate
and the heating rate of 10 °C/ min. up
to 600 °C over 100 mg sample. Volume
of H2 intake by the sample was
calibrated against CuO standard using
an online thermal conductivity detector.
Ce1-xMxO2-δ (M =
Mn, Fe, Co, Ni,
Cu, Pd, Pt, Ru, La,
Y),
Gupta et al.
[2010]
7 TPR/ OSC -
injecting
pulses of
Oxygen
Reduction of the sample
(200 mg) at 550 °C under H2
flow (40 ml/min) and then the sample
was cooled down to 200 ºC under N2 at
the flow rate of 20 ml/min.
CeO2-ZrO2-Al2O3
Co- precipitation
Hongmei et
al. [2010]
8 TPR/pulse
injection of
O2 technique
Sample was reduced with a flow rate of
10 ml/min. H2 at 550 °C for 1 h, and
then cooled to RT under Helium. The
oxygen storage capacity complete
(OSCC) was measured by pulse
injection of O2 until no consumption of
O2 was detected. The amount of O2
consumed during the re-oxidation stage
is referred as OSCC.
Ceria–zirconia–
neodymia ternary
solid solution
coprecipitation
method
Wang et al.
[2011a]
9 TPR/
Oxygen-
pulsing
technique
Pulse reaction system equipped with a
mass spectrometer used as a detector.
Ce0.7Zr0.3O2 Du et al.
[2011]

Chapter 2 Literature review
21
10 CO oxidation Alternate pulses of O2 and CO were
injected every minute in order to
simulate lean and rich operating
conditions of the engine working cycle
coupled with a TWC
Ce1-xNdxO2 -
Co-precipitation
Zr0.10(Ce1-
xMx)0.90O2 (M = Pr
or Nd) - sol-gel
method
Mikulova et
al. [2006]
11 CO reduction Rapid introduction of CO and He (CO
pulse) or CO and O2 (CO-O2 cycle)
Mn doped CeO2-
ZrO2 mixed oxides
Xiaodong et
al. [2006]
12 CO reduction Inlet gas flow sequence CO (5S)-tO2
(5S)+ CO+ O2 at a flow rate of 300
ml/min.
Cel-xZrxO2 Meiqing et
al. [2007]
13 CO reduction The sample was purged in pure
He for 10 min. to remove O2 from the
system and then exposed to 4% CO/He
at 500 °C. CO2 concentration was
monitored as a function of time, and
the OSC was obtained by integrating
the amount of CO2 formed during the
first 2 min.
Ce-Zr-Pr (CZP),
Ce-Zr-Nd (CZN)
mixed oxides by
co-precipitation
Wu et al.
[2007]
14 CO oxidation
reaction
Alternately pulsing: 4% CO/1% Ar/He
(5s) → 2%O2/1% Ar/He (5s)→4%
CO/1% Ar/He (5s) for 5 cycles. The
gas at 300 ml/min. over 25 mg sample
was supplied to prevent the back
mixing of reactants (CO and O2).
Mn0.1Ce0.9Ox and
Mn0.1Ce0.6Zr0.3Ox
prepared by sol-gel
Jia et al.
[2008]
15 CO oxidation
reaction-
CO (2 vol.%)/N2 and O2 (1.0 vol.
%)/N2 were fed into the reactor
alternately for 60 s each. (O2 storage
and release behavior)
Pt/CeO2.ZrO2.
Y2O3
Dong et al.
[2008]
16 CO oxidation
CO and O2 were introduced into a
catalyst every 3 min.
Co-precipitated-
Al2O3/CeO2/ZrO2
Morikawa et
al. [2008]

Chapter 2 Literature review
22
17 CO oxidation
reaction
Alternated CO–O2–CO–O2–CO–O2
pulses. The OSC was determined
based on the CO uptake during the first
CO pulse from the alternated series
La1-yCeyCo1-xFexO Levasseur et
al. [2009]
18 CO oxidation CO and O2 switch gas Pt/CeO2–ZrO2 Kondratenk
o et al.
[2009]
19 TGA First heating cycle from 30 to 800 °C
then cooling down to 150 °C, second
heating cycle from 150 to 800 °C.
Weight loss obtained during second
heating cycle was used to calculate the
OSC
Wet impregnated
CeO2-ZrO2/Al2O3
Ozawa et al.
[2000]
20 TGA The weight change observed during the
TGA was monitored under N2 or dry
air in the temperature from RT to 723
K
Pt/CexZr1-xO2
solids
Bazin et al.
[2009]
21 TGA The weight change observed during the
TGA was monitored under N2 or dry
air in the temp. range of 573–1073 K.
CexZr1−xO2,
CexHf1−xO2 and
CexTb1−xO2−δ
Reddy et al.
[2011]
22 TGA Sample was heated up to 600 °C (N2,
50 ml/min.) in order to release the O2.
After 10 min., the synthetic air was
introduced resulting to an increase in
sample weight due the uptake of O2
from air. The said weight change was
considered as OSC of the sample
Ceria–zirconia Ghom et al.
[2011]
From the above information based on Table 2.2, it is noted that the OSC of nanoparticles has
been studied using different techniques. Thermogravimetric analysis was used to find the redox
temperature of the catalysts. When ceria was doped with zirconia, the reduction temperature was

Chapter 2 Literature review
23
decreased from 757 to 486 °C corresponding to the diminution of 36%. The doping of ZrO2 in
the CeO2 lattice could create oxygen vacancies leading to increase the channel diameter for
oxygen migration in the lattice, which caused the bulk oxygen release at low temperature. It was
associated with the ZrO2 ability to modify the sublattice oxygen in the CeO2-ZrO2 mixed oxides
for generating defective structures, Wang et al. [2006].
Jia et al. [2008] suggested that the dynamic OSC, which is a measure of OSC at a continuous
oxidation and reduction state, could be used to simulate the real operating condition, where the
exhaust gas composition rapidly oscillated between the reducing and oxidizing environment.
Chung et al. [2009] used TGA technique to characterize the OSC by monitoring the changes in
weight under cyclic heating in air environment. The heating cycle consisted of the following: (i)
first heating up to 900 °C, (ii) cooling down to 150 °C and (iii) second heating up to 900 °C. The
heating and cooling rates were maintained at 5 °C/min. The weight loss of the sample (Al2O3-
Ce0.5Zr0.5O2) in the second heating cycle was used to calculate the oxygen release characteristics
of the catalyst between 300 and 800 °C. They also measured the OSC of sample at static
condition using H2/CO pulse injection technique.
Morikawa et al. [2008] measured the OSC of Al2O3-CeO2-ZrO2 using TGA with the
pretreatment at 500 °C for 15 min. under O2/N2 and H2/N2 atmosphere. The change in
atmosphere was repeated until the weight reduction under H2 (20%)/N2 (balance) environment
and the weight gain under O2 (20%)/N2 (balance) environment became almost the same.
Table 2.3 shows the influencing parameters and characteristic features on OSC of different
catalysts. It was observed that the OSC of CeO2-ZrO2 solid solution was influenced by the Ce/Zr
ratio. Higher specific surface area was observed for higher OSC materials within the same
composition and synthesis technique.
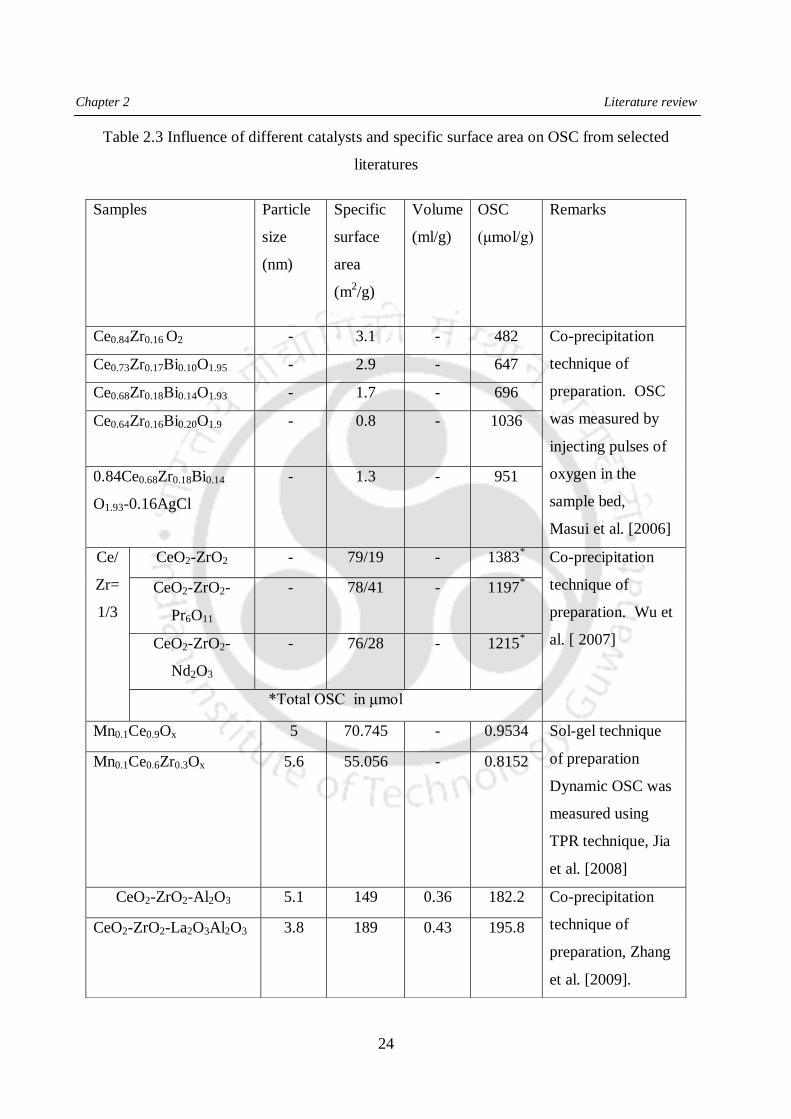
Chapter 2 Literature review
24
Table 2.3 Influence of different catalysts and specific surface area on OSC from selected
literatures
Samples Particle
size
(nm)
Specific
surface
area
(m2/g)
Volume
(ml/g)
OSC
(μmol/g)
Remarks
Ce0.84Zr0.16 O2 - 3.1 - 482 Co-precipitation
technique of
preparation. OSC
was measured by
injecting pulses of
oxygen in the
sample bed,
Masui et al. [2006]
Ce0.73Zr0.17Bi0.10O1.95 - 2.9 - 647
Ce0.68Zr0.18Bi0.14O1.93 - 1.7 - 696
Ce0.64Zr0.16Bi0.20O1.9 -
0.8
- 1036
0.84Ce0.68Zr0.18Bi0.14
O1.93-0.16AgCl
- 1.3 - 951
Ce/
Zr=
1/3
CeO2-ZrO2 - 79/19 - 1383* Co-precipitation
technique of
preparation. Wu et
al. [ 2007]
CeO2-ZrO2-
Pr6O11
- 78/41 - 1197*
CeO2-ZrO2-
Nd2O3
- 76/28 - 1215*
*Total OSC in μmol
Mn0.1Ce0.9Ox 5 70.745 - 0.9534 Sol-gel technique
of preparation
Dynamic OSC was
measured using
TPR technique, Jia
et al. [2008]
Mn0.1Ce0.6Zr0.3Ox 5.6 55.056 - 0.8152
CeO2-ZrO2-Al2O3 5.1 149 0.36 182.2 Co-precipitation
technique of
preparation, Zhang
et al. [2009].
CeO2-ZrO2-La2O3Al2O3 3.8 189 0.43 195.8

Chapter 2 Literature review
25
2.2. Nanoparticles characterization
As the particle size, structure and specific surface area are found to have a great influence on
OSC of a catalyst, the characterization of nanoparticles has significant role to play in many
applications.
2.2.1 Structural characterization
In order to have a structural identification of the catalyst, X-ray diffraction analysis was
performed. The average crystallite size was calculated from the full width at half maximum
(FWHM) using the line profiles and Scherrer’s equation and the lattice constant of the crystal
was calculated using Bragg’s law.
Hirano et al. [2000] confirmed that the crystallite size of CeO2 was increased with hydrolysis
temperature, and the crystal was found to have the cubic fluorite structure along with single
Cex Zr0.5-x
Al 0.5O 1.75
Ce/Zr=1/9 - 143 0.41 130 Co-precipitation
technique of
preparation. OSC
was measured by
injecting pulses of
oxygen in the
sample bed.
Hongmei et al.
[2010]
Ce/Zr=3/7 - 168 0.40 183
Ce/Zr=5/5 - 212 0.40 395
Ce/Zr=7/3 - 189 0.35 361
Ce/Zr=9/1 - 99 0.25 428
Ce0.4 Zr0.5 Y0.1O2 4.4 121.2 0.26 466 Co-precipitation
technique of
preparation, Ming
et al. [2010]
Ce0.4Zr0.49Y0.1 Mn0.01 O2
4.5 109.8 0.24 526
Ce0.4Zr0.475Y0.1Mn0.025O2
4.3 117.6 0.25 561
Ce0.4Zr0.45Y0.1 Mn0.05O2 4.9 98.3 0.23 515
Ce0.4 Zr0.4 Y0.1 MN0.1O2 5.5 87.9 0.21 546

Chapter 2 Literature review
26
phase. Dhage et al. [2004] obtained the particle size of Ce0.75Zr0.25O2 from XRD data and
confirmed the mesoporous structure, which was collapsed on heating at 500 °C for 4 hrs.
Dutta et al. [2006] observed the fluorite structure of Ce1-xZrxO2 from XRD pattern and the Zr
substitution in ceria led to broader width of XRD pattern compared to pure CeO2. Wei et al.
[2008] synthesized CeO2 - ZrO2 - Al2O3 mixed oxides with 10-75 wt.% Al2O3. However, the
individual phases of Al2O3 and ZrO2 were not detected by XRD, which confirmed that alumina
and zirconia were well dispersed in CeO2 crystal lattice and CeO2 - ZrO2 - Al2O3 was a
homogenous solid solution.
Ming et al. [2010] observed that the XRD peaks of Ce0.4Zr0.5–xY0.1MnxO2 (0<x<0.1) showed the
cubic fluorite structure and no peaks for MnOx and Y2O3 phases. It is suggested that the MnOx
and Y2O3 species might be incorporated into the CeO2-ZrO2 lattice forming a homogeneous
solid solution with highly dispersed state. In addition, the samples showed broad symmetric
peaks confirming the small crystallites. With an increase of Mn content, the peak intensities of
Ce0.4Zr0.5–xY0.1MnxO2 samples were found to be high indicating the increase of crystal size.
Hongmei et al. [2010] observed the peaks for CexZr0.5-xAl0.50O1.75 (0.05≤x≤0.45) which were
identical to the cubic fluorite structure of Ce1-xZrxO2 solid solution (Joint Committee on powder
diffraction standards- JCPDS -28- 271) and it is confirmed that Zr4+
doped into CeO2 crystal
lattice during the solid solution formation by co-precipitation and sol-gel methods. From Ming et
al. [2010] studies, it was observed that the crystallite size of Ce1-xZrxO2 was increased with
Ce/Zr ratio. The decrease of (111) spacing could be attributed to Zr4+
doping which shrunk for
the smaller lattice (ionic radius 0.084 nm) than the Ce4+
(ionic radius 0.097 nm).
2.3 Synthesis of nanofluid
The nanofluid is obtained by dispersing the nanoparticles in the base fluid. Because of the high
specific surface area and Van der Waals force of attraction, the nanoparticles are expected to
agglomerate in the liquid leading to sedimentation, and clogging. Thus, the utilization of
nanofluid for commercial application is yet to be realized. Simple techniques such as ultrasonic
agitation, tip sonication, magnetic stirring or the addition of surfactant to the fluids are often
used to minimize the particles aggregation and improve the dispersion behavior of them in the
fluid.

Chapter 2 Literature review
27
Garg et al. [2009] suggested two methods such as mechanical method including ultrsonication
using a probe or a bath and chemical method including the use of surfactants to disperse multi
wall carbon nanotubes in base fluids. They synthesized the nanofluid with de-ionized water,
where gum arabic was used as a surfactant. The mixture was sonicated for 5 min. at 100%
amplitude using 130 W, 20 kHz ultrasonication probe. As the probe sonicated with a limited
conic volume, the sonication was followed by 5 min. of magnetic stirring in order to facilitate
the uniform dispersion. The ultrasonication and magnetic stirring process were used alternatively
for every 5 min. until the sample was sonicated for the desired period of time. Based on the
processing time, a certain amount of energy was transferred to the sample. The samples prepared
by the above techniques were found to be stable for a month with no visible sedimentation.
Ultrosonication is a common tool used to break the agglomeration of nanoparticles in solution
based processing techniques. Ultrasonication can be done by different ways: direct by sonotrode
in the solvent and indirect by the ultrasonic bath. The tip of ultrasonic sonotrode oscillates at a
fixed frequency and produces a conical field of high energy in the fluid. The solvent undergoes
nucleate boiling which produces infinite number of micro bubbles, which produces large amount
of energy during their collapse that is the primary mechanism by which ultrasonic energy
disperses the nanoparticles, Krause et al. [2010].
Sonawane et al. [2011] prepared the nanofluid which was found to be very stable even after 24
hrs independent of sonication time used to prepare the nanofluid. With an appropriate
concentration of polyoxyethylene (20) sorbitan Monolaurate (Tween 20) and oleic acid as
surfactants, the nanofluids were prepared by suspending different volume concentration (0.1-
1%) of Al2O3 nanoparticles in Aviation Turbine Fluid. Gan et al. [2012] prepared a nanofluid
with boron nanoparticles in n-decane and ethanol as a liquid medium. The nanofluid was
prepared by vigorously mixing the liquid and nanoparticles by hand and then the ultrasonic
disruptor was used to prevent the agglomeration.
In order to get the homogeneous dispersion of nanoparticles in a fluid, different surfactants were
used during synthesis of nanofluid. Cetyl trimethylammonium bromide (CTAB) has been used
by Luo et al. [2006] to get an optimum and stable slurry by 10 mol% Gd2O3-doped CeO2
nanoparticles. Ashok et al. [2007] used sorbitan monooleate (span 80) as a surfactant and diethyl
ether as an additive to improve the performance of a fuel in a diesel engine.

Chapter 2 Literature review
28
Changlin et al. [2009] synthesized mesostructured Ce0.6Zr0.4O2 by co-precipitation method with
different surfactants namely pluronic Triblock co polymer P123 (MW: 5800, EO20PO70EC20),
Brij 56 (C16EO10) and CTAB. It was concluded that the surfactants had little influence on the
mesoporous structure of the nanoparticles. Ganesh et al. [2011] used CTAB for biodiesel in
order to disperse Magnalium to control the particle sedimentation.
Aqueous tetramethyl ammonium hydroxide was used as a surfactant in order to cover the
magnetic particles with hydroxide anion where tetramethyl ammonium cation was used to create
electrostatic inter-particle repulsion in an aqueous environment, Shafii et al. [2011]. Gan et al.
[2011a] reported that an overlap of the surfactant layer was expected to produce repulsive forces
to overcome the Van der Waals force of attraction, thus the stability of the nanofluid was
maintained. It is also noted that a sufficient amount of surfactant was required to be added to
form a layer around the particles to produce the required repulsive forces.
Some examples of previously used surfactants are sodium lauryl sulfate (SDS), sodium dodecyl
benzentsulfonate (SDBS), cetyltrimethyl ammonium chloride (CTAC) and CTAB. From the
literature, it was found that SDBS failed at elevated temperature, Sadri et al. [2014].
2.4 Quality characterization of nanofluid
Nanofluids are not a simple mixture of liquid and solid particles. The nanoparticles tend to
aggregate with time due to their high surface activity. The agglomeration of nanoparticles results
not only the settlement and clogging, it also affects the physical and thermal properties of
nanofluids. Thus, the investigation on stability of nanofluids is a key issue that influenced the
properties of them for different applications. The factors affecting the stability of suspension are
the nanoparticles concentration, dispersant, viscosity of base fluid, temperature, surfactants and
pH value. The type, dimension and density of the nanoparticles and the technique used for the
preparation of nanofluid also influence its stability. Few techniques such as sedimentation, UV
vis spectrophotometer and zeta potential analyzer are being used to study the dispersion stability
of nanofluid.
Chapter 2 Literature review
29
2.4.1 Dispersion stability of nanofluid
Sedimentation method is the most simple and reliable technique to study the dispersion stability
of nanofluids. In this method, the variation of concentration or particle size of suspended
medium with sedimentation time was obtained by sedimentation photograph of nanofluids.
Zhu et al. [2007] measured the stability of graphite suspension by a sedimentation balance
method. The weight of sedimented nanoparticles during a certain period of time was measured
from which the suspension fraction was calculated. It was observed that the stability of
suspension was increased with the pH value of the fluid where the maximum dispersion was
noticed at a pH value of 9-10. A further increase in the pH value resulted in unstable suspension.
Long period of observation is the limitation of sedimentation method compared to any other
method, Li et al. [2009b].
Jana et al. [2007] studied the stability of water based nanofluid dispersed with Au and Cu
nanoparticles using UV spectrophotometer and it was observed that the stability of nanofluid
was influenced by various forces such as (i) gravitational force on the particle, (ii) electrostatic
force and (iii) Van der Waals forces between the particles.
Hwang et al. [2007] used CuO2 and SiO2 nanoparticles to prepare nanofluid with deionized
water, ethylene glycol and oil. They studied the dispersion stability of a test sample using a UV-
spectrophotometer. They reported the influence of type of nanoparticles and base fluid on the
dispersion stability of nanofluids. Kumar et al. [2009] characterized the copper nanoparticles
dispersed elthylene glycol using an UV spectrophotometer, where a good dispersion was noticed
against time.
Zeta potential of nanofluid was measured using a zeta potential analyzer by electrophoresis light
scattering method. This method has the limitation of viscosity and concentration of nanofluid.
Zhu et al. [2009] measured the absorbency of alumina nanoparticles in a liquid medium with
SDBS dispersant. According to electrostatic stabilization theory, a high absolute value of zeta
potential increased the electrostatic repulsion among the nanoparticles in a suspension leading to
their higher stability in a base fluid. Lin et al. [2011] obtained the concentration of Al2O3
nanoparticles against time in the nanofluid using the light absorbance data compiled by the

Chapter 2 Literature review
30
spectrophotometer. The variation in weight concentration of the nanoparticles in the nanofluid
for a given period of time was determined as a precipitation rate of the Al2O3 nanofluid.
2.4.2 Fuel properties
Surface tension and viscosity are the important influencing properties of fuel during the injection
process. A highly viscous nanofluid could also result in increasing the pumping power during
the application of fuel.
Sajith et al. [2010] reported that the viscosity of nanofluid was found to be increased with the
addition of ceria nanoparticles in Jatropha based biodiesel. It was suggested to limit the dosing
of cerium oxide by 20-80 ppm, where the viscosity was reported to increase with particle
concentration resulting to increased frictional power. Das et al. [2003a] performed the
rheological studies on alumina based nanofluids. With an increase of particle volume fraction,
the viscosity of nanofluid showed higher values than that of water. Surface tension of nanofluid
was found to have a slight deviation from the base fluid. It was concluded that the change of
surface tension of nanofluid against water was observed to have a negligible effect on the heat
transfer characteristics.
Kim et al. [2007] measured the surface tension of Laponite, silver and Fe2O3 nanoparticles
dispersed water using a tensiometer and it was found that the surface tension of nanofluid was
differed negligibly from that of pure water. Golubovic et al. [2009] measured the surface tension
of Al2O3 and Bi2O3 nanoparticles dispersed water to study the critical heat flux. The surface
tension of nanofluid as a function of nanoparticles concentration was not changed significantly.
2.5 Experimental studies on engine performance and emission level
The performance of a compression ignition engine is generally characterized by several key
parameters including the brake specific fuel consumption (BSFC), brake thermal efficiency
(BTE) and the mechanical efficiency.
By knowing the cylinder pressure and rate of heat release, the typical combustion characteristics
including the rate of increase of cylinder pressure, ignition delay and total combustion duration
can be determined. The injection timing, which is the start of fuel injection, was determined at
the crank angle where the injector needle raised abruptly. The ignition timing, which is the start

Chapter 2 Literature review
31
of combustion, was determined at a point when the heat was released. The time lag between
ignition timing and injection timing is referred as the ignition delay. The end of a combustion
process in a cycle was taken as a point where 90% of the cumulative heat release was completed.
The time lag between end of the combustion and the ignition timing was taken as the total
combustion duration.
Kao et al. [2008] reported that an addition of aqueous aluminum nanofluid in diesel increased
the total combustion heat in addition to the reduction of smoke and nitrogen oxides in the
exhaust emission. Tyagi et al. [2008] presented the ignition characteristics of alumina and
aluminum nanoparticles dispersed diesel without any surfactant. It was concluded that adding
nanoparticle to the fuel caused significant improvements in the radiative and heat / mass transfer
characteristics and hence the droplet was ignited at a much lower temperature, which has the
potential of reducing the evaporation and ignition time of droplets in a diesel engine.
Huang et al. [2009] reported that the melting temperature of a 1 nm aluminum particle could be
as low as 127 °C, one fifth of its bulk material, which had a significant influence on the ignition
and combustion mechanisms. Tyagi et al. [2008] reported that the high specific surface area to
volume ratio of the nanoparticles allowed more fuel in contact with the oxidizer. Because of the
small interparticle distance, the time scale of the chemical reactions was very much different
than the reactions associated with large sized particles and thus, the ignition delay time for
nanosized particles would be reduced.
Gan et al. [2011b] compared the burning behavior of nano and micron suspension of aluminum
in the fuel. The results showed the characteristics and structure of particle agglomeration formed
during the droplet evaporation and the combustion behavior. It was concluded that the burning
behavior of nano suspension was better than the micron suspension.
Kao et al. [2011] dispersed aqueous aluminum nanoparticles in diesel and the results showed the
decrease in BSFC and increase in BTE compared to that of diesel. Zhu et al. [2011] used ferrous
picrate catalyst in diesel and reported the reduction of smoke by 26.2% at full load condition.
Shafii et al. [2011] carried out the performance study of a four-stroke diesel engine using water
based ferrofluid mixed diesel. Water based ferrofluid has two advantages: the diesel can be
diluted, which can reap the benefits of water diesel emulsion; the magnetic nanoparticles can be

Chapter 2 Literature review
32
collected at the exhaust of an engine. By adding a 0.4% ferrofluid to diesel, the BSFC was
decreased by 3.2 - 6.5% and BTE was increased by 3.3 - 6.9%. The emission of NOx and CO
was decreased by 9 - 15 ppm and 3.33 - 6.89%, respectively. Zhu et al. [2012] used ferrous
picrate catalyst for diesel engines, where the reduction in BSFC and the increase in BTE were
observed with an addition of the catalyst. At the catalyst dosing ratio of 1:10000, the BSFC was
reduced by 3.3 - 4.2% at light engine load of 0.12 MPa and 2.0 - 2.4% at heavy engine load of
0.4 MPa. From the in-cylinder pressure and heat release rate analysis, it was found that the
catalyst reduced the ignition delay and the combustion duration resulting the higher peak
cylinder pressure and faster rate of heat release.
Ganesh et al. [2011] observed the reduction of BSFC and increase of BTE, when magnalium and
cobalt oxide were dispersed in biodiesel. Sajith et al. [2010] reported that the cerium oxide
supplied the oxygen for oxidizing the hydrocarbon and soot and it got converted into cerous
oxide. As cerium oxide acts as an oxidation catalyst, it lowered the activation temperature of
carbon combustion and enhanced the hydrocarbon oxidation promoting the complete combustion
of fuel. An average reduction of 25 to 40% in the hydrocarbon emission was obtained for the
catalyst dosing level ranging from 40 to 80 ppm. They have obtained a 30% reduction in NOx
and 25 to 40% reduction in hydrocarbon emission, when cerium oxide nanoparticles were
dispersed with Jatropha based biodiesel. Ganesh et al. [2011] also reported that the fuel
evaporation time was reduced by metal oxide nanoparticles leading to the reduction of physical
delay. In addition to that a 70% reduction in hydrocarbon, 41% reduction in CO and 30%
reduction of NOx emission at 75% load were also observed.
From the above literature, it was clearly understood that the nanoparticles dispersed diesel
enhanced the performance of an internal combustion engine in terms of BSFC and BTE. It
helped to reduce the smoke, NOx and unburned hydrocarbon, which ensured its complete
combustion. In general, the ignition delay and ignition temperature are the two critical
parameters that influence the performance of a diesel engine. Both thermal efficiency and the
reduction of emission level of an engine are improved by optimizing those parameters. Though
there are many advantages of dispersing the nanoparticles in fuel including reduced ignition
delay, increased energy density, high burning rate and reduced emission, a few works has been
reported till date on the effect of dispersing the nanoparticles in diesel.

Chapter 2 Literature review
33
2.6 Technical gap
Based on the deliberation on several topics, the following technical gaps were identified.
o A suitable synthesis technique to prepare the high OSC ceria based homogeneous solid
solution is not identified.
o The influencing parameters on the OSC of nanoparticles such as the crystallite size,
surface area, structure, redox property and thermal stability are yet to be studied in detail.
o A suitable combination of materials and their effective stoichiometric ratio to have the
highest possible OSC of ceria based nanomaterial is still to be identified clearly.
o Most of the studies on OSC of ceria based solid solution are done either by the complex
method or expensive characterization techniques.
o Ageing studies on TWC materials are observed to be inadequate in order to find their
thermal stability.
o Synthesis of highly stable nanoparticle dispersed fuel, studies on its dispersion stability
and the selection of a suitable surfactant using feasible technique are yet to be explored
in detail.
o Identification of suitable surfactants and synthesis technique are needed to be explored in
order to get the highly stable nanofluid.
o Performance and exhaust emission studies on nanoparticle dispersed fuel in an IC engine
are not studied in detail.
2.7 Objectives of the work
In this work, an attempt is proposed to improve the performance and reduce the harmful
emission of a diesel engine by homogenously dispersing the nanosized high OSC materials of
CZA and CZM (C=Ce; Z=Zr; M=Mn; Y= Al, Bi, La, Nd) oxides in diesel. The detailed
objectives of the thesis work are as follows:
o To synthesize a homogeneous solid solution of nanoparticles (CZY and CZM oxides)
using an appropriate technique and their characterization.

Chapter 2 Literature review
34
o To optimize the composition of CZY and CZM oxides based on their oxygen storage
capacity and qualitative confirmation of the same.
o To synthesize highly stable nanoparticle dispersed fuel by selecting a suitable surfactant
and a method of preparation.
o Dispersion stability studies on nanoparticle dispersed fuels and their characterization.
o Studies on the effect of nanoparticles type at an optimum concentration in diesel on the
performance parameters and the reduction of different harmful emission in the exhaust
gas of an engine.
o Field studies on the nanoparticle dispersed fuels.

35
Chapter 3
Materials and methods
This chapter is focused on discussing various techniques used and different methods employed
for the preparation of nanoparticles beginning with materials used, methods followed to
synthesize the nanoparticles and nanofuel, procedure adopted to test the nanofuel in an IC engine
and field trial in the commercial diesel generators. The studies on nanoparticles and nanofuels
involve several analytical tools and experimental techniques in order to confirm their
characteristics. A series of different analytical instruments and techniques is used at various
stages of development and testing of the nanoparticles and nanofuel, which are discussed below
in detail.
3.1 Raw materials
To synthesize a solid solution of CexZr1-xO2 (x= 0.2, 0.4, 0.6, 0.8), Ce0.6Zr0.4-xY1.3xO2 (Y= Al, Bi,
La, Nd) and Ce0.6Zr0.4-xMnxO2 (0.0 ≤ x ≤ 0.4), Cerium (III) nitrate hexahydrate
(Ce(NO3)3.6H2O) (Aldrich, 99% and Alfa Aesar), Zirconium oxychloride (ZrOCl2)
(Lobachemie, 99%), Zirconyl (IV) oxynitrate hydrate powder (ZrO(NO3)3.H2O) (Otto),
Aluminum nitrate Al(NO3)3.9H2O (Merck), Manganese (II) nitrate hydrate Mn(NO3)2.XH2O
(Aldrich), Bismuth nitrate penta hydrate Bi(NO3)3.5H2O (Merck), Lanthanum (III) nitrate hexa
hydrate La(NO3)3.6H2O (Alfa Aesar) and Neodymium (III) nitrate hexa hydrate
(Nd(NO3)3.6H2O) (Alfa Aesar) were used as precursors. Ammonium hydroxide (NH4OH)
(Merck, 30% GR) was used as a precipitant in co-precipitation technique and Citric acid
(C6H8O7) (lobachemie) was used as a gel forming agent in sol-gel technique. Hexadecyl-
trimethyl-ammonium bromide (CTAB) (Merck), Sodium lauryl sulfate (SDS) (Merck), Oleic
acid (Merck), Polyoxyethylene (20) sorbitan monolaurate (Tween 20) (Merck), Polysorbate 80
(Tween 80) (Merck), Sorbitan monolaurate (span 20) (Merck) and Polyoxyethylene (20) sorbitan
monooleate (span 80) (Merck) were used as surfactants during synthesis of the nanofuel. All the
reagents were used without further treatment. Diesel was procured from the commercial outlet of
Indian Oil Corporation Limited, Guwahati, India.

Chapter 3 Materials and methods
36
Cerium (III) nitrate hexahydrate (Ce(NO3)3.6H2O Zirconium oxychloride (ZrOCl2)
Add NH4OH with the flow rate of
0.1ml/min
Calcination in muffle furnace at 200 C for 2 hrs
Precipitate in room temperature for 48 hrs
Washed till no pH change
Cex Zr1-x O2 (0.2≤x≤0.8)
Dissolve and mix in distilled water
3.2 Synthesis of nanoparticles
In order to select a suitable method to prepare high OSC Ceria based nanoparticles, CexZr1-xO2
(x= 0.2, 0.4, 0.6, 0.8) solid solution was synthesized by two techniques: (a) Co-precipitation
(COP) method and (b) Sol-gel method, which are briefly discussed here.
As suggested by Zhang et al. [2007], CexZr1-xO2 (x= 0.2, 0.4, 0.6, 0.8) solid solution was
synthesized by COP technique and the methodology used for the same is shown in Figure 3.1.
The aqueous solutions of Ce(NO3)3.6H2O (0.2mol/lit) and ZrOCl2 having the desired Ce:Zr
molar ratio were mixed thoroughly for 30 min. using a magnetic hot plate stirrer at room
temperature. The molar ratio calculation is appended in Annexure – I. Then, the mixed solution
was added 0.1ml/min into NH4OH having the concentration of 2 mol/lit under vigorous stirring
at 70 °C, where the pH value of the solution was maintained to be more than 10. The obtained
precipitate was kept at room temperature for 48 hrs and then filtered. It was followed by washing
with deionized water until no pH change was detected. The yellow colored precipitate was dried
under ventilated condition at room temperature over night. Finally, the precipitate was calcinated
at 200 °C for 2 hrs in a muffle furnace. The precipitate was agitated with a mortar and pestle to
get the fine powder of CexZrx-1O2 (x = 0.2, 0.4, 0.6, 0.8).
Figure 3.1 Flow chart for the Co-precipitation preparation technique to synthesize CexZr1-xO2
solid solutions

Chapter 3 Materials and methods
37
Zirconyl (IV) oxynitrate hydrate
(ZrOCl2)
Cex Zr1-xO2 (0.2≤x≤0.8)
Cerium (III) nitrate hexahydrate
(Ce(NO3)3.6H2O)
Adding of NH4OH till pH˃6
Ignited in a muffle furnace at 350 C
Dissolve and mix in distilled water along
with citric acid
Formation of transparent gel
Heated at 60 C for 30 min.
Agitated to get fine powder
Heated at 70 C under stirring
CexZr1-xO2 (x=0.2, 0.4, 0.6, 0.8) was also synthesized by sol-gel method, as suggested by Zhang
et al. [2007] and the procedure adopted for the same is presented as a flow chart shown in Figure
3.2. The cerium (III) nitrate hexahydrate (Ce(NO3)3.6H2O) and zirconium oxychloride (ZrOCl2)
with desired molar ratio, and the required quantity of citric acid were taken and all were mixed
well in distilled water using a magnetic hot plate stirrer for 30 min. The pH value of the solution
was increased up to 6 by dropping NH4OH using the microfluidics pump with the flow rate of
0.5 ml/min. at room temperature. The mixture was heated at 60 °C for 30 min. and then heated
further to 70 °C with continuous stirring. A transparent gel was formed at the end of the process,
which was ignited and cooled in a muffle furnace in the static air environment at 350 °C. Then,
the product was collected and agitated using a mortar and pestle to get the fine powder of
CexZr1-xO2 (x=0.2, 0.4, 0.6, 0.8). Figure 3.3 shows the setup used to synthesize the nanoparticles
based on sol-gel / COP technique.
Figure 3.2 Flow chart for the sol-gel preparation technique to synthesize CexZr1-xO2
solid solutions

Chapter 3 Materials and methods
38
a
Cb
Figure 3.3 A setup to synthesize the nanoparticles as per COP and sol-gel technique
(a) Microfluidics pump, b) Magnetic stirrer, c) pH meter
Based on the OSC data of the nanoparticles synthesized by the above discussed techniques, sol-
gel technique was followed for further studies. To synthesize Ce0.6Zr0.4-xY1.3xO2 and Ce0.6Zr0.4-
xMnxO2 (where Y= Al, Bi, La and Nd; x= 0.0 ≤ x ≤ 0.4) samples, the same procedure as
discussed above for CexZr1-xO2 by sol-gel technique was followed except the muffle furnace
temperature, where it was maintained at 500 °C and the sample was called as fresh samples.
Further, the samples were calcinated in a muffle furnace at 800 °C for 7 hrs, which were called
as aged samples. The calcination temperature was selected based on the exhaust gas temperature
passing through the catalytic converter used in an automobile system. The samples were
designated as follows: Ce0.4Zr0.6O2-CZ1, Ce0.5Zr0.5O2-CZ2, Ce0.6Zr0.4O2-CZ3, Ce0.7Zr0.3O2-CZ4,
Ce0.8Zr0.2O2-CZ5, Ce0.6Zr0.3Y0.13O2-CZY1, Ce0.6Zr0.2Y0.26O2-CZY2, Ce0.6Zr0.1Y0.39O2-CZY3 and
Ce0.6Zr0.0Y0.52O2-CZY4. In case of Ce0.6Zr0.4-xMnxO2, the samples were designated as
Ce0.6Zr0.3Mn0.1O2-CZM1, Ce0.6Zr0.2Mn0.2O2-CZM2, Ce0.6Zr0.1Mn0.3O2-CZM3 and
Ce0.6Zr0.0Mn0.4O2-CZM4.
3.3 Synthesis of nanofuel
The nanofuel was synthesized by dispersing the desired type and quantity of nanoparticles in
diesel. Due to high specific surface area of nanoparticles used for the nanofuel synthesize, the
agglomeration of the same was expected to occur due to Van der Waals force of attraction,

Chapter 3 Materials and methods
39
Sound proof box
Temperature sensor
Sonication Tip
Nanofuel Sample
Adjustable height stand
Microprocessor based controller
which are required to overcome in order to produce a stable nanofuel using a suitable surfactant
at 1:2 ratio as suggested by Sharif et al. [2009]. Different types of nanofuel synthesize
techniques namely tip sonication, magnetic stirring and combination of both were explored for
the same. In case of a tip-sonicator assisted nanofuel synthesis technique, a tip-sonicator make:
M/s Sonics, USA, model: VCX 750, was used for the same, where the sample temperature was
maintained at 35 °C and the setup used to prepare the nanofuel is shown in Figure 3.4. The
sample container was kept in an ice bath in order to maintain the required sample temperature
during the sonication period. The different concentration of nanoparticles was dispersed in diesel
along with a suitable surfactant to prepare the nanofuel. The conical field of high energy was
formed in diesel due to the oscillation of ultrasonic sonorod tip at 20 kHz frequency. The fluid
undergoes nucleate boiling which produces infinite number of micro bubbles. When these
bubbles collapse, it produces large amount of energy, which disperses the nanoparticles and
avoiding the formation of agglomeration, Krause et al. [2010]. During the selection of suitable
surfactant for further studies, the sonication period was selected as 1 hour based on our earlier
results, Mandal et al. [2012]. The samples prepared using tip sonicator is shown in Figure 3.5.
Figure 3.4 Tip sonicator

Chapter 3 Materials and methods
40
Diesel + Ceria
Diesel + Ce0.6Zr0.2Mn0.2O2
Diesel + Ce0.6Zr0.4O2
Diesel + Ce0.6Zr0.2Al0.26O2
Diesel + Ce0.6Zr0.1Al0.39O2
Figure 3.5 Different samples prepared using tip sonicator
In case of magnetic stirring technique to synthesize the nanofuel, a magnetic stirrer make: IKA
C-Mag, model: HS7 was used. Figure 3.6 shows the pictorial view of nanofuel preparation using
the magnetic stirrer. The required concentration of nanoparticles was added in diesel with
suitable surfactant at 1:2 ratio and stirred for 2 hrs using the magnetic stirrer at room
temperature, Das et al. [2008]. The magnetic field created on plate was changed its polarity by
AC supply. In order to respond the change in magnetic field, the magnetic bead, which was
placed inside the beaker also changed its direction, makes the vortex rotation within the fluid
field in such a way that the bead rotates continuously leading to the dispersion of nanoparticles
in diesel.
In case of combined technique to synthesize the nanofuel, the combination of tip sonicator and
magnetic stirrer was used alternatively for 30 min. each for 2 hrs to disperse the nanoparticles in
diesel. As the probe sonicates within the limited conic volume, tip-sonication was followed by
magnetic stirring in order to facilitate the uniform dispersion of nanoparticles in diesel.

Chapter 3 Materials and methods
41
Nanofuel
Magnetic stirrer plate
Rotational speed controller
Temperature controller
Figure 3.6 Preparation of nanofuel using magnetic stirrer
3.4 Characterization of nanoparticles
The synthesized nanoparticles were studied using different characterization techniques which are
explained below.
3.4.1 Structural analysis - X-Ray diffractometer (XRD)
The X-ray diffractogram patterns of Ce0.6Zr0.4-xY1.3xO2 (CZY; Y=Al, Bi, La, Nd) and Ce0.6Zr0.4-
xMnxO2 solid solutions were studied using a Bruker D8 advance powder diffractometer using a
diffracted monochromated beam Cu-Kα (1.5406 Å) radiation source. A pictorial view of X-Ray
diffractometer used in this study is shown in Figure 3.7. The samples were loaded on a zero back
ground quartz plate and the intensity data were collected over the 2θ range from 10 to 70˚ with
the scanning rate of 0.02˚ and the step time of 1 s. The crystalline phases of the sample were
identified by comparing the reference data obtained from the JCPDS file. Three diffraction data
were collected per sample in order to calculate the mean crystallite size and the lattice constant
of the solid solution, which were calculated using the Scherrer’s equation and Bragg’s Law,
respectively.
Scherrer’s equation
cosd ... (3.1)

Chapter 3 Materials and methods
42
d = Crystallite size (nm)
Κ = Particle shape factor - 0.894
λ = Wavelength of the X-ray used (1.5405 Å for Cu Kα)
β = Full width at half maximum (radians)
θ = Diffracted angle of X-ray beam with the lattice plane (radians)
Bragg’s Law
nd sin2
... (3.2)
d = Interplanar spacing between the diffracting adjacent planes
θ = Angle of the X-ray beam with the lattice plane
n = Order of diffraction (1)
λ = Wavelength of the X-ray used (1.5405 Å for Cu Kα)
In addition to the above, the strain developed in the nanoparticles due to the processing
technique followed to synthesize nanofuel was also calculated using X-ray diffractogram and the
details of which are given below:
tanStrain
… (3.3)
β = Full width at half maximum (radians)
θ = Diffracted angle of X-ray beam with the lattice plane
Figure 3.7 Bruker D8 advance powder X-Ray diffractometer

Chapter 3 Materials and methods
43
3.4.2 Lattice vibration studies- Raman spectroscopy
The oxygen storage capacity band of a material was confirmed by the Raman spectra using a
laser micro Raman (Jovin Yvon, Triax 550) in the backscattering mode equipped with 514 nm
green laser (Argon) and a CCD detector coupled with a monochromator having the XY step
resolution of 0.1 μm, wave number accuracy of ±1 cm-1
and its resolution of 0.5 cm-1
. The
equipment was also used to confirm the crystallite phase and solid solution formation. The
Figure 3.8 shows the pictorial view of the laser Raman spectroscopy.
Figure 3.8 Laser micro Raman spectroscopy
3.4.3 Imaging studies - Transmission electron microscope (TEM)
A 200 kV Transmission Electron Microscope, JEOL JEM 2100, was used to confirm the
crystallite size and shape of the solid solution. High resolution TEM and selective area electron
diffraction (SAED) pattern were used to study the crystal defects in the solid solution. The
homogenous dispersion of nanoparticles in nanofuel was also confirmed through TEM studies.
Figure 3.9 shows the pictorial view of TEM.

Chapter 3 Materials and methods
44
Figure 3.9 Transmission electron microscope
3.4.4 Oxygen storage capacity studies- Thermogravimetric analyzer (TGA)
The oxygen storage capacity (OSC) of CexZr1-xO2 (0.2 ≤ x ≤ 0.8), Ce0.6Zr0.4-xY1.3xO2 and
Ce0.6Zr0.4-xMnxO2 (where Y= Al, Bi, La, Nd; 0.0 ≤ x ≤ 0.4) was evaluated using the
thermogravimetry analyzer under cyclic heating in the temperature range of 573–1073 K. The
heating and cooling rate were maintained at 15 °C/min. and the initial weight of the sample was
kept in the range of 500 mg. The samples were initially heated from room temperature to 800 °C
in N2 environment and cooled down to 150 °C in air environment followed by heating the
sample up to 800 °C, as suggested by Ozawa et al. [2000]. The weight loss of the sample during
second heating cycle was used to calculate the OSC of solid solution. The sample holder, made
of Alumina, was heated in a muffle furnace up to 1200 °C to remove the contaminants from the
pan, if any, later it was sonicated in an ultrasonic bath and dried in an oven to ensure the
contaminant and moisture free sample holder. A Netzsch (STA 449F3, Germany) TG-DSC
analyzer was employed for the same. The TGA used in the present study is shown in Figure
3.10.

Chapter 3 Materials and methods
45
Figure 3.10 Thermogravimetric analyzer
3.4.5 Thermal expansion studies – Thermomechanical analyzer (TMA)
Thermomechanical analyser (TMA/SS6000, Seiko Instruments) was used to measure the thermal
expansion of the sample in the temperature range varying from 30 to 1000 °C at a heating rate of
10 °C/min. The test samples for TMA analysis were prepared by uniaxial compaction having the
sample thickness and diameter of 5.50 ± 0.05 and 8.00 ± 0.05 mm, respectively. The density of
test sample was observed to be varied within 10 % deviation from the theoretical density. A ‘R’-
type thermocouple was used to measure the sample temperature with an accuracy of 0.1 °C. To
ensure proper contact between the probe and sample, a load of 100 mN was applied on the
sample. A change in length of the sample against temperature was measured using a linear
variable differential transformer (LVDT) technique having the sensitivity of 0.1 µm. The
samples were pretreated in the TMA instrument to remove the absorbed moisture and the
process induced residual stresses. The pictorial view of TMA is shown in Figure 3.11.

Chapter 3 Materials and methods
46
Figure 3.11 Thermomechanical Analyzer
3.5 Quality characterization of nanofuel
3.5.1 Dispersion stability studies- UV-Vis Spectrophotometer
The impact of high OSC nanoparticles on toxic emission can be achieved if the nanoparticles are
homogeneously dispersed in diesel for a long period of time. Thus, it is expected that the
nanoparticles would be continuously injected into the combustion chamber along with diesel.
The dispersion stability of nanofuel was studied using a UV-Vis spectrophotometer model M/s
Shimadzu, UVmini-1240, Japan, where the light was passed through the sample cell, and the
detector records the intensity of the incidental and transmitted light and then the concentration of
sample was calculated using the Beer-Lambert’s equation, Pavia et al. [2007], which is
expressed in eq. 3.4.
0
logI
IA
`
... (3.4)
where I and I0 are the intensity (power per unit area) of the incident and transmitted radiation,
respectively. A is the intensity ratio.

Chapter 3 Materials and methods
47
Relative stability = 100*i
ci
A
AA
... (3.5)
where Ai and Ac are the absorbance value of the nanofuel soon after its synthesize, and the
absorbance value of nanofuel after the required period of time, respectively.
The relative stability of nanofuels was studied continually up to 168 hours (7 days). The duration
of the relative stability test was selected on the basis of refilling the fuel tank in any automobile
system. As the nanoparticles aggregate and sedimentation takes place concurrently, the relative
stability of nanofuel changes continuously and thus it was studied on hour basis initially and
then by day-basis in order to find the rate of sedimentation of nanoparticles in the fluid. As the
prepared nanofuel has high absorbance value in the UV range, i.e. beyond the absorbance range
of the instrument, ±3.9, the samples were diluted with Heptane in order to bring down the
absorbance value to the measurable range of the spectrophotometer. It was chosen because the
electrons might undergo several possible transitions of different energy in all compounds other
than alkanes. The pictorial view of UV-Vis spectrophotometer is shown in Figure 3.12.
Figure 3.12 UV - Vis spectrophotometer

Chapter 3 Materials and methods
48
3.6 Characterization of nanofuel
In order to study the influence of CeO2 based nanoparticles in diesel, the properties of nanofuel
such as surface tension, flash and fire point temperature, thermal conductivity and viscosity were
studied in detail.
3.6.1 Surface tension study - Tensiometer
Surface tension of nanofuel was measured against the concentration and the type of
nanoparticles dispersed in it using a tensiometer. The surface tension between a liquid and the air
was measured by placing a platinum ring below the surface of the liquid. The test was performed
by pulling the ring upward by rotating a hand screw. When the ring just came out of the upper
surface of the liquid, it was not detached abruptly from the liquid surface. Because of the surface
tension, a hemispherical bubble was formed between the ring and the upper surface of the liquid.
The ring was further pulled up very carefully. When the bubble just got detached from the ring,
it showed the surface tension of the liquid. The pictorial view of tensiometer used to measure the
surface tension of nanofuel is shown in Figure 3.13.
Figure 3.13 Tensiometer

Chapter 3 Materials and methods
49
3.6.2 Flash and Fire point temperature measurement - Pensky-Martens open type
apparatus
The Flash and Fire point temperature of nanofuel were measured by using Pensky-Martens open
type apparatus, which is shown in Figure 3.14. The flash point temperature of a volatile liquid is
the lowest temperature at which it can vaporize to form an ignitable mixture in air. At the flash
point, the vapor may cease to burn when the source of ignition was removed. The volatile liquid
suddenly ignited from the heat received by the ignition source from which heat was given for a
specific interval. The fire point temperature, a slightly higher than the flash point, is defined as
the temperature at which the vapor continues to burn after being ignited. The sample contained
in an open cup was heated and after some specific interval of time, a flame was brought over the
surface. The measured flash point varied with the height of the flame above the liquid surface,
and the measured flash point temperature coincides with the fire point at sufficient height. As the
liquid vaporizes from the top surface of the diesel, the gas flame easily catches the hot vapor and
suddenly it becomes ignited and immediately the fire goes away. The fire point temperature is
assumed to be about 10 ºC higher than the flash point temperature.
Figure 3.14 Flash and Fire point temperature measuring instrument

Chapter 3 Materials and methods
50
3.6.3 Thermal conductivity measurement - KD 2 pro Thermal properties analyzer
The KD2-Pro Thermal Properties Analyzer, which is based on transient hot wire technique, was
used to measure the thermal conductivity of nanofuel against the concentration and type of
nanoparticles. The platinum wire serves the purpose of both heater and temperature sensor. The
heat dissipated through the wire is used to increase the temperature of the sample. The accuracy
of the thermal conductivity measurements was ± 2.5% in the range of 0.02 and 2 W/mK in the
temperature range of 5 to 40 °C. The pictorial view of KD 2-Pro is shown in Figure 3.15.
Figure 3.15 KD 2 Pro - Thermal conductivity measuring instrument
3.6.4 Viscosity measurement- Rheometer
The Anton Paar Rheometer Model MCR 101 was used to study the viscosity of the nanofuel
using the cone and plate geometry of the instrument. The upper plate was cone geometry (CP
50-1) with diameter of 49.964 mm, angle of 0.998˚ and the truncation of 99 µm. The sample was
placed above the bottom plate, which was fixed on the base of the instrument. The viscosity of
nanofuel was measured against different concentration and type of nanoparticles at 35 °C, which
is the storage temperature and the maximum possible temperature in the fuel line till it reaches
the combustion chamber. The tests were conducted under rotational mode with constant shear
rate of 10 sec-1
. The pictorial representation of Rheometer is shown in Figure 3.16.

Chapter 3 Materials and methods
51
Figure 3.16 Anton-Paar Rheometer
3.7 Performance and emission studies in an Internal Combustion Engine
3.7.1 IC engine Test rig
The experimental setup used to study the performance characteristics of nanofuel is shown in
Figure 3.17, which encompasses a Kirloskar stationary diesel engine having a single cylinder
and water cooled rope brake dynamometer which is used for agricultural and industrial
applications. The engine develops a power of 5 HP and it is operated at a constant speed of 1500
rpm. The operating conditions of an engine were kept as per the catalogue of the manufacturer.
Initially, the engine was made to run with diesel for 30 min. to attain warm up condition and
subsequently, the engine was tested using different concentrations of nanofuel without having
any modifications in the system. The engine performance on pure diesel was also conducted as a
basis for comparison. During the engine testing, the brake power was varied by changing the
load through a rope brake dynamometer with the help of a spring balance.

Chapter 3 Materials and methods
52
Figure 3.17 IC engine test rig
3.7.2 Emission studies - Gas Analyzer and emission monitor
Figure 3.18 Exhaust gas analyzer and emission monitor
Exhaust emission such as hydrocarbon, CO, CO2 and NOx was measured using a portable gas
Analyzer and emission monitor (Kane Quintox, KM9106), which is shown in Figure 3.18. The
flue gas compositions were analyzed using a multi-component analyzer based on infrared and
chemical cell technique. The apparatus was purged using fresh air before using it to study the

Chapter 3 Materials and methods
53
Diesel fuel pump
Nanofuel drain line
Nanofuel suction line
Nanofuel reservoir
emission. The exhaust sample to be evaluated was passed through a cold trap (moisture
separator) and filter element to prevent water vapor and particulates from entering into the
analyzer. The hydrocarbon, CO and NOx emission were measured in ppm (parts per million),
and CO2 emission was measured in terms of percentage.
3.8 Field Study
Field study of nanofuel was carried out in three different diesel generators having the capacity of
15, 25 and 30 kW. The diesel supply from the fuel tank to injection filter was disconnected and
the fuel supply was directly taken from the nanofuel reservoir, as shown in Figure 3.19. The fuel
line was drained through the suction pump and it was inserted in the nanofuel reservoir. In order
to replace the residual diesel present in the fuel pump, nanofuel was filled in it using hydraulic
suction pump. The same arrangement was followed for 25 and 30 kW capacity diesel generators.
In order to calculate the fuel consumption, the time taken to consume 1 lit. of nanofuel was
noted and compared with diesel. The pictorial view of all the generators tested for field trials are
shown in Figure 3.20.
Figure 3.19 Suction and drained nanofuel line in the nanofuel reservoir

Chapter 3 Materials and methods
54
Figure 3.20 Three diesel generators used for field trial

55
Chapter 4
Results and Discussion
The results and discussion section gives a detailed technical insight into the various experimental
outcomes in a sequential order as mentioned below:
4.1 Synthesize of ceria based high oxygen storage capacity (OSC) materials
4.2 Selection of a suitable surfactant and a synthesis technique to prepare nanofuel
4.3 Optimization of ceria concentration for the performance of an IC engine
4.4 Dispersion stability studies on nanoparticle dispersed fuels and their characterization
4.5 Engine performance with high OSC nanoparticle dispersed diesel (0.06 wt. % CZY solid
solution / diesel - Nanofuel) and emission studies
4.6 Field trial on nanofuels
4.1 Synthesize of ceria based high oxygen storage capacity (OSC) materials
A ceria based high OSC nanomaterials is essential in order to have a higher catalytic effect in a
three-way catalytic converter. The desirable characteristics of high OSC materials are the cubic
structure and their stability at higher temperature. This section discusses about the selection of a
suitable technique to synthesize high OSC nanoparticles, which will have the above
requirements. The structural stability and formation of a solid solution of nanomaterials were
confirmed by the X-ray diffractometric technique. The thermogravimetric technique was used to
calculate the OSC of a nanomaterial, which were qualitatively confirmed by the Raman
spectroscopy, HRTEM and TMA studies.
4.1.1 Selection of a suitable technique to synthesize CexZr1-xO2 (0.4≤ x≤0.8) solid solutions
based on their OSC
In order to select a suitable technique to synthesize the CexZr1-xO2 (0.4≤ x≤0.8) solid solutions,
the co-precipitation (COP) and sol-gel methods were followed. The nanomaterials were studied
by different characterization techniques in order to confirm the homogeneous solid solution,
OSC band, thermal stability, OSC and lattice defects. Figure 4.1a and 4.1b shows the X-ray

Chapter 4 Results and discussion
56
10 20 30 40 50 60 70
(a)
Inte
nsity (
a.u
)
2 Theta (degree)
(111)
(200)(220)
(311)
COP-CZ-1
COP-CZ-2
COP-CZ-3
COP-CZ-4
COP-CZ-5
CeO2- JCPDS- 34-0394
10 20 30 40 50 60 70 80
CeO2- JCPDS- 34-0394
Inte
nsity (
a.u
)
2 Theta (degree)
SOL-CZ-1
SOL-CZ-2
SOL-CZ-3
SOL-CZ-4
SOL-CZ-5
(111)
(200)(220)
(311) (b)
diffractrogram patterns of the CexZr1-xO2 (CZ) solid solutions prepared by co-precipitation
(COP) and sol-gel method, respectively. In both cases, four intense peaks corresponding to
(111), (200), (220) and (311) planes were observed at around 28, 33, 47 and 57˚, respectively, in
all the 5 combinations of the nanomaterials. These peaks confirmed the presence of
homogeneous solid solution having the cubic fluorite structure, which is also confirmed by
Meng et al. [2010]. It is also observed that there was a small peak shift towards the lower angle
in both cases, which is due to increase of Ce/Zr ratio. The obtained peaks were found to be
shifted from the Joint committee on Powder Diffraction Standards (JCPDS) 34-0394 of cubic
CeO2 structure, which is also shown in Figure 4.1 and it is confirmed that Zr4+
ions were doped
on the lattice of CeO2,
Figure 4.1 XRD patterns of CexZr1-xO2 (0.4≤x≤0.8) solid solutions prepared by (a) COP and
(b) Sol-gel method
Table 4.1 shows the average crystallite size, d-spacing, lattice constant, and OSC of CexZr1-xO2
solid solutions prepared by COP and sol-gel synthesis technique. It was observed that the
crystallite size of CexZr1-xO2 solid solutions prepared by sol-gel technique was less than that of
the COP synthesis technique. It was also noted that the lattice constant of CexZr1-xO2 solid
solutions was found to be less than that of CeO2 (5.420Å). It is due to the fact that the radius of
Zr4+
ions (0.84 Å) is smaller than the Ce4+
ions (0.97Å). The d-spacing was found to be in the
range of 3.11 to 3.12 Å for COP sample and 3.04 to 3.09 Å for sol-gel sample. It is also
confirmed that the strain induced in the ceria due to the substitution of Zr ions was found to be
significantly less.

Chapter 4 Results and discussion
57
Table 4.1 also shows the OSC of CexZr1-xO2 solid solutions prepared by COP and sol-gel
methods. In general, the OSC of sample synthesized by sol-gel technique was observed to be
higher than that of the same synthesized by COP technique. The OSC of Ce0.6Zr0.4O2 prepared
by COP and sol-gel technique was calculated to be 0.140 and 0.147 mol. of O2/mol. of CeO2,
respectively, which is the highest among their own group of synthesized materials, and the
sample prepared by sol-gel technique has the highest OSC among CexZr1-xO2 solid solutions. It
was due to the higher lattice expansion and high significant of OSC band in sol-gel samples than
the COP synthesized samples.
Table 4.1 Structural parameters and OSC of CexZr1-xO2 solid solutions prepared by COP and sol-
gel (SOL) method
Figure 4.2 (a) and (b) shows the Raman spectra of CexZr1-xO2 solid solutions prepared by COP
and sol-gel methods, respectively, where the corresponding major peaks were observed at 470
and 478 cm-1
confirming the cubic fluorite structure of the sample. The OSC band observed in
the range of 610 to 640 cm-1
in both COP and sol-gel synthesized samples confirmed the
presence of oxygen vacancies in solid solutions, which is also supported by Deshpande et al.
[2000]. The OSC band of sol-gel synthesized samples was observed to be more significant than
the COP prepared samples.
Ce0.4Zr0.6O2
(CZ1)
Ce0.5Zr0.5O2
(CZ2)
Ce0.6Zr0.4O2
(CZ3)
Ce0.7Zr0.3O2
(CZ4)
Ce0.8Zr0.2O2
(CZ5)
COP SOL COP SOL COP SOL COP SOL COP SOL
Crystallite
size (nm) 6.0 5.6 6.0 5.7 9.8 7.5 9.0 6.0 10.0 7.5
d-spacing (Å) 3.11 3.06 3.12 3.06 3.11 3.07 3.12 3.09 3.12 3.04
Lattice
constant (Å) 5.27 5.34 5.28 5.38 5.39 5.34 5.39 5.40 5.39 5.31
OSC-(δ) (mol
of O2/mol of
CeO2)
0.024 0.043 0.067 0.121 0.140 0.147 0.102 0.131 0.079 0.102

Chapter 4 Results and discussion
58
200 400 600 800 1000
Sol-CZ-5
Sol-CZ-4
Sol-CZ-3
Sol-CZ-2
Inte
nsity (
a.u
)Raman shift(cm
-1)
Sol-CZ-1
OSC band
(b)
478
200 400 600 800 1000
COP-CZ-1
COP-CZ-2
COP-CZ-3
COP-CZ-4
COP-CZ-5
Inte
nsity (
a.u
)
Raman shift (cm-1)
470
OSC band
(a)
Figure 4.2 Raman spectra of CexZr1-xO2 prepared by (a) COP and (b) Sol-gel method
Figure 4.3 TEM images of Ce0.6Zr0.4O2 prepared by (a) COP and (b) Sol-gel method
As the OSC of Ce0.6Zr0.4O2 was found to be the highest among CexZr1-xO2 solid solutions
irrespective of the synthesize technique, TEM images were obtained for the same. Figure 4.3 (a)
and (b) shows the TEM images of Ce0.6Zr0.4O2 samples synthesized by COP and sol-gel
synthesize technique, respectively, where the shape and size of the samples were observed to be
uniform in each synthesize technique. The particles were found to be spherical in shape and the
size was observed to be less than 8 and 10 nm in sol-gel and COP synthesize technique,
respectively. It was also noted that the size of crystallites in sol-gel technique was found to be

Chapter 4 Results and discussion
59
less than that of COP technique and the particle size obtained from the TEM images was in good
agreement with the XRD results.
It is noted from the above studies that the Ce0.6Zr0.4O2 (CZ3) solid solution was observed to be
the best composition having the highest OSC, 0.147 mol. of O2 /mol. of CeO2, among other
types of solid solutions in CexZr1-xO2. Incorporating an appropriate concentration of Zr ions in
CeO2 lattice increased the mobility of lattice oxygen and OSC. It is observed from the crystallite
size and OSC of the Ce0.6Zr0.4O2 solid solution that the sol-gel method was found to be the best
technique to synthesize the high OSC nanoparticles compared to COP method. Hence, the
Ce0.6Zr0.4O2 solid solutions prepared by sol-gel technique were taken for further studies, where a
25, 50, 75 and 100 % of Zr4+
ions were replaced with 3rd
component in ceria lattice, such as Al,
Mn, Bi, La and Nd in order to further improve the OSC of Ce0.6Zr0.4O2.
4.1.2 Structural analysis of Ce0.6Zr0.4-xY1.3xO2 (CZY) and Ce0.6Zr0.4-xMnxO2 (CZM) (x=0.0,
0.1, 0.2, 0.3, 0.4; Y=Al, Bi, La, Nd)
In order to confirm the formation of a solid solution, the XRD patterns of CZY and CZM fresh
and aged solid solutions were studied. The crystallinity and crystal structure of the test sample
were studied and confirmed using full width at half maximum (FWHM) and JCPDS files,
respectively, through the XRD pattern. The structural stability of CZY and CZM solid solutions
were also confirmed by studying the XRD pattern of aged samples.
Figure 4.4 shows the XRD patterns of fresh Ce0.6Zr0.4-xAl1.3xO2 (0 ≤ x≤0.4) (CZA) solid solution.
The diffractograms of cubic ZrO2 and Al2O3 were also plotted for comparison purpose, where
the respective data were obtained from JCPDS file 49-1642 and 10-0425. It is noted that the
major peak of fresh CZA solid solutions was observed in the range of 28 - 29˚ for (111) plane
and a shoulder peak was noted at 33˚ for (200) plane. An additional shoulder peak was also
spotted in Ce0.6Zr0.4O2 (CZ3) at 60˚. It is well known that the cubic CeO2 exhibits a peak at
28.54˚ (JCPDS 34-0394), the monoclinic ZrO2 reveals the peak at 28.218˚ (JCPDS 83-0944) and
the most stable phase of γ-Al2O3 showed the peak at 66.8˚, Kozlov et al. [2002]. In case of all
the fresh samples of CZA, as shown in Figure 4.4, the peaks corresponding to monoclinic ZrO2
and γ-Al2O3 were not observed, which confirmed the uniform doping of Zr4+
and Al3+
in the
ceria lattice to form a homogeneous solid solution of CZA. It is also confirmed by the formation
of cubic fluorite structure of CZA, Peng et al. [2011]. The X-ray diffractograms of Ce0.6Zr0.4-

Chapter 4 Results and discussion
60
10 20 30 40 50 60 70
CZA4
CZA3
CZA2
CZA1
Inte
nsity (
a.u
)
2 Theta (degree)
ZrO2
Al2O
3
CeO2
CZ3
(111)(200) (220) (311)
xAl1.3xO2 solid solution samples showed that the peaks were relatively broadened compared to
that of Ce0.6Zr0.4O2 with an increase of Al3+
concentration, which indicated that the crystallite
size of CZA was observed to be less compared to that of Ce0.6Zr0.4O2 solid solution. In case of
Ce0.6Zr0.4O2, there was a slight shift from the cubic CeO2 and monoclinic ZrO2, which confirmed
the incorporation of Zr4+
in cubic lattice forming the homogeneous solid solution having the
cubic fluorite structure. It is consistent with the fact that the ionic radius of Zr4+
(0.84 Å) is
smaller than that of Ce4+
(0.97 Å), Wang et al. [2011c].
Figure 4.4 XRD patterns of fresh Ce0.6Zr0.4-xAl1.3xO2 samples
Figure 4.5 shows the diffractogram of aged CeO2, Ce0.6Zr0.4O2 and Ce0.6Zr0.4-xAl1.3xO2 samples.
The major peaks were observed around 28, 33, 47 and 57˚ for all the samples of
Ce0.6Zr0.4-xAl1.3xO2 composition for the plane of (111), (200), (220) and (311), respectively. It is
observed that a decrease in FWHM in CZA aged samples compared to that of fresh samples
confirmed the crystal size growth. The same trend was observed in case of all CZA1–CZA4
solid solutions suggesting the growth of crystallite size of the particles. In general, the peaks of
CZA solid solution were found to be broadened with an increase of Al3+
concentration. The peak
broadening in XRD is accounted for decrease in crystallite size [Wang et al. 2011b], strain effect
[Fitzsimmons et al. 1991] and reduced crystallinity [Suhonen et al. 2001]. However, an increase

Chapter 4 Results and discussion
61
10 20 30 40 50 60 70 80
Aged CeO2
Aged CZA4
Aged CZA3
Aged CZA2
Aged CZA1
Aged CZ3
Inte
nsity (
a.u
)
2 Theta (degree)
(111) (200) (220) (311)
of crystallite size after ageing was less in CZA sample compared to CZ3 sample. The FWHM
was observed to be reduced without any peak shift when Al3+
ions were introduced into CZ3
confirming the relief of stress from the CZA aged samples. In addition to that the ageing of
sample at 800 °C led to rearrangement of crystal orientation, which is expected to reduce the
crystal defects in the material, and it could be inferred from the peak narrowing as compared to
fresh samples. The XRD patterns observed for all the aged CZA samples matched with JCPDS
34-0394 data, and it is confirmed that the CZA solid solution had a homogeneous structure and
thus the highly dispersed Al3+
could not be detected in it. It is inferred that the insertion of Zr4+
and Al3+
has not changed the crystalline phase of CeO2 but improved its structural integrity.
Figure 4.5 XRD patterns of aged Ce0.6Zr0.4-xAl1.3xO2 solid solutions
It is observed from Table 4.2 that the average crystallite size of fresh samples of
Ce0.6Zr0.4-xAl1.3xO2 solid solutions varied from 2.7 to 4.7 nm, where the crystallite size of fresh
sample was observed to be decreased initially with an increase of Al3+
concentration and then it
was started to increase when 100 % replacement of Zr4+
was done with Al3+
. The crystallite size
of all the samples was observed to be lower than that of Ce0.6Zr0.4O2 (CZ3). Due to ageing of the
sample at high temperature (800 °C for 7 hrs), the aggregation of the crystals was expected to
take place leading to increased crystallite size by 45, 20 and 38 % for CZ3, CZA1 and CZA3

Chapter 4 Results and discussion
62
solid solutions, respectively. However, there was no influence of ageing on CZA2 and CZA4.
It was noticed that the d- spacing of fresh CZA was increased slightly with Al3+
substitution in
all the samples. The lattice constant of Ce0.6Zr0.4O2 was found to be 5.31 Å, which is
comparatively less than that of pure ceria i.e. 5.41 Å [Wang et al. 2011c]. The lattice shrinkage
of ceria was caused by the introduction of Zr4+
(0.84 Å), which substitutes a part of Ce4+
(0.97
Å) in the CeO2 structure. In case of Ce0.6Zr0.4-xAl1.3xO2, the lattice constant was found to be
increased due to the increase of Ce/Zr ratio [Hongmei et al. 2010], which is caused by the
replacement of Zr4+
by Al3+
though the ionic radius of Al3+
was reported to be 0.51 Å [Chong et
al. 2004], which is lower than that of Ce4+
and Zr
4+. It could lead to the lattice defects and
improved lattice oxygen mobility. Thus, the lattice constant of CZA was slightly higher than that
of CZ3, which was also supported by Guo et al. [2008]. It is also observed that there was no
appreciable increase in lattice constant of CZA due to ageing. Cerium ions were replaced by
aluminium ions in the CeO2 structure, which played a key role on inhibiting the diffusion of
ions. The introduction of Al3+
in CZ3 suppressed its grain growth leading to a stable structure.
Table 4.2 Crystallite size, d-spacing and lattice constant of fresh and aged Ce0.6Zr0.4-xAl1.3xO2
(CZA) solid solutions
Sample Fresh samples Aged Samples %
increase
of crysta
-llite
size*
Crysta
-llite size
(nm)
d-
spacing
(Å)
Lattice
constant
(Å)
Crysta
-llite size
(nm)
d-
spacing
(Å)
Lattice
constant
(Å)
Ce0.6Zr0.4O2
-CZ3
7.5±
0.3
3.07±
0.03
5.31±
0.05
10.8±
0.9
3.09±
0.01
5.34±
0.04 45
Ce0.6Zr0.3Al0.13O2
-CZA1
4.7±
0.5
3.07±
0.08
5.36±
0.07
5.6±
0.7
3.09±
0.08
5.34±
0.04 20
Ce0.6Zr0.2Al0.26O2
-CZA2
4.7±
0.7
3.08±
0.03
5.33±
0.06
4.7±
0.6
3.07±
0.08
5.31±
0.02 0.2
Ce0.6Zr0.1Al0.39O2
-CZA3
2.7±
0.8
3.10±
0.06
5.49±
0.03
3.7±
0.5
3.07±
0.08
5.31±
0.05 38
Ce0.6Al0.52O2 -
CZA4
3.7±
0.7
3.23±
0.03
5.59±
0.04
3.7±
0.3
3.12±
0.04
5.39±
0.03 0.5
*% increase of crystallite size of aged samples with respect to fresh samples

Chapter 4 Results and discussion
63
10 20 30 40 50 60 70
CZM4
CZM3
CZM2
CZM1
(311)(220)
Inte
ns
ity
(a
.u)
2 Theta (degree)
(111)(200)
ZrO2
Mn2O
3
CeO2
CZ3
Figure 4.6 XRD patterns of fresh Ce0.6Zr0.4-xMnxO2 samples
The XRD patterns of freshly prepared Ce0.6Zr0.4-xMnxO2 (0 ≤ x≤0.4) (CZM) are shown in
Figure 4.6. The diffractograms of cubic ZrO2 and Mn2O3 were also plotted for comparison
purpose, where the respective data were obtained from JCPDS file 49-1642 and 02-0896. It was
noted that ZrO2 and Mn2O3 peaks were not observed in the freshly prepared CZM1 and CZM2
samples. Four strong peaks corresponding to Ce0.6Zr0.4-xMnxO2 were observed to be around
28.55, 33.08, 47.48 and 56.33˚ for the plane of (111), (200), (220) and (311), respectively, which
confirmed the presence of cubic fluorite structure as per JCPDS 34-0394. Though all the
samples of Ce0.6Zr0.4-xMnxO2 composition exhibited major peaks similar to that of CeO2, a peak
shift towards the lower angle side was observed with an increase of Mn ions substitution in place
of Zr4+
, which is due to the smaller ionic radius of Zr4+
(0.84 Å), Mn3+
(0.62 Å) and Mn2+
(0.83 Å) compared to Ce4+
(0.97 Å) and Ce3+
(1.14 Å). The above observation is an indication of
the changes in the lattice constant and confirmation of the formation of a homogeneous solid
solution. An increasing trend observed for the d-spacing of CZM confirmed the above finding,
which is presented in Table 4.3. A change in the d-spacing was due to induced uniform strain by
doping smaller ionic radius metals like Zr4+
and Mn3+
in the ceria lattice and it is also supported
by Atkinson et al. [2000]. The strain induced in the material is expected to increase the d-spacing

Chapter 4 Results and discussion
64
10 20 30 40 50 60 70
Aged CZM4
Aged CZM3
Aged CZM2
Aged CZM1
Aged CZ3
Inte
ns
ity
(a
.u)
2 Theta (degree)
(111)
(200) (220) (311)
Aged CeO2
leading to a peak shift towards a lower angle side. It is also noted that the tetragonal zirconia
peaks corresponding to 34.5 and 35.3˚, as referred by Hori et al. [1998], were not found in CZM
even at higher concentration of Zr. A peak observed at 32.2˚ proved the presence of α-Mn2O3 in
CZM3 and CZM4, which is due to the saturation of solubility limit of Mn ions in ceria- zirconia
solid solutions.
Figure 4.7 shows the XRD patterns of Ce0.6Zr0.4-xMnxO2 (0 ≤ x≤0.4) aged samples. The peaks
were observed to be around 28.80, 33.55, 47.80 and 56.84˚ for the respective plane of (111),
(200), (220) and (311). A continuous peak shift towards lower angle side was observed in all
aged samples. These results revealed that the aged samples continued to have the cubic fluorite
structure similar to that of fresh samples, even though the samples were heated till 800 °C for
7 hrs. A decrease in FWHM in aged sample compared to that of fresh samples confirmed the
crystal growth. No XRD peaks pertaining to ZrO2 and Mn2O3 were observed in the samples
except CZM3 and CZM4.
Figure 4.7 XRD patterns of aged Ce0.6Zr0.4-xMnxO2 samples

Chapter 4 Results and discussion
65
Table 4.3 Crystallite size, d-spacing and lattice constant of fresh and aged Ce0.6Zr0.4-xMnxO2
(CZM) solid solutions
Table 4.3 gives the information about the crystallite size, d-spacing and lattice constant of both
fresh and aged samples of CZM, where the crystallite size of CZM was found to be varied from
2.7 to 3.6 nm. The FWHM of CZM samples was observed to be increased with dopant and it
reached maximum when 50 % of Zr ions were replaced with Mn ions. The increase in crystallite
size of CZM3 and CZM4 was due to the saturation of solubility limit of Mn in Ce - Zr structure
and it led to the additional peaks corresponding to Mn ions. In case of Ce0.6Zr0.4O2, the lattice
constant was found to be 5.31 Å for (111) plane, which was less than that of pure ceria. i.e. 5.41
Å. It can be justified with the fact that the ionic radius of Zr4+
(0.84 Å) was less than that of Ce4+
(0.97 Å). The replacement of Zr ions by Mn ions led to increase the d-spacing of CZM.
Although ionic radius of Mn is noted to be less than that of ceria, the d-spacing was found to be
increased with Ce/Zr ratio, which was also supported by Hongmei et al. [2010]. The lattice
constant was observed to be decreased in fresh CZM1 and CZM2 samples and increased in
Samples
Fresh samples Aged samples %
increase
of crysta
-llite
size*
Crysta
-llite size
(nm)
d-
spacing
(Å)
Lattice
constant
(Å)
Crysta
-llite size
(nm)
d-
spacing
(Å)
Lattice
constant
(Å)
Ce0.6Zr0.4O2
-CZ3
7.5±
0.3
3.07±
0.03
5.31±
0.05
10.8±
0.9
3.09±
0.01
5.34±
0.04 45
Ce0.6Zr0.3Mn0.1O2
-CZM1
3.3±
0.5
3.07±
0.04
5.29±
0.03
3.6±
0.7
3.09±
0.05
5.29±
0.05 9
Ce0.6Zr0.2Mn0.2O2
-CZM2
2.7±
0.4
3.07±
0.09
5.28±
0.05
3.4±
0.7
3.09±
0.03
5.29±
0.02 26
Ce0.6Zr0.1Mn0.3O2
-CZM3
3.4±
0.2
3.09±
0.02
5.32±
0.04
3.8±
0.4
3.12±
0.02
5.35±
0.03 12
Ce0.6Mn0.4O2 -
CZM4
3.6±
0.2
3.11±
0.06
5.34±
0.02
3.9±
0.7
3.13±
0.02
5.37±
0.02 8
*% increase of crystallite size of aged samples with respect to fresh samples

Chapter 4 Results and discussion
66
10 20 30 40 50 60 70
CZB4
CZB3
CZB2
CZB1
Inte
nsity (
a.u
)
2 Theta (degree)
ZrO2
Bi2O
3
CeO2
CZ3
(111)
(200) (220) (311)
CZM3 and CZM4 samples compared to fresh CZ3 samples. It is due to the solubility limit of Mn
in CZ3 solid solutions, which led to the appearance of Mn2O3 peak. The peak shift, changes in d-
spacing and the absence of ZrO2 and Mn2O3 peak confirmed the formation of a solid solution in
CZM1 and CZM2 with cubic structure. The crystallite size of aged CZM solid solutions was
observed to be varied from 3.9 to 3.4 nm. The crystallite size of aged samples compared to fresh
samples was found to be maximum, when 50 % of Zr ions were replaced by Mn ions. It was
clearly noticed that the crystallite size of CZ3 was increased after ageing treatment due to the
effect of sintering and crystal growth. However, this effect was reduced significantly after the
replacement of Zr ions by Mn ions. It is noted from the results that the increase in d-spacing of
fresh and aged samples was observed to be increased with Mn ions concentration. The lattice
constant was found to be varied very marginally after the ageing treatment compared to that of
fresh sample. It is confirmed from the above studies that the structural stability of CZM was
maintained even at elevated temperature of 800 °C.
Figure 4.8 XRD patterns of fresh Ce0.6Zr0.4-xBi1.3xO2 samples
Figure 4.8 depicts the XRD patterns of freshly prepared Ce0.6Zr0.4-xBi1.3xO2 (CZB) (0 ≤ x≤0.4)
samples. In addition to those results, the peaks corresponding to ZrO2 and Bi2O3 are also shown,
which were obtained from JCPDS file 49-1642 and 77-0374, respectively, for the comparison
purpose. Four major peaks were observed to be around 28, 32, 47 and 56˚ for the corresponding
plane of (111), (200), (220) and (311), which confirmed the cubic fluorite structure according to

Chapter 4 Results and discussion
67
20 30 40 50 60 70 80
Aged CZB4
Aged CZB3
Aged CZB2
Aged CZB1
Aged CZ3Inte
nsity (
a.u
)
2 Theta (degree)
Aged CeO2
(111)
(200) (220) (311)
JCPDS file 34-0394. The absence of ZrO2 and Bi2O3 peaks in CZB samples confirmed the
formation of a homogeneous solid solution with the insertion of Zr and Bi ions in the ceria
lattice. The ionic radius of Bi3+
was found to be 1.03 Å, which was and higher than Ce4+
(0.97 Å)
Zr4+
(0.84 Å) and lower than Ce3+
(1.14 Å). A continuous shift in peak towards the lower angle
side in CZB was due to the increase of Ce/Zr ratio and the strain induced due to the insertion of
higher ionic radius of Bi ions.
Figure 4.9 XRD patterns of aged Ce0.6Zr0.4-xBi1.3xO2 samples
Figure 4.9 shows the XRD patterns of aged Ce0.6Zr0.4-xBi1.3xO2 (0 ≤ x≤0.4) (CZB) samples. The
peaks were observed to be around 28, 32, 47 and 56˚ same as that of the fresh samples, which
confirmed their cubic fluorite structure even after ageing the sample up to 800 °C. The FWHM
was found to be decreased without any peak shift for the aged samples compared to that of the
corresponding fresh samples, which was significant for higher particle size and it was reported in
Table 4.4. However, the increase in crystallite size of aged CZB sample compared to that of the
fresh sample was not found to be significant. The ageing process of the sample rearranged the
crystal and its orientation, and it could be inferred from the decrease in FWHM compared to the
fresh samples.

Chapter 4 Results and discussion
68
Table 4.4 shows the crystallite size, d-spacing and lattice constant of fresh and aged
Ce0.6Zr0.4-xBi1.3xO2 samples. The crystallite size of CZB samples was found to be varied around
2.72 ±0.06 nm, and the d-spacing was observed to be increased with Bi3+
concentration, which
was also due to the strain present in the material. The increase in crystallite size due to ageing
was not significant in all the CZB composition. The increase in lattice constant was due to the
insertion of larger ionic radius of Bi3+
ions in the ceria lattice in both fresh and aged samples.
The change in lattice constant and d-spacing of aged samples was not significantly influenced in
comparison with that of fresh samples.
Table 4.4 Crystallite size, d-spacing and lattice constant of fresh and aged Ce0.6Zr0.4-xBi1.3xO2
(CZB) solid solutions
Sample
Fresh samples Aged samples %
increase
of crysta
-llite
size*
Crysta
-llite size
(nm)
d-
spacing
(Å)
Lattice
constant
(Å)
Crysta
-llite size
(nm)
d-
spacing
(Å)
Lattice
constant
(Å)
Ce0.6Zr0.4O2 -
CZ3
7.5±
0.3
3.07±
0.03
5.31±
0.05
10.8±
0.9
3.09±
0.01
5.34±
0.04 45
Ce0.6Zr0.3Bi0.13O2
-CZB1
2.7±
0.5
3.07±
0.05
5.23±
0.03
2.8±
0.3
3.08±
0.05
5.26±
0.03 3.3
Ce0.6Zr0.2Bi0.26O2
-CZB2
2.8±
0.2
3.07±
0.04
5.31±
0.18
2.8±
0.1
3.08±
0.13
5.28±
0.02 1.7
Ce0.6Zr0.1Bi0.39O2
-CZB3
2.7±
0.7
3.08±
0.16
5.33±
0.05
2.8±
0.5
3.08±
0.02
5.33±
0.04 3.6
Ce0.6Bi0.52O2 -
CZB4
2.8±
0.9
3.12±
0.46
5.40±
0.15
2.8±
0.9
3.13±
0.02
5.42±
0.03 1.7
*% increase of crystallite size of aged samples with respect to fresh samples

Chapter 4 Results and discussion
69
10 20 30 40 50 60 70
CZL4
CZL3
CZL2
Inte
nsity (
a.u
)
2 Theta (degree)
ZrO2
La2O
3
CeO2
CZ3
CZL1
(111)
(200) (220) (311)
The XRD patterns of freshly prepared Ce0.6Zr0.4-xLa1.3xO2 (CZL) (0 ≤ x≤0.4) are shown in Figure
4.10. The peaks for ZrO2 and La2O3 were also shown, which were obtained from JCPDS file 49-
1642 and 22-0369, respectively, along with CZL samples in order to compare those peaks. Four
major peaks were observed around 28, 33, 48 and 55˚ for the plane of (111), (200), (220) and
(311), respectively. The crystallite size of fresh CZL samples was observed to be varied in the
range of 2.80 to 2.95 nm. The XRD pattern of CZL samples confirmed their cubic fluorite
structure according to JCPDS 34-0394 of cubic CeO2. It was revealed that all the peaks in the
pattern of CZL showed a slight shift towards lower angle with an increase of La and / or Zr ions
substitution in the ceria lattice. The sequential change of the diffraction peaks confirmed the
formation of a single-phase solid solution. As no XRD patterns corresponding to La2O3 and
ZrO2 were observed in CZL samples, it is suggested that the La and Zr ions were inserted in the
ceria lattice and formed a homogenous solid solution of CZL.
Figure 4.10 XRD patterns of fresh Ce0.6Zr0.4-xLa1.3xO2 samples
The XRD patterns of aged Ce0.6Zr0.4-xLa1.3xO2 (0 ≤ x≤0.4) samples are shown in Figure 4.11.
Aged CeO2 and Ce0.6Zr0.4O2 samples were also plotted for the comparison. Though the observed
peaks of aged samples were similar to that of the fresh samples, the FWHM was found to be
decreased confirming the increased crystallite size of CZL. A continuous peak shift towards the
lower angle side was observed with the substitution of La3+
in place of Zr4+
in Ce0.6Zr0.4O2. The

Chapter 4 Results and discussion
70
20 30 40 50 60 70 80
Aged CZL4
Aged CZL3
Aged CZL2
Aged CZL1
Aged CZ3
Inte
nsity (
a.u
)
2 Theta (degree)
Aged CeO2
(111)
(200) (220) (311)
crystallite size of aged CZL was calculated and found to be varied in the range of 2.85 to 4.51
nm, which are shown in Table 4.5.
Figure 4.11 XRD patterns of aged Ce0.6Zr0.4-xLa1.3xO2 samples
The crystallite size, d-spacing and lattice constant of fresh and aged samples of
Ce0.6Zr0.4-xLa1.3xO2 (CZL) were calculated from the XRD data and the results are presented in
Table 4.5. It is observed that the crystallite size of CZL was strongly influenced by the
substitution of La ions. The crystallite size of fresh CZL samples was in the range of 2.80 to
2.96 nm, when the Zr ions were replaced by La ions in Ce0.6Zr0.4O2. In case of aged CZL
samples, the crystallite size was found to be increased significantly compared to that of fresh
samples. The increase in crystallite size of aged sample was found to be the highest for the CZL2
sample and the lowest for the CZL4 sample compared to that of CZL fresh samples. The lattice
constant of aged CZL was observed to be varied from 5.31 to 5.41 Å, which was less than that of
the CeO2 of 5.410 Å. The doping of large ionic radius of La3+
(1.17 Å), Ikeda et al. [2005], in
CZ3 lattice was expected to increase the lattice constant of CZL, where the same was observed
to be increased in both fresh and aged samples.

Chapter 4 Results and discussion
71
Table 4.5 Crystallite size, d-spacing and lattice constant of fresh and aged Ce0.6Zr0.4-xLa1.3xO2
(CZL) solid solutions
Figure 4.12 shows the XRD pattern of the fresh Ce0.6Zr0.4-xNd1.3xO2 (CZN) (0 ≤ x≤0.4) solid
solutions, where the peaks of ZrO2 and Nd2O3 referred from JCPDS file 49-1642 and 83-1356,
respectively, were also presented along with fresh CZN samples for the comparison purpose.
The peaks were observed to be around 29, 33, 48 and 57˚ for the plane of (111), (200), (220) and
(311), respectively in all the CZN samples, where peaks corresponding to Nd2O3 and ZrO2 were
not observed. The formation of a solid solution was confirmed with the peak shift in CZN1 and
CZN2. Though the characteristic peaks for cubic fluorite structure of CeO2 were found in all
CZN samples, the peaks corresponding to Nd2O3 were observed in CZN3 and CZN4 confirming
the presence of cubic Nd2O3. It might be due to the saturation limit of Nd3+
ions in ceria lattice.
Sample
Fresh samples Aged samples %
increase
of crysta
-llite
size*
Crysta
-llite size
(nm)
d-
spacing
(Å)
Lattice
constant
(Å)
Crysta
-llite size
(nm)
d-
spacing
(Å)
Lattice
constant
(Å)
Ce0.6Zr0.4O2 -CZ3 7.5±
0.3
3.07±
0.03
5.31±
0.05
10.8±
0.9
3.09±
0.01
5.34±
0.04 45
Ce0.6Zr0.3La0.13O2
-CZL1
2.8±
0.3
3.13±
0.06
5.32±
0.02
3.2±
0.5
3.11±
0.15
5.31±
0.17
12.0
Ce0.6Zr0.2La0.26O2
-CZL2
2.9±
0.7
3.12±
0.07
5.36±
0.05
4.5±
0.8
3.13±
0.10
5.35±
0.01
36.8
Ce0.6Zr0.1La0.39O2
-CZL3
3.0±
0.3
3.14±
0.04
5.39±
0.03
3.3±
0.6
3.16±
0.04
5.37±
0.01 9.1
Ce0.6La0.52O2 -
CZL4
2.8±
0.2
3.15±
0.11
5.39±
0.02
2.9±
0.5
3.18±
0.16
5.41±
0.03
1.7
*% increase of crystallite size of aged samples with respect to fresh samples

Chapter 4 Results and discussion
72
10 20 30 40 50 60 70
CZ3
CZN4
CZN3
CZN2
CZN1
CeO2
Nd2O
3
Inte
nsity (
a.u
)
2 Theta (degree)
ZrO2
(111)
(200) (220) (311)
10 20 30 40 50 60 70
Aged CZN4
Aged CZN3
Aged CZN2
Aged CZN1
Aged CZ3
Inte
nsity (
a.u
)
2 Theta (degree)
(111)
(200)(220) (311)
Aged CeO2
Figure 4.12 XRD patterns of fresh Ce0.6Zr0.4-xNd1.3xO2 samples
Figure 4.13 XRD patterns of aged Ce0.6Zr0.4-xNd1.3xO2 samples
The X-ray diffractogram patterns of aged Ce0.6Zr0.4-xNd1.3xO2 (0 ≤ x≤0.4) solid solutions are
shown in Figure 4.13 along with aged samples of CeO2 and CZ3 for comparison purpose. It is
observed that the FWHM was observed to be decreased, which resulted in higher crystallite size
compared to that of fresh samples. The development of cubic Nd2O3 was evident after ageing in
case of CZN3 and CZN4 as like that of fresh samples. The crystallite size of aged CZN was

Chapter 4 Results and discussion
73
found to be increased compared to that of fresh CZN samples and varied from 7.5 to 8.5 nm,
which is about 10-19 % enhancement in comparison with fresh samples and it might be due to
the sintering effect of the doping element present in CZN.
Table 4.6 Crystallite size, d-spacing and lattice constant of fresh and aged Ce0.6Zr0.4-xNd1.3xO2
(CZN) solid solutions
Table 4.6 gives the crystallite size, d-spacing and lattice constant of fresh and aged samples of
Ce0.6Zr0.4-xNd1.3xO2 solid solutions. The crystallite size and d-spacing of aged CZN were
calculated from their major peak (111). Lattice constant of CZN was found to be increased from
5.30 to 5.40 Å in fresh CZN samples with the replacement of Zr ions by Nd ions in ceria lattice.
The lattice expansion was due to the higher ionic radius of Nd3+
(1.109 Å), Wu et al. [2007],
compared to that of Ce4+
and Zr4+
. The phenomenon also was observed in aged CZN lattice.
Samples
Fresh samples Aged samples %
increase
of crysta
-llite
size*
Crysta
-llite size
(nm)
d-
spacing
(Å)
Lattice
constant
(Å)
Crysta
-llite size
(nm)
d-
spacing
(Å)
Lattice
constant
(Å)
Ce0.6Zr0.4O2 -CZ3 7.5±
0.3
3.07±
0.03
5.31±
0.05
10.8±
0.9
3.09±
0.01
5.34±
0.04 45
Ce0.6Zr0.3Nd0.13O2
-CZN1
6.5±
0.5
3.06±
0.07
5.30±
0.06
7.6±
0.7
3.16±
0.05
5.32±
0.02 18
Ce0.6Zr0.2Nd0.26O2
-CZN2
6.6±
0.6
3.11±
0.04
5.38±
0.04
7.5±
0.6
3.19±
0.07
5.37±
0.02 14
Ce0.6Zr0.1Nd0.39O2
-CZN3
7.7±
0.7
3.12±
0.07
5.40±
0.02
8.5±
0.5
3.20±
0.06
5.39±
0.03 10
Ce0.6Nd0.52O2
-CZN4
6.6±
0.6
3.10±
0.03
5.37±
0.05
7.8±
0.4
3.22±
0.04
5.40±
0.03 19
*% increase of crystallite size of aged samples with respect to fresh samples

Chapter 4 Results and discussion
74
100 200 300 400 500 600 700 800 900
84
86
88
90
92
94
96
98
100
CZA3
CZA2
CZA4
Ma
ss (
%)
Temperature (°C)
CZA1
(a)
4.1.3 Quantitative studies on oxygen storage capacity (OSC) of CZY and CZM solid
solutions by thermogravimetric analysis
The solid solutions of Ce0.6Zr0.4-xY1.3xO2 (CZY) and Ce0.6Zr0.4-xMnxO2 (CZM) were heated from
30 to 800 °C and cooled down to 150 °C. Then the second heating cycle was followed up to
800 °C. Figure 4.14 a-e shows the weight loss pattern of the second heating cycle of CZY and
CZM solid solutions and these data were used to calculate the OSC of the same, as described by
Ozawa et al. [2000].
It is observed from Figure 4.14 (a-e) that the change in weight loss was found to be high in
Ce0.6Zr0.2Al0.26O2 (CZA2), Ce0.6Zr0.2Mn0.2O2 (CZM2), Ce0.6Zr0.1Bi0.39O2 (CZB3),
Ce0.6Zr0.2La0.26O2 (CZL2) and Ce0.6Zr0.3Nd0.13O2 (CZN1) from the composition of CZA, CZM,
CZB, CZL and CZN solid solutions, respectively. It is also noted that the CZA2 has the highest
weight loss compared to all the samples considered in the present study.

Chapter 4 Results and discussion
75
100 200 300 400 500 600 700 800 900
90
92
94
96
98
100
CZM2
CZM3
CZM4
Ma
ss (
%)
Temperature (°C)
CZM1
(b)
100 200 300 400 500 600 700 800
95
96
97
98
99
100
CZB3
CZB4
CZB1
Ma
ss (
%)
Temperature (°C)
CZB2
(c)

Chapter 4 Results and discussion
76
100 200 300 400 500 600 700 800 900
90
92
94
96
98
100
CZL2
CZL3
CZL4
Ma
ss (
%)
Temperature (°C)
CZL1
(d)
100 200 300 400 500 600 700 800 900
92
93
94
95
96
97
98
99
100
CZN3
CZN1
CZN4
Ma
ss (
%)
Temperature (°C)
CZN2
(e)
Figure 4.14 Weight loss of the CZY and CZM solid solutions during the second heating cycle:
(a) Ce0.6Zr0.4-xAl1.3xO2, (b) Ce0.6Zr0.4-xMnxO2, (c) Ce0.6Zr0.4-xBi1.3xO2, (d) Ce0.6Zr0.4-xLa1.3xO2,
(e) Ce0.6Zr0.4-xNd1.3xO2

Chapter 4 Results and discussion
77
The OSC data can be used to characterize the oxygen transfer capability of catalytic materials.
The release and intake of oxygen in ceria occur owing to the following reversible reaction. Eq.
4.1 shows the conversion of Ce4+
to Ce3+
or vice versa.
2 2 3 2
12
2CeO Ce O O
... (4.1)
The high OSC material can be chosen for the catalytic activity under reducing environment due
to its oxygen releasing mechanism and the same for CexZr1-xO2 is shown in Eq. 4.2
22x1x
3
2
4
212x1
4
x O2
OZr)CeCe(OZrCe
... (4.2)
Since the value of vacancy content is very small, the reaction must be written as follows for the
metal oxides having oxygen vacancy content with little structural change, Ozawa et al. [2000].
The substitution of third element (Al3+
, Mn2+
, Bi3+
, La3+
and Nd3+
) along with Zr4+
into the ceria
lattice follows the oxygen releasing mechanism as described in Eq 4.3 to 4.7 for CZY and CZM
solid solutions.
22x3.1x4.06.0
3
2
4
212x3.1x4.06.0 O2
OAlZr)CeCe(OAlZrCe
... (4.3)
22xx4.06.0
3
2
4
212xx4.06.0 O2
OMnZr)CeCe(OMnZrCe
... (4.4)
22x3.1x4.06.0
3
2
4
212x3.1x4.06.0 O2
OBiZr)CeCe(OBiZrCe
... (4.5)
22x3.1x4.06.0
3
2
4
212x3.1x4.06.0 O2
OLaZr)CeCe(OLaZrCe
... (4.6)
22x3.1x4.06.0
3
2
4
212x3.1x4.06.0 O2
ONdZr)CeCe(ONdZrCe
... (4.7)
The method of calculation of OSC from the weight loss data is discussed below in detail.
Eq. (4.2) was used to calculate the OSC of CZ samples. In order to understand the methodology
used to calculate the OSC, the weight loss and OSC values were referred from Ozawa et al.
[2000] and the same was verified based on the procedure as cited below.

Chapter 4 Results and discussion
78
Composition of the sample (Ce0.8Zr0.2O2)0.3/Al2O3; Weight loss: 0.26 % and δ : 0.08, Ozawa
et al. [2000].
Molecular weight of the individual element:
Ce = 140 g/mol, Zr =91 g/mol, Al =27 g/mol, O =16 g/mol,
Mn = 55 g/mol, La = 139 g /mol, Bi = 209 g/mol
Molecular weight of (Ce0.8Zr0.2O2)0.3/Al2O3 = 150.66 g/mol
In 150.66 g /mol of solid solution, it contains 48.66 g of Ce0.8Zr0.2O2
It can be written as per gram, like 150.66 g of the sample contains 48.66 g of Ce0.8Zr0.2O2
Then 100 gram of the sample contains (48.66/150.66)*100=32.3 g of Ce0.8Zr0.2O2
The weight loss from 32.3 g of Ce0.8Zr0.2O2 = 0.26 g of oxygen
According to Eq. (4.2) (δ/2)*(weight of Ce0.8Zr0.2O2 / mol. weight of Ce0.8Zr0.2O2 )
= weight of O2/ mol weight of O2
δ/2 = (0.26/32)*(162.2/32.3)
δ = 0.08 mol of oxygen/mol of catalyst
As the calculation methodology followed was matched with rest of the samples, reported by
Ozawa et al. [2000], the same procedure was followed for the CZY and CZM samples. The
methodology adopted for Ce0.6ZrxAl1.3xO2 samples to calculate the OSC with respect to CeO2 is
given below:
The observed weight loss of Ce0.6Zr0.1Al0.39O2 (CZA3) was 1.726 %.
The molecular weight of Ce0.6Zr0.1Al0.39O2 (CZA3) = 133.2 g/mol
In 133.2 g/mol, the sample contains 116 g/mol of CeO2
It can be written as
133.2 g of the solid solution contains 116 g of CeO2
Then 100 g of the CZA3 sample contains = (116/133.2)*100 = 87.087 g of CeO2
i.e., 87.087 g of CeO2 lost 1.726 g of oxygen
As the doping elements such as Zr, Al, Mn, Bi, La and Nd were used to influence the redox
process of Ce4+
in to Ce3+
or vice versa, the OSC was calculated against the concentration of
CeO2.

Chapter 4 Results and discussion
79
According to Eq. 4.3
(δ/2)*(weight of CeO2 / mol. weight of CeO2 )
= weight of O2/ mol weight of O2
δ/2 =(1.726/32)*(172/87.087)
δ = 0.21305 mol of oxygen/mol of CeO2
The OSC of rest of the test samples was calculated using the Eq. 4.3, 4.4, 4.5, 4.6 and 4.7 for
CZA, CZM, CZB, CZL and CZN solid solution, respectively and the results are reported and
compared with OSC of CZ3 and it is shown in Figure 4.15, where the comparison of the
respective OSC with CZ3 was also presented.
Figure 4.15 shows the OSC of Ce0.6Zr0.4O2 (CZ3), Ce0.6Zr0.4-xY1.3xO2 and Ce0.6Zr0.4-xMnxO2
(0≤x≤0.04) solid solutions. The OSC data were arranged in an order of CZA, CZM, CZN, CZL
and CZB composition and compared with each other and CZ3. It is observed that the OSC of
solid solutions was influenced by the concentration of the doping elements in ceria. The OSC of
Ce0.6Zr0.4O2 was influenced by the replacement of Zr4+
by 3rd
element which created more
defects in the CeO2 lattice. It is noted that the high OSC was observed in Ce0.6Zr0.2Al0.26O2
(CZA2), Ce0.6Zr0.2Mn0.2O2 (CZM2), Ce0.6Zr0.1Nd0.13O2 (CZN1), Ce0.6Zr0.2La0.26O2 (CZL2) and
Ce0.6Zr0.1Bi0.39O2 (CZB3) among Ce0.6Zr0.4-xAl1.3xO2, Ce0.6Zr0.4-MnxO2, Ce0.6Zr0.4-xNd1.3xO2
Ce0.6Zr0.4-xLa1.3xO2 and Ce0.6Zr0.4-xBi1.3xO2 solid solutions, respectively. The possible reasoning
for the enhancement of OSC is explained as follows: Two essential requirements for an efficient
OSC material were the oxygen vacancies and high anion mobility, Cho. [1991]. Thus, the
following effects on dopant concentration on the oxygen mobility are to be considered:
1) Oxygen mobility was increased with oxygen vacancy concentration, which was increased
with the concentration of dopant; 2) The associative interaction between the dopant cation and
the oxygen vacancy was increased with the concentration of dopant resulting to the reduced
oxygen mobility. Thus, the high OSC was found at the optimum concentration of the dopant.
The respective mechanisms were called as dopant vacancy compensation mechanism and dopant
interstitial compensation mechanism, Bao et al. [2008]. The change in OSC with respect to the
concentration of 3rd
element in CZ3 was due to the above mechanism, where OSC of the CZY
and CZM was increased and then decreased with doping element against its concentration.

Chapter 4 Results and discussion
80
0.0
0
0.0
5
0.1
0
0.1
5
0.2
0
0.2
5
CZ
NC
ZL
CZ
BC
ZM
CZ
3C
ZN
1 C
ZN
2 C
ZN
3 C
ZN
4C
ZL1 C
ZL2 C
ZL3 C
ZL4C
ZB
1 C
ZB
2 C
ZB
3 C
ZB
4
OSC (mol of O2 /mol of CeO2)
CZ
A1C
ZA
2 C
ZA
3 C
ZA
4 CZ
M1 C
ZM
2 C
ZM
3 C
ZM
4
CZ
A
Refe
rence
-27%5
6%
45
%
-22%
-24%
22
%
-27%
-51%
-93%-8
1%
-78%
-82%
-15%
-33% -4
1% -5
4%
-88%
-44%
-70% -8
5%
Fig
ure
4.1
5 C
om
par
ison o
f th
e O
SC
of
Ce 0
.6Z
r 0.4
-xY
1.3
xO
2 a
nd C
e 0.6
Zr 0
.4-x
Mn
xO
2 (
Y=
Al,
Nd, L
a, B
i; 0
≤x≤
0.0
4)
sam
ple
s ag
ainst
CZ
3

Chapter 4 Results and discussion
81
The OSC of Ce0.6Zr0.4-xBi1.3xO2, Ce0.6Zr0.4-xNd1.3xO2 and Ce0.6Zr0.4-xLa1.3xO2 solid solutions was
found to be less than that of Ce0.6Zr0.4O2. In case of CZB solid solution, it might be due to the
fact that the release of oxygen from the lattice could be below 300 °C which was also supported
by Yasuda et al. [2010]. As the weight loss occurred during 300 to 800 °C was considered to
calculate the OSC of a catalyst, Ozawa [2000], the OSC of CZB3 samples was observed to be
less than 78 % in comparison to that of Ce0.6Zr0.4O2. Since the oxygen released from the solid
solution was proposed to be used to enhance the combustion in an internal combustion engine,
the oxygen released from the CZB might not able to solve the purpose of using the same.
In CZN composition, the reduced OSC might be due to the formation of Nd2O3 after 75 % of
substitution of Nd ions, which was confirmed by XRD technique. The appearance of Nd2O3
peak in CZN3 and CZN4 prevented the formation of a solid solution, which was favored for
higher OSC. In case of CZL, it was observed that the OSC of CZL2 was 44 % less that of CZ3
solid solution. The localized increase of lattice distance after the substitution of 2nd
and 3rd
element was the indication of lattice defects. In Ce0.6Zr0.4-xLa1.3xO2 composition, the lattice
expansion was observed to be increased with the concentration of La3+
. It was due to the doping
of larger ionic radius of La ions in the ceria lattice along with Zr ions. However, the reduced
OSC observed in CZB, CZN, and CZL compared to CZ3 was due their higher ionic radius
compared to Ce4+
.
Figure 4.16 shows the comparison of OSC and specific surface area of Ce0.6Zr0.2Al0.26O2
(CZA2), Ce0.6Zr0.1Al0.39O2 (CZA3), Ce0.6Zr0.2Mn0.2O2 (CZM2), Ce0.6Zr0.2Nd0.13O2 (CZN1),
Ce0.6Zr0.2La0.26O2 (CZL2) and Ce0.6Zr0.1Bi0.39O2 (CZB3) solid solutions with respect to
Ce0.6Zr0.4O2 (CZ3). The OSC of CZA2, CZA3 and CZM2 was 56, 45 and 22 % higher than that
of CZ3, respectively, whereas the OSC of CZB3, CZL2 and CZN1 solid solutions was 78, 44
and 15 % less than that of CZ3, respectively. The lattice expansion was caused due to the doping
of 2nd
and 3rd
element in the ceria lattice, where the 3rd
elements were Al, Mn, Bi, La and Nd and
the 2nd
element was Zr4+
. The lattice expansion of CZB, CZL and CZN solid solutions was due
to the higher ionic radius of Bi3+
(1.03 Å), La3+
(1.17 Å) and Nd3+
(1.109 Å), respectively, in
comparison with pure Ce4+
(0.97 Å). Though the ionic radius of Al3+
(0.51 Å) and Mn2+
(0.83 Å)
was less than that of CeO2, the lattice expansion was due to the increase in concentration of
Ce/Zr ratio. Thus, the lattice expansion in case of CZA and CZM was the indication of lattice
defects, which were desirable to increase the OSC of a material, and it was present only in case

Chapter 4 Results and discussion
82
CZA2 CZA3 CZM2 CZN1 CZL2 CZB3
-80
-60
-40
-20
0
20
40
60
80
100
120
140
Incre
ase
in
OS
C a
nd
sp
ecific
su
rfa
ce
are
a w
ith
re
sp
ect to
CZ
3 (
%)
OSC
SSA
of Ce0.6Zrx-0.4Al1.3xO2 (CZA), Ce0.6Zrx-0.4MnxO2 (CZM) solid solutions. The high OSC was found
in CZA2 and CZM2 solid solutions among the CZA and CZM composition respectively, which
was due to the vacancy compensation and dopant interstitial compensation mechanism, as
discussed earlier.
Figure 4.16 Comparison of OSC and specific surface area (SSA) of different solid solutions with
respect to Ce0.6Zr0.4O2
Table 4.7 gives the BET-specific surface area of high OSC nanoparticles. Since the OSC of
CZA2, CZM2, CZB3, CZL2 and CZN1 was found to be the highest in CZA, CZM, CZB, CZL
and CZN solid solutions, respectively, a study on specific surface area was focused only for
those solid solutions. The specific surface area of CZA3 was also studied due to its positive
improvement of OSC compared to CZ3. The specific surface area of ceria was observed to be
increased with the substitution of Zr4+
, Al3+
, Mn2+
, Bi3+
, La3+
and Nd3
in its lattice. It was found
that the specific surface area of CZA2, CZA3 and CZM2 was 139, 18 and 1 % higher than that
of CZ3 sample. However, the same for CZB3, CZL2 and CZN1 solid solution was noted to be
52, 46 and 38 % less compared to that of CZ3 samples. These results were also presented in
Figure 4.16, where the reduction of OSC of CZB3, CZL2 and CZN1 in comparison to that of
CZ3 was correlated with reduced specific surface area of the solid solution. It was also observed
that CZA2, CZA3 and CZM2 had increased specific surface area leading to increased OSC

Chapter 4 Results and discussion
83
compared to CZ3. Among the best combination of CZA and CZM, the specific surface area and
OSC of CZA2 were found to be the highest compared to that of CZA3 and CZM3.
Table 4.7 BET specific surface area for high OSC nanoparticles
Sl.No Ceria based high
OSC nanoparticles
Nomenclature OSC
(mol. of O2/mol.
of CeO2)
Specific surface
area
(m2/g)
1 CeO2 CeO2 - 3.676
2 Ce0.6Zr0.4O2 CZ3 0.147 50.743
3 Ce0.6Zr0.2Al0.26O2 CZA2 0.2293 121.496
4 Ce0.6Zr0.1Al0.39O2 CZA3 0.2131 60.125
5 Ce0.6Zr0.2Mn0.2O2 CZM2 0.1799 51.199
6 Ce0.6Zr0.1Bi0.39O2 CZB3 0.0327 23.903
7 Ce0.6Zr0.2La0.26O2 CZL2 0.0817 27.106
8 Ce0.6Zr0.2Nd0.13O2 CZN1 0.1256 31.458
In order to increase the OSC of ceria, Al3+
, Mn2+
, Bi3+
, La3+
and Nd3+
were doped along with
Zr4+
through the sol-gel preparation technique. From the OSC studies, it was found that the
doping of Al3+
yielded a better solid solution which has the highest OSC compared to rest of the
ions reported in the present study.
Since the OSC of CZA2, CZM2, CZB3, CZL2 and CZN1 was found to be highest in their
respective solid solutions, the TEM images were obtained only for those samples.
4.1.4. TEM studies on high OSC solid solutions
TEM analysis provides information about the size and shape of primary particles and their state
of agglomeration.
The TEM images of fresh Ce0.6Zr0.2Al0.26O2 (CZA2) sample are shown in Figure 4.17 (i-iv) at
different magnification. The size of the crystals was observed to be less than 5 nm with and
without agglomeration. The shape of the particles was observed to be spherical in nature. The

Chapter 4 Results and discussion
84
i ii
iii iv
observation made from TEM images in connection with crystallite size was in good agreement
with the XRD results.
Figure 4.17 (i-iv) TEM images of fresh Ce0.6Zr0.2Al0.26O2 at different magnification
Figure 4.18 (i-iv) shows the TEM images of fresh Ce0.6Zr0.2Mn0.2O2 solid solutions in three
different magnifications. The particles observed from the TEM images were in the average size
of 4 nm and spherical in nature and the crystallite size was observed to be in good agreement
with the results of XRD. The crystallites were observed to be uniform.

Chapter 4 Results and discussion
85
(i) (ii)
(i)
(iv)(iii)
(ii)
Figure 4.18 (i-iv) TEM images of fresh Ce0.6Zr0.2Mn0.2O2 at different magnification
Figure 4.19 (i-ii) TEM images of fresh Ce0.6Zr0.2Bi0.39O2

Chapter 4 Results and discussion
86
Figure 4.19 (i-ii) shows the TEM images of fresh Ce0.6Zr0.2Bi0.26O2 solid solutions. The particles
were observed to be uniform in size and shape. The crystallites were found to be equiaxed and
spherical in shape with an approximate size of 4 nm.
Figure 4.20 shows the TEM image of fresh Ce0.6Zr0.2La0.26O2, where a densely packed
crystallites along with agglomeration were observed. The crystallite size was observed to be less
than 5 nm and well matched with the XRD results. The shape of the crystallites was found to be
spherical.
Figure 4.20 TEM image of fresh Ce0.6Zr0.2La0.26O2
Figure 4.21 shows the TEM image of fresh Ce0.6Zr0.2Nd0.1O2. It was observed that the shape and
size of test sample were observed to be uniform. The size of the crystals was reported to be less
than 10 nm and matched with XRD results.

Chapter 4 Results and discussion
87
Figure 4.21 TEM image of fresh Ce0.6Zr0.2Nd0.13O2
4.1.5 Qualitative confirmation of OSC
Since the OSC of Ce0.6Zr0.2Al0.26O2 (CZA2), Ce0.6Zr0.1Al0.39O2 (CZA3) and Ce0.6Zr0.2Mn0.2O2
(CZM2) was found to be higher than that of Ce0.6Zr0.4O2 (CZ3), the qualitative confirmation
studies such as OSC band, coefficient of thermal expansion and lattice defects were carried out
only for CZA and CZM samples using Raman spectroscopy, thermomechanical analyzer and
HRTEM, respectively.
4.1.5.1. Lattice vibration studies
Since, the XRD pattern is generated by the cation sub-lattice, it showed no tetragonality. It
exhibits an oxygen displacement from the ideal fluorite sites, whose structure was much closer
to that of cubic structure. Raman spectroscopy is a potential tool to differentiate between t”
(tetragonal) and cubic phase based on the oxygen lattice vibrations, which are sensitive to crystal
symmetry, Zhang et al. [2009].

Chapter 4 Results and discussion
88
0 200 400 600 800 1000 1200
CZA4
CZA3
CZA2
CZA1
Inte
nsity(a
.u)
Raman shift (cm-1)
CZ3
474
471
464
462
469
OSC Band
Figure 4.22 Raman spectra of fresh Ce0.6Zr0.4-xAl1.3xO2 solid solutions
The Raman spectra of the fresh Ce0.6Zr0.4-xAl1.3xO2 solid solutions are shown in Figure 4.22,
where an intense peak around 470 cm-1
and a very small shoulder peak around 610 cm-1
were
observed in all the samples. The peak at 474 cm-1
was attributed to the perfect CeO2 based cubic
fluorite lattice due to the vibration mode of F2g symmetry and there was no sign of tetragonal
modification, which was supported by Jia et al. [2008]. The peak observed at 610 cm-1
for fresh
samples confirmed the presence of oxygen vacancies in the solid solution, which was also
confirmed by Deshpande et al. [2004]. Thus, the improvement of oxygen mobility of
Ce0.6Zr0.4O2 was noticed due to the introduction of Al3+
. It is also observed that there were no
distinctive peaks for the monoclinic and tetragonal phases of zirconia. A very small peak at 310
cm-1
in Ce0.6Zr0.4O2 and 300 cm-1
in Ce0.6Zr0.1Al0.39O2 sample revealed the negligible presence of
tetragonal phase (t″). It is also observed that the peaks were broadened and found to be
asymmetric in comparison with Ce0.6Zr0.4O2 confirming the presence of more defective structure
in fresh CZA solid solution. A shift in the major peak observed for CZA samples compared to
Ce0.6Zr0.4O2 samples was due to distortion of the oxygen sublattice influenced by the sharing of
O2-
anions with Al and compressive strain in the sample.

Chapter 4 Results and discussion
89
0 200 400 600 800 1000 1200
Aged CZA4
Aged CZA3
Aged CZA2
Aged CZA1
Inte
nsity(a
.u)
Raman shift (cm-1)
Aged CZ3
477
474
472
469
464
OSC band
Figure 4.23 Raman spectra of aged Ce0.6Zr0.4-xAl1.3xO2 solid solution
The Raman spectra of aged Ce0.6Zr0.4-xAl1.3xO2 samples are shown in Figure 4.23, where a strong
intense peak in the range of 464 to 477 cm-1
was observed. The OSC band was observed in all
the aged samples of CZA. There was no phase separation of all CZA samples and no change in
the presence of OSC peak observed around 600 and 610 cm-1
due to ageing. Thus, it is
reasonable to state that the Ce0.6Zr0.4-xAl1.3xO2 formed a solid solution and it maintained the high
oxygen mobility after the aging process.
Figure 4.24 depicts the Raman spectra of fresh Ce0.6Zr0.4-xMnxO2 samples. It was observed that
the Raman spectrum exhibited a strong band in the range of 474–459 cm-1
and a shoulder peak
around 611–631 cm-1
in all the samples. The major peak observed about 465 cm-1
was assigned
to F2g vibration mode of a cubic fluorite CeO2 like structure. The peak observed about 611 cm-1
might be due to the lattice distraction or oxygen vacancies. The same effect was observed in all
CZM samples. The peaks observed around 460 and 621 cm-1
for Ce0.6Zr0.2Mn0.2O2 (CZM2)
confirmed its cubic fluorite structure, which was also supported by Jia et al. [2008]. The peak
observed around 600 cm-1
, Deshpande et al. [2004], 620 cm-1
, Prasad et al. [2009] and 570 cm-1
,
Reddy and Khan [2005] confirmed the presence of oxygen vacancies or lattice defect in CZM
compounds. It is noted that the band observed at around 462 cm-1
became broader and weaker

Chapter 4 Results and discussion
90
0 200 400 600 800 1000 1200
CZM 4
CZM 3
CZM 2
CZM 1
Raman shift (cm-1)
CZ 3
474
468
465
462
459
Inte
ns
ity
(a
u)
OSC Band
with an increase of Mn ions. The reasoning for band broadening is the presence of more oxygen
vacancies, which is related to the changes in the structure of CeO2 in the presence of Zr/ Mn
ions, Hu et al. [2009]. A continuous shift in major peak towards the lower wave length for all the
fresh samples was observed with an increase of Ce/Zr ratio and it was due the increase in lattice
constant and lattice defects.
Figure 4.24 Raman spectra of fresh Ce0.6Zr0.4-xMnxO2 samples
The Raman spectra of aged Ce0.6Zr0.4-xMnxO2 samples are shown in Figure 4.25. It was observed
that there were negligible peak shift in all the aged samples compared to that of fresh samples
and the number of bands observed for all the spectra was observed to be the same. It was noted
that the peaks observed for the aged samples were found to be weak compared to that of fresh
samples. The peak broadening in aged Ce0.6Zr0.2Mn0.2O2 (CZM2) sample compared to fresh
sample confirmed the presence of more defective sites, as supported by Zhang et al. [2009]. The
peak shift observed in aged samples was increased with Ce/Zr ratio, lattice defects and the lattice
constant. With the above observation, it is confirmed that the structure of Ce0.6Zr0.4-xMnxO2 was
not changed due to ageing.

Chapter 4 Results and discussion
91
0 200 400 600 800 1000 1200
Aged CZM4
Aged CZM3
Aged CZM2
Aged CZM1
Inte
ms
ity
(a
.u)
Raman shift (cm-1)
Aged CZ3
476
468
464
461
459
OSC band
Figure 4.25 Raman spectra of aged Ce0.6Zr0.4-xMnxO2 samples
4.1.5.2 Studies on thermal expansion
The thermal expansion of Ce0.6Zr0.4-xAl1.3xO2 samples against temperature is shown in
Figure 4.26. It is observed that the thermal expansion of all the samples was increased non-
linearly in the temperature range of 100 – 300 °C and linearly after 300 °C. It was also observed
that the Ce0.6Zr0.4-xAl1.3xO2 samples showed negative and positive thermal expansion from room
temperature to 200 °C and above 200 °C, respectively. Though metals have positive thermal
expansion, some metal oxides contract upon heating during a particular temperature range and
have negative thermal expansion (NTE), Govindaraj et al. [2007], which is expected to be
caused by the vibration of the oxide structure of the sample. The phenomenon of the decrease of
NTE is explained by considering the M–O–M bond (M = metal bonded with oxygen), which is
schematically represented in Figure 4.27. Due to longitudinal vibration of oxygen, the distance
between metal and oxygen bond was increased leading to reduced distance between the metal
and metal bond, Evans et al. [1998]. The thermal expansion of the sample beyond 200 °C was
increased with kinetic energy, which resulted to increase the equilibrium spacing of atoms. Due
to the enhancement of anti-sintering characteristics, the thermal expansion of CZA was restricted
with an increase of Al3+
concentration. It is observed that the thermal expansion of

Chapter 4 Results and discussion
92
0 200 400 600 800 1000
-0.3
-0.2
-0.1
0.0
0.1
0.2
0.3
0.4
0.5
Str
ain
(%
)
Temperature (°C)
CZA1
CZ3
CZA3
CZA4
CZA2
Temperature
Temperature
Ce0.6Zr0.2Al0.26O2 (CZA2) was found to be the lowest compared to that of any other samples
reported in Ce0.6Zr0.4-xAl1.3xO2 composition.
Figure 4.26 Thermal expansion behavior of Ce0.6Zr0.4-xAl1.3xO2 samples
Figure 4.27 A schematic representation about transverse thermal vibration of M-O-M Bond,
Evans et al. [1998]

Chapter 4 Results and discussion
93
CZ3 CZA1 CZA2 CZA3 CZA4
0.0
0.4
0.8
1.2
1.6
Ce0.6
Zr0.4-x
Al1.3x
O2 (0.0x0.4) solid solutions
CT
E (
1/K
X1
0-5)
200-600°C
600-1000°C
4.7%
no significant
change
11.8%4.8%
10.6%
Figure 4.28 Coefficient of thermal expansion (CTE) of Ce0.6Zr0.4-xAl1.3xO2 at different
temperature range
Figure 4.28 shows the CTE of Ce0.6Zr0.4-xAl1.3xO2 (CZA) samples in the temperature range of
200-600 °C and 600-1000 °C. It is noticed that the CTE of CZ3, CZA2, CZA3 and CZA4 was
increased by 4.7, 11.9, 4.8 and 10.6 %, respectively, in the temperature range of 600-1000 °C
compared to the range of 200-600 °C. Though CTE of CZA1 was observed to be decreased by
1.2 %, it is well within the experimental deviation. The enhancement of CTE of sample in the
temperature range of 600-1000 °C was due to the loss of oxygen and the associated reduction of
Ce4+
to Ce3+
. The change of valancy of cerium caused to increase the ionic radius of sample
from 0.9 to 1.47 Å, thus the loss of oxygen led to the formation of anionic vacancy causing the
increased CTE, Fagg et al. [2005]. An increase of CTE beyond 600 °C was due to enhanced
oxygen vacancies leading to higher CTE for CZA2 compared to that of any other composition of
Ce0.6Zr0.4-xAl1.3xO2.
The influence of Mn and Zr ion substitution in CeO2 lattice on the thermal expansion of
Ce0.6Zr0.4-xMnxO2 is shown in Figure 4.29. The change in thickness of the sample with respect to
temperature was recorded from 30 to 1000 °C. All the samples experienced the negative thermal
expansion below 200 °C. Thermal expansion of Ce0.6Zr0.4-xMnxO2 was increased linearly with

Chapter 4 Results and discussion
94
0 200 400 600 800 1000
-0.2
0.0
0.2
0.4
0.6
0.8
1.0
1.2
CZM1
CZM3
CZM4
CZM2
Str
ain
(%
)
Temperature (°C)
CZ3 CZM1 CZM2 CZM3 CZM4
0.0
0.2
0.4
0.6
0.8
1.0
1.2
1.4
1.6
Ce0.6
Zr0.4-x
MnxO
2 (0.0X0.4) solid solutions
CT
E (
m/m
- K
x1
0-5)
200-600°C
600-1000°C
4.7%
13%
18% 15%
no difference
temperature beyond 200 °C. It is observed that the thermal expansion of CZM2 was found to be
higher compared to that of any other Ce0.6Zr0.4-xMnxO2 samples reported in the present study.
Figure 4.29 Thermal expansion behavior of Ce0.6Zr0.4-xMnxO2 samples
Figure 4.30 Coefficient of thermal expansion of Ce0.6Zr0.4-xMnxO2 at different temperature range

Chapter 4 Results and discussion
95
2 n m2 n m
Since the increase in thermal expansion of the sample beyond 600 °C was an indication of more
oxygen vacancies, the coefficient of thermal expansion of Ce0.6Zr0.4-xMnxO2 composition at a
different temperature range was studied and the results are shown in Figure 4.30. The increase in
CTE of the samples from 200 – 600 °C to 600 – 1000 °C was observed to be 4.7, 13, 18, 15 and
0 % for CZ3, CZM1, CZM2, CZM3 and CZM4, respectively. The increase in CTE of CZM2 in
the above referred temperature range was found to be high due to the presence of high-oxygen
vacancy.
4.1.5.3 Lattice defects confirmation
In order to study the influence of Zr, Al and Mn ions substitution in ceria lattice on its OSC,
HRTEM images were obtained for CeO2, Ce0.6Zr0.4O2 (CZ3), Ce0.6Zr0.2Al0.26O2 (CZA2) and
Ce0.6Zr0.2Mn0.2O2 (CZM2) and the results are compared.
Figure 4.31 HRTEM image and filtered image of CeO2 without significant lattice defect
Figure 4.31 shows the HRTEM image of CeO2, where it showed the perfect lattice plane with
the interplanar distance of 0.15 nm without any significant surface defects. The filtered image
indicates the lattice fringes without any crystal defects. It is also observed that the lattice fringes
were oriented uniformly in the same direction. It was clearly identified from the marked portion
that CeO2 lattice fringes were observed to have no significant defects.

Chapter 4 Results and discussion
96
2 n m2 n m
(i)
(ii)
(iii)
(i) (ii)
(iii)
Figure 4.32 HRTEM images of Ce0.6Zr0.4O2, (i) filtered image without lattice defect, (ii) Filtered
image with lattice defect-edge dislocation and (iii) Filtered image with lattice defect- edge
dislocation

Chapter 4 Results and discussion
97
(i) (ii)
(iii)
(iv)(v)
(i)
(ii)
(iii)(iv)(v)
Figure 4.32 shows the HRTEM image of Ce0.6Zr0.4O2, where few defects were identified from
the marked portions, which were due to the substitution of Zr ions in CeO2 lattice. The marked
portion in the image was filtered and represented separately, where the edge dislocation defects
were noticed. In some cases, the non-defective fringes were also noted, which agrees well with
the interplanar spacing corresponding to the (111) plane.
Figure 4.33 HRTEM images of Ce0.6Zr0.2Al0.26O2 (i) - (v) Filtered image with lattice defects
Figure 4.33 shows the HRTEM images of Ce0.6Zr0.2Al0.26O2, where many distinguished defects
resulting to more oxygen vacancies were observed. The marked portions in the image were
presented as corresponding filtered images (i-v), where the lattice defects in CZA2 were

Chapter 4 Results and discussion
98
(i)
(ii)
(iii) (iv)
(i) (ii)
(iii) (iv)
identified to be the edge dislocation. The distorted lattice fringes were the indication of lattice
defects. The interplanar spacing of CZA2 was observed to be around 0.28 nm. The increase in
interplanar distance is due to the insertion of Al3+
ions resulting to the increase of Ce/Zr ratio.
Figure 4.34 HRTEM image of Ce0.6Zr0.2Mn0.2O2 (i-iv) Filtered image with lattice defects

Chapter 4 Results and discussion
99
Figure 4.34 shows the HRTEM images of Ce0.6Zr0.2Mn0.2O2, where more number of defects, and
the randomized orientation of lattice fringes were observed. It gave an impression that the
particles were not coalesced. The marked portions in HRTEM image were filtered and
represented separately with the indication of i-iv, where the defective and dislocated lattice
fringes where identified, which were due to the substitution of Zr and Mn ions in ceria lattice.
These lattice defects were expected to play a significant role for the improvement of OSC
compared to other type of samples.
From the OSC and its confirmation studies, it was found that the doping of Al3+
yielded a solid
solution which has the highest OSC compared to rest of the ions Mn2+
, Bi3+
, La3+
and Nd3+
. It
was noted that the introduction of Zr4+
and Al3+
ions into ceria lattice led to considerable
modification of its textural, structural and redox properties, which were confirmed by the
different characterization techniques: (1) enhancement of BET specific surface area in CZA, (2)
effective restraining of sintering the crystallite particles, stabilizing the pseudo-cubic t″-phase
restricting the phase separation of CZA to form a homogeneous solid solution and high thermal
stability, (3) creating more defective structure and enhancing the mobility of bulk oxygen which
contributes to the increase of OSC and redox properties of CZA systems.
4.2 Optimization of surfactant and synthesis technique to prepare nanofuel
In order to prepare a highly stable nanofuel at least for a period of one week, it was synthesized
using different surfactants and preparation techniques. Different surfactants according to their
hydrophilic head charge namely anionic (SDS), cationic (CTAB) and nonionic (tween 20, oleic
acid, tween 80) were used. Different types of nonionic category surfactants were selected based
on their chain length. Tip sonication, magnetic stirring and combination of both were used to
synthesize the nanofuel in order to select a suitable preparation technique for stable nanofuel.
4.2.1 Influence of surfactant on the stability of nanofuel
Figure 4.35 shows the comparison of relative stability of nanofuels having the concentration of
0.06 wt. % of CeO2 with and without adding the surfactants. The nanofuels were prepared using
tip sonication technique for 1 hr with different surfactants and the samples were observed for 7
hrs under static condition in order to select a suitable surfactant to prepare the nanofuel for
further studies. It was observed that the nanofuel prepared without any surfactant was found to

Chapter 4 Results and discussion
100
0 1 2 3 4 5 6 7 8
50
60
70
80
90
100
Re
lati
ve
sta
bil
ity
(%
)
Time (hrs)
without surfactant
SDS
CTAB
Tween 20
Oleic Acid
Tween 80
have 80 and 55 % stability after 2 and 7 hrs, respectively. However, the nanofuel prepared with
CTAB, SDS, tween 20, oleic acid and tween 80 surfactant was found to have 63, 65, 78, 84 and
89 % stability, respectively, at the end of 7 hrs. It was noted that the nanofuel prepared with
tween 80 maintained 100 % stability for about 3 hrs. However, the same prepared with tween 20
and oleic acid as a surfactant was observed to be 100 % stable for about 1 hr only. Beyond 2 hrs
of its preparation, the tween 20 based nanofuel showed the rapid sedimentation of nanoparticles
compared to that of oleic acid. At the end of 7 hrs, the increase in stability of CTAB, SDS, tween
20, oleic acid and tween 80 based nanofuel was found to be 14, 17, 42, 53 and 63 %,
respectively, compared to that of the nanofuel prepared without any surfactant. The surfactant
was found to promote the physical stability of nanofuel and the stability enhancement of the
same was observed to be low in anionic / cationic surfactants and high in non-ionic surfactants
compared to that of the nanofuel prepared without any surfactants. It was due to the fact that the
surfactant kept the particles dispersed in the base fluid by electrostatic repulsive forces among
the particles and hydrophobic surface forces due to physical adsorption of surfactant by solid
particles, and it was also supported by Murshed et al. [2005].
Figure 4.35 Influence of different surfactants on the relative stability of nanofuel having
0.06 wt. % of CeO2

Chapter 4 Results and discussion
101
CeO2 CeO2
CeO2 CeO2
Ceria nanoparticles exhibited a tendency for aggregation and formation of the large entangled
agglomerates due to their size and high surface energy in base fuel. The rate of sedimentation of
nanoparticles was found to be high in nanofuel, when no surfactant was used, which was due to
strong Van der Waals force of attraction among nanoparticles due to their size. The increase in
stability of nanofuel with surfactant was due to the fact that the surfactant molecules get
adsorbed over the ceria surface by their hydrophobic segments with hydrophilic head directed
towards the base fluid, which was also confirmed by Lisunova et al. [2006]. The electrostatic
stabilization achieved in ionic surfactants was due to the presence of negative and positive
hydrophilic head charges in SDS and CTAB, respectively, Paria et al, [2004], and their
respective schematic diagrams are shown in Figures 4.36a and 4.36b. The presence of single
hydrocarbon chain in CTAB and SDS surfactants has the tendency to form micelles leading to
higher rate of sedimentation of nanoparticles in base fluid, which was also supported by Tah et
al. [2011]. Though the homogeneous dispersion of CTAB and SDS was ensured in nanofuel
using a suitable synthesis technique, it was not advisable to use them in a CI engine where the
fuel injectors and nozzle holes are expected to be blocked due to their size.
a)
b)
Figure 4.36 Electrostatic stabilization mechanism of (a) CTAB and (b) SDS surfactant on
Nanofuel

Chapter 4 Results and discussion
102
CeO2 CeO2
r
CeO2
r
CeO2 h
δ δ
CeO2 h
h < 2δ
CeO2 δ
r
δ
r
Figure 4.37 Steric stabilization mechanism of Non-ionic surfactant
In case of nonionic surfactants, the steric stabilization mechanism was observed in nanofuel.
The long-chain molecules present in tween 20, tween 80 [Young et al. 2000] and oleic acid
[Morales et al. 2005] were attached to the nanoparticles and they form a layer between the
particle and the fluid molecules, where the thickness of adsorbed layer was noted to be δ. These
layers increased the potential between the particles and imparted repulsive force between them.
If two particles maintain the separation distance of h, which is smaller than 2δ, the adsorbed
layers can overlap or become compressed, resulting the strong repulsion. The above mechanism
is schematically shown in Figure 4.37. Though tween 20 and tween 80 belong to the same group
of surfactant, both differs with hydrophobic compound attached with them. Tween 20 has lauric

Chapter 4 Results and discussion
103
acid and tween 80 has oleic acid as a hydrophobic structure, Lorenz et al. [1977]. Steric
stabilization occurs due to the presence of steric barriers from the adsorbed nonionic molecules
that prevent the particles coming close enough to dominate the Van der Waals force of attraction
between the particles. Tween 80 contains the ethylene oxide and long hydrocarbon chain
compared to oleic acid and it imparts both lipophilic and hydrophilic characteristics, Som et al.
[2014], leading to increased stability of nanofuel compared to oleic acid and tween 20 based
nanofuel.
By comparing all the results, the nanofuel with tween 80 was observed to show the improved
stability, where the sedimentation was found to be nearly 0 % for at least 3 hrs and 10 % at the
end of 7 hrs. Eventhough the nanofuel with oleic acid was observed to show the 100 % stability
for 1 hr, the sedimentation was observed to be increased by around 33 % compared to that of the
nanofuel having tween 80 at the end of 7 hrs. With respect to time, the reduction in nanofuel
stability was due to the depletion of surfactant layer of nanoparticles caused by the frequent
collision among them. Thus, the nanoparticles were observed to be stable during initial period
after synthesis of nanofuel but started to settle with respect to time. However, the rate of
sedimentation was found to be influenced by the nature of surfactant used to prepare the
nanofuel. Hence, the nanofuel with tween 80 was used for further studies in order to suggest a
suitable preparation technique with different concentration of nanofuel.
4.2.2 Influence of preparation technique on the relative stability of nanofuel
Figure 4.38 illustrates the relative stability of nanofuel with tween 80 as a surfactant prepared by
magnetic stirrer for 2 hrs at different CeO2 concentration for the period of 72 hrs. As the rapid
sedimentation of nanoparticles was noted in all cases, the experiments were limited to 72 hrs.
The samples were kept motionless till completion of the test. It was noted that the relative
stability of nanofuel was observed to be 100 % in all the concentration for the period of 2 hrs.
After 2 hrs period of the nanofuel preparation, the rate of settling of nanoparticles was observed
to be high with an increase of the concentration of CeO2. Due to lower concentration of CeO2,
the distance between the particles was sufficient enough to dominate both the repulsive and
attractive forces acting against each other. With the absence of repulsive and attractive forces
between the particles, the nanoparticles were subjected to continuous collision against each other
due to the Brownian motion, which caused the sapping of adsorbed surfactant layer. In due

Chapter 4 Results and discussion
104
0 10 20 30 40 50 60 70 80
55
60
65
70
75
80
85
90
95
100
105
Re
lati
ve
sta
bil
ity
(%
)
Time (hrs)
0.04 wt%
0.02 wt%
0.06 wt%
0.08 wt%
0.10 wt%
course of time, the nanoparticles started to aggregate and then agglomerate and thus the
gravitational force influenced the rate of sedimentation of the particles even at lower
concentration. When the particle concentration was increased, the minimum distance between
the particles was decreased and it caused the domination of Van der Waals force of attraction
leading to aggregation and sedimentation of them. Thus, the stability of nanofuel was decreased
continuously. Due to the continuous stirring process, the temperature of nanofuel was also
increased leading to depletion of the adsorbed surfactant layer of the nanoparticles. Thus, the
agglomeration of nanoparticle was observed and it results the sedimentation of the particles.
After 72 hrs of its preparation, the relative stability of nanofuel was observed to be 72.8, 71.3,
68, 64.8 and 61.5 % for 0.02, 0.04, 0.06, 0.08 and 0.1 wt. % of CeO2, respectively.
Figure 4.38 Relative stability of nanofuel prepared by magnetic stirrer for 72 hrs
Figure 4.39 shows the relative stability of nanofuel at different concentrations with tween 80 as a
surfactant prepared using the tip sonicator for 2 hrs. During the sample preparation, the
temperature of the nanofuel was maintained at 35 °C using an ice bath. It is observed that the
relative stability of nanofuel was observed to be within 93 % after 72 hrs of ageing for all the
concentration of CeO2 dispersed nanofuel. The stability of nanofuel synthesized by the tip
sonication technique was found to be high compared to that of the sample prepared through

Chapter 4 Results and discussion
105
0 20 40 60 80 100 120 140 160 180
84
86
88
90
92
94
96
98
100
102
Re
lative
sta
bili
ty (
%)
Time (hrs)
0.1wt%
0.08wt%
0.06wt%
0.04wt%
0.02wt%
magnetic stirring method. The relative stability of nanofuel at 0.02, 0.04, 0.06, 0.08 and 0.10 wt.
% was observed to be 93.5, 91.4, 87.0, 86.0 and 84.6 %, respectively, at the end of 168 hrs,
where the corresponding 100 % relative stability of the above was observed for the period of 4,
3, 3, 2 and 1 hr. The decrease in stability with time could be due to the damage on the adsorbed
layer of the surfactant coating over the particles caused by the collision between the particles.
Thus, the electrostatic repulsive forces and hydrophobic surface forces generated by the
surfactant became less. The Van der Waals force of attraction between the particles is expected
to overcome the hydrophobic surface forces leading to the formation of agglomeration, and the
particle clusters started to settle due to gravitational force. In comparison with the results
reported against Figure 4.35, it is noted that the sedimentation was noted to be 1 and 11 % for
the sonication of nanofuel by 2 and 1 hr, respectively, at the end of 7 hrs.
Figure 4.39 Relative stability of nanofuel prepared by tip sonicator for 168 hrs
Various forces such as gravitational force, electrostatic repulsive force and Van der Waals
attractive force acting on the particles are playing an important role in the dispersion stability of
the nanofuel. In both cases of sample preparation technique as discussed above, it is noted that a
0.02 wt. % nanofuel was found to be more stable for a longer period of time compared to rest of
the sample. When particles became closer than the equilibrium distance during the Brownian
motion of particles, the Van der Waals force of attraction dominates and these two particles are

Chapter 4 Results and discussion
106
0 20 40 60 80 100 120 140 160 180 200
65
70
75
80
85
90
95
100
Re
lative
sta
bili
ty (
%)
Time (hrs)
Magnetic stirring
Tip sonication
Combined
attracted each other leading to increased size of agglomeration and thus the gravitational force
influences the sedimentation. The above phenomenon is more significant when CeO2
concentration was high. The ratio between volume of liquid and volume of particles was found
to be 3.6 x 10¹⁰
, 1.8 x 10¹⁰
, 1.2 x 10¹⁰
, 0.9 x 10¹⁰
and 0.72 x 10¹⁰
for the concentration of 0.02,
0.04, 0.06, 0.08 and 0.1 wt. %, respectively. It is noted that the volumetric ratio of liquid to
particles was observed to be decreased with an increase of concentration. The above observation
was confirmed by the fact that the rate of sedimentation was proportional to the concentration of
CeO2. The effect of gravitational force, which favors the sedimentation, became dominant in the
nanofuel even with less concentration of CeO2 particles with time.
Figure 4.40 Comparison of relative stability of 0.06 wt. % nanofuel
Figure 4.40 shows the comparison of relative stability of nanofuel based on the preparation
techniques namely magnetic stirring, tip sonication and combined technique of both. Due to high
rate of sedimentation, the relative stability of nanofuel was studied up to 72 hrs in case of
magnetic stirring method. However, the relative stability of nanofuel synthesized by tip
sonication and combined technique was studied up to 168 hrs. It is observed that the nanofuel
prepared by the magnetic stirring method showed the poor stability compared to rest of the
techniques even within 72 hrs of its preparation. Overall, the combined technique of nanofuel

Chapter 4 Results and discussion
107
preparation showed the best results compared to that of individual techniques up to 168 hrs of
sample preparation.
It is observed from Table 4.8 that the combined method produced more stable nanofuel than the
rest of the methods, where the summary of the relative stability after 72 hrs and 168 hrs of
ageing is given in addition to duration of 100 % relative stability. Since the probe sonicates for
30 min. followed by the magnetic stirring for 30 min. alternatively for the period of 2 hrs, it
helped to maintain the surfactant coating over the nanoparticles. The density of the supernatant
of nanofuel was also studied for the same testing period in order to support the above findings,
where it was observed to be varied in the range of 0.838 to 0.843 g/cm3 during the testing period.
From the above studies, the homogeneous dispersion of the nanoparticles and the stability of
nanofuel were confirmed to be superior, when the sample was prepared by the combined
method.
Table 4. 8 Relative stability of nanofuel based on the synthesis technique
The XRD patterns of (i) as received CeO2 nanoparticles and (ii) CeO2 nanoparticles derived
from centrifuging the nanofuel prepared from magnetic stirring, tip sonication and combined
technique were studied and the results are shown in Figure 4.41. The XRD profile confirmed the
polycrystalline nature of cerium oxide nanoparticles. The high intensity peaks were observed at
28.6, 33.15, 47.55 and 56.45˚ for the lattice plane of (111), (200), (220) and (311), respectively.
The observed peaks were matched with JCPDS-ICDD No: 81-0792 of CeO2 crystal. The strain
present in the nanoparticles was calculated using the FWHM of the main peak of XRD pattern of
CeO2 and it was found to be 0.351, 0.452 and 0.356 % for the preparation technique of magnetic
stirring, tip sonication and combined method, respectively. The strain induced in the
Magnetic Stirring Tip sonication Combined Technique
After 72 hrs of ageing 68.4 % relative
stability
95.3 % relative
stability 97 % relative stability
After 168 hrs of ageing Not applicable 87 % relative
stability 91.6 % relative stability
100 % relative stability
till 1 hr 3 hr 24 hr

Chapter 4 Results and discussion
108
10 20 30 40 50 60 70
(311)(221)(200)
CeO2- Combined techique
CeO2- Tip sonication
CeO2- Magnetic stirring
Inte
nsity (
a.u
)
2 Theta (deg)
Pure untreated CeO2
(111)
nanoparticle by the centrifugal force during the particle separation from the nanofuel was
considered to be the same irrespective of the processing technique followed to prepare the
nanofuel. The process induced strain on the nanoparticles was calculated by subtracting the
inherent strain present in the as received CeO2 nanoparticle and it is observed to be 1.04, 8.14
and 1.56 % for the preparation technique of magnetic stirring, tip sonication and combined
technique, respectively. The strain developed in the nanoparticle due to tip sonication process
was observed to be the highest compared to other processing techniques and it might be one of
the reasons for damaging the surfactant coating over the nanoparticles, which caused their
sedimentation after the specific period. Though the strain developed in the nanoparticle by the
combined technique and magnetic stirring method was found to be approximately same, the
surfactant coating was removed in later case due to high rate of heat generation. The nanofuel
prepared through the combined technique has the good stability for a long period of time while
maintaining the surfactant coating over the CeO2 nanoparticles.
Figure 4.41 XRD patterns of derived CeO2 nanoparticle from nanofuel
Figure 4.42 shows the TEM images of the nanofuel drop synthesized by the magnetic stirring,
tip sonication method and combined technique at different magnifications. It is observed from
Figure 4.42a that the particles were observed to be more agglomerated in the magnetic stirring
preparation technique. In case of tip sonication technique, the particles were observed to be non-

Chapter 4 Results and discussion
109
a b
C d
uniform nature due to more strain present in the particles, which are shown in Figure 4.42b.
However, a uniform size of nanoparticles is observed in Figure 4.42c and 4.42d, where the
nanofuel was synthesized by the combined technique and it is expected that the inherent
characteristics of the nanoparticles were maintained without any distortion.
Figure 4.42 TEM images of nanofuel drop synthesized by the a) Magnetic stirring, b) Tip
sonication, c) Combined technique in 20nm scale, d) Combined technique in 50nm scale
The above results indicated that the combination of tip sonication and magnetic stirring was a
successful synthesis technique to prepare homogeneous dispersion of CeO2 in diesel for a longer
period of time.
4.2.3 Accelerated relative stability study
Figure 4.43 and 4.44 shows the relative stability of CeO2 based nanofuel at 0.06 wt. % by the
natural and accelerated sedimentation condition, respectively. The later was used to reduce the
time consumption required for the stability studies and to predict the relative stability of the
nanofuel against ageing. An accelerated ageing study using centrifuge was done at 1000 rpm for

Chapter 4 Results and discussion
110
0 5 10 15 20 25 30
86
88
90
92
94
96
98
100
102
Re
lative
sta
bili
ty (
%)
Centrifuge duration (min)
Stability=110.17769*exp(4.4781/(centrifuge time-48.44492))
R2=0.994
0 100 200 300 400 500 600 700
0
20
40
60
80
100
0 20 40 60 80 100 120 140 160 180 200
90
92
94
96
98
100
102
Re
lative
sta
bili
ty (
%)
Time (hrs)
Normal
Predicted
Predicted
Normal
Stability=-11.12683*exp (-Time/270.38911)+111.74422
R2=0.993
Re
lative
sta
bili
ty (
%)
Time (Hrs)
the period of 5, 10, 15, 20, 25 and 30 min. and the relative stability studies were done. The
relative stability of nanofuel under natural and accelerated ageing was compared and the
following relation was obtained, which gives the correlation between the period of centrifuging
and equivalent normal sedimentation period.
Figure 4.43 Predicted relative stability of nanofuel up to 620 hrs period of time- nanofuel
synthesized by combined technique
Figure 4.44 Accelerated relative stability with curve fitting for CeO2 nanofuel at 0.06 wt. %

Chapter 4 Results and discussion
111
The relation between natural sedimentation timing and centrifuge timing is as follows:
)4449.48CT/(4781.4e*1777.110AS ... (4.8)
74422.111e*12683.11NS 38911.270NT
... (4.9)
where AS= Accelerated relative stability (%), CT= Centrifuge time (min), NS=Natural relative
stability (%) and NT= Normal time (hrs). By equating the equation (4.8) and (4.9), the relation
between centrifuge time and normal ageing time was obtained, which is given in equation (4.10).
44492.48]014777.1e*101046.0ln[
4781.4CT
38911.270NT
... (4.10)
The equation (4.10) was validated for 168 hrs of normal ageing and presented as inset in Figure
4.43. The relative stability of 91.03 % was achieved for 168 hrs of normal ageing equivalent to
24.98 min. of centrifuge timing obtained using the above equation, whereas the experimental
results showed the stability of 90.64 % for 168 hrs, where a close approximation between them
was obtained. Since the deviation between experimental and predicted results was found to be
significantly very less, the equation (4.10) was used to calculate the relative stability of nanofuel
after 5, 10, 15, 20 and 25 days, where the respective dispersion stability was noted to be 94.4,
84.7, 69.6, 46.1 and 9.4 % and their equivalent centrifuge time was calculated to be 19.5, 31.4,
38.7, 43.3 and 46.6 min, respectively. It is also noted that the nanoparticles were found to be
settled completely after 620 hrs.
4.3 Optimization of ceria concentration for the performance enhancement of an IC engine
Though tween 80 was found to be a suitable surfactant to prepare CeO2 based nanofuel, it was
found to be not appropriate for the synthesized samples such as CZA, CZM and others. As
tween 80 has oleic acid as a hydrophobic structure and being a non-ionic surfactant, the oleic
acid was chosen to prepare the nanofuel using different types of nanoparticles. As tween 80 has
the ability to remove petroleum hydrocarbon, Lai et al. [2009], it might reduce the lubrication
efficiency in an IC engine. As the surface tension of tween 80 was found to be 43.7 mN/m,
which was higher than that of the oleic acid (32.12 mN/m), it is expected to influence the droplet
formation of fuel and its penetration in the combustion chamber. By considering the application

Chapter 4 Results and discussion
112
of nanofuel in an IC engine, the relative stability of the nanofuel was compromised by 6 % at 7
hrs of stability, which is within the experimental deviation, and thus the oleic acid was selected
as a surfactant for further studies.
Ceria concentration in diesel played an important role to reduce the concentration of toxic gases
by influencing the complete combustion of the fuel in an IC engine, which is reflected in the
performance of an IC engine, i.e. brake power (BP), brake specific fuel consumption (BSFC),
brake thermal efficiency (BTE) and mechanical efficiency. In order to find the optimum
concentration of CeO2 in diesel, a nanofuel with oleic acid as a surfactant was synthesized at
different concentrations such as 0.02, 0.04, 0.06, 0.08 and 0.1 wt. % of CeO2 and tested in an IC
engine.
Figure 4.45 shows the effect of concentration of CeO2 in diesel and load on BTE of an IC
engine. It was observed that the BTE was increased with loading. In an IC engine, the heat
transfer process is mainly between the combustion chamber charge and the chamber wall. The
temperature of the combustion chamber wall depends on the combustion deposit over it, which
was influenced by the engine loading. Due to the reduction in temperature difference, the heat
loss from the combustion charge to the cylinder wall was reduced with an increase of load. At
25 % loading, the temperature difference between the combustion charge and cylinder wall was
comparatively higher than the other loading condition. Thus, the heat loss was the highest at no
load condition, which was decreased with an increase of load. The trend of BTE of an engine
against loading while using diesel and nanofuel was due to the reduced heat loss and increased
brake power at higher loading in an IC engine, Ramadhas et al. [2005]. The BTE was observed
to be high for nanofuels compared to that of diesel in all the loading condition and concentration
of dispersed CeO2 nanoparticles. The BTE was found to be increased with nanofuel having up to
0.06 wt. % of CeO2 and then it was decreased. The nanofuel penetration depth was increased due
to the improved momentum of nanofuel, which was also supported by Shafii et al. [2011]. If the
fuel penetration reaches a zone, where the temperature of it is lower than the ignition
temperature of fuel, it reduced the burning rate of fuel and increased the unburned and partially
burned species. However, the under penetration of fuel resulted in poor air utilization leading to
the formation of rich fuel mixture and incomplete combustion of fuel, which was also reported
by Heywood [1988]. It was found that the BTE of 0.06 wt. % of CeO2 nanofuel was high
compared to all the test fuels. This might be due to fact that the under penetration and over

Chapter 4 Results and discussion
113
25 50 75 100
15
20
25
30
35
40
45
BT
E (
%)
Load (%)
Diesel
0.02wt% Ceria
0.04wt% Ceria
0.06wt% Ceria
0.08wt% Ceria
0.1wt% Ceria
penetration were expected in the nanofuel having less than 0.06 wt. % and more than 0.06 wt. %
of CeO2, respectively. The optimum penetration depth was expected in 0.06 wt. % of nanofuel
and thus the BTE was found to be high compared to the rest of the test fuel.
Figure 4.45 Effect of ceria concentration and load on BTE of an IC engine
Figure 4.46 shows the increase in brake thermal efficiency (BTE) of an engine against different
concentrations of nanofuel usage compared to diesel and loading conditions. The BTE was
observed to be increased in all types of nanofuels compared to diesel under all loading
conditions. It was noticed that the maximum performance of an engine was observed at 50 %
loading condition irrespective of the concentration of nanofuel. After 50 % loading condition,
the trend was found to be decreased up to 75 % loading and then it was increased. It is noted that
the maximum enhancement of BTE at 100 % loading was noted to be 13 %, which was less than
that of the results observed at 50 % loading, i.e. 18 %. It was due to the fact that there was more
rapid combustion at 50 % loading condition, which was also supported by Ajav et al. [1999].
The increase in BTE was observed to be high at 0.06 wt. % nanofuel irrespective of mechanical
loading, where the enhancement of BTE was noted to be 9, 18, 10, and 13 % at 25, 50, 75 and
100 % loading, respectively. It is due to the optimum depth of fuel penetration at 0.06 wt. %,
which reduced the problems of over and under penetration of fuel in the combustion chamber.

Chapter 4 Results and discussion
114
25 50 75 100
2
4
6
8
10
12
14
16
18
20
Incre
ase
in
BT
E (
%)
Load (%)
0.02wt% Ceria
0.04wt% Ceria
0.06wt% Ceria
0.08wt% Ceria
0.1wt% Ceria
25 50 75 100
0.15
0.20
0.25
0.30
0.35
0.40
0.45
0.50
0.55
BS
FC
(kg
/ k
W -
hr)
Load (%)
Diesel
0.02wt% Ceria
0.04wt% Ceria
0.06wt% Ceria
0.08wt% Ceria
0.1wt% Ceria
Figure 4.46 Increase in BTE while nanofuel usage compared to diesel in an IC engine at
different concentration of CeO2 nanoparticles
Figure 4.47 Effect of concentration of ceria nanoparticles on BSFC of an engine

Chapter 4 Results and discussion
115
25 50 75 100
0
2
4
6
8
10
12
14
16
18
De
cre
ase
in
BS
FC
(%
)
Load (%)
0.02wt% Ceria
0.04wt% Ceria
0.06wt% Ceria
0.08wt% Ceria
0.1wt% Ceria
Figure 4.47 shows the brake specific fuel consumption (BSFC) of nanofuel against different
concentrations of CeO2 and loading conditions. It was observed that the BSFC of an engine was
decreased with an increase of load irrespective of type of fuel used. It was due to the fact that the
fuel required to operate the engine was less than the increase of brake power due to relatively
less portion of heat loss at higher loading conditions, Godiganur et al. [2010]. The BSFC of
nanofuel was found to be significantly less compared to that of diesel in all concentrations of
nanofuel and loads. It was due to that the CeO2 promoted the fuel combustion by acting as a
catalyst and the engine produced the required amount of power in order to maintain the speed by
burning the less quantity of fuel, supported by Mandal et al. [2012]. The BSFC was found to be
decreased with an increase of concentration till 0.06 wt. % and then it was started to increase,
which was due to the under and over penetration of fuel. The nanofuel at 0.06 wt. % CeO2 was
found to have the lowest BSFC compared to all concentration tested in this study due to its
optimum penetration depth of fuel.
Figure 4.48 Decrease in BSFC compared to diesel with respect to CeO2 concentration
Figure 4.48 shows the reduction of brake specific fuel consumption (BSFC) of nanofuel at
different concentration of ceria and loading conditions. If the diesel system is replaced with
nanofuel system, there was a reduction of BSFC irrespective of CeO2 concentration. The oxygen
stored in the ceria helped to have a complete combustion and encouraged for lower fuel

Chapter 4 Results and discussion
116
0.00 0.02 0.04 0.06 0.08 0.10 0.12
3.1
3.2
3.3
3.4
3.5
3.6
3.7
3.8
3.9
4.0
Fri
ctio
na
l p
ow
er
(kW
)
wt. % of ceria concentration
consumption. The maximum reduction of BSFC was observed to be 8.2, 15.1, 8.8 and 11.3 % at
25, 50, 75 and 100 % loading conditions, respectively, for 0.06 wt. % nanofuel compared to that
of pure diesel. When nanofuel was used in the system, the BSFC was decreased by about 15.1 %
at 50 % loading and the same was limited to only 11.3 % at full loading condition at 0.06 wt. %
CeO2 in diesel. Though the maximum reduction of BSFC was noted at 50 % loading condition
for 0.06 wt. % CeO2 in diesel, by considering the economic perspective, the maximum reduction
of BSFC by 11.3 % was preferred. The increase in BSFC after 75 %, which was observed for all
the CeO2 concentration, was due to the rapid combustion in an engine, Ajav et al. [1999].
Figure 4.49 Effect of CeO2 concentration on frictional power of an IC engine
Figure 4.49 shows the effect of CeO2 concentration on frictional power of an engine, which was
calculated by following the Willan’s line method. It was observed that the frictional power was
found to be decreased till 0.06 wt. % CeO2 nanoparticles in diesel and then it was found to be
increased. Since the friction power was less in case of nanofuel usage in all concentration
compared to diesel, the nanoparticles in diesel acted as a solid lubricant and it reduced the
friction between the contacting surfaces. It was due to the fact that the cerium oxide
nanoparticles produced a layer between two contacting surfaces, which was also confirmed by
Sharma et al. [2010]. As the higher nanoparticle concentration produced more pressure to adhere

Chapter 4 Results and discussion
117
0.02 0.04 0.06 0.08 0.10
0
2
4
6
8
10
12
14
16
18
20
22
De
cre
ase
in
fri
ctio
na
l p
ow
er
(%)
wt. % of ceria concentration in nanofuel
the layer to sustain the abrasive contact between the surfaces, the frictional power was observed
to be increased after 0.06 wt. % of CeO2 in diesel.
Figure 4.50 Decrease in frictional power of an engine with respect to diesel
Figure 4.50 shows the decrease in frictional power of an engine when nanofuel was used. It was
calculated based on the diesel, which was observed to be increased till 0.06 wt. % CeO2
nanoparticles in diesel and then it was found to be decreased. The high reduction of frictional
power was observed in 0.06 wt. % loading of ceria nanoparticle in diesel.
Figure 4.51 shows the effect of ceria nanoparticle concentrations in diesel on mechanical
efficiency of an engine against loading. It was observed that the mechanical efficiency of an
engine was increased with loading irrespective of type of fuel used either diesel or nanofuel.
Since the frictional power calculated through the Willian’s line method was constant irrespective
of loading, the mechanical efficiency was influenced by the brake power with respect to load.
The increasing trend observed for the nanofuel and diesel was due to the generation of higher
brake power against load. The mechanical efficiency was found to be high in case of ceria
dispersed diesel in all the concentrations compared to that of diesel. It was due to that the
nanoparticles in diesel acted as a solid lubricant and thus reducing the frictional power loss. The

Chapter 4 Results and discussion
118
25 50 75 100
10
15
20
25
30
35
40
45
Me
ch
an
ica
l e
ffic
ien
cy (
%)
Load (%)
Diesel
0.02wt% Ceria
0.04wt% Ceria
0.06wt% Ceria
0.08wt% Ceria
0.1wt% Ceria
25 50 75 100
2
4
6
8
10
12
14
Incre
ase
in
me
ch
an
ica
l e
ffic
ien
cy (
%)
Load (%)
0.02wt% Ceria
0.04wt% Ceria
0.06wt% Ceria
0.08wt% Ceria
0.1wt% Ceria
nanofuel with 0.06 wt. % of ceria experienced high mechanical efficiency at all the loading
conditions compared to any other nanofuel considered in the present study.
Figure 4.51 Effect of CeO2 concentration on mechanical efficiency of an IC engine
Figure 4.52 Increase in mechanical efficiency compared to diesel with respect to CeO2
concentration

Chapter 4 Results and discussion
119
Figure 4.52 shows the increase in mechanical efficiency of nanofuel at different concentrations
of CeO2 compared to that of diesel. It was observed that the mechanical efficiency of an engine
was found to be increased at all the loading conditions compared to diesel. Since the frictional
power at 0.06 wt. % was found to be the minimum compared to the remaining concentration of
nanofuel, the mechanical efficiency was found to be increased up to 0.06 wt. % and then it was
decreased. The nanofuel containing 0.06 wt. % showed the maximum increase in mechanical
efficiency, which was observed to be 12.0, 11.3, 9.4 and 9.2 % at 25, 50, 75 and 100 % load
respectively, compared to pure diesel. It was due to the decrease in frictional power at 0.06 wt.
% of CeO2, as discussed above.
4.4 Studies on high OSC nanoparticles dispersed diesel
As the engine performance at 0.06 wt. % CeO2 dispersed diesel was found to be the best, the
relative stability studies and fuel characteristics were focused on 0.06 wt. % of nanoparticles
dispersed diesel. The nanofuel with required concentration was prepared using the combination
technique of tip sonication and magnetic stirring with oleic acid as a surfactant.
4.4.1 Studies on the dispersion stability of nanofuel
As the engine performance at 0.06 wt. % of CeO2 based nanofuel was found to be superior
compared to other types of concentration, further studies were focused on 0.06 wt. % of high
OSC nanoparticles i.e. CZ3, CZA2, CZA3 and CZM2 dispersed diesel. In order to have a trend
in the results, two more concentrations i.e. 0.05 and 0.07 wt. % in addition to 0.06 wt. % of
respective nanoparticles were dispersed in diesel and their dispersion stability was studied up to
168 hrs. Figure 4.43(a-e) shows the relative stability of CeO2, Ce0.6Zr0.4O2 (CZ3),
Ce0.6Zr0.2Al0.26O2 (CZA2), Ce0.6Zr0.1Al0.39O2 (CZA3) and Ce0.6Zr0.2Mn0.2O2 (CZM2) based
nanofuel. It was observed from all type of nanofuel that the relative stability of 0.05 and 0.07 wt.
% of nanoparticle dispersed diesel was found to have higher and lower stability than the 0.06 wt.
% nanofuel, respectively. It was found that the dispersion stability of 0.06 wt. % of CeO2, CZ3,
CZA2, CZA3 and CZM2 based nanofuel was noted to be 87, 88, 88, 91 and 89 %, respectively
at the end of 168 hrs.

Chapter 4 Results and discussion
120
0 20 40 60 80 100 120 140 160 180
84
86
88
90
92
94
96
98
100
102
Re
lative
sta
bili
ty (
%)
Time (Hrs)
CeO2-0.05 wt%
CeO2- 0.06 wt%
CeO2- 0.07 wt%
a
0 20 40 60 80 100 120 140 160 180
86
88
90
92
94
96
98
100
102
Re
lative
sta
bili
ty (
%)
Time (Hrs)
CZ3-0.05 wt %
CZ3-0.06 wt %
CZ3-0.07 wt %
b
0 20 40 60 80 100 120 140 160 180
84
86
88
90
92
94
96
98
100
102
Re
lative
sta
bili
ty (
%)
Time (Hrs)
CZA2-0.05 wt%
CZA2-0.06 wt%
CZA2-0.07 wt%
c
0 20 40 60 80 100 120 140 160 180
88
90
92
94
96
98
100
Re
lative
sta
bili
ty (
%)
Time (Hrs)
CZA3-0.05 wt%
CZA3-0.06 wt%
CZA3-0.07 wt%
d
0 20 40 60 80 100 120 140 160 180
86
88
90
92
94
96
98
100
102
Re
lative
sta
bili
ty (
%)
Time (Hrs)
CZM2-0.05 wt %
CZM2-0.06 wt %
CZM2-0.07 wt %
e
Figure 4.53 Relative stability studies on nanofuel based on (a) CeO2, (b) Ce0.6Zr0.4O2, (c)
Ce0.6Zr0.2Al0.26O2, (d) Ce0.6Zr0.1Al0.39O2, (e) Ce0.6Zr0.2Mn0.2O2

Chapter 4 Results and discussion
121
The relative stability of CeO2, CZ3, CZA2, CZA3 and CZM2 dispersed diesel after 40 hrs and
168 hrs is shown in Table 4.9. The sedimentation of nanoparticles irrespective of their type and
size up to 40 hrs was found to be very less and then the sedimentation started to happen. Once
the nanoparticles started to agglomerate, the gravitational force influenced to dominate leading
to the settlement of nanoparticles quickly even at lower concentration. Since the stability of
nanofuel was observed to be influenced by the particle size of nanoparticles, which was also
supported by Gan et al. [2012], the stability of CeO2 based nanofuel was found to be the lowest
compared to that of rest of the nanofuel. The stability of CZA3 based nanofuel was observed to
be the highest compared to rest of the nanofuels due to the size and density of CZA3
nanoparticles. It was proved from the above studies that the rate of sedimentation was influenced
by the crystallite size and concentration of nanoparticles dispersed in diesel.
Table 4.9 One week relative stability studies on nanofuels
Figure 4.54 shows the relative stability of CeO2, CZ3, CZA2, CZA3 and CZM2 dispersed diesel
having the concentration of 0.05, 0.06 and 0.07 wt. % after 40 and 168 hrs. It was observed that
the relative stability of 0.05 wt. % nanofuel was found to be the highest compared to the
remaining nanofuel after 40 hrs. In all the concentrations, the stability of CeO2 type nanofuel
was found to be the lowest compared to the remaining nanofuel.
Type of
nanoparticles
dispersed in diesel
Crystallite
size (nm)
Density
(g/cc)
Relative stability of nanofuel (%)
0.05 wt. % 0.06 wt. % 0.07 wt. %
40
(hrs)
168
(hrs)
40
(hrs)
168
(hrs)
40
(hrs)
168
(hrs)
CeO2 25 7.2 99 89 98 87 97 86
Ce0.6Zr0.4O2 (CZ3) 7.8 6.77 99.7 90 99 88 98 86
Ce0.6Zr0.2Al0.26O2
(CZA2)
4.7 6.19 99.7 90 99 88 98.5 86
Ce0.6Zr0.1Al0.39O2
(CZA3)
2.6 5.96 99.5 93 99.2 91 98.4 88
Ce0.6Zr0.2Mn0.2O2
(CZM2)
2.7 6.10 99.8 92 99.2 89 98.6 87

Chapter 4 Results and discussion
122
0.05 0.06 0.07
60
65
70
75
80
85
90
95
100
105
110
115
120
Re
lative
sta
bili
ty (
%)
Concentration (wt. %)
Ceria-40 hrs
CZ3-40 hrs
CZA2-40 hrs
CZA3-40 hrs
CZM2-40 hrs
Ceria-168 hrs
CZ3-168 hrs
CZA2-168 hrs
CZA3-168 hrs
CZM2-168 hrs
Figure 4.54 Effect of concentration and duration on relative stability of high OSC nanoparticle
dispersed diesel
4.4.2 Characterization of nanofuel
The high OSC nanoparticles such as CeO2, Ce0.6Zr0.4O2 (CZ3), Ce0.6Zr0.2Al0.26O2 (CZA2),
Ce0.6Zr0.1Al0.39O2 (CZA3) and Ce0.6Zr0.2Mn0.2O2 (CZM2) were dispersed in diesel at different
concentrations such as 0.05, 0.06 and 0.07 wt. % with oleic acid as a surfactant and then the fuel
characteristics such as surface tension, flash point and fire point temperature, thermal
conductivity and viscosity were studied at room temperature and reported.
Figure 4.55 shows the surface tension of different types and concentration of nanoparticles
dispersed diesel. It was observed that the surface tension of nanofuel was not varied significantly
irrespective of the type of nanoparticles and their concentration. When the concentration of
nanoparticles was increased from 0.05 to 0.07 wt. %, the surface tension of nanofuel was found
to be increased within 4 %. Since the nanofuel was a heterogeneous mixture of nanoparticles
dispersed in fuel, an increase of surface tension of nanofuel might be due to the homogenous
presence of nanoparticles in the fuel. Though the addition of nanoparticles in diesel increased its
surface tension, as reported by Moosavi et al. [2010], the steric stabilization of surfactant
reduced the surface energy at the liquid-air interface leading to the reduction of surface tension
of nanofuel, which was increased due to the addition of nanoparticles, and it is also supported by
Tanvir et al. [2012]. As the long-chain nonionic oleic acid surfactant molecules attached on the

Chapter 4 Results and discussion
123
0.05 0.06 0.07
10
15
20
25
30
35
40
45
50
Su
rfa
ce
te
nsio
n (
mN
/m)
Nanoparticles concentration wt (%)
Diesel
Diesel+Ceria
Diesel+CZ3
Diesel+CZM2
Diesel+CZA3
Diesel+CZA2
solid particles, they form a layer between the particles and the surrounding fluid molecules. Such
layers increased the potential between particles and impart a repulsive force between them. This
in turn caused a reduction in surface tension upon addition of surfactant, which was also
documented by Khaleduzzaman et al. [2013]. However, the enhancement observed for the
surface tension of diesel against dispersion of nanoparticles and their concentration was found to
be within the limit of experimental deviation. Thus, it is suggested that the effect of adding
nanoparticles on the surface tension of diesel was negligible, i.e. the atomization of diesel is not
expected to be influenced with an addition of nanoparticles.
Figure 4.55 Effect of high OSC nanoparticles on the surface tension of diesel
As the flash point and fire point temperature of the fuel show the indication of its volatility, the
influence of different types of nanoparticles and their concentration was studied and reported.
Higher flash point temperature of nanofuel is preferred for safe handling of the fuel. The flash
point and fire point temperature of nanofuel against the particle concentration with different
nanofuel are shown in Figure 4.56 and 4.57, respectively. It is noted that both flash point and fire
point temperature of diesel were found to be increased within 9 % irrespective of type of
nanoparticles and their concentration, which was also observed by Prabu et al. [2012]. It was due
to the increase in flammability and combustibility of fuel with the addition of nanoparticles,
which was also supported by Karthik et al. [2013]. Thus, the fuel dispersed with cerium oxide
based nanoparticles is inherently safer to handle than the base fuel. As the flash point and fire

Chapter 4 Results and discussion
124
0.05 0.06 0.07
10
20
30
40
50
60
70
80
Fla
sh
po
int te
mp
era
ture
(°C
)
Nanoparticle concentration wt (%)
diesel
Diesel+Ceria
Diesel+CZ3
Diesel+CZM2
Diesel+CZA3
Diesel+CZA2
0.05 0.06 0.07
10
20
30
40
50
60
70
80
Fir
e p
oin
t te
mp
era
ture
(°C
)
Nanoparticle concentration wt (%)
diesel
Diesel+Ceria
Diesel+CZ3
Diesel+CZM2
Diesel+CZA3
Diesel+CZA2
point temperature of diesel obtained from different commercial outlets were observed to be
varied within the experimental variation, the enhancement observed in case of nanofuel falls
within the limit. The handling requirement of the nanofuel is same as that of diesel and the
combustion behavior of the nanofuel in connection with above is also not expected to be
influenced compared to that of pure diesel.
Figure 4.56 Effect of high OSC nanoparticles on the flash point temperature of diesel
Figure 4.57 Effect of high OSC nanoparticles on the fire point temperature of diesel

Chapter 4 Results and discussion
125
0.00 0.02 0.04 0.06 0.08 0.10
1.00
1.02
1.04
1.06
1.08
1.10
1.12
1.14
1.16
1.18
1.20
1.22
Effe
ctive
th
erm
al co
nd
uctivity r
atio
(k / k
0)
Concentration of nanoparticle (wt .%)
Diesel+CZA3
Diesel+CZM2
Diesel+CZA2
Diesel+CZ3
Diesel+Ceria
Figure 4.58 Effective thermal conductivity of nanofuel having different concentration of
nanoparticles
Figure 4.58 shows the effective thermal conductivity of nanofuel having different concentrations
of nanoparticles at room temperature. It is observed that the effective thermal conductivity of
nanofuel was increased with concentration of high OSC nanoparticles and it is observed to be
maximum at 0.1 wt. % nanoparticles, in this study. The increase in thermal conductivity of
nanofuel was due to large specific surface area and enhanced specific heat capacity of
nanocrystalline materials, as stated by Xuan et al. [2000]. The increase in thermal conductivity
not only depends on the concentration of nanoparticles dispersed in diesel, but it also depends on
the size and shape of the nanoparticles and temperature of nanofuel. Since the shape of
nanoparticles and temperature of nanofuel are the constant factors for specific applications, the
effective thermal conductivity of nanofuel depends on the concentration and size of the
nanoparticles dispersed in diesel. Brownian motion of the nanoparticles in fluid is responsible
for transporting energy through collision between the nanoparticles or liquid convection, which
enhanced the transport of thermal energy causing the increase of thermal conductivity of
nanofuel. The higher enhancement of effective thermal conductivity of nanofuel was expected to
increase the heat transfer capability, Das et al. [2003b]. It is observed from Figure 4.58 that the
rate of increase of thermal conductivity was found to be linear with respect to concentration and
the slope of the curve was observed to be in the range 1.18 to 1.27, 1.30 to 1.28, 1.61 to 1.65,

Chapter 4 Results and discussion
126
Diesel CZA3 CZA2 CZM2 CZ3 Ceria
1.0
1.5
2.0
2.5
3.0
3.5
4.0
Vis
cosity [m
Pa
·s]
Types of nanofuel
1.31 to 1.49 and 1.25 to 1.97 for CeO2, CZ3, CZA2, CZA3 and CZM2 based nanofuel,
respectively. It was also observed that the effective thermal conductivity of CZA3 dispersed
nanofuel was high compared to that of the remaining nanofuel, which is due to its lowest
crystallite size of 2.6 nm, compared to the average crystallite size of CeO2, CZ3, CZA2 and
CZM2, and their respective values were 25, 7.8, 4.7 and 2.7 nm. Though the CZM2 crystallite
size was approximately the same as CZA3, the high enhancement of effective thermal
conductivity in CZA3 was due the presence of lower ionic radius of Al3+
in CZA3, which was
also supported by Tada et al. [2010], where it was reported that the thermal conductivity of
lower ionic radius element was higher compared to the higher ionic radius element. In case of
CZA2, the particle size effect on thermal conductivity dominated the ionic radius effect leading
to less effective thermal conductivity in comparison to that of CZA3.
Figure 4.59 Effect of 0.06 wt. % OSC nanoparticles on viscosity of nanofuel at room
temperature
Figure 4.59 shows the effect of 0.06 wt. % high OSC nanoparticles dispersed diesel on its
viscosity at room temperature. The viscosity of nanofuel was observed to be high compared to
that of diesel, which was also observed by Keblinski et al. [2005]. The addition of nanoparticles
in the fuel increased the resistance between the fluid layers and hence increased the viscosity.
The viscosity of CZA3 dispersed diesel was found to be less compared to that of CeO2, CZ3,

Chapter 4 Results and discussion
127
CZA2 and CZM2 dispersed diesel, which is due less crystallite size of CZA3 compared to the
rest of the nanoparticles. The increase in viscosity due to the nanoparticles dispersion in diesel
was found to be in the range of 6.6 to 33.3 % in this study. As the change in viscosity of
nanofuel was observed to be within the acceptable range of experimental variation in case of
CeO2, CZ3, CZA2, CZA3 and CZM2, the fuel injection pattern of those nanofuel in combustion
chamber is expected to be the same.
4.5 Engine performance with high OSC nanoparticle (0.06 wt. %) dispersed diesel
(Nanofuel) and emission studies
In order to find the influence of OSC of the nanoparticles, which were dispersed in diesel, the
engine performance and emission analysis were studied. The engine performance parameters
considered here are the brake specific fuel consumption (BSFC), brake thermal efficiency (BTE)
and mechanical efficiency. During the performance studies at different loading condition, carbon
monoxide (CO), hydrocarbon, oxides of nitrogen (NOx) and carbon dioxide (CO2) were
measured. The nanofuel was prepared by dispersing high OSC nanoparticles such as CZA2,
CZA3, CZM2 in diesel. CeO2 and CZ3 based nanofuel was also considered for the comparison
purpose.
4.5.1 Engine performance studies
Figure 4.60 shows the effect of high OSC nanoparticles dispersed diesel on brake specific fuel
consumption (BSFC) of an engine against different loading conditions. It is noted that the BSFC
was observed to be decreased exponentially for nanofuel and diesel up to 50 % loading
condition. In the range of 50 to 100 % load, the decrease in BSFC was significantly less
compared to 25 to 50 % loading condition. The mass of fuel required to operate the engine and
brake power developed by the engine were increased with load. However, the BSFC was found
to be decreased with an increase of load in both cases of diesel and nanofuel. The main reason
was that the fuel required to operate the engine after its normalized condition was less than the
brake power developed during the loading condition. Since the heat loss due to heat transfer
between the combustion gas mixture to cylinder wall was found to be less during the higher
loading conditions, the reduction in BSFC was found to be very less in the range of 50 to 100 %
loading condition. The highest reduction of BSFC was found in case of CZA2 dispersed diesel
compared to all types of nanofuel tested in this study, which was clearly indicated through the

Chapter 4 Results and discussion
128
25 50 75 100
0.15
0.20
0.25
0.30
0.35
0.40
0.45
0.50
0.55
BS
FC
(kg
/kW
-hr)
Load (%)
Diesel
Diesel+Ceria
Diesel+CZ3
Diesel+CZA2
Diesel+CZA3
Diesel+CZM2
inset of Figure 4.60. It is due to the fact that the complete combustion of nanofuel having the
highest OSC nanoparticles was occurred leading to the reduced requirement of mass of the fuel
used to run the engine to produce the same brake power. As the increase in oxygen concentration
of the fuel was expected to reduce the ignition delay in the engine, as reported by Heywood
[1988], it led to complete combustion of the fuel and reduced BSFC.
Figure 4.60 Effect of high OSC nanoparticles in diesel at 0.06 wt. % on BSFC
Figure 4.61 shows the effect of OSC nanoparticles dispersed diesel at 0.06 wt. % on decrease of
the BSFC of an engine with respect to diesel against different loading conditions. The reduction
of BSFC of nanofuel was observed to be high at 50 % loading condition compared to rest of the
loads, where the BSFC was found to be decreased by 15.2, 16.5, 18.8, 18.2 and 17.2 % in case
of CeO2, CZ3, CZA2, CZA3 and CZM2 dispersed diesel, respectively, compared to diesel.
Highest reduction was observed in CZA2 dispersed nanofuel, which was found to be 13.6, 18.8,
14.2 and 17.1 % in 25, 50, 75 and 100 % loading condition. The decrease in BSFC can be due to
the positive effects of nanoparticles on physical properties, which was denoted as oxygen
content of nanoparticle dispersed fuel and also the reduction of ignition delay, Tyagi et al.[
2008], which might be helpful to have the complete combustion of nanofuel, Pivkina et al.
[2004]. In addition, it can be due to the effects of nanoparticles on fuel propagation in the

Chapter 4 Results and discussion
129
25 50 75 100
8
10
12
14
16
18
20
De
cre
ase
in
BS
FC
(%
)
Load (%)
Diesel+Ceria
Diesel+CZ3
Diesel+CZM2
Diesel+CZA3
Diesel+CZA2
combustion chamber. On the other hand, the nanoparticles dispersed diesel increased the mixture
momentum and, consequently, the penetration depth in the cylinder, Kao et al. [2008], where
indepth penetration increased the contact with air inside the combustion chamber. As a result,
the combustion was improved, which was also observed by Shaffi et al. [2011]. Though BSFC
was found to be decreased by 17.1 % in case of 100 % loading, the same was observed to be
18.8 % at 50 % loading. Based on the economical and industrial point of view, an engine is
preferred to be run at 100 % loading and / or over loading up to certain extent when the engine is
operated with nanofuel having 0.06 wt. % of CZA2 nanoparticles.
Figure 4.61 Decrease in BSFC of an engine using 0.06 wt. % nanofuel with respect to diesel
Figure 4.62 shows the brake thermal efficiency (BTE) of a diesel engine with respect to different
loading conditions and types of nanoparticles at 0.06 wt. %. It is observed that the BTE of an
engine was increased with load for all type of fuel, including the nanofuel and diesel. It was due
to the reduction of heat loss and increase of power with an increase of load. It was observed that
the BTE of nanofuel was higher than the diesel in all the loading conditions. It was due to the
decrease in ignition delay for high OSC nanoparticle dispersed diesel. Since the ignition delay
was decreased with respect to the oxygen concentration in diesel, the same was expected in
CZA2 compared to any other nanofuel due to its high OSC. As the reduced ignition delay in the

Chapter 4 Results and discussion
130
25 50 75 100
15
20
25
30
35
40
45
50
BT
E (
%)
Load (%)
Diesel
Diesel+Ceria
Diesel+CZ3
Diesel+CZA2
Diesel+CZA3
Diesel+CZM2
25 50 75 100
8
10
12
14
16
18
20
22
24
Incre
ase
in
BT
E(%
)
Load (%)
Diesel+Ceria
Diesel+CZ3
Diesel+CZM2
Diesel+CZA3
Diesel+CZA2
CZA2 dispersed diesel was expected to burn completely, it led to complete combustion in high
OSC dispersed diesel leading to have increased BTE.
Figure 4.62 Effect of high OSC nanoparticles in diesel at 0.06 wt. % on BTE of an engine
Figure 4.63 Increase in BTE of an engine using 0.06 wt. % nanofuel with respect to diesel

Chapter 4 Results and discussion
131
Diesel Ceria CZ3 CZM2 CZA3 CZA2
1.0
1.5
2.0
2.5
3.0
3.5
4.0
Fri
ctio
na
l P
ow
er
(kW
)
Type of Nanofuel
Figure 4.63 shows the increase in BTE of an engine with respect to diesel at different loading
conditions, where a positive trend was observed in all loads. The maximum increase of BTE
was found to be 17.9, 19.8, 23.2, 22.2 and 20.7 % for CeO2, CZ3, CZA2, CAZ3 and CZM2
based nanofuel, respectively, at 50 % loading condition in comparison to that of diesel. The BTE
of an engine was increased when nanofuel was used compared to diesel which was due to the
increase in burning process of combustion. The increase in BTE of nanofuel was due to the
overall heat transfer characteristics of the combustion gases produced by the nanofuel, which
were significantly better than those of normal diesel. The maximum increase in BTE of CZA2
based nanofuel was observed in all the loads compared to other nanofuel, which was due to the
dispersion of highest OSC nanoparticles in diesel compared to rest of the nanoparticles. Based
on the economic consideration, it is recommended to operate an engine at 100 % loading though
the efficiency difference at 50 % and 100 % loading was noted to be only 3 %.
Figure 4.64 Effect of high OSC nanoparticles in diesel at 0.06 wt. % on frictional power of an
engine
Figure 4.64 shows the effect of high OSC nanoparticles in diesel on frictional power of an
engine and it was calculated using the Willian’s line method. The frictional power of an engine
was found to be less for all type of nanofuel compared to diesel. The decrease in frictional power
of an engine with nanofuel proved that the nanoparticles in diesel acted as a solid lubricant. The

Chapter 4 Results and discussion
132
25 50 75 100
10
15
20
25
30
35
40
45
Me
ch
an
ica
l e
ffic
ien
cy (
%)
Load (%)
Diesel
Diesel+Ceria
Diesel+CZ3
Diesel+CZA2
Diesel+CZA3
Diesel+CZM2
decrease in frictional power with respect to diesel was noted to be 17.2, 22.1, 17.9, 16.9 and 15.3
% for CeO2, CZ3, CZM2, CZA3 and CZA2 based nanofuel, respectively. It was found that the
frictional power of CZ3 based nanofuel was found to be the lowest compared to that of
remaining nanofuel taken in the present study.
Figure 4.65 shows the effect of high OSC nanoparticles dispersed diesel on mechanical
efficiency of an engine with respect to different types of high OSC nanoparticles and loading
conditions. It was observed that the mechanical efficiency of an engine was increased with
loading conditions. It was due to the increase in power generated by the engine against load. An
increase of mechanical efficiency was observed when nanofuel was used compared to diesel. It
was due to decrease in frictional power, when nanofuel was used. The mechanical efficiency of
CZ3 nanoparticles dispersed diesel was found to be higher compared to that of rest of the
nanofuel tested in this study, as the CZ3 based nanofuel showed the lowest frictional power.
Figure 4.65 Effect of high OSC nanoparticles in diesel at 0.06 wt. % on mechanical efficiency of
an engine
Figure 4.66 shows the effect of high OSC nanoparticle dispersed diesel at 0.06 wt. % on increase
of mechanical efficiency of an engine with respect to diesel at different loading conditions. It
was observed that the mechanical efficiency of an engine was found to be increased by 12.0,

Chapter 4 Results and discussion
133
25 50 75 100
7
8
9
10
11
12
13
14
15
16
17
Incre
ase
in
me
ch
an
ica
l e
ffic
ien
cy (
%)
Load (%)
Diesel+Ceria
Diesel+CZ3
Diesel+CZM2
Diesel+CZA3
Diesel+CZA2
15.6, 10.6, 11.9 and 12.6 % for CeO2, CZ3, CZA2, CZA3 and CZM2, respectively, dispersed
diesel at 25 % loading condition. Since the mechanical efficiency of an engine was influenced by
the frictional power, the maximum increase in mechanical efficiency of an engine at 100 %
loading was noted to be 11.6 % for CZ3 based nanofuel. Though the frictional power for CZ3
was found to be less leading to increase the mechanical efficiency, the brake thermal efficiency
and BSFC of CZ3 based nanofuel were inferior to that of CZA2.
Figure 4.66 Increase in mechanical efficiency of an engine using 0.06 wt. % nanofuel with
respect to diesel
Table 4.10 gives the comprehensive data on the performance parameters and their changes in an
engine with respect to diesel using high OSC nanoparticles at 0.06 wt. %, where the influence of
different types of nanoparticles against loading was reported.

Chapter 4 Results and discussion
134
Table 4.10 Engine performance parameters of an engine and their changes with respect to diesel
using high OSC nanoparticles at 0.06 wt. %
Level % change
BTE
(%)
BSFC
(kg/kW-
hr)
Mechanical
efficiency
(%)
BTE
BSFC
Mechanical
efficiency
Diesel
25 15.7 0.51 13.4 - - -
50 27.5 0.29 23.8 - - -
75 35.1 0.23 32.0 - - -
100 39.1 0.21 38.2 - - -
CeO2 dispersed
Diesel
25 17.1 0.47 15.0 9.0 8.3 12.0
50 32.4 0.25 26.5 17.9 15.2 11.3
75 38.5 0.21 35.1 9.7 8.9 9.4
100 44.1 0.18 41.7 12.8 11.3 9.2
CZ3 dispersed
Diesel
25 17.6 0.46 15.5 12.3 10.9 15.6
50 32.9 0.24 27.2 19.8 16.5 14.4
75 39.7 0.20 35.9 13.2 11.7 12.1
100 45.2 0.18 42.6 15.7 13.6 11.6
CZM2
dispersed
Diesel
25 17.8 0.45 15.1 13.9 12.2 12.6
50 33.1 0.24 26.6 20.7 17.2 11.8
75 40.2 0.20 35.2 14.5 12.7 9.9
100 46.1 0.17 41.8 18.0 15.2 9.5
CZA3
dispersed
Diesel
25 18.1 0.45 15.0 15.2 13.2 11.9
50 33.6 0.24 26.5 22.2 18.2 11.2
75 40.6 0.20 35.0 15.9 13.7 9.4
100 46.8 0.17 41.7 19.6 16.4 9.1
CZA2
dispersed
Diesel
25 18.1 0.44 14.8 15.7 13.6 10.6
50 33.9 0.24 26.2 23.2 18.8 10.1
75 40.9 0.20 34.7 16.5 14.2 8.3
100 47.2 0.17 41.3 20.7 17.1 8.2

Chapter 4 Results and discussion
135
0 25 50 75 100
0
100
200
300
400
500
600
700
CO
(p
pm
)
Load (%)
diesel
diesel+Ceria
diesel+CZ3
diesel+CZM2
diesel+CZA3
diesel+CZA2
4.5.2 Exhaust gas analysis using high OSC nanoparticles (0.06 wt. %) dispersed diesel
(Nanofuel)
Figure 4.67 Effect of nanoparticles in diesel at 0.06 wt. % on CO emission
Figure 4.67 shows the CO emission using high OSC nanoparticles such as CeO2, CZ3, CZA2,
CZA3 and CZM2 dispersed diesel. It was found that the CO emission was observed to be
decreased with an increase of loading conditions and after reaching its lowest value at 75 %
loading, CO emission was increased again for the diesel and nanofuel. In all cases irrespective of
load and fuel, the highest concentration of CO was observed at no load condition, where the rich
fuel mixture was used in order to get the required combustion temperature and pressure. As the
temperature inside the cylinder was increased with load, it resulted the reduction of CO emission
up to 75 % loading condition and then it was increased. The CO emission was reduced from 586
to 472 ppm and 216 to 138 ppm for diesel and CZA2 based nanofuel, respectively at 75 %
loading condition. The reason is as follows: the diesel engine is quality governed engines. The
quantity of air supplied for each cycle irrespective of load on the engine is nearly constant. With
an increase of load, the amount of fuel injected into the engine is increased while maintaining
the constant supply of air. Thus, a lean fuel mixture is available at lower loading condition and
rich fuel mixture is available at higher loading condition. It will result in increased CO emission

Chapter 4 Results and discussion
136
0 25 50 75 100
0
10
20
30
40
50
60
70
80
90
De
cre
ase
in
CO
(%
)
Load (%)
Diesel+Ceria
Diesel+CZ3
Diesel+CZM2
Diesel+CZA3
Diesel+CZA2
at higher loads. It was observed from the results that a significant reduction of CO was observed
when the engine was operated using the nanofuel. The cerium based nanoparticles were acted as
a chemically active component and it worked as an oxygen storage device by releasing the O2 in
the presence of reduced gas environment of CO and converting into CO2 leading to the reduction
of the concentration of CO.
Figure 4.68 Decrease in CO emission with different types of nanofuel at 0.06 wt. % in
comparison with diesel
Figure 4.68 shows the decrease in CO emission compared to diesel using high OSC
nanoparticles CeO2, CZ3, CZA2, CZA3 and CZM2 dispersed diesel against different loading
conditions. It was observed that the decrease of CO concentration at no load condition was the
lowest. However, the reduction of CO was increased with loading pattern and it reached the
maximum reduction at 75 % loading condition. The same was noted to be 53, 57, 62, 68 and 71
% for CeO2, CZ3, CZM2, CZA3 and CZA2 based nanofuel, respectively. At 100 % load, the
decrease in CO was found to be less than that of 75 % load. The trend observed for all types of
nanofuel against the reduction of CO was followed the same as that of the OSC of nanoparticles.
The reduction of CO was found to be very high in case of CZA2 based nanofuel and less in case
of CeO2 based nanofuel in all the loading conditions, where the trend of OSC of the nanoparticle
and quantity of oxygen liberation was reflected. When economic aspect of running the engine

Chapter 4 Results and discussion
137
0 25 50 75 100
0
50
100
150
200
250
300
350
400
Hyd
roca
rbo
n (
pp
m)
Load (%)
Diesel
Diesel+Ceria
Diesel+CZ3
Diesel+CZM2
Diesel+CZA3
Diesel+CZA2
was considered, the reduction of CO was noted to be 60 % when CZA2 based nanofuel was used
at 100 % loading conditions. The oxygen content in nanofuel aided for complete combustion
leading to reduced concentration of CO liberation.
Figure 4.69 shows the effect of high OSC nanoparticles dispersed diesel on hydrocarbon
emission against different loading conditions. The trend observed for the emission level of
hydrocarbon for the nanofuel and pure diesel with load variation was similar and it was same as
that of CO emission. The emission level of hydrocarbon was higher at no load condition and it
was gradually decreased till 75 % load, where it was reduced from 328 to 220 ppm and 141 to
117 ppm for pure diesel and CZA2 dispersed diesel, respectively. It was due to the fact that a
rich fuel mixture was required to start the engine at low loading conditions to get the required
combustion temperature and pressure and maintain the speed at higher loading condition. In all
type of nanofuel, the hydrocarbon emission level was less compared to pure diesel. With further
increase of load beyond 75 %, an increasing trend of hydrocarbon emission was observed.
Figure 4.69 Effect of nanoparticles in diesel at 0.06 wt. % on hydrocarbon emission
Figure 4.70 shows the decrease in hydrocarbon emission using high OSC nanoparticles CeO2,
CZ3, CZA2, CZA3 and CZM2 dispersed diesel compared to pure diesel. The reduction of
hydrocarbon was observed to be high in all type of nanofuel compared to diesel and it follows

Chapter 4 Results and discussion
138
0 25 50 75 100
0
10
20
30
40
50
60
De
cre
ase
in
hyd
roca
rbo
n (
%)
Load (%)
Diesel+Ceria
Diesel+CZ3
Diesel+CZM2
Diesel+CZA3
Diesel+CZA2
the trend of OSC of the nanoparticles irrespective of loading. The presence of oxygen in the
nanofuel reduced the activation temperature of carbon combustion, which promoted the
complete combustion of fuel leading to decrease the hydrocarbon emission. A high reduction of
unburned hydrocarbon was observed to be 57, 59, 55, 47 and 44 % at 0, 25, 50, 75 and 100 %
load, respectively for CZA2 nanofuel, where it involved in complete combustion process due to
its more oxygen content compared to the remaining nanofuel.
Figure 4.70 Decrease in hydrocarbon emission with different nanofuel at 0.06 wt. % in
comparison with diesel
Cerium oxide provides necessary oxygen for the oxidation of CO or CxHy or it absorbs oxygen
for the reduction of NOx. Cerium oxide may store or release oxygen in the following reaction
processes:
2322 O2
1OCeCeO2
...(4.11)
The removal of oxygen from ceria was occurred when it was exposed to oxygen deficient
atmosphere at high temperature, which led to the formation of several cerium oxide phases of the
type of CeO2-x with a range of possible compositions (0≤x≤0.5). Like CeO2, the oxygen release

Chapter 4 Results and discussion
139
0 25 50 75 100
0
20
40
60
80
100
120
NO
x(p
pm
)
Load (%)
diesel
diesel+Ceria
diesel+CZ3
diesel+CZM2
diesel+CZA3
diesel+CZA2
reactions for CZ3, CZA2, CZA3 and CZM2 were also given in equation (4.2), (4.3), (4.4) and
(4.5), respectively. The amount of oxygen released / absorbed during oxygen reduction or rich
environment by CZA2 was comparatively higher than the remaining nanoparticles. It was due to
the high OSC and specific surface area of CZA2 compared to rest of the nanoparticles, which are
given in Table 4.7. It helped to increase the area of contact between the fuel and the oxidizer to
achieve the maximum possible combustion, which resulted in reduced CO and hydrocarbon
emission.
Figure 4.71 Effect of nanoparticles in diesel at 0.06 wt. % on NOx emission
Figure 4.71 shows the effect of various high OSC nanoparticles dispersed diesel on NOx
emission at different loading conditions. It was observed that the emission level of NOx was
observed to be increased with loading for both nanofuel and diesel. The major source of NOx
during combustion is the presence of nitrogen in air and fuel. The quantity of NO and NOx
formation was observed to be directly influenced by the combustion temperature. NOx comprises
of different oxides of nitrogen formed during the combustion process by the oxidation of
nitrogen. Initially, the amount of NOx was less due to low combustion temperature at zero
loading condition, which was gradually increased with loading. The NOx content was increased
from 58 to 100 ppm and 15 to 33 ppm for diesel and CZA2 nanofuel, respectively, when the

Chapter 4 Results and discussion
140
0 25 50 75 100
0
10
20
30
40
50
60
70
80
De
cre
ase
in
NO
x (
%)
Load (%)
Diesel+Ceria
Diesel+CZ3
Diesel+CZM2
Diesel+CZA3
Diesel+CZA2
loading was increased from 0 to 100 %. The NOx emission was observed to be high at higher
loading condition due to higher gas temperature, Kumar et al. [2008]. Irrespective of loading
condition, NOx emission of an engine by nanofuel usage was observed to lower than that of
diesel usage. It was due to the oxygen absorption characteristics of CeO2, CZ3, CZA2, CZA3
and CZM2 in the oxygen rich environment. The reduction trend of NOx content reflects the OSC
of different nanoparticles.
Figure 4.72 Decrease in NOx emission with different types of nanofuel at 0.06 wt. % in
comparison with diesel
Figure 4.72 shows the decrease in NOx emission using high OSC nanoparticles CeO2, CZ3,
CZA2, CZA3 and CZM2 dispersed diesel at different loading conditions compared to that of
diesel, where the reduction of NOx emission was observed in all types of nanofuel and loading.
Due to high OSC of the nanoparticles, a corresponding reduction in emission of NOx was noted
and the reduction was remarkable for nanoparticle dispersed diesel, where the trend of OSC was
followed in the reduction of NOx emission. It was observed that a higher reduction of NOx was
obtained for CZA2 nanofuel in all range of loading conditions, which was observed to be 73, 70,
67, 67.7 and 67.9 % for 0, 25, 50, 75 and 100 % of load, respectively. It is also observed that the
quantity of NOx emission at higher loading condition was less, when the nanofuel was used to

Chapter 4 Results and discussion
141
0 25 50 75 100
0.0
0.5
1.0
1.5
2.0
2.5
3.0
3.5
CO
2(%
)
Load (%)
diesel
diesel+Ceria
diesel+CZ3
diesel+CZM2
diesel+CZA3
diesel+CZA2
run the engine compared to pure diesel. It is due to the fact that the catalytic activity of
nanoparticles became more influential after sufficient period of operation in an engine with
nanofuel which promoted the possible chemical reactions as discussed by Chen et al. [2009]. A
major factor contributing to NOx emissions included the high combustion temperature and
presence of oxygen during the combustion process, Zhuiykov et al. [2002]. The high OSC
nanoparticle dispersed diesel reduced the ignition delay in an engine leading to decrease the
combustion temperature, which resulted the reduced NOx emission compared to that of diesel.
Figure 4.73 Effect of nanoparticles in diesel at 0.06 wt. % on CO2 emission
Figure 4.73 shows the effect of high OSC nanoparticles on CO2 emission with nanofuel at
different loading conditions. It was observed that the quantity of CO2 was increased for all types
of nanofuel and diesel with an increase of load. The CO2 level was observed to be high at 100 %
loading. The CO2 is considered to be the product of complete combustion of a hydrocarbon fuel,
which results in the reduction of concentration of CO. It was observed that the CO2 emission for
nanofuel was higher than that of diesel. The rising trend of CO2 emission with load is due to the
higher fuel requirement with an increase of load. The CO2 emission was increased from 0.1 to
0.5 % and 0.5 to 3.1 % for diesel and CZA2 based nanofuel, respectively, when the loading was
increased from 0 to 100 %. In all cases, CZA2 dispersed nanofuel was observed to generate

Chapter 4 Results and discussion
142
0 25 50 75 100
100
200
300
400
500
600
Incre
ase
in
CO
2 (
%)
Load (%)
Diesel+Ceria
Diesel+CZ3
Diesel+CZM2
Diesel+CZA3
Diesel+CZA2
more quantity of CO2 compared to other fuel due to its high conversion rate of CO in to CO2 in
the presence of high OSC materials in diesel. The trend observed for the increase of CO2
concentration is similar to that of OSC trend.
Figure 4.74 shows the increase in CO2 emission with different nanofuel against loading
conditions. It was observed that the increase in trend of CO2 for all type of nanofuel was the
same as that of OSC content of nanoparticles. It was found that the increase in CO2
concentration at 100 % loading was noted to be 180, 260, 320, 420 and 520 % for CeO2, CZ3,
CZM2, CZA3 and CZA2 based nanofuel, respectively. The increase in CO2 emission of CZA2
based nanofuel was found to be 400, 500, 266, 500 and 520 % at 0, 25, 50, 75 and 100 % of
load, respectively. It is due the high OSC capacity of CZA2, which was used to oxidize the CO
and converted into CO2. The increase in CO2 emission is due to the equivalent reduction of CO
emission in addition to the oxidation of hydrocarbon.
Figure 4.74 Increase in CO2 emission with different types of nanofuel at 0.06 wt. % in
comparison with diesel
The NOx formation and reduction are explained with the help of following equation. Added to
that the oxidation mechanism of hydrocarbon and CO emission is explained as follows for CeO2

Chapter 4 Results and discussion
143
dispersed diesel, Sajith et al. [2010], and Mandal et al. [2012]. The oxidation process to obtain
CO2 is also shown here.
NO is formed by the combination of nitrogen present in air and oxygen. At high temperature, the
diatomic nitrogen breaks to monoatomic nitrogen, which easily reacts with oxygen to form NO
N2N2 ... (4.12)
NO2ON2 2 ... (4.13)
22 NO2O2N2 ... (4.14)
This NO2 reacts with cerium based high OSC nanoparticles to form cerium peroxide or super
oxide
2222 )( ONOCeNOCeO ... (4.15)
The super oxide gets decomposed and contributes to the conversion of NOx in to N2 and
oxidation of carbon
22222 CO2NCeO2C2O)NO(Ce2 ... (4.16)
22222 CO4NCeO2CO4O)NO(Ce2 ... (4.17)
The cerium based high OSC nanoparticles act as a catalyst to reduce the NOx by influencing the
reduction of NO or NO2 by C and CO formed by combustion
22 CONCNO2 ... (4.18)
222 CO2NC2NO2 ... (4.19)
22 CO2NCO2NO2 ... (4.20)
222 CO4NCO4NO2 ... (4.21)

Chapter 4 Results and discussion
144
In order to oxidize the hydrocarbon during the combustion process, the oxygen released from the
ceria reacts with hydrocarbon and converts it in to CO2 and H2O as per the following reaction:
OH2
yxCOOCe
2
)yx2(HCCeO)yx2( 232yx2
... (4.22)
As cerium oxide has higher stability at Ce
3+ ionic state, the CeO2 converts into Ce2O3 after
oxidizing the hydrocarbon and it remains active even after the initial stage of combustion and
gets reduced into CeO2 through the reduction of nitrogen oxide by the following reaction.
2232 N2
1CeO2NOOCe
... (4.23)
Table 4.11 summaries the details of engine exhaust emission using high OSC nanoparticle
dispersed diesel against loading, where the influence of nanoparticles on the reduction of NOx,
hydrocarbon and CO and the increase of CO2 against loading was noted.
Table 4.11 Engine exhaust emission of high OSC nanoparticles dispersed diesel against loading
and different type of nanofuel
Level % change
Engine Exhaust emission CO
(ppm)
HC
(ppm)
NOx
(ppm)
CO2
(%)
CO
(%)
(-)
HC
(%)
(-)
NOx
(%)
(-)
CO2
(%)
(+)
Diesel 0 586 328 56 0.1 - - - -
25 527 302 61 0.15 - - - -
50 494 264 79 0.3 - - - -
75 472 220 96 0.4 - - - -
100 541 250 103 0.5 - - - -
CeO2 dispersed
Diesel
0 381 218 41 0.2 35.0 33.5 26.8 100
25 324 195 49 0.4 38.5 35.4 19.7 167
50 250 190 70 0.6 49.4 28.0 11.4 100

Chapter 4 Results and discussion
145
4.6 Field trial on nanofuels
Field study was carried out in three different diesel generators having the capacity of 15, 25 and
30 kW. One liter of each type of nanofuel based on CeO2, CZ3, CZA2, CZA3 and CZM2
nanoparticles was supplied and the testing was done under no load condition of the engine.
Figure 4.75 shows the running time of the diesel generators having different capacity. It was
observed that the utilization period of nanofuel was high compared to diesel in all three diesel
generators. It was also noted that the running period of diesel and nanofuel was decreased with
75 224 170 85 0.9 52.5 22.7 11.5 125
100 300 202 90 1.4 44.6 19.2 12.6 180
CZ3 dispersed
Diesel
0 350 213 23 0.3 40.3 35.1 58.9 200
25 296 189 27 0.55 43.8 37.4 55.7 267
50 235 176 39 0.8 52.4 33.3 50.6 167
75 203 169 47 1.3 57.0 23.2 51.0 225
100 270 198 50 1.8 50.1 20.8 51.5 260
CZM2 dispersed
Diesel
0 304 178 19 0.35 48.1 45.7 66.1 250
25 261 159 23 0.6 50.5 47.4 62.3 300
50 201 147 33 0.9 59.3 44.3 58.2 200
75 180 142 39 1.7 61.9 35.5 59.4 325
100 261 168 42 2.1 51.8 32.8 59.2 320
CZA3 dispersed
Diesel
0 247 156 19 0.45 57.9 52.4 66.1 350
25 215 137 21 0.7 59.2 54.6 65.6 367
50 163 127 29 1 67.0 51.9 63.3 233
75 153 123 33 1.9 67.6 44.1 65.6 375
100 223 146 35 2.6 58.8 41.6 66.0 420
CZA2 dispersed
Diesel
0 216 141 15 0.5 63.1 57.0 73.2 400
25 184 123 18 0.9 65.1 59.3 70.5 500
50 149 120 26 1.1 69.8 54.6 67.1 267
75 138 117 31 2.4 70.8 46.8 67.7 500
100 217 139 33 3.1 59.9 44.4 68.0 520

Chapter 4 Results and discussion
146
15kW 25kW 30kW0
20
40
60
80
100
Ru
nn
ing
tim
e (
min
.)
Capacity (kW)
Diesel
Diesel + Ceria
Diesel + CZ3
Diesel + CZM2
Diesel + CZA3
Diesel + CZA2
an increase of capacity of the generator. It was due to the fact that the higher capacity generator
consumed more quantity fuel in order to meet the power output compared to that of lower
capacity generator. The utilization time was increased with the OSC of the nanoparticles used in
diesel in all three generators, where the lowest running time was observed in CeO2 based
nanofuel and the same was noted to be highest in case of CZA2 based nanofuel among the
nanofuel category. The running time for the remaining CZ3, CZA3 and CZM2 based nanofuel
was found to be in between CeO2 and CZA2 results according to their OSC.
Figure 4.75 Effect of nanofuel at 0.06 wt. % on running time of different capacity of diesel
generators at no load condition
Figure 4.76 shows the increase in utilization time of nanofuel compared to diesel usage. It is
proved that a diesel generator can be adapted to run with nanofuel to generate increased utility.
The increase in running time with respect to diesel showed the decrease in fuel consumption
compared to that of diesel. It was observed that the increase in utilization time of CZA2
dispersed nanofuel was observed to be 25±1 % for all three generators compared to that of diesel
usage. However, the enhancement was limited to 5±1 %, 17±1 %, 20±2 % and 22 % for CeO2,
CZ3, CZM2 and CZA3 based nanofuel, respectively. The high utilization period in CZA2
dispersed nanofuel was due its highest OSC compared to the remaining nanofuel. The

Chapter 4 Results and discussion
147
15kW 25kW 30kW0
5
10
15
20
25
30
35
22%
18%
22%22.1%
24.4%26%
Incre
ase
in
ru
nn
ing
tim
e (
%)
Capacity (kW)
Diesel + Ceria
Diesel + CZ3
Diesel + CZM2
Diesel + CZA3
Diesel + CZA2
5.9% 6.1%4.9%
17.9%
16%17%
25.4%
22.3%
19.4%
enhancement in utility period followed the same trend as that of OSC of different nanoparticles
dispersed in diesel.
Figure 4.76 Increase in running time of different capacity of diesel generators using nanofuel at
0.06 wt. % compared to diesel

Chapter 4 Results and discussion
148

149
Chapter 5
Conclusions and future scope
5.1 Conclusions
Cerium based solid solutions of CexZr1-xO2 (x = 0.4, 0.5, 0.6, 0.7, 0.8) were synthesized by sol-
gel and co-precipitation technique, where the high OSC composition was found in the
Ce0.6Zr0.4O2 solid solution synthesized by the sol-gel technique. In order to increase the OSC of
Ce0.6Zr0.4O2 further, the Al3+
, Mn2+
, Bi3+
, La3+
and Nd3+
were doped by sol-gel synthesize
technique and it formed the homogeneous solid solutions of Ce0.6Zr0.4-xY1.3xO2 (Y= Al, Bi, La
and Nd) and Ce0.6Zr0.4-xMnxO2, which were characterized by different analytical techniques.
Based on the OSC studies, the solid solutions of CeO2, Ce0.6Zr0.4O2, Ce0.6Zr0.2Al0.26O2,
Ce0.6Zr0.1Al0.39O2 and Ce0.6Zr0.2Mn0.2O2 were used for engine performance and exhaust emission
analysis and the same was used for field trial in order to explore them for potential commercial
application. The summary of major results obtained under each sub-heading is given below:
A. Synthesize of ceria based high oxygen storage capacity (OSC) materials
o The crystallite size of CexZr1-xO2 (0.4≤x≤0.8) solid solutions varied in the range of 5
to 7 nm and 5 to 10 nm in sol-gel and co-precipitation technique, respectively.
o The Ce0.6Zr0.4O2 solid solution was observed to have the cubic fluorite structure and
lattice defects in order to have the highest OSC among the CexZr1-xO2 (0.4≤x≤0.8)
solid solutions.
o The OSC of Ce0.6Zr0.4O2 solid solution prepared by co-precipitation and sol-gel
method was observed to be 0.140 and 0.147 mol of O2/mol of CeO2, respectively,
and thus the sol-gel method was chosen to synthesize nanoparticles for further
improvement of its OSC.
o The crystallite size of Ce0.6Zr0.4-xY1.3xO2 (Y= Al, Bi, La and Nd) and
Ce0.6Zr0.4-xMnxO2 solid solutions was observed to be less than that of Ce0.6Zr0.4O2.

Chapter 5 Conclusions and future scope
150
o The qualitative confirmation of OSC of nanoparticles was done by Raman
spectroscopy, Thermomechanical analyzer and HRTEM images.
o The OSC of Ce0.6Zr0.4O2 solid solution was influenced by the ionic radius of doping
element. When Al3+
and Mn2+
ions were doped, whose ionic radius is lower than that
of Ce4+
, the OSC of Ce0.6Zr0.2Al0.26O2 , Ce0.6Zr0.1Al0.39O2 and Ce0.6Zr0.2Mn0.2O2 was
increased by 56, 45 and 22 %, respectively, in comparison to that of Ce0.6Zr0.4O2
solid solution.
o When Bi3+
, La3+
and Nd3+
ions were doped in Ce0.6Zr0.4O2, the OSC was decreased
by 78, 44 and 15 %, respectively, where the ionic radius of the doped elements was
higher than the Ce4+
.
o The specific surface area of nanoparticles is observed to be directly proportional to
their oxygen storage capacity.
o The OSC of Ce0.6Zr0.2Al0.26O2 was observed to be the highest amongst all the tested
samples.
B. Selection of suitable surfactant and synthesis technique to prepare nanofuel
o Tween 80 as a surfactant was observed to show the better dispersion stability in CeO2
based nanofuel.
o Combination of tip sonication and magnetic stirring technique was observed to be the
suitable processing technique to prepare highly stable nanofuel.
o Accelerated sedimentation technique was noted to be the suitable one to estimate the
relative stability of nanofuel till the final sedimentation of nanoparticles in the fuel. In
case of CeO2 dispersed diesel at 0.06 wt. %, the total sedimentation time was calculated
to be 620 hrs.
o Oleic acid was selected as a surfactant to prepare all types of nanoparticles (CeO2,
Ce0.6Zr0.4O2, Ce0.6Zr0.2Al0.26O2, Ce0.6Zr0.2Mn0.2O2 and Ce0.6Zr0.1Al0.39O2) dispersed diesel
to be tested for engine studies.

Chapter 5 Conclusions and future scope
151
C. Optimization of ceria concentration for the performance of an IC engine
o The performance of an IC engine was observed to be increased when CeO2 dispersed
diesel was tested.
o The optimum concentration CeO2 in diesel was found to be 0.06 wt. %, where the brake
thermal efficiency and mechanical efficiency of an engine were increased by 12.8 and
9.2 %, respectively. In addition, the brake specific fuel consumption and frictional power
of an engine were decreased by 11.3 and 20.8 %, respectively.
D. Studies on high OSC nanoparticles dispersed diesel
o Stability of nanofuel was observed to be influenced by the concentration and
crystallite size of the nanoparticles.
o The rate of sedimentation of nanoparticles in diesel was observed to be inversely
proportional to the exponential relation.
o The relative stability of 0.06 wt. % of CeO2, Ce0.6Zr0.4O2, Ce0.6Zr0.2Al0.26O2,
Ce0.6Zr0.1Al0.39O2 and Ce0.6Zr0.2Mn0.2O2 dispersed diesel was found to be 87, 88, 88,
91 and 89 %, respectively, after 168 hrs.
o As the Ce0.6Zr0.1Al0.39O2 nanoparticles have the lowest crystallite size, the nanofuel
prepared with the same showed the highest relative stability for the period of 168 hrs.
o Surface tension of nanofuel was increased by 4% for all types of nanoparticle
dispersed diesel tested in the present study, which is within the limitation of
experimental variation.
o Flash point and fire point temperature of all types of nanofuel were increased by 9 %.
o Viscosity of nanofuel was observed to be increased with crystallite size of
nanoparticle dispersed in diesel.
o Effective thermal conductivity ratio of nanofuel at room temperature was observed to
be 1.06, 1.08, 1.09, 1.14 and 1.11 for CeO2, Ce0.6Zr0.4O2, Ce0.6Zr0.2Al0.26O2,
Ce0.6Zr0.1Al0.39O2 and Ce0.6Zr0.2Mn0.2O2 dispersed diesel, respectively, at 0.06 wt.%.

Chapter 5 Conclusions and future scope
152
E. Engine performance with high OSC nanoparticle (0.06 wt. %) dispersed diesel
(Nanofuel) and emission studies
o When Ce0.6Zr0.2Al0.26O2 nanoparticles dispersed diesel was tested, the brake thermal
efficiency and mechanical efficiency of an engine were increased by 20.7 and 8.2 %,
respectively and the BSFC and frictional power were decreased by 17.1 and 15.3 %,
respectively, which were found to be the best among all types of nanofuel considered
in the present study, as the Ce0.6Zr0.2Al0.26O2 has the OSC of 0.2293 mol of O2/ mol
of CeO2, the highest among the other types of nanoparticles proposed in the present
study.
o The highest reduction of friction power in an engine was observed in Ce0.6Zr0.4O2
dispersed diesel and thus the mechanical efficiency of the same was high compared
to other types of nanofuel.
o Emission level of hydrocarbon, CO and NOx was observed to be decreased in all type
of nanofuel compared to diesel.
o Highest emission reduction was obtained for Ce0.6Zr0.2Al0.26O2 nanofuel, where the
emission level of NOx, CO and hydrocarbon were reduced by 68, 60 and 44 %,
respectively, compared to that of diesel emission.
F. Field trial on nanofuels
o Utilization time of the commercial diesel generators was increased with nanofuel
compared to diesel. It was found to be increased by 5±1, 17±1, 20±2 and 22 % for CeO2,
Ce0.6Zr0.4O2, Ce0.6Zr0.2Mn0.2O2 and Ce0.6Zr0.1Al0.39O2 dispersed diesel, respectively.
o The increase in utilization time of 25±1 % was observed for 15, 25 and 30 kW diesel
generator, when Ce0.6Zr0.2Al0.26O2 nanoparticles dispersed diesel was tested.
5.2 Scope of future work
The work presented here opens up several avenues for further development of the high OSC
nanoparticles for the application of an IC engine. The scope of the future work is outlined as
follows:

Chapter 5 Conclusions and future scope
153
o Cerium based four-metal combination can be synthesized in order to increase the OSC
further.
o The high OSC nanoparticles may be prepared with magnetic characteristics in order to
trap them after the catalytic application.
o Combustion studies on nanoparticles dispersed diesel may be carried out.
o Higher OSC nanoparticles can be used in biodiesel blends in order to reduce the CO2
emissions.
o Accelerated sedimentation studies may be further extended for all types of nanofuel.
o The high OSC nanoparticles may be mixed with coal powder to increase the fuel
combustion efficiency and reduce the emission level.
o Systematic field study can be carried out with respect to load and speed in order to find
the effective utilization of nanofuel for the commercial applications.
o Nanofuel can be explored for stationary power production units such as steam turbine,
where diesel is used as a heat source.

Chapter 5 Conclusions and future scope
154

155
References
Ajav E. A, Singh B, Bhattacharya T K. Experimental study of some performance parameters of
a constant speed stationary diesel engine using ethanol-diesel blends as fuel. Biomass and
Bioenergy 17 (1999) 357–365.
Arias M, Garcia M F, Jues A I, Hungria A B, Anderson J A, Conesa J C, Soria J. Influence of
thermal sintering on the activity for CO–O2 and CO–O2–NO stoichiometric reactions over
Pd(Ce, Zr)Ox/Al2O3 catalysts. Applied Catalysis B: Environmental 38 (2002) 151–158.
Ashok M P, Saravannan C G. Performance and emission of the emulsified fuel in a DI diesel
engine using additive diethyl ether with surfactant of Span 80. Energy and Fuels 21 (2007)
1878–1882.
Atkinson A, Ramos T M G M. Chemically induced stress in ceramic oxygen ion-conducting
membranes. Solid state Ionics 129 (2000) 259–269.
Bao H, Chen X, Fang J, Jiang Z , Huang W. Structure-activity relation of Fe2O3–CeO2
composite catalysts in CO oxidation. Catalysts Letter 125 (2008) 160–167.
Bazin P, Saura O, Meunier F C, Daturi M, Lavalley J C, Govic M A L, Harle V, Blanchard G.
A thermogravimetric and FT-IR study of the reduction by H2 of sulfated Pt/CexZr1-xO2
solids. Applied Catalysis B: Environmental 90 (2009) 368–379.
Brook RD, Franklin B, Cascio W, Hong Y, Howard G, Lipsett M et al. Air pollution and
cardiovascular disease: a statement for healthcare professionals from the expert panel on
population and prevention science of the american heart association. Circulation 109 (2004).
2655–2671.
Cao CY, Cui ZM, Chen CQ, Song WG, Cai W. Ceria hollow nanospheres produced by a
template-free microwave-assisted hydrothermal method for heavy metal Ion removal and
catalysis. Journal of Physical Chemistry C 114 (2010) 9865–9870.
Cassee F R, Campbell A, Boere A J F, McLean S G, Duffin R, Krystek P, Gosens I, Miller M R.
The biological effects of subacute inhalation of diesel exhaust following addition of cerium
oxide nanoparticles in atherosclerosis-prone mice. Environmental Research 115 (2012) 1–10.
Chang Y, McCarty J G. Novel oxygen storage components for advanced catalysts for emission
control in natural gas fueled vehicles. Catalysis Today 30 (1996) 163–170.
Changlin L, Xin G, Yanq W, Yaojun W, Yangang W, Xiaohui L, Guanzhong L. Synthesis and
characterization of mesostructured ceria-zirconia solid solution. Journal of Rare Earths 27
(2009) 211–215.
Chen Y, Guo Z, Wang Z. Influence of CeO2 on NOx emission during iron ore sintering. Fuel
Processing Technology 90 (2009) 933–938.
Cho B K. Chemical modification of catalyst support for enhancement of transient catalytic
activity: nitric oxide reduction by carbon monoxide over rhodium. Journal of catalysis 131
(1991) 74–87.
Chong M K, Pita K, Kam C H. Photoluminescence of sol-gel-derived Y2O3: Eu3+
thin-film
phosphors with Mg2+
and Al3+
co-doping. Applied Physics A, Materials Science &
Processing 79 (2004) 433–437.

References
156
Chuang C C, Hsianga H I, Hwang J S, Wang T S. Synthesis and characterization of Al2O3-
Ce0.5Zr0.5O2 powders prepared by chemical co precipitation method. Journal of Alloys and
Compounds 470 (2009) 387–392.
Crozier P, Wang R, Sharma R. In situ environmental TEM studies of dynamic changes in
cerium-based oxides nanoparticles during redox processes. Ultramicroscopy 108 (2008)
1432–1440.
Das S K, Putra N, Thiesen P, Roetzel W. Temperature dependence of thermal conductivity
enhancement for nanofluids. Journal of Heat Transfer 125 (2003a) 567–573.
Das S K, Narayan G, Baby A K. Survey on nucleate pool boiling of nanofluids: the effect of
particle size relative to roughness. Journal of nanoparticle research 10 (2008) 1099–1108.
Das S K, Putra N, Roetzel W. Pool boiling characteristics of nano-fluids. International Journal of
Heat and Mass Transfer 46 (2003b) 851–862.
Deshpande A S, Pinna N, Beato P, Antonietti M, Niederberger M. Synthesis and
characterization of stable and crystalline Ce1-xZrxO2 nanoparticle sols. Chemistry of
Materials 16 (2004) 2599–2604.
Dhage S.R, Gaikwad S P, Kumar P M, Ravi V. Synthesis of Ce0.75Zr0.25O2 at 100°C. Ceramic
International 31 (2004) 211–213.
Dong F, Tanabe T, Suda A, Takahashi N, Sobukawa H, Shinjoh H. Investigation of the OSC
performance of Pt/CeO2ZrO2Y2O3 catalysts by CO oxidation and 18
O/16
Oisotopic exchange
reaction. Chemical Engineering Science 63 (2008) 5020 – 5027.
Du Y, Shi S, He H, Dai H. Fabrication and characterization of Ce0.7Zr0.3O2 nanorods having high
specific surface area and large oxygen storage capacity. Particuology 9 (2011) 63–68.
Dutta G, Umesh V W, Baidya T, Hedge M S, Priolkar K R, Sarode P R. Reducibility of Ce1-
xZrxO2: orgin of enhanced oxygen storage capacity. Catalytic Letters 108 (2006) 165–172.
Eguchi K, Setoguchi T, Inoue T, Arai H. Electrical properties of ceria-based oxides and their
application to solid oxide fuel cells. Solid State Ionics 52 (1992) 165–72.
Evans J S O, Mary T A, Sleight A W. Negative thermal expansion materials. Physica B. 241-243
(1998) 311–316.
Fagg D P, Kharton V. V, Shaula A, Marozau I.P, Frade J R. Mixed conductivity, thermal
expansion, and oxygen permeability of Ce (Pr, Zr) O2-δ. Solid State Ionics 176 (2005) 1723 –
1730.
Fitzsimmons M R, Eastman J A, Stach M M, Wallner G. Structural characterization of
nanometer-sized crystalline Pd by x-ray-diffraction techniques. Physical Review B 44(6)
(1991) 2454–2460.
Gan Y, Lim Y S, Qiao L. Combustion of nanofluid fuels with the addition of boron and iron
particles at dilute and dense concentrations. Combustion and flame 159 4 (2012) 1732–1740.
Gan Y, Qiao L. Combustion characteristics of fuel droplets with addition of nano and micron
sized aluminum particles. Combustion and flame 158 (2011a) 354–368.
Gan Y, Qiao L. Evaporation characteristics of fuel droplets with the addition of nanoparticles
under natural and forced convection. International journal of Heat and Mass transfer 54
(2011b) 4913–4922.

References
157
Gan Y, Syuen Y, Lim Y S, Qiao L. Combustion of nanofluid fuels with the addition of boron
and iron particles at dilute and dense concentrations. Combustion and flame 159 (2012)
1732–1740.
Ganesh D, Gowrishankar G. Effect of nano-fuel additive on emission reduction in a biodiesel
fuelled CI engine. IEEE: International conference on electrical and control engineering
(ICECE) (2011) 3453–3459.
Garg P, Alvarado J I, Marsh C, Carlson T A, Kessler D A, Annamalai K. An experimental study
on the effect of ultrasonication on viscosity and heat transfer performance of multi-wall
carbon nanotube-based aqueous nanofluids. International Journal of Heat and Mass Transfer
52 (2009) 5090–5101.
Gateshki, M Niederberger, A S Deshpande, Y Ren, V Petkov. Atomic-scale structure of
nanocrystalline CeO2–ZrO2 oxides by total x-ray diffraction and pair distribution functional
analysis. Journal of physics condensed Matter 19 (2007) 156205 1–12.
Ghom S A, Zamani C, Andreu T, Epifani M, Morante J R. Improvement of oxygen storage
capacity using mesoporous ceria- zirconia solid solutions. Applied Catalysis B:
Environmental 108– 109 (2011) 32–38.
Godiganur S, Murthy C S, Reddy R P. Performance and emission characteristics of a Kirloskar
HA394 diesel engine operated on fish oil methyl esters. Renewable Energy 35 (2010) 355–
359.
Golubovic M N, Hettiarachchi H D M, Worek W M , Minkowycz W J. Nanofluids and critical
heat flux experimental and analytical study. Applied Thermal Engineering 29 (2009) 1281–
1288.
Govindaraj R, Sundar C S, Arora A K. Atomic scale study of negative thermal expansion in
zirconium tungsten. Physical Review B 76 (012104) (2007) 1–4.
Goyal K K. Renewable energy. Pinnacle technology (2009).
Guo J, Wu D , Zhang L, Gong M, Zhao M, Chen Y. Preparation of nanometric CeO2–ZrO2–
Nd2O3 solid solution and its catalytic performances. Journal of Alloys and Compounds 460
(2008) 485–490.
Gupta A, Waghmare U V, Hegde M S. Correlation of oxygen storage capacity and structural
distortion in transition-metel,, noble-metal, and rare-earth-ion-substituted CeO2 from first
principles calculation. Chemistry of Materials 22 (2010) 5184–5198.
He H, Dai H X, Wong K W, Au CT. RE0.6Zr0.4−xYxO2 (RE = Ce, Pr; x = 0, 0.05) solid solutions:
an investigation on defective structure, oxygen mobility, oxygen storage capacity, and redox
properties. Applied Catalysis A: General 251 (2003) 61–74.
Heywood J B. Internal combustion engine fundamentals McGraw Hill, New York. (1988).
Hirano M, Fukuda Y, Iwata H, Hotta Y, Inagaki M. Preparation and spherical agglomeration of
crystalline cerium (iv) oxide nanoparticles by thermal hydrolysis. Journal of American
Ceramic Society 83 (2000) 5 1287–1289.
Hirano M, Hirai K. Effect of hydrolysis conditions on the direct formation of nanoparticles of
ceria–zirconia solid solutions from acidic aqueous solutions. Journal of Nanoparticle
Research 5 (2003) 147–156.

References
158
Hirano M, Kato E. Hydrothermal synthesis of nanocrystalline cerium (IV) oxide powders.
Journal of American Ceramic Society 82 3 (1999) 786–88.
Hirano T. Dehydrogenation of ethylbenzene over potassium- promoted iron oxide containing
cerium and molybdenum oxides. Applied Catalysis 28 (1986)119–132.
Hongmei L, Qingchao Z, Yile L, Maochu G, Yongdong C, Jianli W, Yaoqiang C. Effects of
ceria/zirconia ratio on properties of mixed CeO2 -ZrO2 -Al2O3 compound. Journal of Rare
Earths 28(1) (2010) 79–83.
Hori C E, Permana H, Ng K Y S, Brenner A, More K, Rahmoeller KM, Belton D. Thermal
stability of oxygen storage properties in a mixed CeO2-ZrO2 system. Applied Catalysis B:
Environmental 16 (1998) 105–117.
Hu C, Zhu Q, Jiang Z Nanosized CuO–ZrxCe1-xOy aerogel catalysts prepared by ethanol
supercritical drying for catalytic deep oxidation of benzene. Powder Technology 194 (2009)
109–114.
Huang, Risha G A, Yang V, Yetter R A. Effect of particle size on combustion of aluminum
particle dust in air. Combustion and flame. 156 (2009) 5–13.
Hwang Y, Lee J K, Lee C H, Jung Y M, Cheong S I, Lee C G, Ku B C, Jang S P. Stability and
thermal conductivity characteristics of nanofluids. Thermochima Acta 455 (2007) 70–74.
Ikeda T, Hirata M, and Kimura T. Hydration structure of Y 3+
and La 3+
compared: An
application of metadynamics. Journal of chemical physics. 122 (2005) 244507 1–5.
Jana M, Khojin A S, Zhong W H. Enhancement of fluid thermal conductivity by the addition of
single and hybrid nano – additives. Thermochima Acta 462 (2007) 45–55.
Jia L, Shen M, Hao J, Rao T, Wang J. Dynamic oxygen storage and release over Mn0.1Ce 0.9Ox
and Mn0.1Ce0.6Zr0.3Ox complex compounds and structural characterization. Journal of Alloys
and compounds 454 (2008) 321–326.
Jung H Kittelson d B Zachariah R. The influence of a cerium additive on ultrafine diesel particle
emissions and kinetics of oxidation. Combustion and Flame 142 (2005) 276–288.
Kao M. J, Ting C C, Lin B F, and Tsung T T. Aqueous aluminum nanofluid combustion in
diesel fuel. Journal of Testing and Evaluation 36.2 (2008) 503 1–5.
Karthik R. Raja T S R, Madavan R. Enhancement of critical characteristics of transformer oiil
using nanomaterials. Arab Journal of Science and Engineering 38 (2013) 2725–2733.
Kaspar J, Fornasiero P, Hickey N. Automotive catalytic converters: current status and some
perspectives. Catalysis Today 77 (2003) 419–449.
Keblinski P, Eastman J A, and Cahill D G. Nanofluids for thermal transport Materials today 8
(2005) 36–44.
Keskin A, Guru M, Altiparmak D. Influence of tall biodiesel with Mg and Mo based fuel
additives on diesel engine performance and emission. Bioresource Technology 99 (2008)
6434–6438.
Khaleduzzaman S S, Mahbubul I M, Shahrul I M., Saidur R. Effect of particle concentration,
temperature and surfactant on surface tension of nanofluids. International Communications
in Heat and Mass Transfer 49 (2013) 110–114.

References
159
Kim S J, Banf I C, Buongiorno J, Hu L W. Surface wettability change during pool boiling of
nanofluids and its effect on critical heat flux. International Journal of Heat and Mass
Transfer 50 (2007) 4105–4116.
Kondratenko E V, Sakamoto Y, Okumura K, Shinjoh H. Transient analysis of oxygen storage
capacity of Pt/CeO2–ZrO2 materials with millisecond- and second-time resolution. Applied
Catalysis B: Environmental 89 (2009) 476–483.
Kozlov A I, Kim D H, Yezerets A, Andersen P, Kung H H, Kung M C. Effect of preparation
method and redox treatment on the reducibility and structure of supported ceria–zirconia
mixed oxide. Journal of Catalysis. 209 (2002) 417–426.
Krause B, Mende M, Potschke P, Petzold G. Dispersability and particle size distribution of
CNTs in an aqueous surfactant dispersion as a function of ultrasonic treatment time. Carbon
48 (2010) 2746–2754.
Kumar S A, Meenakshi K S, Narashimhan B R V, Srikanth S, Arthanareeswaran G. Synthesis
and characterization of copper nanofluid by a novel one step method. Materials Chemistry
and Physics 113 (2009) 57–62.
Kumar S K, Velraj R, Ganesan R. Performance and exhaust emission characteristics of a CI
engine fuels with pongamia pinnata methyl ester (PPME) and its blends with diesel. 33
(2008) 2294–2302.
Lai C C, Huang Y C, Wei Y H, Chang J S. Biosurfactant enhanced removal of total petroleum
hydrocarbons from contaminated soil. Journal of Hazardas materials 167 (2009) 609–614.
Letichevsky S, Claudio A. Tellez C A, Roberto R, Avillez R R D, Silva M I P D, Fraga M A,
Appel L G. Obtaining CeO2–ZrO2 mixed oxides by co precipitation: role of preparation
conditions. Applied Catalysis B: Environmental 58 (2005) 203–210.
Levasseur B, Kaliaguine S. Effect of iron and cerium in La1-yCeyCo1-xFexO3 perovskites as
catalysts for VOC oxidation. Applied Catalysis B: Environmental 88 (2009) 305–314.
Li Y, Suzuki M, Ogawa H, Effect of ethyl tert-butyl ether addition to diesel fuel on
characteristics of combustion and exhaust emissions of diesel engines. Fuel 88 (2009a)
2017–2024.
Li Y, Zhou J, Tung S, Schneider E, Xi S. A review on development of nanofluid preparation
and characterization. Powder Technology 196 (2009b) 89–101.
Lima J F D, Martins R F, Neri C R, Serra O A. ZnO:CeO2-based nanopowders with low
catalytic activity as UV absorbers. Applied Surface Science 255 (2009) 9006–9009.
Lin C Y, Wang J C, Chen T C. Analysis of suspension and heat transfer characteristics of Al2O3
nanofluids prepared through ultrasonic vibration. Applied Energy 88 (2011) 4527–4533.
Lisunova M O, Lebovka N I, Melezhyk O V, Boiko Y P. Stability of the aqueous suspensions of
nanotubes in the presence of nonionic surfactant. Journal of Colloid and Interface Science.
299 (2006) 740–746.
Lorenz W, Reimann H J, Schmal A, Dormann P, Schwarz B, Neugebauer E, et al. Histamine
release in dogs by cremophor EI and its derivatives: oxethylated oleic acid is the most
effective constituent. Agents actions 7-1 (1977) 63–67.

References
160
Luca L T D, Galfetti L, Severini F, Meda L, Marra G, Vorozhtsov A B, Meda L, Marra G,
Sedoi, Babuk V A. Burning of nano-aluminized composite rocket propellants. Combustion,
Explosion, and Shock Waves 41 (2005) 680–692.
Luo, Tok A I Y, Boey F Y C. Aqueous tape casting of 10 mol%- Gd2O3 doped CeO2 nano-
particles. Material Science and Engineering 429 (2006) 266–271.
Mandal S, Kanagaraj S. Reduction of emission in a diesel engine using nanofuel - ceria
nanoparticle dispersed diesel. Journal of ASTM International 1567 (2012) 64–78.
Masui T, MinamiK, Koyabu K, Imanaka N. Synthesis and characterization of new promoters
based on CeO2–ZrO2–Bi2O3 for automotive exhaust catalysts. Catalysis Today 117 (2006)
187–192.
Masui T, Ozaki T, Machida K I, Adachi H Y. Preparation of ceria–zirconia sub-catalysts for
automotive exhaust cleaning. Journal of Alloys and Compounds 303–304 (2000) 49–55.
Medina C, M J, Martinez M J S, Radomski A, Corrigan O I and Radomski M W. Nanoparticles:
pharmacological and toxicological significance. British Journal of Pharmacology 150 (2007),
552–558.
Meiqing S, Xinquan W, Yuan A, Duan W, Minwei Z, Jun W. Dynamic oxygen storage capacity
measurements on ceria based material. Journal of rare earths 25 (2007) 48–52.
Meng, L., Liu, L., Zi, X., Dai, H., Zhao, Z., Wang, X., He, W., Preparation ceria-zirconia solid
solution with enhanced oxygen storage capacity and redox performance. Front
Environmental science Engineering China 24 (2010) 164–171.
Mikulova J, Rossignol S, Gerard F, Mesnard D, Kappenstei C, Duprez D. Properties of cerium–
zirconium mixed oxides partially substituted by neodymium : Comparison with Zr–Ce–Pr–O
ternary oxides. Journal of Solid State Chemistry 179 (2006) 2511–2520.
Ming Z, Yanling Y, Hairong W, Zhimin L, Maochu G, Yaoqiang C. Preparation and
investigation of Ce0.4Zr0.5–xY0.1MnxO2 oxygen-storage materials. Journal of Rare Earths 28
(2010) 260–214.
Modeshia D R, Wright C S, Payne J L, Sankar G, Fiddy S G, Walton R L. Low-temperature
redox properties of nanocrystalline cerium (IV) oxides revealed by in situ XANES. The
Journal of Physical Chemistry 111 (2007) 14035–14039.
Moosavi M, Goharshadi E K, Youssefi A. Fabrication, characterization, and measurement of
some physicochemical properties of ZnO nanofluids. International Journal of Heat and Fluid
Flow 31 (2010) 59–605.
Morales M A, Jain T K, Labhasetwar V, Pelecky D L L. Magnetic studies of iron oxide
nanoparticles coated with oleic acid and pluronic block copolymer. Journal of applied
physics 97 (10) (2005) 1–4.
Morikawa A, Suzuki T, Kanazawa T, Kikuta K, Suda A, Shinjo H. A new concept in high
performance ceria–zirconia oxygen storage capacity material with Al2O3 as a diffusion
barrier. Applied Catalysis B: Environmental 78 (2008) 210–221.
Murshed S M S, Leong K C, Yang C. Enhanced thermal conductivity of TiO2–water based
nanofluids. International Journal of Thermal Sciences 44(4) (2005) 367–73.

References
161
Ozawa M, Hattori M, Yamaguchi T. Thermal stability of ceria catalyst on alumina and its
surface oxygen storage capacity. Journal of Alloys and Compounds 451 (2008) 621–623.
Ozawa M, Matuda K, Suzuki S. Microstructure and oxygen release properties of catalytic
alumina-supported CeO2–ZrO2 powders. Journal of Alloys and Compounds 303–304 (2000)
56–59.
Paria S, Khilar K C. A review on experimental studies of surfactant adsorption at the hydrophilic
solid-water interface. Advances in colloid and interface science 110 (3) (2004) 75-95.
Pavia D L, Lampman G M, Kriz G S. Introduction to spectroscopy, 3rd edition, Thomson, India
Edition, (2007) 353–385.
Peng C T, Lia H K, Liaw B J, Chen Y Z. Removal of CO in excess hydrogen over CuO/
Ce1−xMnxO2 catalysts. Chemical Engineering Journal 172 (2011) 452–458.
Peters A, Pope III CA Cardiopulmonary mortality and air pollution. Lancet 360 (2002) 1184–
1185.
Ping F, Jiqing L U, Xiaoyan X, Mengfei L. Catalytic combustion study of soot on Ce0.7Zr0.3O2
solid solution. Journal of Rare Earths 26 (2008) 250–253.
Pivkina A, Ulyanova P, Frolov Y, Zavyalov S, Schoonman J. Nanomaterials for heterogeneous
combustion. Propellants, explosives, pyrotechnics. 29 (2004) 39–49.
Pope CA Particulate air pollution, C-reactive protein, and cardiac risk. Eur Heart J 22 (2001)
1149–1150.
Prabhu S, Vinayagam B K. AFM investigation in grinding process with nanofluids using
Taguchi analysis. International Journal of Advanced Manufacturing Technology 60 (2012)
149–160.
Prasad D H, Lee J H, Lee H W, Kim B K, Park J S. Chemical synthesis and characterization of
CexZr1-xO2 powders by a modified sol gel method. Journal of Ceramic Processing Research
10 (6) (2009) 748–752.
Ramadhas A. S, Muraleedharan C, Jayaraj S. Performance and emission evaluation of a diesel
engine fueled with methyl esters of rubber seed oil. Renewable Energy 30 (2005) 1789–
1800.
Rao R, Mishra B G. Structural redox and catalytic chemistry of ceria based materials. Bulletin of
the Catalysis Society of India 3 (2003) 122–134.
Reddy B M, Katta L, Thrimurthulu G. Novel nanosized CexZr1−xO2, CexHf1−xO2 and
CexTb1−xO2−δ solid solutions: structural characteristics and catalytic performance. Catalysis
Today 175 (2011) 585– 592.
Reddy B M, Khan A. Nanosized CeO2-SiO2, CeO2-TiO2, and CeO2-ZrO2 mixed oxides:
influence of supporting oxide on thermal stability and oxygen storage properties of Ceria,
Catalysis survey from Asia. 9-3 (2005) 155–171.
Rossignol S, Madier Y, Duprez D. Preparation of zirconia - ceria materials by soft chemistry.
Catalysis Today 50 (1999) 261–270.
Rui R, Duan W, Xiaodong W, Jun F, Lei W, Xiaodi W. Structure and oxygen storage capacity of
Pr-doped Ce 0.26 Zr 0.74 O2 mixed oxides. Journal of Rare Earths 29 (2011) 1053–1059.

References
162
Sadri R, Ahmadi G, Togun H, Dahari M, Kazi S N, Sadeghinezhad E, Zubir N. An experimental
study on thermal conductivity and viscosity of nanofluids containing carbon nanotubes.
Nanoscale Research Letters 9:151 (2014) 1–16.
Sajith V, Sobhan C B, Peterson G P. Experimental investigation on the effects of cerium oxide
nanoparticle fuel additives on biodiesel. Advances in Mechanical Engineering Article ID
581407 (2010) 1–6.
Sayle T X T, Parker S C, Sayle D C. Oxidising CO to CO2 using ceria nanoparticles. Physical
Chemistry Chemical Physics 7 (2005) 2936–2941.
Shafii M B, Daneshvar, Jahani N, Mobini. Effect of ferrofluid on the performance and emissions
patterns a four-stroke diesel engine. Advances in Mechanical Engineering (2011) article ID
529049. 1–5.
Sharif S M, Fard F G, Khatibi E, Sarpoolaky H. Dispersion and stability of carbon black
nanoparticles, studied by ultraviolet-visible spectroscopy. Journal of Taiwan institute of
chemical engineers 40 (2009) 524–527.
Sharma S. K, Nirala A K, Kanagaraj S. Studies on the influence of cerium oxide nanoparticle as
an anti wear lubricant additive. (2010) B.Tech thesis report, Indian Institute of Technology,
Guwahati, India.
Shcherbakov A B, Ivanov V K, Zholobak N M, Ivanova O S , Krysanov Y E, Baranchikov A E,
Spivak N Y, and Tretyakov Y D. Nanocrystalline. Ceria Based Materials-Perspectives for
Biomedical Application. Biophysics 56 (2011) 1- 6.
Som I, Bhatia K Y, Asir M. Status of surfactants as penetration enhancers in transdermal drug
delivery. Journal of Pharmacy and Bioallied sciences 4 (2012) 2–9.
Sonawane S S, Patankar K, Fogla A, Puranik B, Bhan U, Kumar S S. An experimental
investigation of thermo-physical properties and heat transfer performance of Al2O3-aviation
turbine fuel nanofluids. Applied Thermal Engineering 31 (2011) 2841–2849.
Suhonen S, Valden M, Hietikko M, Laitinen R, Savimaki A, Harkonen M. Effect of Ce–Zr
mixed oxides on the chemical state of Rh in alumina supported automotive exhaust catalysts
studied by XPS and XRD. Applied Catalysis A: General 218 (2001) 151–160.
Tada M, Yoshiya M, Yasuda H. Effect of ionic radius and resultant two-dimensionality of
phonons on thermal conductivity in MxCoO2 (M = Li, Na, K) by perturbed molecular
dynamics. Journal of Electronic materials 39-9 (2010) 1439–1445.
Tah B, Pal P, Mahato M, Talapatra G B. Aggregation behavior of SDS/CTAB catanionic
surfactant mixture in aqueous solution and at the air/water interface. The journal of Physical
Chemistry B 115 (2011) 8493–9.
Takatori K, Tani T, Watanabe N, Kamiya N. Preparation and characterization of nano-
structured ceramic powders synthesized by emulsion combustion method. Journal of
Nanoparticel Research 1 (1999) 197–201.
Tanvir S T, Qiao L. Surface tension of nanofluid-type fuels containing suspended nanomaterials.
Nanoscale research letters 7 (2012) 226 1–10.

References
163
Trovarelli A, Boaro M, Rocchini E, Leitenburg C D, Dolcetti G. Some recent developments in
the characterization of ceria-based catalysts. Journal of alloys and compounds. 323-324
(2001) 584–591.
Trovarelli. A Structural and oxygen storage/release properties of CeO2-based solid solutions
comments on inorganic Chemistry. A Journal of Critical Discussion of the Current
Literature, 20 4-6 (1999) 263 –284.
Tyagi H, Patrick E. Phelan, Prasher R, Peck R, Lee T, Jose R. Pacheco, Arentzen P,. Increased
hot plate ignition probability for Nanoparticle -laden Diesel fuel. Nanoletters 8 (2008) 1410–
1416.
Vlaic G, Fornasiero P, Geremia G, Kaspar J, Graziani M. Relationship between the zirconia-
promoted reduction in the Rh-loaded Ce0.5Zr0.5O2 mixed oxide and the Zr–O local structure.
Journal of catalysis 168 (1997) 386–392.
Vlaic G, Monte R D, Fornasiero P, Fonda E, Kaspar J, Graziani M. Redox property–local
structure relationships in the Rh-loaded CeO2–ZrO2 mixed oxides. Journal of Catalysis 182
(1999) 378–389.
Wang Q, Li G, Zhao B Zhou R. The effect of Nd on the properties of ceria–zirconia solid
solution and the catalytic performance of its supported Pd-only three-way catalyst for
gasoline engine exhaust reduction. Journal of Hazardous Materials 189 (2011a) 150–157.
Wang Q, Li G, Zhao B, Zhou R. The effect of Nd on the properties of ceria–zirconia solid
solution and the catalytic performance of its supported Pd-only three-way catalyst for
gasoline engine exhaust reduction. Journal of Hazardous Materials. 189 (2011b) 150–157.
Wang Q, Li Z, Zhao B, Li G, Zhou R. Effect of synthesis method on the properties of ceria–
zirconia modified alumina and the catalytic performance of its supported Pd-only three-way
catalyst. Journal of Molecular Catalysis A: Chemical. 344 (2011c) 132– 137.
Wang X, Rodriguez J A, Jonathan, Hanson J C, Gamarra D, Arias A M, Garcıa M F. In situ
studies of the active sites for the water gas shift reaction over Cu-CeO2 catalysts: complex
interaction between metallic copper and oxygen vacancies of ceria. Journal of Physical
Chemistry B 110 (2006) 428–434.
Wei Z, Li H, Zhang X, Yan S, Lv Z, Chen Y, Gang M. Preparation and property investigation of
CeO2–ZrO2–Al2O3 oxygen-storage compounds. Journal of Alloy and Compounds 455 (2008)
322–326.
Wu X, Wu X, Liang Q, Fan J, Weng D, Xie Z, Wei S. Structure and oxygen storage capacity of
Pr/Nd doped CeO2-ZrO2 mixed oxides. Solid state science 9 (2007) 636–643.
Xiaodong W, Qing L, Duan W. Effect of manganese doping on oxygen storage capacity of ceria-
zirconia mixed oxides. Journal of Rare Earths 24 (2006) 549–553.
Xiaodong W, Qing L, Xiaodi W, Duan W. Role of surface adsorption in fast oxygen storage and
release of CeO2-ZrO2 mixed oxides. Journal of Rare Earths 25 (2007) 416–421.
Xuan Y, Li Q. Heat transfer enhancement of nanofluids. International Journal of Heat and Fluid
Flow 21 (2000) 58–64.

References
164
Yang H H, Lee W J, Mi H H Wong C H. PAH emissions influenced by Mn-based additive and
turbocharging from a heavy duty diesel engine Environment International 24 (1998) 389–
403.
Yasuda K, Nobu M, Masui T, Imanaka N. Complete oxidation of acetaldehyde on Pt/CeO2–
ZrO2–Bi2O3 catalysts Materials Research Bulletin 45 (2010) 1278–1282.
Yetter R A, Risha G A, Son S F. Metal particle combustion and nanotechnology. Proceedings of
the combustion Institute 32 (2009)1819–1838.
Young T J, Mawson S, Johnston K P. Rapid expansion from supercritical to aqueous solution to
produce submicron suspensions of water-insoluble drugs. Biotechnology progress 16 (2000)
402–407.
Zhang X, Long E, Li Y, Guo J, Zhang L, Gong M ,Wang M, Chen Y. CeO2-ZrO2-La2O3-Al2O3
composite oxide and its supported palladium catalyst for the treatment of exhaust of natural
gas engined vehicles. Journal of Natural and Gas Chemistry 18 (2009) 139–144.
Zhang Z, Zhang Y, Mu Z, Yu P, Ni X, Wang S, Zheng L. Synthesis and catalytic properties of
Ce0.6Zr0.4O2 solid solutions in the oxidation of soluble organic fraction from diesel engines.
Applied Catalysis B: Environmental 76 (2007) 335–347.
Zhu H, Zhang C, Tang Y, Wang J, Ren B, Yin Y. Preparation and thermal conductivity of
suspension of graphite nanoparticle. Carbon 45 (2007) 226–268.
Zhu M, Ma Y, Zhang D. An experimental study of the effect of a homogenous combustion
catalyst on fuel consumption and smoke emission in a diesel engine. Energy 36 (2011)
6004–6009.
Zhu M, Ma Y, Zhang D. Effect of a homogeneous combustion catalyst on the combustion
characteristics and fuel efficiency in a diesel engine. Applied Energy 91 (2012) 166–172.
Zhu, Li X, Wang N, Wang X, Gao J, Li H. Dispersion behavior and thermal conductivity
characteristics of Al2O3 - H2O nanofluids. Current Applied Physics 9 (2009) 131–139.
Zhuiykov S, Ono T, Yamazoe N, Miura N. High-temperature NOx sensors using zirconia solid
electrolyte and zinc-family oxide sensing electrode, Solid State Ionics 152– 153 (2002) 801–
807.

165
List of Publications
Papers published in Journals
1. N. Shanmugapriya, M. Bala Subramaniam, Chandramohan Somayaji, S.
Kanagaraj.Influence of surfactants and synthesis techniques on the dispersion stability of
Nanofuel. Physics and Chemistry of Liquids (accepted with minor revision)
2. N. Shanmugapriya, Chandramohan Somayaji, S. Kanagaraj. Synthesis and
characterization of Nd3+
doped Ce0.6Zr0.4O2 and its doping significance on oxygen
storage capacity. Rare Metals (accepted for publication)
3. N. Shanmugapriya, Chandramohan Somayaji, S. Kanagaraj. Optimization of
Ce0.6Zr0.4-xAl1.3xO2 solid solution based on oxygen storage capacity. Journal of
Nanoparticle research 16 (2014) 21-10.
4. N. Shanmugapriya, Chandramohan Somayaji, S. Kanagaraj. Characterization and
optimization of Ce0.6Zr0.4-xMnxO2 (x≤0.4). Journal of Nanoparticle research 16 (2014)
2660 1-10.
5. N. Shanmugapriya, Chandramohan Somayaji, S. Kanagaraj. Optimization of ceria-
zirconia solid solution based on OSC measurement by cyclic heating process. Journal of
Procedia Engineering 64 (2013) 1235-1241.
6. N. Shanmugapriya, Chandramohan Somayaji, S. Kanagaraj. Oxygen storage capacity of
CexZr1-xO2 (0.4≤x≤0.8) solid solution using thermogravimetric analysis. Advanced
Materials Research 747 (2013) 579-582.
Conference Proceeding
1. N. Shanmugapriya, Chandramohan Somayaji, S. Kanagaraj. Comparative studies on
characteristics of CexZr1-xO2 nanoparticles prepared by sol-gel and co-precipitation
technique. Proceedings of 21st International Symposium on Processing and Fabrication of
Advanced Materials, Edited by P.S. Robi, N. Bhatnagar and T.S. Srivatsan, (2012)
285-290.

List of publications
166
Submitted
1. N. Shanmugapriya, M. Bala Subramaniam, Chandramohan Somayaji and S. Kanagaraj.
Influence of surfactants and preparation methods on the dispersion stability of nanofuel.
Energy, 2014.
Under preparation
1. N. Shanmugapriya, Chandramohan Somayaji and S. Kanagaraj. Performance
enhancement of CZA and CZM dispersed diesel in an IC engine.
2. N. Shanmugapriya, Chandramohan Somayaji and S. Kanagaraj. Influence of ionic radius
of doping element on the oxygen storage capacity studies on Ce0.6Zr0.4O2.
Papers presented in International Conference
1. N. Shanmugapriya, K. Konanki Hareesh Naidu, Chandramohan Somayaji and S.
Kanagaraj. Validation of thermodynamic two-zone combustion model for ceria dispersed
diesel. International Conference on Environment and Energy 25th
-17th
Dec-2014,
Jawaharlal Nehru Technological University, Hyderabad.
2. N. Shanmugapriya, M. Bala Subramaniam, Chandramohan Somayaji and S. Kanagaraj.
Dispersion stability of surfactant coated ceria in nanofuel, 22nd
National and 11th
ISHMT-ASME Heat and Mass Transfer Conference, ISHMT-2013, Indian Institute of
Technology. Kharagpur, India. December 28-31, 2013.
3. N. Shanmugapriya, Chandramohan Somayaji and S. Kanagaraj. Oxygen storage capacity
of nanostructured ceria-zirconia solid solution prepared by sol-gel technique using
Thermogravimetric studies, International conference on Design and Manufacturing,
IConDM-2013, Indian Institute of Information Technology, Design and Manufacturing,
Kancheepuram Chennai. July 18-20, 2013.
4. N. Shanmugapriya, Chandramohan Somayaji and S. Kanagaraj. Oxygen storage capacity
of CexZr1-xO2 (0.4≤x≤0.8) solid solution using Thermogravimetric Analysis, Multi-
functional materials and structures, Bangkok, Thailand, July 14-17, 2013.

List of publications
167
5. N. Shanmugapriya, Swapnita Kakati, Chandramohan Somayaji and S. Kanagaraj.
Performance enhancement of conventional stove using a new class of fuel: Nanofuel.
Rural Technology Action Group North East, Trade Centre, Guwahati, January 23 - 25,
2013.
6. N. Shanmugapriya, Mantuala Basumatary, Saptarshi Mandal, Chandramohan Somayaji
and S. Kanagaraj. Enhanced performance of environmental friendly nanofuel for internal
combustion engine. Rural Technology Action Group North East, Trade Centre,
Guwahati, January 23 - 25, 2013.
7. N. Shanmugapriya, Chandramohan Somayaji and S. Kanagaraj. Comparative studies on
characteristics of CexZr1-xO2 nanoparticles prepared by sol-gel and co-precipitation
technique. Processing and Fabrication of Advanced Materials XXI. Indian Institute of
Technology Guwahati, India, December 10-13, 2012.
8. N. Shanmugapriya, M. Petchimmal, Chandramohan Somayaji and S. Kanagaraj,
Synthesis of ultrafine Ce0.4Zr0.6O2.xAl2O3 nanostructure using controlled flow rate of
precursor. 4th
International conference on Advanced nanomaterials. Indian Institute of
Technology Madras, Chennai, October 17-19, 2012.

168
Annexure-I
Molar ratio calculation
Requirement of 5 grams of Ce0.6Zr0.4O2
0.6Ce(NO3)3.6H2O+0.4ZrO(NO3)3.H2O+3 C6H8O7 → Ce0.6Zr0.4O2+3NO2+16H2O+18CO2
One mole of Ce0.6Zr0.4O2 = 152.4 grams
5 grams of Ce0.6Zr0.4O2 = 0.032809 mole
The required amount of Ce(NO3)3.6H2O
= 0.6*molecular weight of Ce(NO3)3.6H2O * mole of 5 grams of Ce0.6Zr0.4O2
= 0.6*434.22*0.0332809
= 8.5478 grams
The required amount of ZrO(NO3)3.H2O
= 0.4*molecular weight of ZrO(NO3)3.H2O * mole of 5 grams of Ce0.6Zr0.4O2
= 0.4*231*0. 0332809=3.03155 grams
The required amount of C6H8O7
= 3*molecular weight of C6H8O7 * mole of 5 grams of Ce0.6Zr0.4O2
= 3*320*0.033280
= 31.49664 grams