Embed Size (px)
Citation preview

,
I ••
\
TECHNICAL REPORT STANDARD TITLE PAGE
1. Report No. 2. Government ACCI!'5sion No. 3. Recipient' 5 Catalog No.
FHWA/TX-8l/l4+208-3F
4. Tille and Subtitle S. Report Date
DESIGN OF POST-TENSIONED GIRDER ANCHORAGE ZONES June 1981 6. Performing Orgoni lotion Code
7. Autnor / 51 B. Performing Organizotion Report No.
W. C. Stone and J. E. Breen Research Report 208-3F
9. Performing Organi lalion Nome and Address 10. Work Unit No.
Center for Transportation Research The University of Texas at Austin 11. ContrQct or Grant No.
Research Study 3-5-77-208 Austin, Texas 78712 13. Type of Report and Period Covered
12. Sponsoring Agency Name ond Addre ..
Texas State Department of Highways and Public Final Transportation; Transportation Planning Division
P. O. Box 5051 14. Sponsoflng Agency Code
Austin, Texas 78763 15. Supplementary Notes
Study conducted in cooperation with the U. S. Department of Transportation, Federal Highway Administration. Research Study Title: "Influence of Casting Position and of Shear on the Strength of Lapped Splices"
16. Abstract
Several large thin-webbed box girders, with post-tensioned anchorage zones designed in accordance with AASHTO and ACI requirements, have experienced large cracks along the tendon path in the anchorage zones at the design stressing load. Cracking of this nature provides a path for penetration of moisture and salts and thus presents a potential corrosion and frost damage threat. In addition, such cracking negates a major reason for the use of prestressed concrete, the minimiza-tion of service load cracking.
This report summarizes the major design-related observations and conclusions from an extensive analytical and experimental program which studied anchorage zone behavior of post-tensioned box girders. The experimental program investigated the
rimar variables affectin the formation of the tendon p y g p ath crack: tendon inc lin-ation and eccentricity, section height and width, tensile splitting strength of the concrete, anchor width and geometry, and the effect of supplementary anchorage zone reinforcement, both active and passive. An extensive series of three-dimensional linear elastic finite element computer analyses was used to generalize these results and develop a failure theory to explain tendon path crack initiation based
1
I
I I
I I I ,
!
I I I
I
I
i i
I,
[
, I
upon specified peak spalling strains at the edge of the anchorage. The theory I
agreed well with the experimental data over a wide spectrum of variables. i
17. Key Word.
box-girders, thin-webbed, anchorage zones, post-tensioned, cracks, tendon path, reinforcing
lB. Diltribution Statement
No restrictions. This document is available to the public through the National Technical Information Service, Springfield, Virginia 22161.
19. Security Cla .. iI. (of this report) 20. Security Clouif. (of this page) 21. No. af Pages 22. Price
Unclassified Unclassified 158
Form DOT F 1700.7 (8-69)
I

..
DESIGN OF POST-TENSIONED GIRDER
ANCHORAGE ZONES
by
W. C Stone and J. E. Breen
Research Report No. 208-3F
Research Project No. 3-5-77-208
"Design Criteria for Post-Tensioned Anchorage Zone Bursting Stresses"
Conducted for
Texas Department of Highways and Public Transportation
In Cooperation with the U.S. Department of Transportation Federal Highway Administration
by
CENTER FOR TRANSPORTATION RESEARCH BUREAU OF ENGINEERING RESEARCH
THE UNIVERSITY OF TEXAS AT AUSTIN
June 1981

The contents of this report reflect the views of the authors, who are responsible for the facts and the accuracy of the data presented herein. The contents do not necessarily reflect the official views or policies of the Federal Highway Administration. This report does not constitute a standard, specification, or regulation.
There was no invention or discovery conceived or first actually reduced to practice in the course of or under this contract, including any art, method, process, machine, manufacture, design or composition of matter, or any new and useful improvement thereof, or any variety of plant which is or may be patentable under the patent laws of the United States of America or any foreign country.
ii
. .

•
PRE F ACE
This is the final report in a series which summarizes the
detailed investigation of the effects and control of tensile
stresses in the anchorage zones of post-tensioned girders. The first
report in the series sumnmrizes the state-of-the-art and presents a
three-dimensional finite element analysis procedure which is of great
use in understanding the development of these tensile stresses. The
second report in this series summarizes an extensive series of model
and full-scale physical tests which were performed to document the
problem and further explore the effect of variables. This third and
final report in the series draws on the analytical and experimental
results presented in the first two reports. It uses these results
to develop design procedures and suggested AASHTO specification pro
visions to control the problem. This report also contains several
examples to illustrate the application of the design criteria and
procedures.
This work is a part of Research Project 3-5-77-208, entitled
"Design Criteria for Post-Tensioned Anchorage Zone Bursting Stresses."
The studies described were conducted at the Phil M. Ferguson Struc
tural Engineering Laboratory as a part of the overall research pro
gram of the Center for Transportation Research, Bureau of Engineer
ing Research of the University of Texas at Austin. The work was
sponsored jOintly by the Texas Department of Highways and Public
Transportation and the Federal Highway Administration under an agree
ment with The University of Texas at Austin and the Texas Department
of Highways and Public Transportation.
Liaison with the Texas Department of Highways and Public
Transportation was maintained through the contact representative Mr.
Alan Matejowsky, the Area IV committee chairman Mr. Robert L. Reed and
iii
the State Bridge Engineer, Mr. Wayne Henneberger; Mr. F~ndy Losch was
the contact representative for the Federal Highway Administration.
Special thanks are due to Dr. E. B. Becker and Dr. C. P. Johnson of
The University of Texas at Austin, who gave a great deal of assistance
and encouragement in developing the program PUZGAP-3D used in the
analytical phase. Special thanks are also extended to Messrs.
Wanderlan Paes-Filho and John Sladek, Assistant Research Engineers,
at the Phil M. Ferguson Structural Engineering Laboratory, who made
major contributions to the design, fabrication and testing of the
specimens.
The overall study was directed by Dr. John E. Breen, The J. J.
McKetta Professor of Engineering. The detailed analysis was carried
out under the immediate supervision of Dr. William C. Stone, Research
Engineer, Center for Transportation Research.
iv

SUMMARY
Several large thin-webbed box girders, with post-tensioned
anchorage zones designed in accordance with AASHTO and ACI require
ments, have experienced large cracks along the tendon path in the
anchorage zones at the design stressing load. Cracking of this nature
provides a path for penetration of moisture and salts and thus pre
sents a potential corrosion and frost damage threat. In addition,
such cracking negates a major reason for the use of prestressed con
crete, the minimization of service load cracking.
This report summarizes the major design-related observations
and conclusions from an extensive analytical and experimental pro
gram which studied anchorage zone behavior of post-tensioned box
girders. The experimental program investigated the primary variables
affecting the formation of the tendon path crack: tendon inclinationn
and eccentricity, section height and width, tensile splitting strength
of the concrete, anchor width and geometry, and the effect of sup
plementary anchorage zone reinforcement, both active and passive. An
extensive series of three-dimensional linear elastic finite element
computer analyses was used to generalize these results and develop a
failure theory to explain tendon path crack initiation based upon
specified peak spalling strains at the edge of the anchorage. The
theory agreed well with the experimental data over a wide spectrum of
variables.
Experimental data from the prototype tests revealed an
interesting additional failure mechanism due to "multistrand" effects.
Sections with significant curvature in the tendon profile and with
multiple strands in the same duct generated large lateral splitting
forces at the point of minimum radius of curvature due to the flat
tening out of these multiple strands in the tendon within the con
fines of the duct. A method of designing reinforcement to resist this
effect was presented.
v

A new design procedure is suggested for control of tendon
path cracking and suggested code provisions are furnished. Emphasis
is pmced on methods of designing the section to remain uncracked at
the maximum temporary post-tensioning load. Various reinforcing
schemes for the anchorage zone proper (both active and passive) were
investigated and a general reinforcement design procedure was
developed. The concept of limit state design of the anchorage zone
is discussed and load factors are developed with respect to cracking
and ultimate load.
vi

IMP L E MEN TAT ION
This report summarizes the most important findings of an
extensive experinlental and analytical investigation of tension
stresses in the anchorage zones of thin post-tensioned concrete
structures. Specific suggestions for AASHTO Specification changes
are presented along with a general design methodology for eliminating
or controlling the occurrence of this cracking.
The study shows that current AASHTO provisions are
ineffective, misleading, and incomplete. Adoption of the suggested
specifications and design criteria and procedures will lessen the
owner or designer reliance on the supplier of the anchorage system
to provide correct anchorage zone hardware and details of supple
mentary reinforcement. The designer or constructor is given a pro
cedure to more realistically evaluate the acceptability of a proposed
anchorage system. The present AASHTO specification places great
reliance on the anchorage supplier and creates substantial conflict
of interest and division of responsibility in case of subsequent
problems due to the detailing provisions.
Comparative study of various details indicate that use of
spirals or transverse prestressing can greatly improve anchorage
behavior and capacity. Substantial economies can result from the
relaxation of some present requirements which are shown to be grossly
conservative, while improved performance will result if cracking is
eliminated or minimized by use of the improved detailing provisions
suggested.
vii

..

Chapter
1
2
3
TAB L E o F CON TEN T S
INTRODUCTION . . . . . . . . . . . . . .
1.1 1.2
1.3
Problems in Thin Web Post-Tensioned Structures The Anchorage Zone Stress State . . 1.21 The Nature of Anchorage Zone Overview of the Project 1.3.1 Objectives ........ .
Stresses
ANCHORAGE ZONE BEHAVIOR DESIGN IMPLICATIONS
2.1
2.3
Introduction . . " ..... . 2.1.1 General .... . .... . 2.1.2 Methods of Comparing Test Results 2.2.2 The Bearing Stress Role 2.2.3 The Bursting Stress Role .. 2.2.4 Spalling Stress Role •... 2.2.5 Anchorage Failure Mechanism 2.2.6 Prediction of First Cracking Based on
Analytical Studies . . . . 2.2.7 Multistrand Side Face Failure Mechanism Major Effects of Variables . . . . 2.3.1 Cover and Thickness Effects 2.3.2 2.3.3 2.3.4 2.3.5
2.3.6
Inclination Effects Bearing Area Effects . . . . Eccentricity Effects . . . . Passive Reinforcement Effects--
Spirals, Orthogonal Grids Active Reinforcement Effects
DESIGN CRITERIA AND PROCEDURES
3.1 Introduction ..... . 3.2 Cracking Load Production
3.2.1 Limitations 3.2.2 Effect of Supplementary Reinforcement
3.3 Ultimate Strength Prediction .... . 3.4 Limit State Design .... .
3.4.1 Limit State Design for Cracking 3.4.2 Limit State Design for Ultimate 3.4.3 Application of Limit State Philosophy
3.5 Design Criteria ...... . 3.5.1 Crack Free Design 3.5.2 Acceptable Crack Design
ix
Page
1
1 3 3
l3 13
17
17 17 18 18 24 33 33
38 42 45 45 50 50 58
58 72
77
77 77 85 87 88 89 91 91 92 93 94 94

Chapter
4
Page
3.5.3 Design of Supplemental Reinforcement.... 96 3.5.4 Anchor Bearing Area ........ .105
3.6 Suggested Code or Specification Requirements 106 3.6. 1 Code Provis ions . . . . . . 106 3.6.2 Commentary . . . . . . . . 108
3.7 Illustrations of Design Procedure 115 3.7.1 Example 1 115 3.7.2 Example 2 124 3.7.3 Example 3 126
3.8 Summary 132
CONCLUSIONS AND RECOMMENDATIONS
4.1 4.2 4.3 4.4 4.5 4.6
General Major Conclusions . . . . Reinforcement Conclusions Similitude Conclusions . . Analytical Study Conclusions Recommendations for Further Research
133
133 135 138 140 141 141
BIBLIOGRAPHY . . . . . . . . . . . . . . . . . 143
x

Figure
1.1
1.2
1.3
1.4
1.5
1.6
LIS T o F FIG U RES
Resident engineer pointing to tendon path crack
Transverse stresses in a rectangular block loaded by a plate . . . . . . . . . . . . . . ...
Equilibrium considerations within the lead-in zone
Bursting stresses in semi-infinite body for various loaded areas.. • • • • • • . . . . . . ....
Bursting stresses for various loaded areas (Guyon) • • . . . . . . . . . . . .
Maximum bursting stress and tensile force • • • . . . . . . .
1.7a Combination of end zone, radial and inclined wedge effects
1.7b Forces due to tendon curvature
1.8 MOdels of typical anchors used in post-tensioned construction . . . . . . . . •
2.1
2.2
2.3
2.4
2.5
2.6
2.7
2.8
2.9
2.10
2.11
2.12
2.13
2.14
Failure sequence--plate anchors
Failure sequence for plate anchors
Peak bursting stress as a function of section thickness
Experimental bursting strain distribution--eccentricity series . . . . . . ..... .
Experimental bursting strain distribution--inclination series . . . .
Spalling initiated shear failure theory
Radial and friction forces due to tendon curvature
Multistrand failure in a curved tendon .
Failure due to multistrand effect in specimen FS3B
Cover effects
Thickness effects
Inclination effects
Bearing area effects
Eccentricity effects
xi
Page
2
4
6
7
7
9
11
11
12
20
23
28
30
31
35
43
46
47
49
51
53
57
60

Figure
2.16 Normalized ultimate loads . . . . .
2.17 Anchorage zone reinforcement design as per Guyon. • • . . . . . . . . . .
2.18 Lateral post-tensioning details
3.1 Geometric data for Eqs. 3.1 and 3.2 •
3.2 Special cases for Eq. 3.2 •••
3.3 Passive reinforcement design
3.4 Spiral confinement for multistrand loading
3.5 Example 1 cross section and tendon profile
3.6 Lateral post-tensioning details
3.7 Sizing spiral diameter
3.8 Data for design of spiral reinforcement to resist multistrand cracking . . . . .. . ...
3.9 Overall mesh pattern--inclined tendon prototype specimen
3.10 Rezone mesh detail
3.11 Bottom mesh detail
3.12 Duct mesh detail
3.12 Top mesh detail.
xii
Page
71
72
73
80
86
87
101
116
120
120
123
127
128
129
130
131

Table
2.1
2.2
2.3
2.4
2.5
2.6
LIS T o F TABLES
3D-FEM summary . . .
3D-FEM peak spalling strain at first cracking
Cover effects
Inclination effects
Bearing area effects
Eccentricity effects
2.7 Reinforcement efficiency summary--inclined tendon tests
2.8 Reinforcement efficiency summary--straight tendons wi th spiral reinforcement . . . . . . . . . . . .
2.9 Reinforcement efficiency summary--straight tendons with orthogonal reinforcement
2.10 Recommended design values
3.1 Regression analysis data
3.2 Regression analysis results--comparison of predicted and actual cracking loads
3.3 External check of Equation 3.2 ..... .
xiii
Page
25
40
48
52
54
57
62
63
65
66
79
82
83

C HAP T E R 1
INTRODUCTION
1.1 Problems in Thin Web Post-Tensioned Structures
Current trends in bridge construction show increased
utilization of precast and prestressed concrete.
A number of problems have occurred in post-tensioned
applications in both the bridge and the building field which indi
cate that the design procedures and design criteria for post
tensioned anchorage zone tensile stresses need further examination
and refinement [1]. Substantial cracking along the tendon path has
been experienced in a precast segmental bridge in Texas [3] (see
Fig. 1.1) and in a cast-in-place box girder bridge reported by
Dilger and Ghali [4]. In both of these bridges the cable profiles
had significant curvature, inclination, and eccentricity in and near
the anchorage zones. In the case of the Texas bridge, there was some
concern over the possible effects of the anchorage hardware geometry.
Similar cracking was reported in construction of the Olympic Stadium
in Montreal and in post-tensioned slab structures and other thin web
applications. Significant anchorage zone cracking was experienced
in preliminary tests for a major lightweight concrete bridge in
California which indicated lightweight concrete may be even more
vulnerable.
The cracking which occurred in these anchorage regions was
controlled by auxiliary reinforcement and the member strength was not
appreciably reduced. However harmless these cracks may appear, they
provide a path for penetration of moisture and salts and thus present
potential corrosion and frost damage threats. The formation of these
1

r
2
Fig. 1.1 Resident engineer pointing to tendon path crack

cracks negates one of the major factors leading to the choice of
prestressed concrete, the minimization of service load cracking.
Major and contradictory changes have taken place in the
AASHTO, ACI, and pel design specifications for anchorage zones in
recent years, based more on the results of field experience and pro
prietary data than on published analyses or test procedures. Cur
rent design recommendations [4,5], while vague, seem both conserva
tive and workable for many applications where massive end blocks
with large cover can be used with relatively straight or gently
curving tendons in cast-in-place post-tensioned construction. How
ever, they do not give sufficient guidance for the wide range of
thin web post-tensioned applications currently in use today, or the
many new applications being suggested as the industry develops.
Thus, this study of the development and control of critical anchor-
age zone tensile stresses was undertaken. Its goal was to provide
3
more specific guidance to bridge design and construction personnel
regarding the behavior of anchorage systems so that they could bet
ter assess the performance of a post-tensioning system without having
to rely wholly on the recommendations of the hardware supplier.
1.2 The Anchorage Zone Stress State
1.2.1 The Nature of Anchorage Zone Stresses. Application of
linear, elastic theory shows that if a concentrated load is applied
through a bearing plate across the width of a finite rectangular
block, compressive and tensile stresses are set up, as shown in Fig.
1.2. Two important tension fields are shown in this figure: those
acting along the line of the load, and those acting on or near the
end face at points removed from the load. The two tensile stress
zones are generally called:
(1) Bursting Stress--located along the line of loading, normal to it, and away from the point of loading.
(2) Spalling Stress--located along the loading surface, parallel to it and away from the point of loading.

4
TRANSVERSE AXIS
~I·------b--------~"I
P SFALUNG STRESS G..
~OMPRESSION I TENS!2!\.
~--b/4----Ioo-I:1 ~-------------b/2--------------~·
+ =.. ,. TENSION = ...... COMPRESSION
Fig. 1.2 Transverse stresses in a rectangular block loaded by a plate

5
In dealing with a specific post-tensioned anchorage, the load must be
applied over a finite area. The compressive stress immediately under
the anchor is called:
(3) Bearing Stress--The load divided by the net bearing area.
An extensive literature study presented in Ref. 1 shows that the
precise role that each of these three stresses plays in the behavior
of the anchorage zone has not been fully understood. No method has
been proposed to predict the cracking loads. Little information is
available on efficiency of reinforcement for controlling cracking
caused by these tensile stresses.
1.2.1.1 Bursting Stress. Distress in the anchorage zone is
signalled by the sudden formation of a crack along the line of the
load. The load at which this occurs depends not only on the size of
the loaded area in relation to the geometry of the loaded surface
but additionally on the geometry of the surface itself, i.e., the
eccentricity, inclination, and curvature of the tendon. In addition,
the shape of the anchorage device as well as the action of supple
mental reinforcement affect the load at which crack formation occurs.
St. Venant1s principle applied to a member subjected to a
concentrated load P as in Fig. 1.3(a) states that a section at a dis
tance approximately equal to the depth of the section from the applied
load should exhibit an essentially uniform normal stress distribution.
The longitudinal stress distribution within the zone ABeD is not
uniform and cannot be analyzed by the usual laws of strength of
materials. In fact, the distribution of stresses on Section EE' is
completely discontinuous, with very high stresses at points near the
applied load P and practically zero stress at all other points. This
zone of disturbance is called the lead-in zone. Fig. 1.5(b) is a
free body of the upper part of the lead-in zone. Equilibrium of
horizontal forces requires the shear stress T. Transverse stresses
f are required for equilibrium of moments about M. Finally, the x
vertical equilibrium of forces requires the transverse stress

6
p -
(0)
X ..... LEAD-IN ZONE
A IE B
I ~
. _. +._._.---=-.-~ h
i ! I f/ I z
'E' C
I h -----..1.1
( b)
f x = BURSTING STRESS DlSTRIBl!fION
LFx=O : LfX9 + LfX~=O
.oj 7
Fig. 1.3 Equilibrium considerations within the lead-in zone
z

o N
"'a.. "'
7
,2 p. Q "11= 100 kip.
4 f------+---+-
5L ____ ~ ___ ~ ___ ~ __ ~ ____ ~ __ ~ ____ L_ __ .~ ____ L_ __ ~
20 16 12 a 4 0 4 8 12 16 20
COMPRESSION (lIsi) TENSION (ksil
Fig. 1. 4 Burst s tresses in semi- infinite body for various loaded areas (from Ref. 7)
2 a' "----
I 0.6 fx (TENSION)
0.4
z 2a
,-+-x 0.2 ! -..... .
o 1.50
Fig. 1.5 Bursting stresses for various loaded areas (Guyon) (from Ref. 7)
- y 20

8
distribution resultant to be equal to zero. Therefore, tensile and
compressive transverse stresses must occur within the lead-in zone.
However, these equilibrium considerations are not sufficient for the
determination of the transverse stress distribution. Various ana
lytical approaches to the solution of the stress distribution in the
anchorage zone were discussed in detail in the first report in this
series [1].
In actual anchorage practice, the load acts over a finite
area with a reasonably large radius. For this case the classical
elasticity analysis indicates that the stresses are relatively small.
These stresses are plotted for a constant load P in Fig. 1.4 for
various values of a'/a, where 2a denotes the section breadth and 2a'
denotes the anchor breadth. Standard design practice in many coun
tries has been to provide massive reinforcement for the total
resultant tensile force obtained by integrating the area under curves
such as those shown in Figs. 1.5 and 1.6. Experience gained from
anchorage zone cracking problems with the Texas bridge at Corpus
Christi [3], in which the anchorage zones were reinforced based on a
similar set of experimentally derived bursting curves [8] indicated
that design based solely upon such consideration of bursting
stresses may be unconservative.
1.2.1.2 Spalling Stress. The spalling tensile stresses are
maximum at the loaded surface and decrease rapidly away from the
surface (see Fig. 1.2). The total spalling tensile force is thus
relatively small. In contrast to the attention paid to bursting
stresses, the spalling stresses have sometimes been neglected or
dismissed because they are so localized. However, the peak spalling
stress can be very high, indeed much higher in almost every practical
anchorage application examined by the authors than the bursting
stresses. This takes on great Significance since in the currently
reported experimental program cracking occurred along the tendon
path with calculated bursting stresses far below the tensile

0.8
0.6 .., "-><
- 0.4
0.2
°O~~~--L--L-~--~~~----~ 0.2 0.4 0.6 0.8
0,/0
P 1 ZIELINSKI ROWE (EXPERIMENTAL) 2 BLEICH SIEVERS -L
.-----'--, - ~ 3 BLEICH 20' 4 MAGNEL 5 MAGNEL MODIFIED 6 GUYON 7 SARGIOUS (BY WRITER) 8 MORSCH
OAt 0.3
a.. ........ >-
02.
01~
a = HALF' -WIDTH OF BLOCK o' = HALF -WIDTH OF ANCHORAGE fx = MAXIMUM TRANSVERSE BURSTING STRESS
.~c= AVERAGE STRESS (P/2o\
T = BURSTING TENSilE FORCE 7 2 P = PRESTRESSING FORCE
'" " , ....... 4 3.::::::-........... ........
6 .......... ' .......... -8",~~",""""'~ --_ y -~~
'""",-
O------~--~L-----!~--~--~ o 0.2 0.4 0.6 0.8 0'/0
Fig. 1. 6 Maximum hursting stress and tensile force (from Ref. 7)
9

10
strength of the concrete. Like bursting stresses, the spalling
stress distribution is greatly affected by the geometric variables
such as eccentricity, inclination, and proportions of the section.
Most of the previous research on post-tensioned anchorage zones has
been limited to analysis for straight tendons and has been interpreted
in the context of the role of the bursting stresses. The advent of
comprehensive finite element programs in the last decade allowed
more realistic modeling for specimens with complex geometries. The
results of these analyses reported in Refs. 1 and 2 indicate a key
role of spalling stresses in crack formation.
1.2.1.3 Bearing Stress. The maximum compressive stress
developed by a post-tensioning system occurs beneath the anchor. In
the case of a flat plate, or bearing-type anchor, the average bearing
stress is equal to the post-tensioning load divided by the net area
of the anchor defined as the projected plate area minus the tendon
duct area. Current design specifications in the United States, while
specifying the need to examine bursting and spalling stresses, usu
ally phrase their strictest recommendations in terms of allowable
bearing stress. Most European specifications permit significantly
higher allowable bearing stresses in post-tensioned design [9].
Whether this apparent over-conservatism in the American codes is
justified has been a question much pondered but under-researched.
1.2.1.4 Additional Considerations. In addition to the
geometric effects such as inclination, eccentricity, width, and
bearing area, the effects of friction and normal forces along the
tendon duct for curved tendons (see Fig. 1.7), the effect of anchor
hardware geometry (see Fig. 1.8) and other externally applied loads
such as lateral post-tensioning must all be considered to fully
grasp the anchorage zone stress state.

.,
END ZOf£ BURSTING STRESSES
RADIAL FORCES DUE TO TENDON CURVATURE
INCLINED WEDGE EFFECT
Fig. 1.7a Combination of end zone, radial, and inclined wedge effects
~---"""I-
,/' J -
TENDON CONCRETE
Fig. 1.7b Forces due to tendon curvature >-' >-'

- on
ft._ I .• _t .. f ,,,.Lul '"t'lO _ t. _.-.... 1 __ .,.,...1 .. •
'.

,-
13
1.3 Overview of the Project
1.3.1 Objectives. The overall research program was broken
into six interactive phases which constitute its specific objectives.
These were:
(1) To document the state-of-the-art based on an extensive literature study of all analytical, experimental, and design-related papers and reports concerning anchorage zone stresses for post-tensioned applications.
The results of this survey were presented in detail in the first
report [1].
(2) To survey the wide range of post-tensioning anchorage systems currently available in the United States and to make a classification according to general anchorage principles, sizes, and shapes.
Figure 1.8 shows the three distinct types of anchorages in use.
These are the bearing or plate-type anchor, the cone or wedge anchor,
and a "bell" shaped anchor. There are also three basic schemes used
in making up the tendon. These use either 250 or 270 ksi 7 wire
strand tendons where the load is locked off using conical chucks,
240 ksi wire where the load is locked off by "button-heading" the
ends of the wire, or 160-170 ksi bars, smooth or deformed. The
latter uses a heavy duty nut which conveniently screws down once the
post-tensioning load has been applied. Bar type tendons cannot be
used where a sharp curvature is required and wire type tendons usu
ally require specialized anchorage procedures in the field. For
these reasons the 7 wire strand tendons have been widely used in post
tensioned applications. While theoretically the anchorage zone cannot
detect whether it is being loaded by strand, wire, or bar, the overall
performance of anchorage in regions where significant curvature of
the tendon is required has shown that cracking can occur at locations
well removed from the immediate anchoLage area [2]. This effect
occurs primarily for multiple strand tendons, but can occur for
single strand tendons as well, and is discussed in this report.

14
(3) To survey present and projected tendon path and anchorage zone characteristics in post-tensioned bridge applications.
A detailed examination of available bridge plans for several segmental
projects both in the United States and Europe was reported on in
Ref. 1. In many cases tendons are curved, inclined at anchors, and
have significant eccentricity. These characteristics and their
effects on the anchorage zone are illustrated in Fig. 1.7. There is
a current trend to anchor out of the web for speed of construction.
This technique uses side "blisters" in the interior of the box section
to anchor the tendon. Aside from moving the anchorage away from the
congestion at the end of the web section, this method often does not
eliminate the above factors and in fact may give rise to an addi
tional out-of-plane curvature effect.
(4) To study systematically by both analytical and experimental procedures, the development of critical tensile stresses in the anchorage zone for typical applications using representative anchorage systems.
In essence this was the core of the project. In this phase the
principal variables, inclination, cover (width), eccentricity, bear
ing areas, and anchorage type were examined using both accurate 1/4-
scale models and full-scale prototype specimens in the laboratory,
as reported in the second report of this series [2]. A parallel
effort was initiated to predict stress distributions in the physical
specimens through the use of two- or three-dimensional static, linear
elastic finite element programs. As primary emphasis was placed on
developing a behavioral mode for first cracking, the linear elastic
assumption proved to be sufficiently accurate. The development and
calibration of the analytical programs are detailed in the first
report of this series [1].
"'
(5) To evaluate the efficiency of various active and passive reinforcement in anchorage zones, including spirals, conventional reinforcing bars, and lateral prestressing.
15
This objective was an outgrowth of the experimental program but dealt
with crack control rather than the behavioral mechanism by which the
crack was initiated. If the cracking load could be altered and the
ultimate load enhanced by the addition of reinforcement, then major
design interest focuses on the most efficient scheme for placement of
this reinforcement. Placement was the primary question concerning
passive reinforcement. With lateral prestressing, or active rein
forcement, a powerful new option was opened. This was due to the fact
that the stress field in the anchorage zone could be significantly
altered by the addition of a transverse compressive force. Experi
mental results were reported in the previous report of this series
[2]. Detailed design recommendations are given herein.
(6) To develop recommendations for specific design criteria for post-tensioned anchorage zone tensile stresses.
Based upon experimental and analytic data these recommendations can
be broken down into two categories:
(a) If the structure is to be located in a highly corrosive
environment where not even minor cracking can be tolerated, what is
the maximum permissib12 stressing load, given the geometry of the
anchorage zone?
(b) Given rigid geometric conditions and required load, what
is an "acceptable" crack and how can this be controlled through an
active or passive reinforcing scheme?
In either case the structure must be capable of performing satisfac
torily under service load conditions and with an adequate factor of
safety under failure conditions. The design recommendations and
examples based on this investigation are contained in this report.

..,

C HAP T E R 2
ANCHORAGE ZONE BEHAVIOR DESIGN IMPLICATIONS
2.1 Introduction
2.1.1 General. In the preceding report in this series [2],
detailed experimental data and photos were presented for both model
and prototype specimens. Comparisons were provided between the
analytical model [1] and the physical tests, and similitude rela
tionships between model and prototype were developed. In this
chapter, the overall trends obtained experimentally will be sum
marized, trends will be extrapolated using the analytical program
PUZGAP and design implications will be indicated.
An extensive comparison was made of experimental data and the
finite element analysis results. A semi-empirical calibration pro
cedure provided a method by which the cracking load could be pre
dicted with reasonable accuracy from the results of an analytical
analysis using the three-dimensional finite element program (PUZGAP).
The development of this semi-empirical method is presented in Sec.
2.2, while the actual calculations are illustrated in Sec. 2.3. Using
these procedures, cracking loads for the major geometric variables
were calculated and compared to the experimental results in Secs. 2.4
through 2.7. The solid line on each figure in those sections repre
sents the finite element predicted cracking load. Analytical
results were extrapolated to include regions beyond the range of the
experimental data to establish design trends. Sections 2.4 through
2.7 present the observed normalized load trends causing initiation
of the tendon path cracks for the major geometric variables: cover,
inclination, bearing area, and eccentricity.
17

18
Since the test specimens used to explore those effects
contained no supplementary anchorage zone reinforcement, ultimate
loads for most cases occurred at loads only nominally above the
load to cause cracking. Thus, no ultimate load conclusions should
be drawn from these tests. Since both the cracking and ultimate
load can be raised significantly through the use of supplementary
anchorage zone reinforcement, the effects of such reinforcement are
dealt with in Sec. 2.8. Major emphasis is placed on the development
of simplified multipliers which can be applied to the cracking load
of the specimen without supplementary reinforcement to predict the
expected cracking and ultimate loads for the same section with sup
plemental reinforcement. To complete the generalization, the crack
ing trends presented in Secs. 2.4 through 2.7 (for unreinforced sec
tions) are reduced in Chapter 3 to a design expression through a
regression analysis of the experimental data.
2.1.2 Methods of Comparing Test Results. The cracking
behavior of the anchorage zone is very much a function of the tensile
capacity of the concrete. Two measures of this capacity are the
indirect tensile strength as measured by the split cylinder test and
the computed tensile strength based on measured compressive strength,
which is usually expressed as X~. Since the split cylinder c
strength proved to be the most accurate normalizer when comparing
model and prototype performance, it will be used in developing the
mathematical model and for comparison with test results. On the other
hand, for design applications and regulations most practicing engineers
would rather deal with a function of the compressive strength, since
this is the general control specimen used. There is a large amount of
data relating f' and f so that a suitable conversion factDr can be c sp
derived. This will be presented in Chapter 3.

2.2 General Concepts of Thin Web Anchorage Zone Failure
19
2.2.1 Anchorage Zone Failure. In spite of the many variables
investigated in the experimental program reported in detail in Ref. 2,
the post-tensioned anchors in thin web girders tended to exhibit a
generally consistent behavior in sequence of failure. The actual loads
at which various stages were reached were affected by variables such as
inclination, eccentricity, and supplementary reinforcement but the
sequence was generally the same.
The failure sequence for a plate anchor specimen with no
supplementary reinforcement is shown in photographs in Fig. 2.1 and
summarized in Fig. 2.2. The basic stages are:
(a) Initial cracking along the tendon path, beginning at a distance about the bearing plate width in front of the anchor
(b) With increased load, the crack extends both towards the loaded face and away from it
(c) Formation of diagonal cracks on the end face, emanating from the four corners of the bearing plate
(d) Propagation of the diagonal cracks on the side faces
(e) A generally sudden explosive-type failure, with complete destruction of the side face and a noticeable formation of a cone of crushed concrete ahead of the anchor.
In specimens with no supplementary reinforcement, stages (d)
and (e) are often almost simultaneous. The main effect of the sup
plementary anchorage zone reinforcement is to raise the initial
cracking loads and to provide a significant amount of reserve strength
between cracking and ultimate.
2.2.2 The Bearing Stress Role. As documented in the tests
reported in Ref. 2, the cracking load is fairly insensitive to
appreciable changes in the bearing area. The two full-scale tests,
FSIA and FS1B, had identical cracking loads and had differences in
normalized cracking loads of only 12 percent, despite a 73 percent
difference in anchorage bearing area. Furthermore, these tests were

,I" o
~) Tendon path crack
Fig. 2.1 Failure sequence--plate and10rs
,

(c) Diagona 1 cracks propaga te
Fig. 2.1 (Continued)
(d) Ultimate failure
IV t-'

22
(e) Cone of crushed concrete
Fig. 2.1 (Continued)

END FACE VIEW
PROPAGATES l..t.JDER INCREASED LDAD
( a ) FIRST CRACKf\JG
UPPER DIAGONAL CRACK
P --- TENDON PATH CRACK
P> PeR
P ULT
'LOWER DlAGONAL CRACK
( b) DIAGONAL CRACK FORMATION (SICE FACE VEW)
EXPLOSIVE SI)E FACE FAILURE
(e) ULTIMATE
Fig. 2.2 Failure sequence for plate anchors
23

24
conducted on straight tendon, concentrically loaded specimens.
Cracking loads for inclined and eccentric tendons with no supple
mentary anchorage reinforcement are substantially less than those
for a straight concentric tendon, given identical anchors. While
bearing stress should be a factor in a design equation, results indi-, cate it should be a minor one. The factor 2a/t, which indirectly
reflects cover as a function of the anchor width (2a') and the web
thickness (t) is considerably more important than the factor (2a'/t)2
which reflects the bearing area. Present specifications which base
anchorage design principally on bearing stress are not only over
conservative for straight tendon, concentric load applications, but
inapplicable and generally unconservative for inclined and eccentric
tendon situations. A more accurate general indicator of cracking
trends is thus needed.
2.2.3 The Bursting Stress Role. Since most previous research
[1] focused on a bursting stress design criterion it is important to
have a clear understanding of the bursting stress variation for all
geometric variables studied. One measure of this is the peak tensile
bursting stress developed for a given load. As the analytically com
puted bursting and spalli~ stresses (strains) were in general agree
ment with the physical test strainmeter data it will simplify com
parisons to use the 3D FEM analytical solution results. Reference
will be made to specific measured data where important trends were
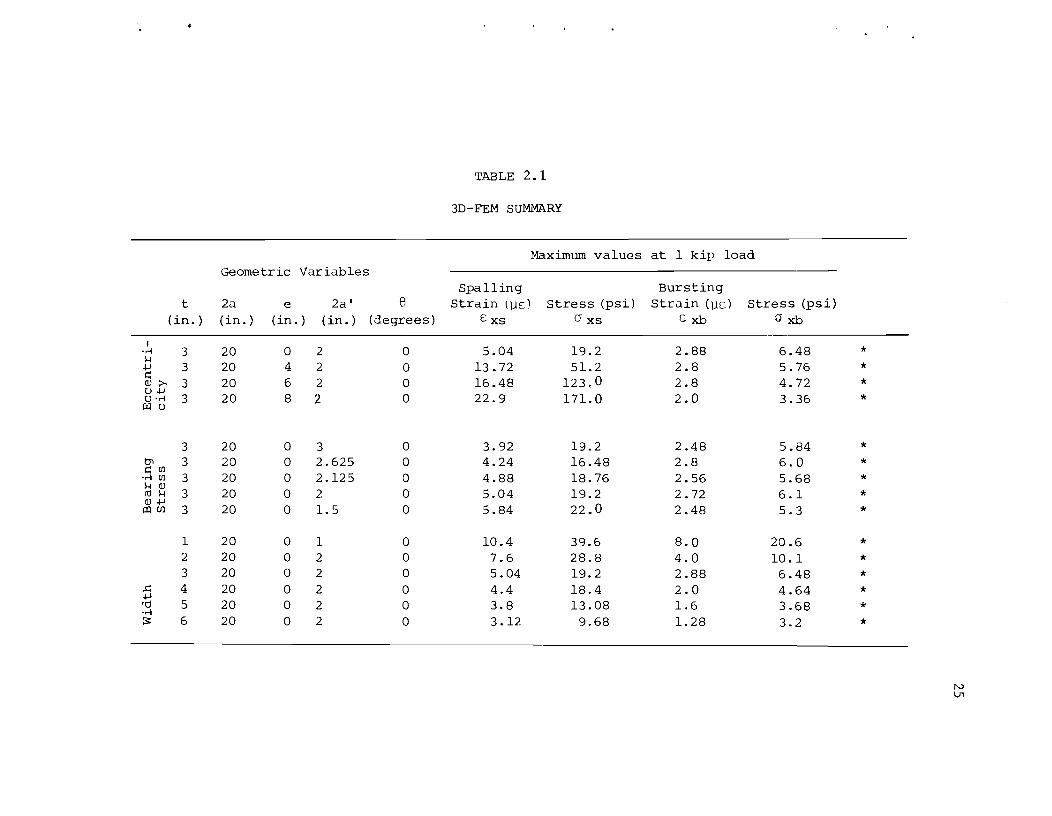
observed. Table 2.1 provides a summary of all three-dimensional
finite element studies pertinent to the physical test program. Data
are provided for a 1 kip load. Since the solution is linear, com
parable data for any tendon load can be obtained by multiplication
of the indicated results by the load. Values corresponding to speci
fic test specimens at their measured cracking loads are presented
later in Sec. 2.3.
For concentric straight tendon specimens with varying
thicknesses, column Uxb
in Table 2.1 indicates that the maximum
Geometric Variables
t 2a e 2a' e (in. ) (in. ) (in. ) (in. ) (degrees)
, ·rl 3 20 0 2 0 ~
20 4 2 +J 3 0 ~
6 2 0>;>-' 3 20 0 U+J
20 8 2 0 U·rl 3 rLI U
3 20 0 3 0 0> 3 20 0 2.625 0 ~ UJ
·rl UJ 3 20 0 2.125 0 ~ QJ rtl ~ 3 20 0 2 0 QJ+J CQW 3 20 0 1.5 0
1 20 0 1 0 2 20 0 2 0 3 20 0 2 0
,.c: 4 20 0 2 0 +J '0 5 20 0 2 0 ·rl ~ 6 20 0 2 0
TABLE 2.1
3D-FEM SUMMARY
Maximum values at 1 kip load
Spalling Bursting Strain l)lE' Stress (psi) Strain ()lE) Stress (psi)
E xs o xs Exb °xb
5.04 19.2 2.88 6.48 13.72 51.2 2.8 5.76 16.48 123.0 2.8 4.72 22.9 171.0 2.0 3.36
3.92 19.2 2.48 5.84 4.24 16.48 2.8 6.0 4.88 18.76 2.56 5.68 5.04 19.2 2.72 6.1 5.84 22.0 2.48 5.3
10.4 39.6 8.0 20.6 7.6 28.8 4.0 10.1 5.04 19.2 2.88 6.48 4.4 18.4 2.0 4.64 3.8 13.08 1.6 3.68 3.12 9.68 1.28 3.2
* * * *
* * * * *
* * * * * *
N V1

TABLE 2. 1 (Continued)
Maximum values at 1 kip load
t
(in. )
s:: 3 .~ 3 +l rO 3 s::
• .-1 r-I U 3 s:: H
E-I p.., H
3
3
Notes: ---
Geometric Variables
2a (in. )
20.5 20.5 20.5
20.5
20.5
20.5
e (in. )
0 0 0
0
0
0
2a' e (in.) (degrees)
2.625 0 2.625 15 2.625 30
2.625 45
2.625 30
2.625 30
Spa11ing Strain (f.lE)
Exs
8.04 40.32 57.76
80.8
24.1
50.24
* Tendon duct not included in FEM mesh.
Stress (psi) 0 xs
34.0 164.0 229.0
325.0
94.4
197.6
** Duct, friction and normal (radial) forces included in mesh. I 0.3 kip LPT atO.146a from loaded face.
II 0.3 kip LPT atO.780a from loaded face.
Bursting
Strain (f.lE) Exb
5.02@ 3.76@ 2.87@ 6.72# 3.l6@ 8.72#
1.68@ 5.52#
-0.856@ 4.32#
@ Peak burstinq stress (strain) at 4a' from loaded face along tendon duct.
Stress (psi) 0 xb
13.9@ 11.5@
9.l2@ 23.9#
9.52@ 32.3#
2.99@ 19.4# -7.04@ 13.6#
** ** ** ** ** **
**,1 **,1 **,11 **,11
# Peak transverse stress (strain) at point of maximum tendon curvature (not a conventional bursting stress).
N (J'\

bursting stress decreases exponentially with increasing thickness.
This is expec.ted, and the trend is illustrated in Fig. 2.3. The
27
solid line in this figure represents the predicted peak bursting
stress at the model tendon design load of 25 kips (400 kips prototype)
(0.8 f ). pu
Even at the higher loads which actually caused cracking
in the test specimens the measured peak stresses are insufficient to
explain why cracking occurred, since the tensile strength of the
concrete (which is shown on Fig. 2.3) is considerably in excess of
the highest bursting stress expected or measured. For example, in
the first line of the table with t = 3 in., e = 0, e 0, Table 2.1
indicates the calculated peak bursting stress at a 1 kip load to be
6.48 psi. The cracking load for the corresponding test specimen
(Ml-2) was 34 kips. Thus, at cracking, the calculated peak bursting
stress is 6.48 (34) = 220 psi, as plotted on the dashed line of Fig.
2.3. This value is well below the measured tensile capacity of the
concrete for that particular specimen (f = 627 psi). The experi-sp
mentally measured values showed peak stresses at cracking based on
measured strains to be approximately 30 to 50 percent higher than
those predicted by the computer analysis, as shown in Fig. 2.3.
These values are plotted above the 3D FEM predicted values and again
clearly fall well below the measured tensile strength of the con
crete. The observed bursting strains at cracking were generally
well below the 150 microstrain recommended by Rusch [10] as the
lowest limiting strain which would cause cracking.
The most important evidence that the bursting stress is not
the proper criteria for anchorage zone cracking behavior comes from
eccentric straight tendon tests. The survey of design methods out
lined in Ref. 1 showed that in the widely accepted symmetrical prism
analogy of Guyon [7], to treat the case of an eccentric tendon, the
distance from the eccentric load centerline to the nearest face
(denoted al
) is used in place of the value a (half height of the
section). For increasingly eccentric loads, the value al
thus

'iii a.
~ w a:: ~ CJ)
28
600
500
400
~ 300 i= CJ) a:: ::> II)
:)£
<C 200 w a..
100
3D-FEM PEAK BURSTING STRESS vrs,
PLATE ANCHOR· 20':: 2" 20:: 20"
SECTION WIDTH
~0, ~EASURED
~o'l ' -- 3D- FEM
-- -- -- -- 0 __ .E~EDICTED ---0~
PEAK BURSTI NG STRESS AT DESIGN LOAD = 25 kips (3D - FEM )
PEAK BURSTING STRESS AT OBSERVED CRACKING LOADS FOR TESTS MI-2, M2-2, M3-2
°0~------~--------~2~ 3 4 5 ----'-
6
MODEL SPECIMEN THICKNESS (in.)
F ' 2 3 Peak bursting stress as a function of section Ig. . thickness
29
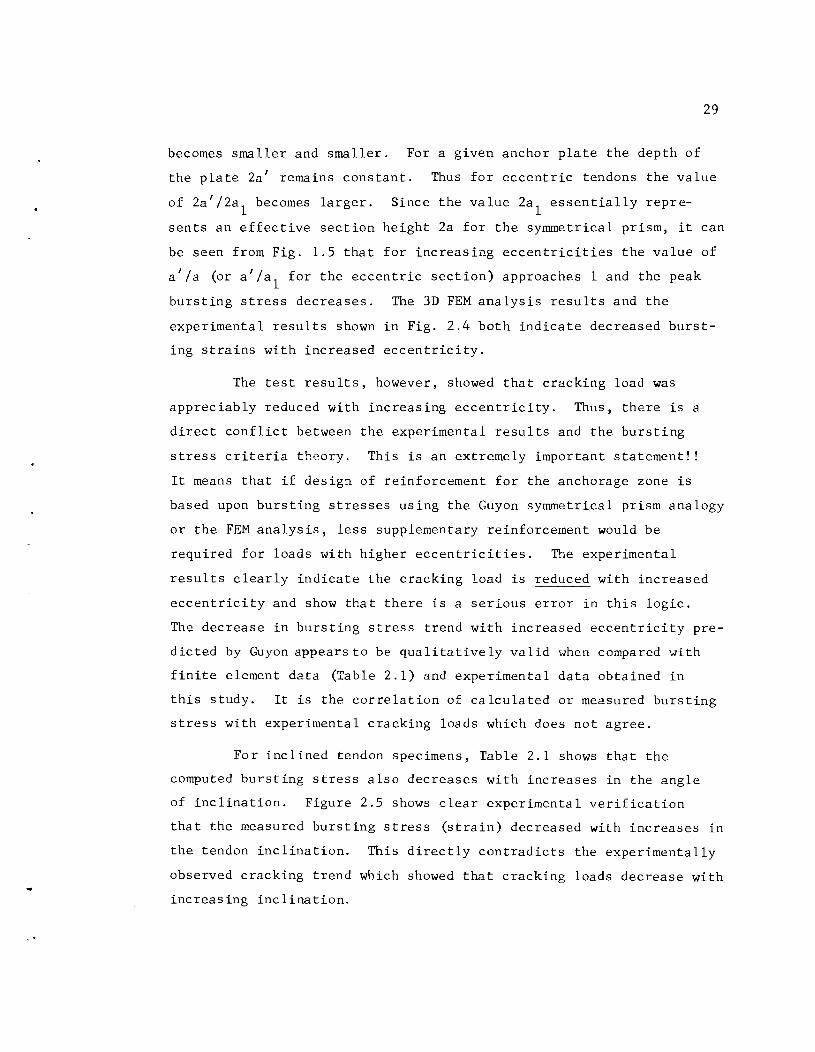
becomes smaller and smaller. For a given anchor plate the depth of
the plate 2a' remains constant. Thus for eccentric tendons the value
of 2a' /2al
becomes larger. Since the value 2al
essentially repre
sents an effective section height 2a for the sy~netrical prism, it can
be seen from Fig. 1.S that for increasirrg eccentricities the value of
a' /a (or a' /al
for the eccentric section) approaches 1 and the peak
bursting stress decreases. The 3D FEM analysis results and the
experimental results shown in Fig. 2.4 both indicate decreased burst
ing strains with increased eccentricity.
The test results, however, showed that cracking load was
appreciably reduced with increasing eccentricity. Thus, there is a
direct conflict between the experimental results and the bursting
stress criteria theory. This is an extremely important statement!!
It means that if design of reinforcement for the anchorage zone is
based upon bursting stresses using the Guyon symmetrical prism analogy
or the FEM analysis, less supplementary reinforcement would be
required for loads with higher eccentricities. The experimental
results clearly indicate the cracking load is reduced with increased
eccentricity and show that there is a serious error in this logic.
The decrease in bursting stress trend with increased eccentricity pre
dicted by Guyon appears to be qualitatively valid when compared with
finite element data (Table 2.1) and experimental data obtained in
this study. It is the correlation of calculated or measured bursting
stress with experimental cracking loads which does not agree.
For inclined tendon specimens, Table 2.1 shows that the
computed bursting stress also decreases with increases in the angle
of inclination. Figure 2.5 shows clear experimental verification
that the measured bursting stress (strain) decreased with increases in
the tendon inclination. This directly contradicts the experimentally
observed cracking trend which showed that cracking loads decrease with
increasing inclination.

30
30
20
10
0
I I
I I I I I I , , I I I I I I I J
• 0/2
0
t- 171
/0, / \
I \ I \ I \ I \ I \ I \
\ \
\
o \ \
0
\ \ \
20 = 20" 20' = 2"
\ \
t :: 0.30
LOAD = 10k
\ \
\
z
~ r-- 20'
~~======~~ ~ 20
'___z ------.J 1 \ \
\
\ e=O \
\ \ o \
\
30/2
o
\ \
\ \
\ 0 , " " ,
20
"-"-
-.It I.--
"-"- ' . .....
Fig. 2.4 Experimental bursting strain distribution-eccentricity series

Z
~ I-C/) 0 IX: ~ :E
INCLINATION EFFECTS
40
20
0 0/2 o
z
-20
-40 o
-60
-80
o
-100
Fig. 2.5 Experimental burst inclination series
30/2 20
0=10" 0' = ( t = 030 e=O
LOAD;;; 25 kips
1 I
20
I t --t
strain distribution--
31
j20' IIZZl
1 I
f k-

32
Although not a conventional bursting stress from the
elasticity definition given in Chapter 1, Table 2.1 shows that for
highly inclined multiple strand tendons (note 30, 45 degree values
specifically) the transverse tensile stress along the tendon path at
points near the region of maximum curvature begins to increase. The
two values shown in the table (labeled # in Table 2.1) represent the
3D FEM predicted transverse stress at the point of maximum curvature
developed by applying appropriate friction and normal forces along the
tendon duct. The true peak conventional "bursting" stress occurs at
approximately a distance of 4a' from the loaded face. These values
are marked with the symbol @ in Table 2.1 and show the general
decrease with increased inclination. The bursting stress in the
anchor region marked with @ is insufficient to cause cracking at the
loads observed experimentally.
For example specimen FS2B (30 degree tendon) cracked at a
load of 330 kips. Using the results shown in Table 2.1 and scaling
the prototype load to a quarter-scale load by (1/4)2 = 1/16 would
indicate a peak bursting stress of (330)(9.12)/16 = 187 psi, con
siderably less than the measured 455 psi indirect tensile strength of
the concrete used in that specimen. On the other hand, the trans
verse peak stress at the point of maximum curvature, 330 (23.9)/16
490 psi would probably cause cracking, and, in fact, the crack did
initiate from this location in specimen FS2B. While the conventional
bursting stress clearly is an inappropriate indicator of the cracking
behavior in the anchorage zone, the special case of the highly
inclined curved multiple strand tendon poses an additional mecha-
nism for crack fonnat ion. For this case the calculated transverse
tensile stress at the point of maximum curvature does agree qualita
tively with experimentally observed cracking data. Desi.gn of
reinforcement to resist the transverse tensile stress in the region of
maximum curvature is, therefore, a requisite when dealing with
curved tendons. This is discussed in Section 2.2.5.

Conventional bursting stress analysis is not a proper
criterion for control of anchorage zone cracking.
2.2.4 Spalling Stress Role. When the major contradiction
33
outlined in the previous section was noted between the predicted
bursting stress and the actual eccentric tendon cracking load trends,
a detailed examination was undertaken of the state of stress in the
anchorage zone using the three-dimensional finite element program.
Somewhat unexpectedly it was found that the computed tensile
spalling stress along the end face increased rapidly with increasing
eccentricity. The maximum value calculated was located near the
lower edge of the plate anchor. While no evidence was seen in any
test specimens of external cracks due to spalling stresses, the vari
ation in magnitude of the computed spalling stress also correlated
with the observed variations in the inclined, bearing stress, and
cover series specimens.
Studies of the role of the spalling stresses in anchorage
zone behavior led to the formulation of a failure hypothesis outlined
in Sec. 2.2.5. Since the spalling stress (strain) seems to be the
best indicator of tendon path crack initiation, even though "spalling
cracks" do not occur, a method of predicting first cracking through
the use of analytically derived spalling stresses (strains) was
developed, as outlined in Sec. 2.2.6.
2.2.5 Anchorage Failure Mechanism. Detailed comparison of
analytical and experimental data for a wide variety of variables
indicated that several key phases were common in the overall loading
behavior of plate ~earing) type anchorages. These phases suggested
a general failure mechanism which could also be adapted to cone and
bell anchors.
The key phases were:

34
(1) Appearance of the longitudinal tendon path crack, usually
beginning at a distance approximately 2a' from the loaded face.
(2) Appearance of upper and lower diagonal cracks emanating from
the corners of square anchors or of radial cracks from circular
anchors.
(3) Ultimate failure consisting of an explosive side face blow
out, usually occurring shortly after formation of the diagonal cracks.
(4) After failure a cone (pyramid) of crushed concrete was
observed beneath the anchor plate with the telltale presence of
powdered concrete along its edges indicative of a shear failure.
To further investigate the shear type failure noted in phase
(4), a study was made of both the calculated spalling tensile stress
(strain) and maximum shearing stress (strain) in the vicinity of the
anchor plate edge. The shearing stress values offered no direct cor
relation which would explain the cracking behavior. The spalling
stress vslues, however, followed a definite trend which indicates
that the following sequence is the probable mechanism leading to
anchorage zone failure for bearing plate anchors and with minor
modifications for cone and bell type anchors:
(1) Due to large friction forces developed directly beneath the
anchor plate, Poisson ratio type lateral expansion of the concrete
in this vicinity is constrained.
(2) A complex, triaxial compressive stress state is thus set up
which permits development of extremely high direct bearing stresses
(up to 3f') beneath the plate (see Fig. 2.6a). c
(3) The confining lateral forces at the edge of the plate are
reduced by the presence of the spalling tensile stress (strain). As
this reduction in lateral confining stress takes place the effect on
the state of stress would be to increase the shearing stress, as
can be seen from the increase in diameter of the Mohr's circle as
illustrated in Fig. 2.6b.

P ...
1+ SPALLING
STRESS
~ANCHORAGE
t+
o
BURSTING
STRESS
"-TENDON
35
! <TLATERAL DUE TO FRICTION
1
(J'" P DUE TO POST - TENSIONING
LOAD
Fig. 2.6 Spalling initiated shear failure theory
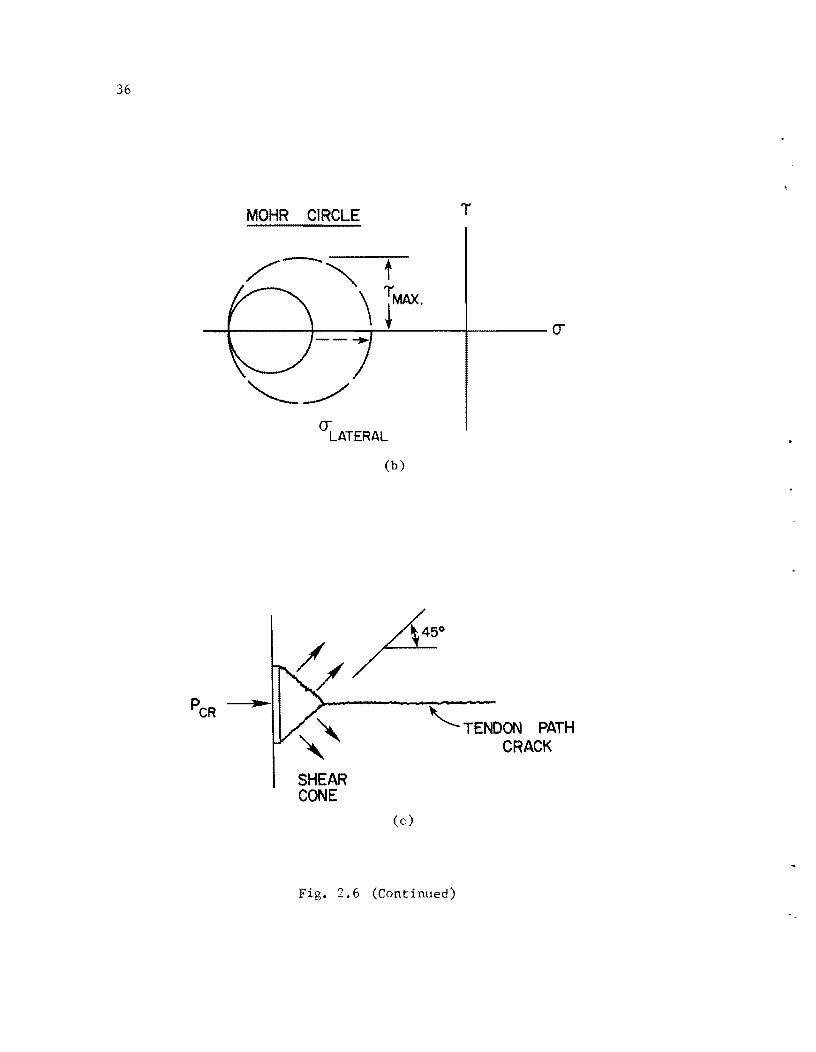
36
MOHR CIRCLE
O""LATERAL
(b)
SHEAR CONE
(c)
"- TENDON PATH CRACK
Fig. 2.6 (Continued)
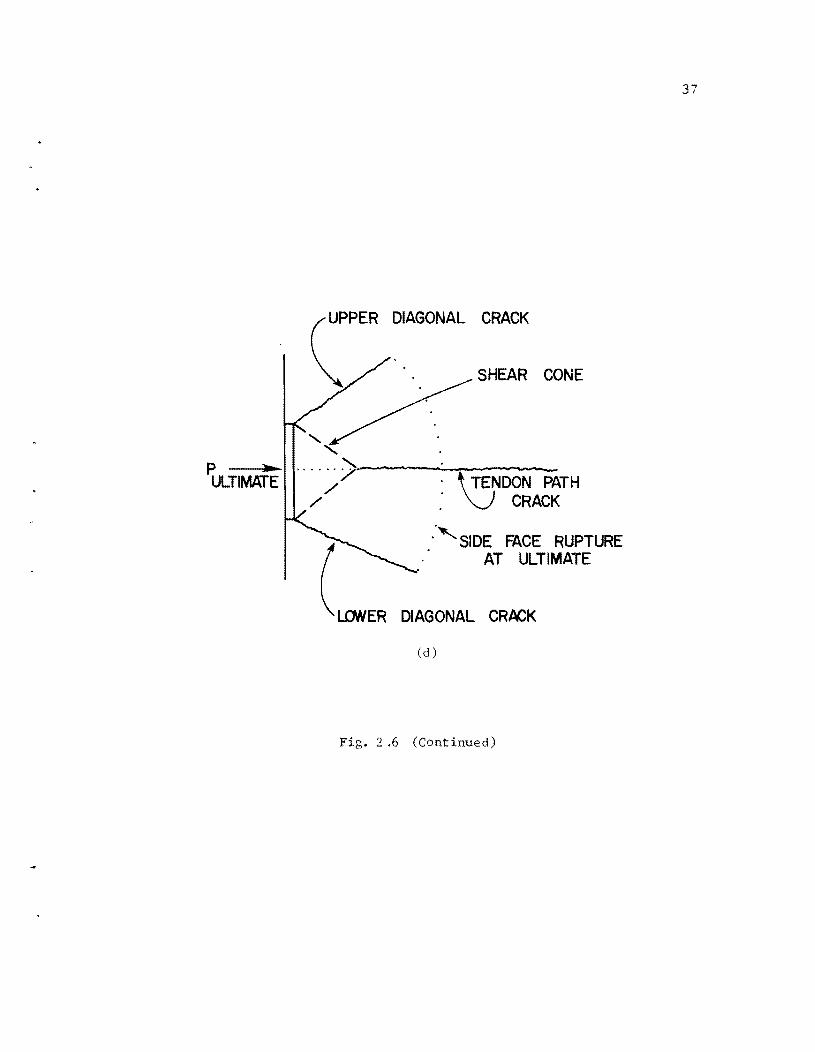
37
DIAGONAL CRACK
SHEAR CONE
P }IIo
ULTIMATE . \3N'OO~~TH
(~ER :'SIDE FACE RUPTURE . AT ULTIMATE
DIAGONAL CRACK
(d)
Fig. 2.6 (Continued)

38
(4) At some level of applied load the confining stress is suffi
ciently reduced (though still in compression) that an internal shear
failure occurs along the plane of maximum shear stress.
(5) The maximum shearing stress plane occurs at an angle of 45 0
counterclockwise from the primary stress a axis and thus propagates p
to form the 45 0 pyramidal "cone" seen for all plate-type anchors
(see Figs. 2.le and 2.6c).
(6) Simultaneous with the formation of the cone, a tendon path
crack propagates from the tip of the cone, as shown in Fig. 2.6c.
(Phases 5 and 6 can be delayed by the presence of supple
mentary anchorage zone reinforcement. This delay can be substantial
whe~ spirals and lateral post-tensioning which enhance confinement
are used.)
(7) The cone is forced into the anchorage zone, setting up large
lateral forces which eventually produce the upper and lower diagonal
cracks.
(8) Increases in load above that required for formation of
diagonal cracks lead to ultimate explosive failure of the side
faces, bounded by the upper and lower diagonal cracks (see Fig.
2.6d).
2.2.6 Prediction of First Cracking Based on Analytical
Studies. A summary of the three-dimensional finite element
analysis findings ,,,as presented in Table 2.1. Dimensions correspond
to those of the quarter-scale specimens at a load of 1 kip. For
full-scale comparison, dimensions should be multiplied by a scale
factor Si of 4 and the stresses and strains shown would correspond 2
to a load of Si or 16 kips.
As pointed out in Sec. 2.2.4, the spalling stress-strain
trends seem to be the best indirect indicator of crack initiation.
As a means of comparing the maximum tensile spalling strain, all
39
values in Table 2.1 which corresponded to physical specimens were
multiplied by the respective measured cracking loads to obtain the
predicted peak spalling strain at the plate edge. These values are
presented in Table 2.2.
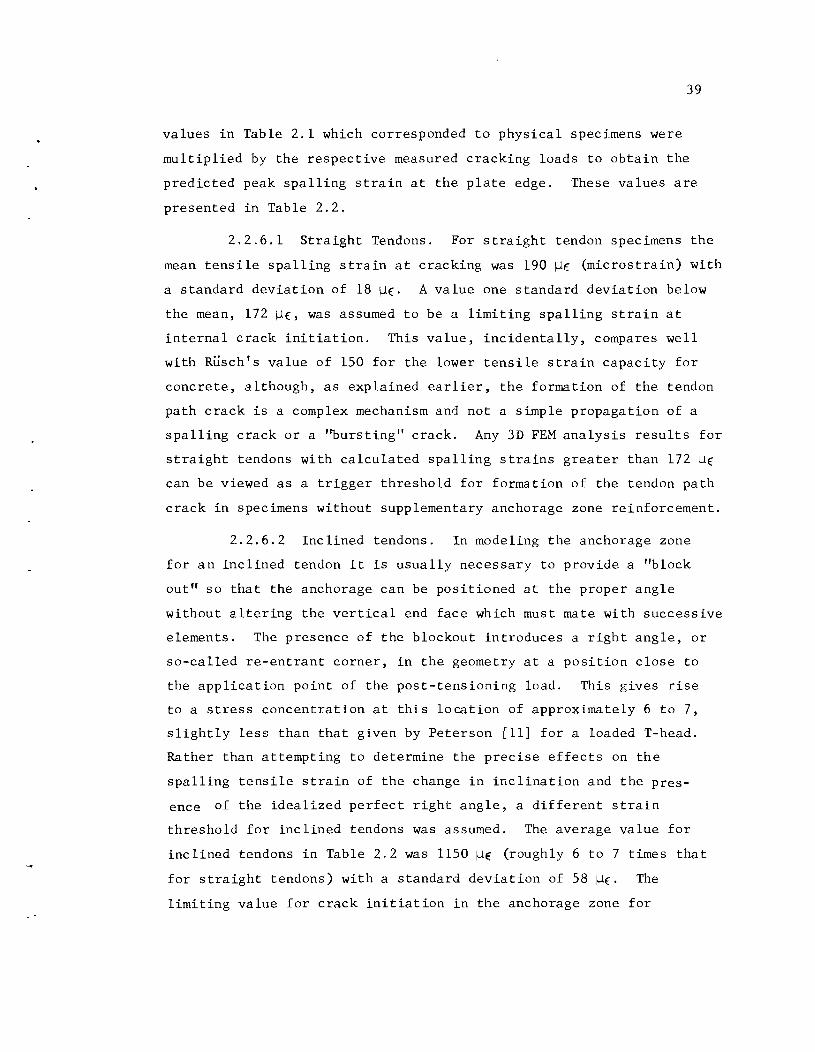
2.2.6.1 Straight Tendons. For straight tendon specimens the
mean tensile spalling strain at cracking was 190 ~~ (microstrain) with
a standard deviation of 18 ~€. A value one standard deviation below
the mean, 172 ~€, was assumed to be a limiting spalling strain at
internal crack initiation. This value, incidentally, compares well
with Rusch's value of 150 for the lower tensile strain capacity for
concrete, although, as explained earlier, the formation of the tendon
path crack is a complex mechanism and not a simple propagation of a
spalling crack or a '~ursting" crack. Any 3D FEM analysis results for
straight tendons with calculated spalling strains greater than 172 u€
can be viewed as a trigger threshold for formation of the tendon path
crack in specimens without supplementary anchorage zone reinforcement.
2.2.6.2 Inclined tendons. In modeling the anchorage zone
for an inclined tendon it is usually necessary to provide a "block
out" so that the anchorage can be positioned at the proper angle
without altering the vertical end face which must mate with successive
elements. The presence of the blockout introduces a right angle, or
so-called re-entrant corner, in the geometry at a position close to
the application point of the post-tensioning load. This gives rise
to a stress concentration at this location of approximately 6 to 7,
slightly less than that given by Peterson [11] for a loaded T-head.
Rather than attempting to determine the precise effects on the
spalling tensile strain of the change in inclination and the pres
ence of the idealized perfect right angle, a different strain
threshold for inclined tendons was assumed. The average value for
inclined tendons in Table 2.2 was 1150 UE (roughly 6 to 7 times that
for straight tendons) with a standard deviation of 58 u€. The
limiting value for crack initiation in the anchorage zone for

40
TABLE 2.2
3D-FEM PEAK SPALLING STRAIN AT FIRST CRACKING
C . P Corresponding Variable . P
xs cr Specimen t
xs cr f sp ID
e = 0 172 0.274 M2-2
e = .3A 168 0.513 M7A-4
e = .6A 205 0.414 M1A-4
2a' 0.87St 165 0.244 MR1A
2a' 0.87St 207 0.317 MIlA
2a' 0.87St 201 0.501 FS1B
2a' O,71t 209 0.309 MR1B
2a' 0.7lt 200 0.329 MIlB
t 0.2a 183 0.292 M3-2
t 0.3a 172 0.274 M2-2
t 0.4a 210 0.334 Ml-2
e 15 1109 2.08 FS2A
e 30 1191 2.61 FS5B
e 30
60k
LPT @ O.lSa 845 1.5 FS5B
(continued)

TABLE 2.2 (Continued)
Variable € • p xs cr
e = 30
60k LPT @ O. 78a
1444
Straight Tendon Specimens:
Inclined Tendon Specimens:
€ xs
€ xs
f
€ xs
E; xs
€ • p xs cr
f sp
2.56
P 190 cr
S.D. 18
P cr
0.345 sp
S.D. 0.09
P 1150 cr
S.D. 58
. P cr
f 2.34 sp
S.D. 0.26
Corresponding Specimen
ID
FS5A
41

42
inclined tendons was thus set at 1092 ~(. A rezone technique was
necessary to refine the mesh in the vicinity of the anchor for
accurate resolution of the above values. The transition between
this value and the much smaller one for straight tendons needs fur
ther study to adequately treat the effect of very small inclinations.
2.2.6.3 Multistrand Effect in Curved Tendons. Cracking
loads predicted from the use of the assumed critical spalling
strains assume first cracking to occur in the anchorage zone via the
mechanism discussed in Sec. 2.2.5. For the case of highly inclined,
curved multiple strand tendons the cracking load may be significantly
less due to failure initiating at the point of maximum tendon curva
ture. This independent failure mechanism should be checked in
accordance with the theory presented in Sec. 2.2.7 and the rein
forcement recommendations presented in Chapter 3.
2.2.7 Multistrand Side Face Failure Mechanism. For thin
web post-tensioning applications where significant tendon curva
tures are required and multiple strand tendons are used, a second
mechanism may govern the failure of the section. Any time a loaded
tendon follows a curved path, normal and friction forces will be set
up as shown in Fig. 2.7. Equilibrium of forces in the vertical (x)
direction yields:
P sin
2P sin
de + (P + dP) 2
.9.e. + dP 2
sin dB 2
sin
N
dB _ N 2
o (2.1)
(2.2)
where N = summation of all normal components over ds. The normal
force applied to the tendon duct per unit length is thus:
p = N/ds (2.3)
Also, from small angle theory

~ P +dP
P +dP
\ I I \11
P
Fig. 2.7 Radial and friction forces due to tendon curvature
43

44
sin de '" ARC de 2 2
Substituting (2.4) into (2.2) yields
But
2P ~ + dP de = N 2 2
dP de I'V 0 2
Pde = N
thus
Substituting (2.3) into (2.6) yields
where
From calculus
P = post-tension load (kips)
R radius of curvature at a given point (in.)
p = normal load on tendon duct per unit length (kips/in. )
r- d ) 2-.3/2 i 2.. ! 1 + (dZ I
R = - •
I ::~ I Most curved tendon profiles can be described by the equation
x = Az 3 + Bz
2 + Cz + D
Substitution into (2.8) yields
R = [1 + (3Az2 + 2Bz + C)2 J1.5 !6Az + 2B I
(2.4)
(2.5)
(2.6)
(2.7)
(2.8)
(2.9)
(2.10)
If the value of R is relatively small, very normal
components of the post-tensioning force are set up which can cause
tendon path cracking at loads below those which would initiate

45
cracking in the anchorage zone proper. This is more likely to occur
when the anchorage zone is well-reinforced and the point of maximum
curvature occurs well away from the anchorage and does not have sup-
plementary reinforcement. Figure 2.8 illustrates this failure
sequence which was observed in the full-scale tests, as shown in Fig.
2.9. An empirical design method to control this effect will be pre
sented in Chapter 3.
2.3 Major Effects of Variables
In this section the measured cracking loads of the physical
test specimens reported in Ref. 2 and the predicted cracking loads
using the 3D FEM analysis with cracking criteria based on the empir
ically based spalling strain levels developed in the preceding sec
tion are discussed as functions of the major variables in the program.
Use of the 3D FEM procedure allows a more general comparison of the
effect of variables. As a means of nondimensionallzing the data pre
sented in the following sections, the normalized cracking load
p If (which has units of square inches), is divided by the crosscr sp
sectional area of the web--2at.
2.3.1 Cover and Thickness Effects. For most specimens in
the scale model and full-scale tests, the web thickness was a con
stant, as was the section height. To investigate the effect of
cover, however, one model series was conducted wherein similar
anchors were used while varying the web thickness. Rather than
dealing in absolute web thickness (t = 6 in., for example), the cover
is expressed indirectly as a ratio of the width of the bearing plate
divided by the thickness (2a'/t) or expressed directly as the coverl
thickness ratio on a face (Cit 1/2 - a'/t). Table 2.3 lists the
data pertinent to this series, while Fig. 2.10 shows the non
dimensional cracking trends with respect to cover. The solid line,
which forms a reasonable and conservative lower bound for the experi
mental data, was based on the three-dimensional finite element pre
dictions discussed in Sec. 2.2.6.

46
, a \ , '0
''''/> ",. I> ~ I
'0 " ' " iI'
J) / /)
, p ()"
6
i (J II I t> I
" ()
o ' () \ ! / 0 '0
P , ',' \ I 0 .
'( ,
4
11 6 , "\
V 't} o .
, p .... I)
., 0
\ , _t>
1>- ,4 :-" ,I;r~
I> t> '
(0) UNSTRESSED TENDON
(b) TENDON AT STRESSING LOAD
&'
~
----- (I
If!>
'f' ~
LARGE RADIAL FORCES DUE TO "FLATTENING OUT" OF TENDON BUNDLE INITIATE CRACKING IN VICINITY OF SHARPEST CURVATURE
te) FAIWRE SIDE FACE RUPTURE AT POINT OF SHARPEST CURVATURE
Fig. 2.8 Multistrand failure in a curved tendon

-.
(a) Ultimate load : 590 kips. Side face rupture at point of maximum curvature
(b) Close up of failure zone. Vertica L ba r in cen te r has been forced outward
Fig. 2 . 9 Failure due to multis trand effect in specimen FS3B
47

48
TABLE 2.3
COVER EFFECTS
Cover (in~) (in~) (in~) (in~) p Specimen Ratio p P P P fsp cr
cr cr ult ult 2a'/t f f Ii' (2£ at)
~ ~ sp sp sp c c c
Ml-2 0.50 68 659 68 659 9.6 0.85
M2-2 0.66 54 521 54 521 9.6 0.90
M3-2 1.00 38 368 38 368 9.6 0.95
M3-2R 1.00 39 333 41 351 8.5 0.975
MRlA 0.875 54 529 76 734 9.7 0.878
MRIB 0.71 59 573 73 706 9.7 0.959
MIA 0.875 71 677 86 815 9.5 1.154
MIlB 0.71 59 560 72 683 9.5 0.959
FSIA 0.71 55* 352* 6.4 0.894
FSIB 0.875 62* 328* 5.3 1.008
'~Adjusted to 1/4 model values. M..I1tip1y above numbers by 16 to obtain prototype values.

-0
.... N
" c.
1.25
1.0 20
.75 I a. (/)
5 .50 0
0
• . 25
~ 0
0
8
", '.,
0
0
~t+1 PeR / 2·Q·t·fsp =172/€XS fsp·Q·t 3D -FEM
MODEL DATA
PROTOTYPE DATA
3D FEM PREDICTED
49
8
OL--------.L2------~.4--------~,6--------~.8------~I.O(2:')
,5 .4 .3 .2 .1 0 ( ~~i~~NESS )
Fig. 2.10 Cover effects

50
The trend exhibited in Fig. 2. 10 would tend to indicate that
for specimens with like values of f ,it would appear that sections sp
will crack when about the same uniform compressive stress (P 12at) cr
is applied, irrespective of the ratio of cover concrete (cit). It
does not mean the absolute cracking load remains the same as cover
is increased.
Clearly the thickness of the section is an important variable.
Since the sections with like values of f crack when a specified sp
uniform compressive stress (P 12at) is reached, thicker sections cr
will require higher loads to achieve that specified stress. The
effect can be illustrated by factoring out the nondimensionalizing
term (2at), and plotting P If in Fig. 2.11. Here it can be cr sp
clearly seen that, for any given anchor size, as the thickness of
the section increases due to increased cover the cracking load also
increases significantly.
2.3.2 Inclination Effects. A summary of specimens with
inclined tendons is presented in Table 2.4. The angle of inclination
is measured from the axis normal to the end face. In general, as the
angle of inclination increases, the cracking load drops. This trend
is clearly illustrated in Fig. 2.12. The solid line was generated
from the finite element predicted cracking loads. An approximate
value for the decrease in the norma lized cracking load (P .l2atf ) is cr sp
1 percent per degree of inclination as measured from the normal to
the loaded face, as shown in Fig. 2.12.
2.3.3 Bearing Area Effects. A summary of the seven specimens
which dealt with the effect of bearing area on the behavior of the
anchorage zone is presented in Table 2.5. In contrast to the cover
series, the width of the specimen was kept constant and the size of
the anchorage was succeSSively reduced to obtain higher bearing
stresses for a given load. In general, it was observed that the
cracking load increased slightly for increases in the size of the
bearing plate, as shown in Fig. 2.13. The results of the FEM analy
sis agree with the test data. The relative flatness of the curve

'in ~ -0...
(J) -....... -
100
80
8. 60 :.i: -a:
<..)
Q.
40
20
o
.5
-'-
!-+t .... 1
,2
.4
PCR / fSp = 172/E xs f SP
,4
,3
30- FEM
0
0
• *=
:::.~
9 0
0
MODEL DATA
PROTOTYPE DATA
3D 20 1
.6
.2
t
FEM PREDICTED c _ T-
.8
.1
COVER THICKNESS
Fig. 2.11 Thickness effects
51

TABLE 2.4 \Jl N
INCLINATION EFFECTS
Specimen Inclination (in
2) (in
2) ( )
f 1;;;- p cr/2f at P Iii' p /';:-;-
P /f ult/ f" sp c sp cr sp cr c c
PSIB* 0 62 328 6.4 1.008
MIlA 0 71 677 86 815 9.5 1.154
MIlB 0 ')9 560 72 683 9.5 0.959
MRIA 0 54 520 76 734 9.7 0.878
MRIB 0 59 573 73 706 9.7 0.959
FS2A* 15 51 387 7.4 0.829
FS2B* 30 45 303 6.6 0.731
Ml-3 30 45 468 52 535 10 0.750
MI2 30 51 411 82 659 8 0.829
*Full scale values adjusted by scale factor of 1/16. For comparison multiply above values by 16 to obtain equivalents.

53
1.14
P / 2· a· t· f :: 1092/2 Ea· t· f CR SP XS SP
.98
3D - FEM
o .81
.65 -c a.. en ....
N .......
.49 a: () 0 MODEL DATA
a..
0 PROTOTYPE DATA
. 33 • 3D FEM PREDICTED
.16
10 20 30 40 50 ANGLE OF INCLINATION (eo)
Fig. 2.12 Inclination effects

TABLE 2.5
BEARING AREA EFFECTS
Bearing p I~ p p ;-,-
f II;' Ratio P If ult If ultl t cr C C sp C
Specimen
A1/A2 cr sp sp
M2-2 0.44 54 521 54 521
MIlB 0.50 59 560 72 683
MR1B 0.50 59 573 73 706
FS1A* 0.50 55 352
MIlA 0.76 71 677 86 815
MR1A 0.76 54 520 76 734
FS1B* 0.76 62 328
*Adjusted by scale factor of 1/16. Multiply above values by 16 to obtain prototype equivalents.
9.6
9.5
9.7
6.4
9.5
9.7
5.3
V1 ~

55
can be seen by observing the increase in P /2atf for dramatic cr sp
changes in Al/A2 where Al = the area of the bearing plate and A2
the area concentric with and geometrically similar to the plate
(these definitions are as given in the ACI Building Code). For
instance, for Al/A2 = 1, the cracking load is 40 percent above that
for the case of Al/A2 = 0.2. Thus, the 40 percent increase in crack
ing load corresponds to a 500 percent increase in bearing area.
It should be noted that increased Al/A2 values correspond to increased
a' /a values which should result in decreased bursting stresses.
With slight rearranging, the ACI equation for bearing stress
after allowance for prestress losses (Sec. 18.13 ACI 318-77 Commen
tary) yields the following formula:
f allow
p allow
for f' c
P /f allow sp
0.6f~ JA2/Al ~ f~ (from ACI)
4000 psi (average, most tests), and f sp
= 8.3R (models) c
4.57 JA2Al
[A lower value of around 6.5~ would be more appropriate for c prototype concretes.]
(2. 11)
As a comparison, these values are plotted as a broken line below the
experimental data in Fig. 2.13. Also plottec is a similar curve based
on the ACI bearing stress
fallow = 0.8 f~. JA2/Al -~
equation immediately after tendon anchorage
0.2 ~ 1.25 f'. This expression is in very c. ~

56
good agreement with the data trends and is quite conservative.
They follow the correct trend but are indeed conservative, especially
since the ACI formula is based on ultimate load (not cracking).
Since, with supplementary reinforcement, the cracking and ultimate
loads can be raised significantly, the ACI curve is in actuality
very conservative.
A similar examination can be made of the AASHTO Anchorage
Bearing Stress criterion of AASHTO Sec. 1.6.1. (B)(4). This allows a
post-tensioned anchorage bearing stress at service load of 3000 psi
but not to exceed 0.9 f' For the model series f' was about 4000 c. c
psi, 2a was 20 in. and t~was 3 in. To illustrate the effects of this
criterion in Fig. 2.13 the following procedure was used
fallow = 3000 ~ 0.9(4000)
~ Again, for the models f = 8.3 vf ,so sp c
P allow f sp
3000Al
8. 3./4000
Nondimensionalizing as in Fig. 2.13
For 2a 20
Pall
f 2at sp
t = 3
Pall
f 2at sp
Al 0.86 A
2
5.72 (2a' )2 2at
t
t
Al 5.72 A
2
t
2a
The AASHTO values for various Al/A2 ratios are shown on Fig. 2.13.
The AASHTO procedures become increasingly conservative as smaller
bearing plates are used in a constant thickness web and also
severely penalize small anchors in high strength concrete. The

• ... .
.......
5 0..
o .2
Fig. 2.13
o 0
.4---;---.6
Bear in g area eff ects
57
o
.8 1.0

58
CEB-FIP expression (P u = fcd JA1A2 ~ 3.3 fcdA l )
= O. 67 f ~ J A2Al $, 2. 2 f ~ Al ) comparable terms (P u
is shown in roughly
in Fig. 2.13. It is
similar to and falls in between the ACI expressions.
The general trend of the ACI and CEB expressions is much more
in agreement with the experimental and analytical results than are the
AASHTO expressions. Remembering that all experimental and analytical
data are for specimens with no supplementary anchorage zone rein
forcement, the suggested design expressions for bearing stress for
post-tensioned anchorages could be liberalized significantly. The
AASHTO expression should be changed to reflect cover effects.
A reasonable expression would be
fb 0.8f~.JA2/Al ~ 1.33f~. ~ ~
which is shown as a "suggested" curve on Fig. 2.13.
2.3.4 Eccentricity Effects. A series of nine tests dealt
with the effect of eccentricity of the anchorage in a web. Data for
these tests are given in Table 2.6. The general trend, shown in
Fig. 2.14 indicates that increased eccentricity results in a decrease
in the cracking load. As a measure of this, an anchor located 1/3 of
the distance from the centroidal plane toward the edge will crack at a
load 25 percent below that for centroidal loading. An anchor located
2/3 of the way toward the edge will crack at a load approximately 50
percent below that for: centro ida 1 loading. The trend appears to be
fairly linear. The superimposed solid line represents the finite
element analysis predicted cracking load. If the anchor is so eccen
tric that it is located within the flange region, these results may
not be meaningful.
2.3.5 Passive Reinforcement Effects--Spirals, Orthogonal
Grids. There are basically two reasons for adding supplementary
reinforcement to the post-tensioned anchorage zone. The most
important is to prevent complete failure in the event that cracking
should occur, and thus to ensure that the safety of the structure is

TABLE 2.6
ECCENTRICITY EFFECTS
(in~) (in~) (in~) (in~) Specimen ;--;- ;;-:-;- ~
p If p I f Pult I fc P 1 I f f I f~ cr sp cr sp ute sp c
M7A-4 e = 0.3a 46 306 52 347 6.6
M7C-4 e = 0.3a 58 508 65 572 8.7
M1A-4 e = 0.6a 36 301 36 301 8.3
M8B-4 e = 0.6a 43 475 49 537 10.8
MR1A e = 0 54 520 76 634 9.7
MR1B e ; 0 59 573 73 706 9.7
MlA e 0 71 677 86 815 9.5
MIlE e 0 59 560 72 683 9.5
FS1B* e 0 62 328 5.3
*Values adjusted by 1/16 to model scale. To obtain equivalent values for prototypes multiply above values by sixteen.
P cr
2f at sp
0.76
0.96
0.6
0.716
0.88
0.959
1.15
0.959
1.008
V1 \0
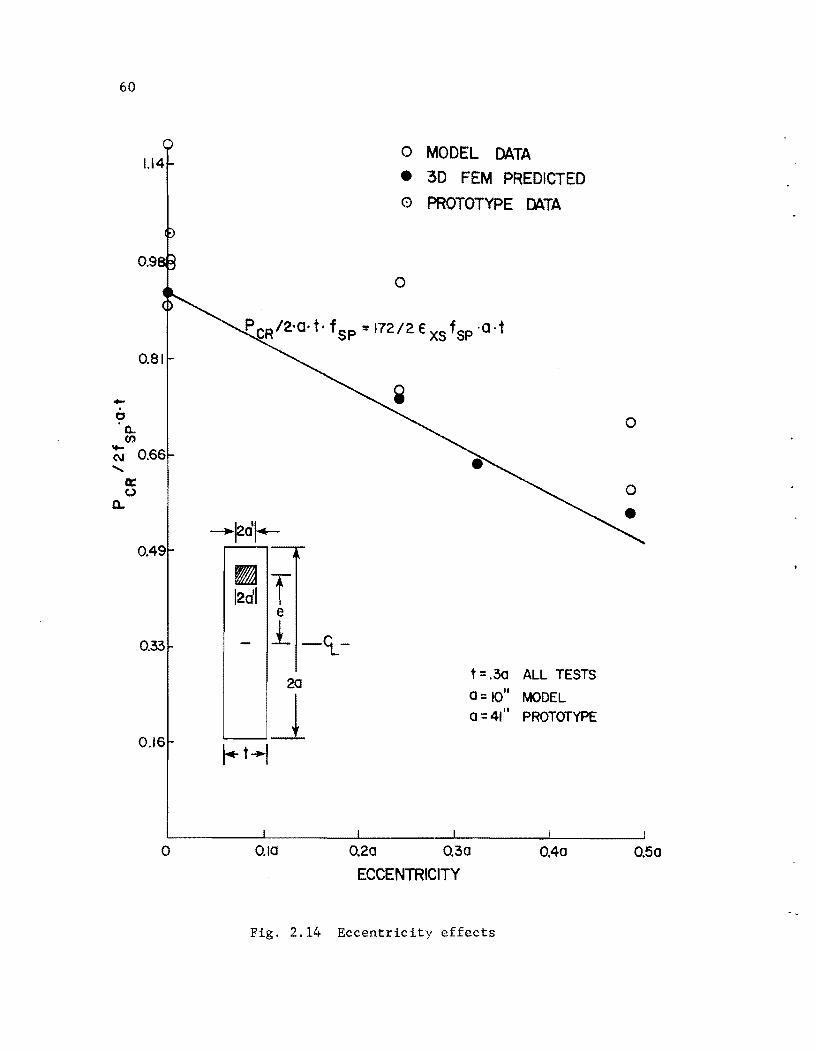
60
-. I:' '0..
1.14
0.81
CJ) 'to-N 0.66 ......
a:: o
a..
0.49
0.33
0.16
o
20
,--J
0.10
o MODEL DATA
• 3D FEM PREDICTED
o PROTOTYPE [)\TA
o
t=.30 ALL TESTS
0=10" MODEL
o = 41" PROTOTYPE
0.20 0.30 0.40
ECCENTRICITY
Fig. 2.14 Eccentricity effects
o
o
0.50

61
unimpaired. However, in most cases, the addition of supplementary
reinforcement will also tend to raise the cracking load, due to the
confinement of the concrete. Thus, the second reason for adding
supplementary reinforcement is to increase the surface crack formation
load adding to the resistance to corrosion and to the aesthetics of
the post-tensioned application.
The reinforcing schemes tested during the rectangular model
series [2J indicated that spiral reinforcement was far superior to
conventional orthogonal or grid-type reinforcement. However, in many
cases it may be impractical to use spiral reinforcement because of
congestion in the anchorage zone. For such situations, orthogonal
reinforcement, while less efficient, will provide some increase in
the cracking load and a substantial increase in the ultimate capacity.
General trends for both types of passive reinforcement are discussed
below.
2.3.5.1 Spiral Reinforcement. Test results for spirally
reinforced specimens (summarized in Tables 2.7 and 2.8 and shown in
Fig. 2.15) indicate the following trends:
(1) For a given volumetric percentage of spiral reinforcement,
the spirals fabricated from smaller diameter bar stock (3/8 in. versus
1/2 in. for the prototype tests) were observed to perform better than
identical spirals fabricated from larger bar stock. While this trend
may not be a general rule, it indicates that for a given required
quantity of reinforcement, the most efficient means of deployment
is through the use of spirals fabricated from smaller bars at a
closer pitch, rather than from large bars at a greater pitch.
(2) Within the range investigated in the full-scale tests, long
spirals (26 in. in length affixed to the anchor) performed no better
than short spirals (13 in. in length). For the case of the inclined,
curved, multiple strand tendons, however, careful attention must be
paid to the possibility of cracking along the tendon path at the

0-.
TABLE 2.7 N
REINFORC~~T EFFICIENCY SUMMARY -- INCLINED TENDON TESTS
A B A (~ - 1) B (- - 1) (- - 1) A f
(in~) (' 2. A A s y ~n. J c c
Specimen Reinforcement 10,000 P If P /f X 100% X 100% X 100% (kips) cr sp u1t sp
FS2B Control (Full Scale) 725 0 0
No Reinforcement
D = 8" t 13" FS3A 787 1361 9 73 88 10.6
S 2" d = 3/8"
D 8" t = 13" -12 ** FS3B 636 1250 96 72 18.84
S = 2" d = 1/2"
D 8" t 26" FS4A 779 1267 8 63 75 21.2
S = 2" d 3/8"
FS5A 60 kips LPT at 32" 845 17 8.26
FS5B 60 kips LPT at 6" 959 1599 33 66 120 8.26
(continued)

TABLE 2.7 (Continued)
A B
Specimen Reinforcement (in
2) (in 2) .. p If
cr sp p If ult sp
MI2* Control for MI3 825 1319
D 2" t = 6.5" MI3* 976 1610
8 = 1/4", d = 13 gage
Notes: ---
A = Normalized control cracking load (no reinforcement) c
A,B = Normalized specimen cracking and ultimate loads D Overall spiral diameter (inches) t ~ Overall length of spiral (inches) d = bar diameter (60 ksi) used to fabricate spiral
A (~- 1) B (- - 1) (- - 1) A A A
c c
X 100% X 100% X 100%
0
18 65 95
LPT = lateral post-tensioning (active reinforcement). Distance is from loaded face. Model values for A f 11000, p If , p ltlf adjusted by scale factor 1182 = 16 s y cr sp u sp *
**=8pecimen cracked prematurely due to multistrand effects.
A f s y
10,000
(kips)
0
20.2
A The area of supplementary reinforcement which crosses perpendicularly the tendon path in the s anchorage zone. For practical purposes, the anchorage zone is assumed to extend a maximum
distance of 6a' from the primary loaded face. All specimens had plate type anchors.
0" W

TABLE 2.8 REINFORCEMENT EFFICIENCY SUMMARY--STPillIGHT TENDONS WITH SPIRAL REINFORCEMENT
Specimen
M2B-4
MSA-4*
M5B-4*
MIB-4*
M6A-4*
j16B-4*
-
Notes:
Reinforcement
Control for (t O. Sa)
M5A-4 , M5B-4
D 2" 6"
S 0.75" d 13 gage
D 2" 2 r., II
S 0.75" d 10 Cjuge
Contl.-ol for M6A-4
('.: '" 0.3a) t168-4
D 2" i 6 11
s 0.75"
.D -'I tr
"
d
6 11
13 gRqe
s 0.7]" d 10
A
(in 2)
421.0
768.0
823.0
3...:3.0
736.0
W).<.O
B
. 2 (w)
P If ult sp
421.0
1136.0
1184.0
452.8
3.0
1053
A NormaLi.zed control cracking load (no reinforcement) c
A,B Normalized cracking and ultimate loads.
(L _ 1) A
c
x 100f,
82
95
In
154
B (~- 1) A .
x 100/,
o
47
43
40
41
28
B (A - 1) c
x 100'7,
170
181
222
226
(kips)
o
18.5
33
o
18.5
33
Same as [or Table 7.5a. All values for Pcr/fsp' Pult/fsp data by a factor of 16. All tendons have eccentricity of
and have been scaled from model .6a.
Q'\ .j:--

TABLE 2.9
REINFORCEMENT EFFICIENCY SUMMARY -- STRAIGHT TENDONS WITH ORTHOGONAL REINFORCEMENT
A B <!;. - 1) B B
(in2
) (in2 ) (- - 1) (- - 1)
A A A imen Reinforcement c c
Pcr/fsp P If ult sp
X 100% X 100% X 100%
Control for t == 0.45a M2B-4 421 421 0
!'-14A-4 M4B-4
5 - 10 gage stirrups M4A-4 716 777 70 8.5 127
at 2" spacing
17 - 6w~ stirrups M4B-4 832 958 97 15.1 127
at I" spacing
Control for M3A-4, M3B-4 MIB-4 323 452.8 40
t = 0.3a
11 - 6 rom stirrups M3B-4 596 688 84 15.4 113
at 1. 6" spacing
Notes:
Same as 7.5a,b. All specimens had cone type anchors.
A f s y
10,000
(kips)
a
13.74
143.0
0
92.5
0-V1

TABLE 2.10
RECOMMENDED DESIGN VALUES
I.) straight Tendon Tests
Increase in Increase in
Reinforcement Cracking Load Ultimate Load
x (10) o (%) x - 20 (%) x (%) o (%) x -20(%)
Spiral 141 19 103 224 2.8 211:
Orthogonal 84 11 61 106 18 71
II.) Inclined Curved Tendon Tests
Spiral (multiple 8.5 O. 7 7 78 8.5 61 strand tendon)
Spiral (single 18 2.07* 14 95 9.22* 77 strand tendon)
100 psi LPT 33 3.8* 25.4 120 11.6* 97 (multiple strand tendon)
*Estimates based on mean variance of other tests. x - 20 represents the recommended % increase above the cracking load for a specimen with no supplemental reinforcement (from Fig·. 2.10-2.13 or Eq. 3.2).
(j'\ (j'\

rP-
zoo,
.----. I
_150 :J o Q:
~ o
/
/:$- SPIRAL REINFORCEMENT
(STRAIGHT TENDONS)
-$
I 9a:
IOOI' t:'I_ a..<.J __ --~ ...... --2 19. _ - - - 0 ORTt-KlGDNAL REINFORCEMENT
~ Ii 0 (STRAIGHT TENDONS 1 w a. 50 -'!)
30° INCLINED, CURVED "'-'" ......... o 60 kips lPT AT 6" FROM LOADED FACE!
01-"",- SPIRAL REINFORCEMENT MUlTFLE STAAt.[) TENDON
o 50
Asfy/lOOOD lb.
'0) PERCENT INCREASE IN CRACKING LOAD ABOVE UNREINFORCED SECTOO
250
1
rh--$ cI- ~ t'f7 '
200 ! {
~
...J
~ I-
~ 9
a: 0.0 ...... ...... Z W ~ &3 ~
!::i a.::>
......... .........
I 1
150
o
SPIRAL REINFORCEMENT (STRAIGHT TENDON 1
___ 1 I I
50 100 150
Asfy/lOOOO lb.
(b) PERCENT IN ULTNATE LOAD ASQ\IE CRACKING LOAD FOR UNREINFORCED SECTION
. 2.15 Supplementary reinforcement efficiency
0' ~

68
point of maximum tendon curvatures. In most practical applications
that point would be well-removed from the anchorage zone, and from
the influence of any spiral reinforcement in the anchorage zone.
While continuing anchorage zone reinforcement into the zone of maxi
mum curvature would seem logical in such situations, calculations
which will be presented in the next chapter indicate that the rein
forcement required to resist multistrand effects is much smaller
than that required for confinement in the anchorage zone.
(3) At first cracking, all spiral confinements tested in the
prototype specimens series maintained crack widths below the maximum
0.013 in. currently implicitly specified by ACI.
A measure of the spiral's effectiveness in delaying surface
cracking and in increasing the ultimate anchorage capacity can be
clearly seen in Fig. 2.15 and is summarized in Table 2.10. In
straight tendon specimens the spiral reinforcement raised the crack
ing load by 100 percent (i.e., more than twice the cracking load)
over that witnessed in companion tests with no supplementary
anchorage zone reinforcement. Ultimate loads were increased more
than 200 percent above the cracking load for the unreinforced sec
tion. These results would apply to both single and multiple strand
tendons. The values in Table 2.10 represent conservative results two
standard deviations below the observed mean.
For specimens with 30-degree inclined, curved, multiple
strand tendons, supplementary spiral reinforcement in the anchorage
zone raised cracking loads by only 7 percent. Part of the reason
for this was due to the fact that first cracking for the specimens
in this series occurred beyond the zone of spiral reinforcing, in
the area of maximu~ tendon curvature. The anticipated rise in
cracking load with the addition of the spiral is thus counterbalanced
by the tendency for cracking which occurs due to the multistrand
effects discussed in Sec. 2.2.7. However, model tests of single
strand tendons (see Table 2.10) indicate that if cracking were

69
prevented in the region of maximum curvature (say, by the proper use
of spiral reinforcement in that zone), first cracking would occur in
the anchorage zone at a load approximately 14 percent above that for
a specimen without reinforcement. Figure 2.15 clearly indicates that
passive supplementary reinforcement is significantly less effective
in raising cracking loads for inclined tendon applications than for
straight tendons. However, the ultimate load can be substantially
raised by the addition of spiral reinforcement, although again not
as much as for straight tendon applications. For supplementary
spiral confinement with inclined tendons (at 30°), the ultimate loads
will be conservatively 61 percent and 77 percent above the cracking
load for the unreinforced section for multiple strand tendons and
single strand tendons, respectively. It may be possible to raise the
ultimate capacity of multiple strand tendons still further by the
addition of supplementary spiral reinforcement in the region of
maximum curvature, but no experimental verification of this is avail
able at present. The design of such reinforcement is discussed in a
later section. For tendons inclined at angles other than 30°, it
would seem reasonable, pending further experimental study, to assume
a linear variation in the increases in cracking and ultimate loads
between the sets of values given for straight and 30° inclined
tendons.
The percentage increases stated above reflect the observed
mean less two standard deviations for each grouping. Spiral rein
forcement is assumed to be designed in accordance with the method
described in Ref. 2 which suggests a minimum confinement similar to
an ACI column spiral. Design procedures and recommendations for
spirally reinforced anchorage zones are summarized in Chapter 3. The
method will be illustrated in an example in Chapter 3. Data for
specimens with straight tendons and a width of t = 0.45a were not
used in deriving these values as the spiral used was considered to
be of insufficient diameter for that section. Proper design of the

70
spiral will yield
prototype used in
values of A f /10000 (lb) of about 20 for the s y
this study. The value A for the spiral is deters
mined by the area of spiral steel crossing perpendicular to a hori
zontal plane along the tendon path. Values for other applications
will depend upon spiral diameter, pitch, the post-tensioning load and
the yield strength of the spiral. Increasing the amount of spiral
steel beyond that calculated probably would not greatly modify the
percentage increases given in Table 2.10. Figure 2.16 indicates the
strength gain to be flat-topped for increas amounts of spiral
reinforcement.
2.3.5.2 Orthogonal Reinforcement. While spiral reinforcement
is the most efficient means of providing passive reinforcement in
anchorage zones, it may not always be feasible to use it due to prob
lems of congestion. For such cases, orthogonal reinforcement in the
form of closely spaced closed stirrups, or mats similar to those
recommended by Guyon and shown in Fig. 2.17, is an acceptable
remedial method of raiSing the cracking and ultimate loads.
A study dealing with widely varying amounts of passive rein
forcement in Ref. 2 reveals that heavily reinforced specimens
exhibited only nominally higher cracking and ultimate loads than
those with fairly light amounts of reinforcement. This effect is
summarized in Table 2.9.
As shown in Fig. 2.15 and Table 2 10, for straight tendon
applications orthogonal reinforcement raises the cracking load by
60 percent above the observed cracking load in companion specimens
with no reinforcement. Ultimate failure occurred at loads at least
70 percent above the cracking load for the unreinforced section. No
tests were done to investigate the performance of orthogonal rein
forcement for inclined tendon applications because the spiral was so
clearly superior.

80
70
60
-'iii .lII:
- 50 a. CJ) -........
10
o
t = .450
~SPIRAL t = .30
ORTHOGONAL t = .30
t = .30 t =.450
I I I
10 20 30 40 50 TOTAL As fS (kips)
Fig. 2.16 Normalized ultimate loads--reinforcement series
71
60

72
Mesh reinforcement immediately behind anchors
Fig. 2.17 Anchorage zone reinforcement design as per Guyon (from Ref. 5)
Figure 2.15 shows the relative insensitivity of the anchorage
zone to massive amounts of orthogonal reinforcement, both for crack
ing am ultimate loads. Following an initial rise both curves flatten
out.
2.3.6 Active Reinforcement Effects. For most practical
situations, the inclusion of passive reinforcement in the form of
spirals will be the most convenient method of anchorage zone rein
forcement. However, in situations where complete preveation of
cracking is desirable, the use of lateral prestress in the anchorage
zone offers the designer a powerful tool. Perhaps the most important
need for the use of lateral prestressing occurs when, due to geometric
limitations or construction schedules which require stressing before
the concrete has reached its maximum tensile strength, it is not pos
si.ble to provide a section which would remain uncracked at service
load using passive reinforcement. In such cases, by judicious use of
lateral prestress the cracking load can be raised significantly.
Test specimens FS5A and FS5B and the results of the
three-dimensional finite element analysis indicated the following:
(1) The optimum location for the lateral prestress load is as
close to the loaded face as is feasible, as shown in Fig. 2.18.

PLPT
3/2 dLPT
- MIN. COVER TO LOAD <t.
2a f----
lL........---... I
2a = ANCHOR WIDTH
(a) LATERAL COMPRESSIVE STRESS ALONG AB ~ LPT la·t
0 0
I I
I
I
\1', 1'1/
0 0 0
~ ..... __ TWIN GROUTED TENDONS
c: p c: ;:0
SYMMETRICAL ABOUT D UCT WILL CTION.
SO THAT NO MOMENT BE SET UP IN WEB SE
(b) TYPICAL IMPLEMENTATION IN ACTUAL BOX SECTION WEB TO AVOID MOMENT SET UP.
Fig. 2.18 Lateral post-tensioning details
73

74
(2) For a lateral post-tension load of 60 kips (100 psi nominal
lateral precompression of the web over a length equal to one-half of
the section depth ~ee Fig. 2.l8a] for the prototype section of this
study) placed at the optimum location, the cracking load was observed
to be 33 percent higher than that for an identical specimen without
supplementary reinforcement (active or passive). Cracking occurred
on a plane following the tendon path, but slightly above it and
extended from the loaded face to the web-flange junction. Crack width
measurements indicated that the crack initiated in the region of
maximum curvature where the widest cracks were observed. Thus, first
cracking appeared at a load somewhat lower than that predicted by the
program.
(3) Given that the inclined, curved, multirle strand tendon appears
to be the worst case for design, it can be seen in Fig. 2.15 that
lateral post-tensioning offers the most effective means of raising
both the cracking and ultimate loads. Although no LPT tests were
done for straight tendons, it seems reasonable to assume that its
performance relative to the spiral will be similar.
(4) As only one test was performed with the lateral
post-tensioning load at the optimum location, estimates of the
expected standard deviation were calculated from the mean variance
of the other tests dealing with reinforcement effects. By sub
tracting twice this deviation from the observed values, the allowable
increase in cracking load shown in Table 2.10 was 25 percent above
that for the unreinforced curved tendon section. Likewis~ the
ultimate load increase is 97 percent above that for the unrein
forced section. These values pertain to the inclined, curved,
multiple strand tendon pattern.
Several additional important points should be made concerning
the implementation of lateral post-tensioning (LPT) in practical
situations. Upon first consideration it might be assumed that

75
shrinkage and creep losses would be a severe deterrent to the use
of lateral post-tensioning, owing to the short length of the tendon.
For the case of a segmental bridge using precast box sections (one
of the most likely situations to need LPT), three considerations make
LPT highly practical and easy to implement:
(1) Since most segmental bridges are now built using fast-track
procedures, the precast box segments are constructed well before
they are erected. This reduces shrinkage problems to a minimum,
since nearly all losses due to shrinkage occur in the first 100 days
from the date of casting.
(2) A lateral prestress load capable of raising the cracking
load by 33 percent only required 100 psi compression across the web
section. At this pressure, creep losses are small.
(3) Losses at the LPT anchorage due to slip associated with
seating the chucks can be minimized by using a positive seating
method such as a secondary jack for pressing the wedges in before the
load is released from the stressing jack. Alternatively, threaded
bar-type tendons with lock-off nuts can be used.
Grouted tendons are recommended to prevent possible loss of
the tendon should a failure occur at the anchorage sometime after
stressing.


C HAP T E R 3
DESIGN CRITERIA AND PROCEDURES
3.1 Introduction
The design engineer has two general approaches available for
the design of post-tensioned anchorage zone reinforcement. These
are:
(1) To design the section geometry and supplementary anchorage zone reinforcement so that cracking will not occur at maximum stressing load levels.
(2) To allow anchorage zone cracking to occur during stressing but to provide proper reinforcement so that crack widths at the stressing load will not exceed an allowable value selected to minimize the possibility of water penetration and corrosion.
In either case the anchorage ultimate load capacity must be
kept well above the cracking load to ensure adequate safety and to
give warning of structural distress well in advance of failure.
In this chapter specific methods of predicting cracking and
ultimate loads are presented based on a comprehensive regression
analysis of the test data and on the indications of the 3D-FEM
analysis procedures. A limit state design philosophy with appropri
ate factors of safety for cracking and ultimate loads is presented.
Suggested code and commentary language is presented and several
design examples are included to illustrate the procedures suggested.
3.2 Cracking Load Prediction
A step-wise linear regression analysis considering all
geometric variables in the test program was performed using the
results [2] of the 20 tests for which no supplementary anchorage
zone reinforcement was provided. Both model and full-scale data
were included.
77
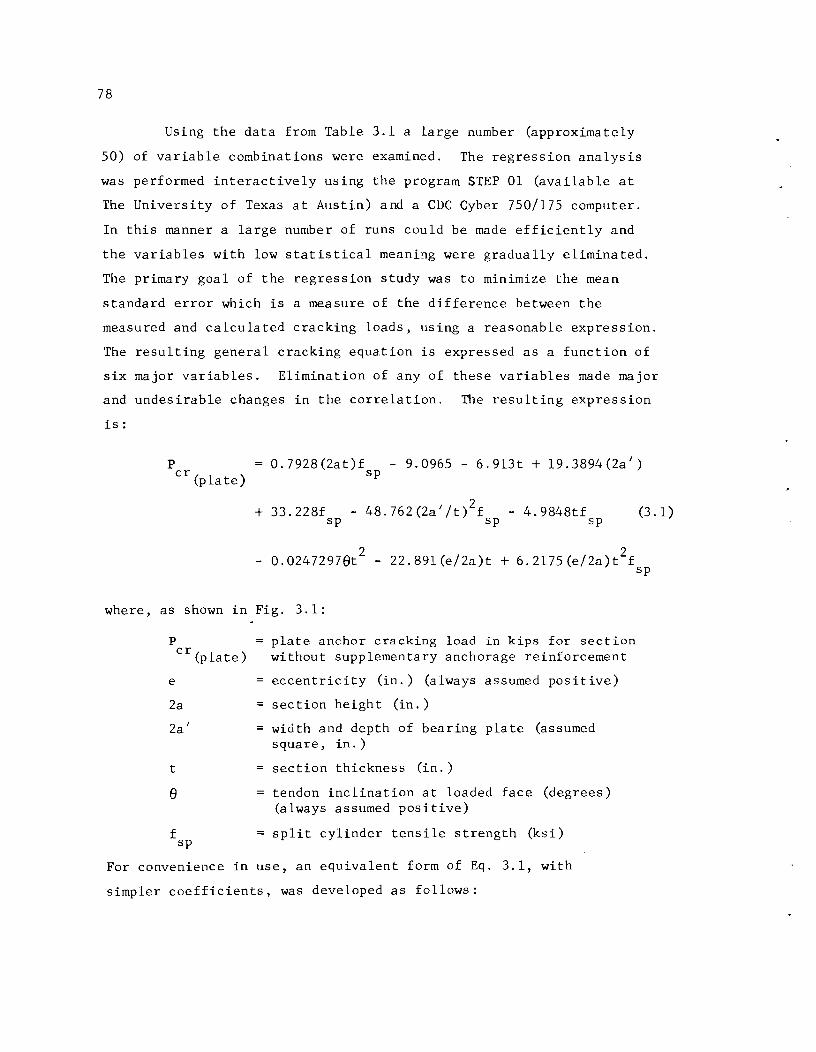
78
Using the data from Table 3.1 a large number (approximately
50) of variable combinations were examined. The regression analysis
was performed interactively using the program STEP 01 (available at
The University of Texas at Austin) and a CDC Cyber 750/175 computer.
In this manner a large number of runs could be made efficiently and
the variables with low statistical meaning were gradually eliminated.
The primary goal of the regression study was to minimize the mean
standard error which is a measure of the difference between the
measured and calculated cracking loads, using a reasonable expression.
The resulting general cracking equation is expressed as a function of
six major variables. Elimination of any of these variables made major
and undesirable changes in the correlation. The resulting expression
is:
p cr
(plate) 0.7928(2at)f - 9.0965 - 6.913t + 19.3894(2a')
sp
+ 33.228f - 48.762(2a'/t)2 f - 4.9848tf sp sp sp
(3.1)
- 0.0247297Bt2
- 22.891(e/2a)t + 6.2175(e/2a)t2
f sp
where, as shown in Fig. 3.1:
p
e
cr (plate)
2a
2a'
t
B
f sp
plate anchor cracking load in kips for section without supplementary anchorage reinforcement
eccentricity (in.) (always assumed positive)
section height (in.)
width and depth of bearing plate (assumed square, in.)
section thickness (in.)
tendon inclination at loaded face (degrees) (always assumed positive)
split cylinder tensile strength (ksi)
For convenience in use, an equivalent form of Eq. 3.1, with
simpler coefficients, was developed as follows:

79
TABLE 3.1
REGRESSION ANALYSIS DATA
Case Specimen P t 2a' f 2a e 9 cr sp
1 l-1R1A 39 3 2.625 0.723 20.5 0 0 2 MR1B 43 3 2.125 0.725 20.5 0 0 3 MIlB 41 3 2.125 0.697 20.5 0 0 4 1-112 30 3 2.625 0.582 20.5 0 30 5 FS1A 400 12 8.5 0.451 82 0 0 6 FS1B 400 12 10.5 0.401 82 0 0 7 FS2B 330 12 10.5 0.455 82 0 30 8 H7A-4 15 3 2 0.327 20 3 0 9 M7C-4 32 3 2 0.548 20 3 0
10 M1A-4 18 3 2 0.495 20 6 0 11 M8B-4 31 3 2 0.707 20 6 0 12 Ml-2 43 4 2 0.627 20 0 0 13 M2-2 34 3 2 0.627 20 0 0 14 M3-2 24 2 2 0.627 20 0 0 15 M3-2R 18 2 2 0.460 20 0 0 16 M2A-4 22 4.5 2 0.495 20 6 0 17 M1A-4 18 3 2 0.495 20 6 0 18 FS2A 440 12 10.5 0.532 82 0 15 19 Ml-3 28 3 2 0.610 20 0 30 20 M2-3 32 4.5 2 0.637 20 0 30
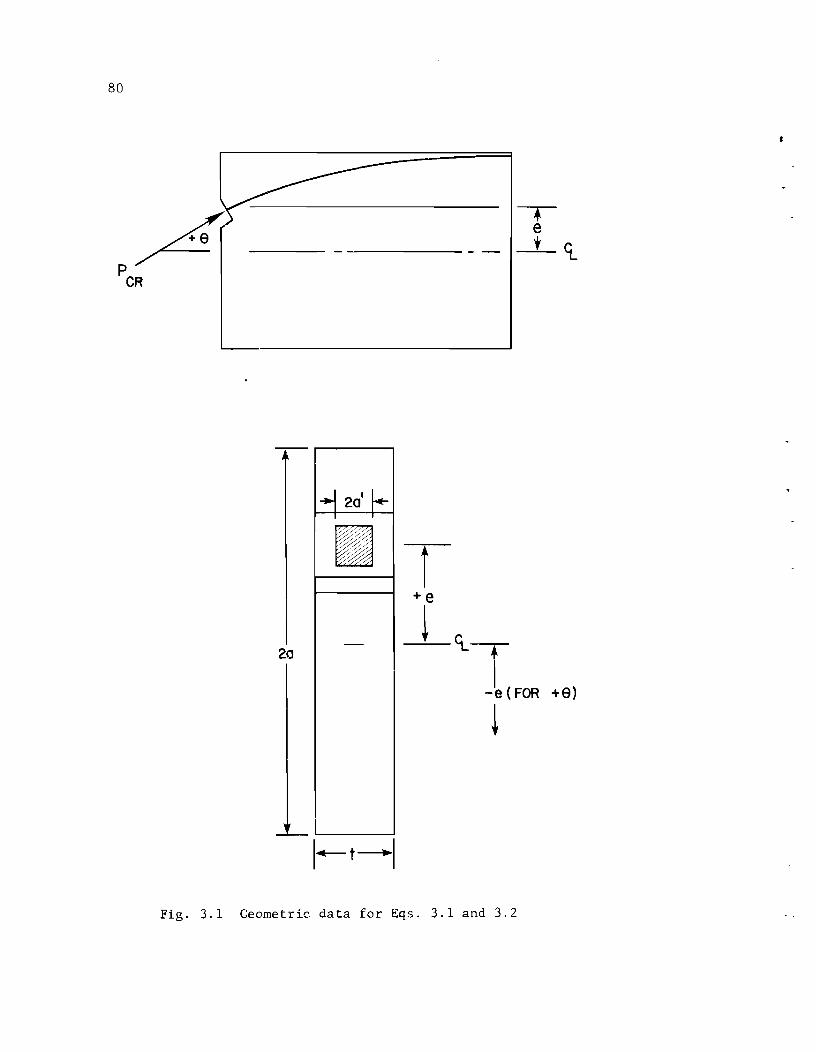
80
I.J 201 l.-
I
IJ
20
i +e
t <t-
.e
_t_ <t.
i -e (FOR +9)
~
Fig. 3.1 Geometric data for Eqs. 3.1 and 3.2

Pcr = {:~P(38a (plate)
103 - -(e/a)
9
t - 120) - 81[28 -252(e/a)fspJ
f 39a' + ~[166 - 975(a7t)2 J - 9.1
5
81
(3.2)
To demonstrate the accuracy of Eq. 3.2, Table 3.2 compares
the measured experimental cracking load against the calculated value.
The mean of P (test)/P (calculated) was 1. 004 with a standard cr cr
deviation of 0.072. As an external check, Eq. 3.2 was used to cal-
culate the expected cracking loads for a number of physical specimen
tests performed by Cooper [3J and Berezovytch [12J. The results
are shown in Table 3.3. For the 16 comparisons made of these inde
pendent tests, the mean value of P (test)/P (calculated) was 1.127, cr cr
indicating a moderate conservatism in the calculated values. The
standard deviation was 0.23, which is high but not unreasonable given
the expected scatter for tests which depend heavily on the tensile
strength of concrete specimens.
Equation 3.2 can be used to predict the plate anchor load
which will cause c~acking in a section without supplementary anchorage
zone reinforcement. For those sections which do have supplementary
anchorage zone reinforcement, either passive or active, the expected
increase in cracking load above that calculated from Eq. 3.2 can be
obtained by using the appropriate factor from Table 2.10. This will
be discussed further in Sec. 3.2.2.
Equation 3.2 was developed from test results for bearing or
plate-type anchors. The results from Eq. 3.2 should be modified
for "be 11" and "cone" type anchors. Tes t resu 1 ts reported in Ref.
2 indicate the following factors are appropriate:
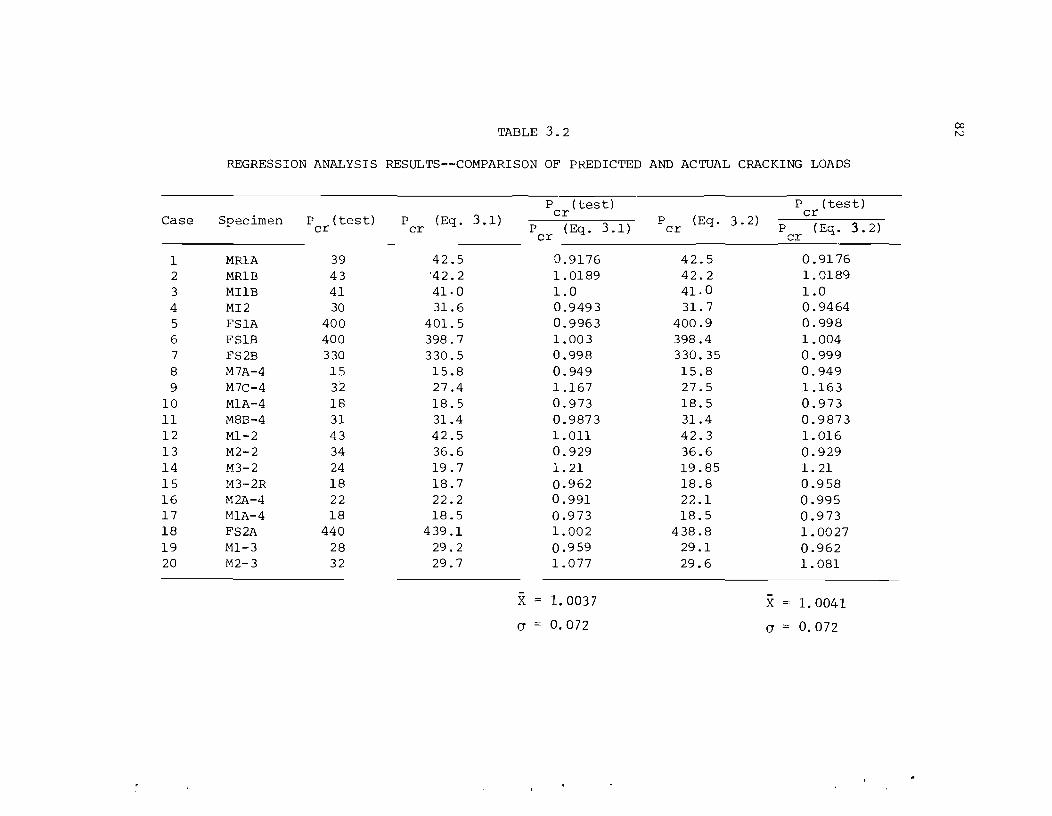
TABLE 3.2 co N
REGRESSION ANALYSIS RESULTS--COMPARISON OF PREDICTED AND ACTUAL CRACKING LOADS
P (test) P (test) Case Specimen P (test) P (Eq.3.1)
cr P (Eq. 3.2)
cr cr cr P (Eq.3.1) cr P (Eq. 3.2)
cr cr
1 MRlA 39 42.5 0.9176 42.5 0.9176 2 MRIB 43 '42.2 1.0189 42.2 1.0189 3 MIlB 41 41·0 1.0 41.0 1.0 4 MI2 30 31.6 0.9493 31. 7 0.9464 5 FSIA 400 401. 5 0.9963 400.9 0.998 6 FSIB 400 398.7 1.003 398.4 1.004 7 FS2B 330 330.5 0.998 330.35 0.999 8 M7A-4 15 15.8 0.949 15.8 0.949 9 M7C-4 32 27.4 1.167 27.5 1.163
10 MIA-4 18 18.5 0.973 18.5 0.973 11 M8B-4 31 31.4 0.9873 31.4 0.9873 12 Ml-2 43 42.5 1.011 42.3 1.016 13 M2-2 34 36.6 0.929 36.6 0.929 14 M3-2 24 19.7 1. 21 19.85 1. 21 15 M3-2R 18 18.7 0.962 18.8 0.958 16 M2A-4 22 22.2 0.991 22.1 0.995 17 MIA-4 18 18.5 0.973 18.5 0.973 18 FS2A 440 439.1 1.002 438.8 1.0027 19 Ml-3 28 29.2 0.959 29.1 0.962 20 M2-3 32 29.7 1.077 29.6 1.081
-X 1. 0037 X 1. 0041
cr 0.072 cr 0.072
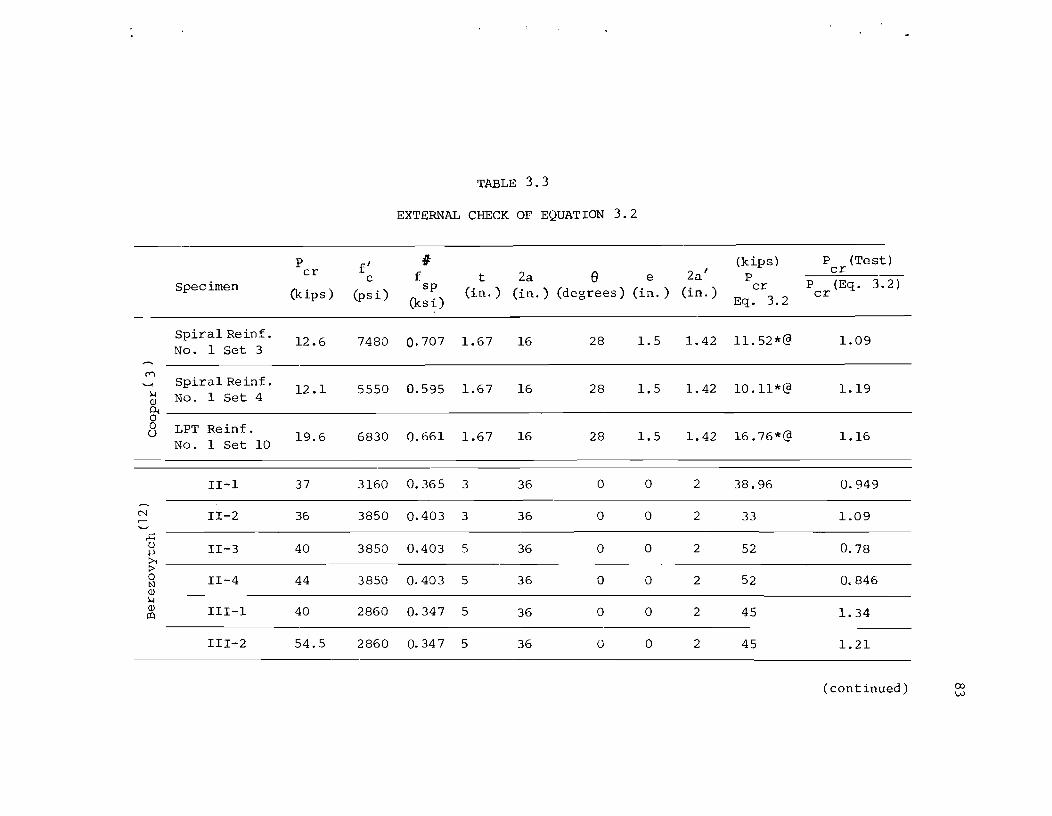
TABLE 3.3
EXTERNAL CHECK OF EQUATION 3.2
P f' # (kips) P (Test) cr f 2a e 2a' cr
c t e P P (Eq. 3.2) Specimen (kips) (psi)
sp (in. ) (in.) (degrees) (in. ) (in. ) cr
cr (ksi) Eq. 3.2
Spiral Reinf. 12.6 7480 0.707 1.67 16 28 1.5 1.42 11. 52*@ 1.09
No. 1 Set 3
C""l Spiral Reinf. .....,
12.1 5550 0.595 1.67 16 28 1.5 1. 42 10.11*@ 1.19 >-I No. 1 Set 4 Q)
0.. 0 0 LPT Reinf. 0 19.6 6830 0.661 1.67 16 28 1.5 1.42 16.76*@ 1.16
No. 1 Set 10
II-l 37 3160 0.365 3 36 0 0 2 38.96 0.949
N II-2 36 3850 0.403 3 36 0 0 2 33 1.09 M
.r:: u II-3 40 3850 0.403 5 36 0 0 2 52 0.78 .p
~ 0 II-4 44 3850 0.403 5 36 0 0 2 52 0.846 N Q)
>-I Q) III-l 40 2860 0.347 5 36 0 0 2 45 1. 34 p:)
III-2 54.5 2860 0.347 5 36 0 0 2 45 1.21
(continued) OJ w
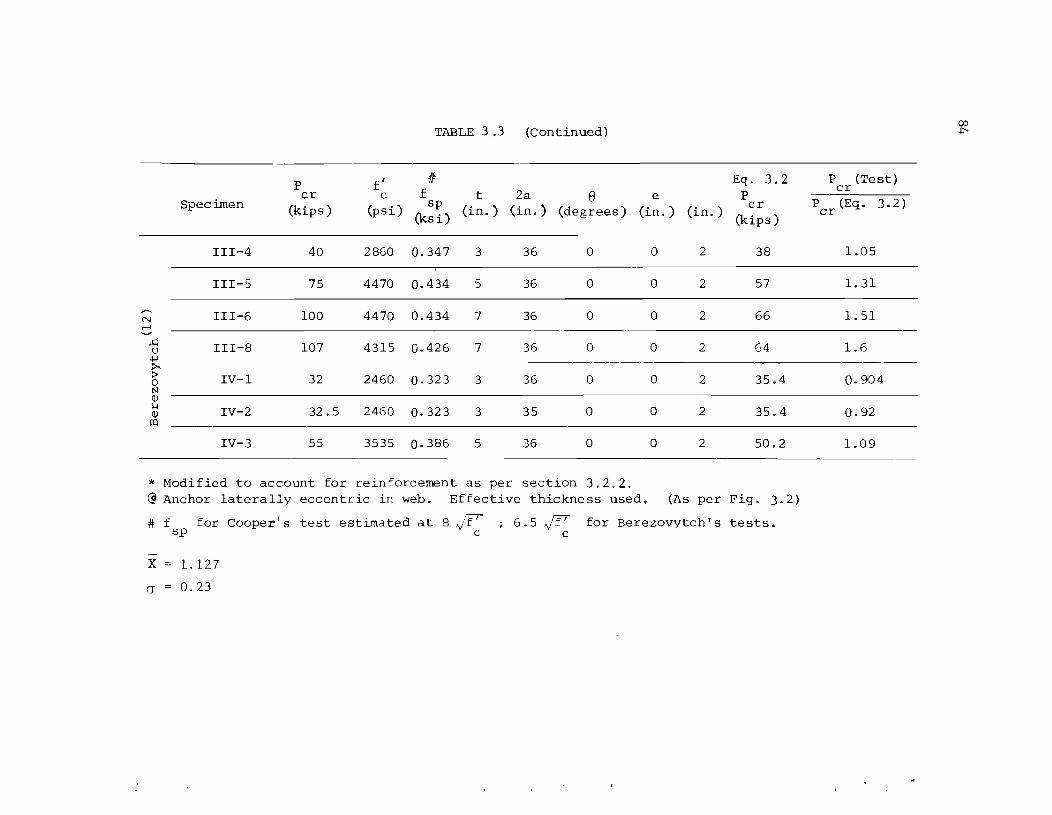
TABLE 3.3 00
(Continued) -i"
p f' If: Eq. 3.2 P (Test) f 2a
cr cr c t 8 e p
Specimen (kips) (psi) sp
(in. ) (in. ) (degrees) (in. ) (in. ) cr P (Eq. 3.2)
(ksi) (kips) cr
III-4 40 2860 0.347 3 36 0 0 2 38 1.05
III-5 75 4470 0.434 5 36 0 0 2 57 1. 31
N III-6 100 4470 0.434 7 36 0 0 2 66 1. 51 ~
..c:: III-8 107 4315 0.426 7 36 0 0 2 64 1.6 u .j.I !>; :> IV-l 32 2460 0.323 3 36 0 0 2 35.4 0.904 0 N iJ)
~ IV-2 32.5 2460 0.323 3 35 0 0 2 35.4 0.92 iJ)
co
IV-3 55 3535 0.386 5 36 0 0 2 50.2 1.09
* Modified to account for reinforcement as per section 3.2.2. @ Anchor laterally eccentric in web. Effective thickness used. (As per Fig. 3.2)
# f for Cooper's test estimated at 8 yf' ; 6.5 Jf' for Berezovytch's tests. sp c c
X 1. 127
(J 0.23

85
Plate: P 1.00P (3.3a) cr cr
(plate)
Bell: P 1.08P (3.3b) cr cr
(plate)
Cone: P 0.61P (3.3c) cr cr
(plate)
3.2.1 Limitations. Equation 3.3, although intended for
general applications,has certain restrictions due to lack of data in
some areas. These include:
(1) Inclinations are always assumed positive, as are
eccentricities (see Fig. 3.1). Any combination of negative tendon
eccentricity (i.e., below the centroid rather than above it) with
positive tendon inclination or vice versa is not directly covered.
It is likely that in such cases the tendon would have a higher crack
ing load than when both inclination and eccentricity are positive.
However, by using absolute values for angles and eccentricities,
Eq. 3.3 should yield conservative solutions for such problems.
(2) Thin web sections are assumed. The limits of the experimental
and computer data are for 0.05 ~ t/2a ~ 0.25.
(3) Multiple tendons anchored in the same web section are not
covered. Limited experimental evidence [2] indicates further con
servatism is warranted.
(4) The anchorage is assumed to be square. Until further
information is available, the shorter edge distance should be used
for 2a' when rectangular anchors are used (see Fig. 3.2d).
Although not specifically tested in this study, several
practical applications should be soluble using Eq. 3,3, and proper
consideration cf the geometry. These are:

86
(0) LATERALLY ECCENTRIC ANCHOR (b) EDGE ANCHOR SUBSTITUTE t = 2g in EO 3.2 SUBSTITUTE t= 2g in Ea. 32
1-2g--1 (1 = 2~ )
(d) RECTANGULAR h: PLATE • ANCHORS --12a'~.
• NT, <1..-- -u- r
20'< 2b'
I 9 1 .1
t=2g -1
(C) MULTIPLE ANCI1():( ACROSS THICK WEB SECTION
(el
SUBSTITUTE t::.2g IN EQ.3.2
2b' < 20' EC.3.2 NOT APPLICABLE
-G..
Fig. 3.2 Special cases for Eq. 3.2
I I
I ;7
/1

(a) Laterally eccentric anchors and edge anchors, particularly in thick web sections.
(b) Multiple anchors across thick web sections.
(c) Rectangular anchor plates oriented such that 2a' < 2b' .
87
These cases are illustrated in Fig. 3.2. Figures 3.2a through c
indicate that a conservative solution should be obtained by replacing
the value t in Eq. 3.2 with the value 2g which equals twice the edge
distance or the distance between the anchors. Strip type rectangular
anchors such as shown in Fig. 3.2e where 2b' < 2a' cannot be
accurately handled by Eq. 3.2 without further experimental or ana
lytical investigation. However, rectangular anchors, such as shown
in Fig. 3.2d, where 2a' < 2b' can be conservatively designed using
Eq. 3.2.
For other complex applications, a more exact solution should
be obtained as described in Sec. 2.2.6 using a linear elastic, three
dimensional finite element analysis, or by further experimental
investigation.
3.2.2 Effect of Supplementary Reinforcement. Cracking loads
calculated from Eq. 3.3 represent the minimum value to be expected
for a normally reinforced section witho~t supplementary anchorage zone
reinforcement. A substantial number of tests dealing with various
supplementary reinforcing methods indicated that cracking loads could
be raised significantly by the addition of such reinforcement
(passive or active). The expected rise in cracking load for a given
type of reinforcement was given in Table 2.10. Using these per
centage increases and assuming a linear variation between the values
for straight and inclined tendons the cracking load for the rein
forced anchorage zone is given by:

88
p' cr
p' cr
p' cr
where
= (2.03 - 0.032B)P Spiral Reinforcement cr
(1. 61 - 0.019B)p Orthogonal Reinforcement cr
= (2.37 - 0.0372B)P Active Reinforcement cr
p' cr
the predicted cracking load with supplemental reinforcement (kips)
B angle of tendon inclination (degrees)
(3.4a)
(3. 4b)
(3. 4c)
p cr
cracking load for the section with no supplementary reinforcement as calculated from Eqs. 3.3 and 3.2.
These equations are valid only for reinforcement amounts and
locations designed in accordance with Sec. 3.5.3.
3.3 Ultimate Strength Prediction
A review of the ultimate load data for specimens without sup
plemental anchorage zone reinforcement shows a considerable amount of
scatter. Some inclined tendon models developed ultimate loads 60
percent above cracking. Most, particularly among the straight tendon
tests, exhibited very brittle behavior with an explosive failure of
the anchorage zone.occurring at a load coincident with or only
slightly above that which caused formation of the tendon path crack.
For this reason the ultimate load for an anchor with no supple
mentary reinforcement should conservatively be equated with the
cracking load. The ultimate load, however, is substantially
increased for sections containing supplementary reinforcement in the
anchorage zone (active or passive), thus prOViding a desirable margin
of safety between cracking and ultimate load. The relative increase
in the ultimate load for a given supplementary anchorage zone
reinforcing method is presented in Table 2.10~ Again assuming a
linear variation between the straight and inclined values from Table
2.10, the ultimate load for a given situation can be calculated as:

p ult
P ult
p ult
where
89
(J.18 - O.OS38)P Spiral Reinforcement (J. Sa) cr
(1. 71 - O.0178)P cr
Orthogonal Reinforcement (J.Sb)
= (3.89 - O.06!+8)P Active Reinforcement (J. Sc) cr
P ult
ultimate load for the supplementary reinforced section (kips)
e P cr
angle of tendon inclination (degrees)
cracking load for the section with no supplementary reinforcement as calculated from Eqs. 3.3 and 3.2 (kips) .
These equations are valid only for reinforcement amounts and
locations designed in accordance with Sec. 3.5.3.
3.4 Limit State Design
In general, when a structure or structural element becomes
unfit for its intended use, it is said to have reached a limit state
[13]. Limit state design is a design process which involves identi
fication of all possible modes of failure (limit states), determina
tion of an acceptable level of safety against occurrence of each limit
state and consideration by the designer of the significant limit
states. Limit states for the post-tensioned anchorage zone fall into
two basic groups:
(1) Ultimate limit states which are related to the structural
collapse of part or all of the structure. Such a limit state should
have a low probability of occurrence since it may lead to loss of
life and major financial losses. Ultimate limit state for the post
tensioned anchorage zone would be evidenced by:
(a) Explosive rupture of the anchorage zone.
(b) Complete side face blow-out of a multiple strand curved tendon at the point of maximum curvature.

90
(2) Damage limit states which are related to damage of the
structure in the form of premature or excessively wide cracks. For
the post-tensioned anchorage zone the damage limit state falls into
two categories:
(a) If the environment is a hostile one (corrosion and freezethaw damage possibilities) formation of any tendon path crack would constitute a damage limit state.
(b) If the environment is nonhostile and minor cracking can be tolerated, the limit state would constitute the load at which crack widths became excessive (greater than about 0.012 in.-0.013 in. as currently implicitly specified).
Since there is less danger of loss of life in the second group, a
higher probability of occurrence can be tolerated than in the case
of the ultimate limit state.
The design philosophy for these two limit state groups is to
arrive at a best estimate of the highest load that will come onto
the structure with respect to a particular limit state. This load is
then multiplied by an appropriate factor of safety which takes into
account possibilities of overload, as well as anticipated variations
in the maximum load due to material tolerances. This new load (with
safety factor included) must be less than the best estimate of the
nominal resistance-of the structure to a particular limit state
multiplied by a strength reduction factor (¢-factor) which takes into
account both the undesirability of a particular type of failure, as
well as the possibility of material and construction defects (sub
standard concrete, e.g.). Expressed in equation form:
where
(PLS
) (L. F .) ~ ¢ p nom
LS
(3.6)
the best estimate of the highest load to come onto the structure at a particular limit state
best estimate of nominal strength of structure with respect to a particular limit state

L.F. the load factor representing a factor of safety against reaching a particular limit state.
strength reduction factor--accounts for material and construction defects and undesirability of a particular limit sfate.
91
3.4.1 Limit State Design for Cracking. The maximum per
missible specified temporary prestressing load to be applied to any
structure is 0.8f ,that is to say, 80 percent of the guaranteed pu
ultimate tensile strength of the prestressing tendon. Thus P =
0.8f A, where A is the nominal area of the tendon. In practice, pu s s
a 10 percent overload could occur due to a jacking error such as
miscalibration, misreading or overpumping. A 15 percent margin for
error above that would constitute a reasonable factor of safety
against a damage limit state. Thus, the total load factor recom-
mended is L.F. 1.25.
On the other side of the inequality is the cracking load from
Eq. 3.3 with appropriate modification to account for tendon geometry
and supplemental reinforcement. Since Eq. 3.3 was selected as a
lower bound prediction, the variance attached to Eq. 3.3 is rela
tively low, and since quality control is fairly good for prestressed
construction, a ¢-factor of 0.90 is reasonable. Thus
P 2: nom
cr
(P ) (LF) cr
------==-=--¢-- 2:
(1. 25) (0. 8f ) (A ) pu s
(0.90) 1. 10f A
pu s (3.7)
3.4.2 Limit State Design for Ultimate. In general considera
tions of ultimate loading which may come on a structure, there is no
practical bound on the upper limit of the load due to misloading. With
prestressing forces, the tensile strength of the tendon imposes a prac
tical upper bound. For the ultimate limit state, the nominal maxi-
mum stressing load on the structure would be the nominal ultimate
capacity of the prestressing tendon (l.Of A). However, this is pu s
not the best estimate of the highest load which could come onto the
structure. Mill reports and metallurgist recommendations indicate

92
that the actual steel area for a given tendon could be as much as
2.4 percent above the nominally specified cross-sectional area.
Likewise, prestressing steel with a nominally specified ultimate
strength of 270 ksi may reach 300 ksi maximum, representing an 11.1
percent rise in strength. Both of these values constitute upper
bound limits, ones highly unlikely to occur simultaneously for all
tendons in practice. An additional consideration, hard to quantify,
is the possibility of a greater number of strands being used than the
number specified. This chance seems remote. An appropriate load
factor which would account for these effects for ultimate would seem
to be about 1.20. This is the value used by CEB-FIP for tendon
force. Given the same material and construction quality as before,
the capacity reduction factor for ultimate failure should be lower
than for cracking, as an explosive anchorage failure may have a
disastrous effect on the integrity of the overall structure. For
this brittle-type failure, a value of ¢ = 0.75, similar to that used
for spiral columns, is recommended. The design check for ultimate
is thus:
P > nomult .
1.2 X f A pu s
0.75 1. 60f A
pu s (3.8)
3.4.3 Application of Limit State Philosophy. It is antici
pated that the application of a reasonable limit state philosophy to
post-tensioned anchorage zones will be a controversial subject. A
cracking criterion based on a design tendon force of 1.10 fA, as pu sp
suggested in Sec. 3.4.1, at first glance seems wildly conservative in
an industry which takes pride in "load testing" every structure dur
ing the post-tensioning process. Yet it is just this "load-testing"
that makes the requirement so important. Almost every tendon is
loaded to approximately 0.8f A during jacking. With errors in ram pu sp
calibration, pressure gauges, and human fallibility, certainly some
are loaded beyond that point and probably more than 10 percent beyond.
The remaining difference is the "margin of safety" which must not only

account for possible dimensional errors, material understrengths
and constructional bloopers like honeycombing, but must provide for
the wide variability associated with the imprecision of our knowl
edge and the general variability of concrete tensile properties.
It is even more important to focus on the ultimate state.
The tendon can be called on to develop its full tensile capacity
if the structure is overloaded. This tensile capacity is not the
guaranteed minimum tensile strength but the actual tensile strength
based on actual (not nominal) area and actual tensile properties.
The failure of an anchorage may be sudden, explosive, and devas
tating. A suitable reserve should be provided. The values sug
gested are actually less than we accept for a ductile beam failure
because of the higher confidence in the level of load.
93
Traditionally in the United States, a consistent design
philosophy has not been applied to the anchorage zone. These load
levels seem high when compared to what we have used. In the CEB-FIP
criteria they have been more realistic. They require a load factor
on prestress forces of 1.2 and resistance factors on concrete in the
anchorage zone of 1.5. Thus, the comparable ultimate load when
adjusted for variations in concrete quality control would be
equivalent to 0.8f A pu sp
x 1.2 X 1.5 X 1.10 = 1.58 f A pu sp
which is very
close to the 1.60 f A pu sp
recommended. Therefore, the limit states
recolOOlended are not revolutionary but represent more of a world norm.
3.5 Design Criteria
The various factors affecting the design of post-tensioned
anchorage zones in Refs. 1 and 2 and the preceding chapters are
restated in terms of specific design criteria in this section. A
complete design may follow one of two routes; to not permit any
cracks at all to form at service loads, or, alternatively, to
permit the formation of cracks at service load but limit their
maximum widths. Both routes must satisfy the serviceability and
ultimate limit state requirements of Eqs. 3.7 and 3.8.

94
3.5.1 Crack Free Design. Although in some instances such
as for interior members the formation of anchorage zone cracks at
service load levels may be acceptable, for the most part they should
not be tolerated for reasons of freeze-thaw durability or corrosion
threats and for general aesthetics. There are two means of achieving
service load level crack free anchorage zone design:
(1) To proportion the segment to remain uncracked with no
dependence on supplementary anchorage zone reinforcement using Eqs.
3.3 and 3.7 while providing sufficient supplementary reinforcement
to satisfy the ultimate strength requirement of Eq. 3.8.
(2) If, due to geometric restrictions the section would not
remain uncracked at the service level stressing load according to
Eq. 3.3, then supplementary reinforcing, either active or passive,
should be used to raise the cracking load to a level which satisfies
the requirements of Eq. 3.7. The expected increase in cracking load
above that given by Eq. 3.3 for a given geometric configuration and
reinforcing scheme is given by Eq. 3.4. A final check must be made
to satisfy the ultimate strength requirement of Eq. 3.8.
3.5.2 Acceptable Crack Design. If for some reason the
requirements of Seetion 3.5.1 cannot be met, it is possible in some
cases to maintain service level crack widths within the general
AASTID-ACI acceptable levels (0.013 in.) through the use of supple
mentary reinforceLlent particularly lateral prestressing. Due to
scatter in the experimental crack width data the assessment of
allowable load increases beyond cracking load is difficult. The fol
lowing data were obtained from examination of Tables 2.11 and 3.4 in
Ref. 2.

where
X a X-a X-2a
Straight tendons with spiral reinforcement 36% 14% 22% 8%
Inc lined tendons with spiral reinforcement 51% 26% 25% 0
Inclined tendons with 100 psi lateral post-tensioning 25% 5% 20% 15/0
x the mean percent increase in load above the cracking load before crack widths begin to exceed 0.013 in.
95
The values for the full-scale inclined tendon specimens were
calculated from crack width data measured within a distance of 4a'
from the loaded face, thus inside the range of influence of the sup
plemental reinforcement. Crack widths at the point of maximum tendon
curvature were generally wider at a given load, but since no sup
plementary reinforcement was provided at that location the results
were not usable. Selection of one standard deviation below the mean
values implies that with adequate spirals or lateral post-tensioning,
nominal cracking loads approximately 20 percent above the cracking
loads calculated from Eq. 3.3 can be tolerated with acceptable crack
widths. Specimens with orthogonal supplementary reinforcement
exhibited unacceptably wide cracks at first cracking and thus no
increase is recommended. The more conservative use of a criterion two
standard deviations below the mean would indicate that only lateral
post-tensioning would give a useful increase in cracking load (15
percent) .
Until more extensive experimental evidence is available
concerning crack width control in the anchorage zone, the above
recommendations must be considered very tentative and the prudent
designer should make every effort to use the more certain "no crack"
design procedure of Sec. 3.5.1. Should a large overload occur on a
section designed for no cracking, an additional buffer would be
available (20 percent) before the section would experience severe
cracking distress.

96
3.5.3 Design of Supplemental Reinforcement. In order to
obtain the strength increases indicated in Eqs. 3.4 and 3.5, sup
plementary anchorage zone reinforcement must meet certain minimum
requirements.
3.5.3.1 Spiral Reinforcement. Spiral reinforcement for the
anchorage zone should be proportioned to ensure that the spiral con
finement is sufficient to confine early cracking. In keeping with
the general philosophy of limit state design, a strength reduction
factor should be applied to the capacity carried by unconfined con
crete. In addition, wherever a spiral is required, an arbitrary
minimum diameter of 1/4 in. is suggested so that a sturdy unit which
will ho ld its shape is furnished. Thus,
A :?: sp
fl - ¢(0.85f~.) -------~- (Ds) :?:
8.2f s
f - 0.6f' 1 c.
0.05s. ~
(3.9)
or for design, A 2 sp
--~~~--~~ Ds :?: 5 f
y 0.05s.
~ (3.9a)
where A sp
= the required cross-sectional area of the rod used to fabricate the spiral
the post-tension design load divided by the area confined by the spiral
4P/n D2 (psi)
f' specified compressive strength of concrete at time of c i stressing (psi)
D overall diameter of spiral (in.)
s pitch of spiral (longitudinal hoop spacing) (in.)
f the allowable stress in the spiral steel = 0.6 f s y
f spiral yield strength y
¢ 0.70 for spiral design
See Fig. 3.3a for details concerning spiral geometry.
For design of a spiral based upon Eq. 3.9a, the following
recommendations are made:

97
S:: PITCH
r.-- fl :: 40' -----III>
fl =4P/1r0 2 (SPIRAL)
(0) SPIRAL
CLOSED STIRRUP
-I S r- S :: SPACING
-0
fl = 4P/1Y0 2 (ORTHOGONAL)
MESH
(b) ORTHOGONAL
Fig. 3.3 Passive reinforcement design

98
(1) The diameter of the completed spiral, D, should be as large
as possible within the confines of the web or slab, while still
satisfying cover requirements. This recommendation is limited to thin
web applications where 0.05 ~ t/2a ~ 0.25. For tendons located near
the side face of thick web sections, the radius of the spiral should
be the edge distance less the required cover. For tendons located in
the center portions of wider webs, the spiral diameter should be the
maximum linear dimension of the anchorage projected bearing surface
(or approximately 2a'~ for square anchors).
(2) The spiral pitch should be as small as possible, but not less
than that required to readily pass the maximum aggregate size used in
the concrete mix. The AASHTO Bridge SpeCifications and ACI Building
Code recommend a minimum spiral clear distance pitch of 1 in. or
1-1/3 the maximum aggregate size for column spirals.
(3) The spiral should begin at the anchor bearing plate and the
minimum length of the spiral should be 4a'. Longer spirals affixed
to the anchor will not raise the cracking load significantly. The
design of spiral reinforcement in regions of tendon curvature to
control cracking due to multistrand effects is discussed in Sec.
3.5.3.4.
3.5.3.2 Orthogonal Reinforcement. For passive reinforcement
applications where spiral reinforcement cannot be used, an orthog
onal grid of closely spaced closed stirrups or a mesh similar to
that shown in Fig. 3.3b may be substituted. Since massive amounts
of orthogonal reinforcement were shown to have little effect in
preventing cracking in the anchorage zone, the required reinforcement
can be calculated by using the same procedure and equation presented
for spiral reinforcement design in Sec. 3.5.3.1. While this may at
first appear unconservative, since it is known that orthogonal rein
forcement is substantially inferior to the spiral, the trends pre
sented in Fig. 2.15 clearly show that addition of substantial rein
forcement beyond that calculated by E~. 3.9 is nonproductive.

99
The only required definition changes from those presented
in Sec. 3.5.3.1 are that the spiral diameter, D, becomes the minimum
lateral dimension of the orthogonal closed stirrup (see Fig. 3.3b).
The desired configurations for confinement are square closed stirrups,
or better, a square mesh as shown in Fig. 3.3b. The s term in Eq.
3.9a becomes stirrup spacing, rather than spiral pitch. All other
recommendations on placement remain the same as for the spiral.
3.5.3.3 Active Reinforcement. For full utilization of the
cracking and ultimate load increases recommended in Eqs. 3.4 and 3.5,
active reinforcement in the form of lateral post-tensioning should be
designed as follows:
(1) LPT (Lateral Post-Tensioning) tendons should be placed as
close as possible to the loaded face and should extend throughout the
height of the web.
(2) LPT load levels should be designed to produce a minimum of 100
psi lateral precompression across the web section after losses. Con
sidering the losses to be expected over the short development length,
initial stressing should provide between 150 and 200 psi precompres
sion. The lateral precompression stress can be estimated as the
total lateral post~tension load divided by a nominal effective area
(at) where a is the half height of the web and t is the web thick
ness (see Figs. 2.18 and 3.6).
(3) LPT tendons should be placed in pairs or as U stirrups with
tendons laterally equidistant from the longitudinal tendon duct
~ee Fig. 2.18) to minimize lateral moments being set up in the web.
(4) LPT tendons should be grouted and should utilize the most
positive seating load lock-off mechanism available.
3.5.3.4 Reinforcement for Multistrand Effects. Although no
tests were performed in this series to investigate the most effective
control measure for multistrand cracking with curved tendons,
previous model tests [14] have shown spiral reinforcement to be an

100
efficient means of control. Until other detailed tests can be
performed, the following design method should produce a conserva
tive solution:
(1) Given the internal diameter of the tendon duct and the num
ber of strands to be used, make a scale drawing of the duct with all
strands placed as close as possible to the concave side of the duct
as would occur when the stressing load is applied. Draw two tangen
tial lines from the center of the duct to the outside of the outer
most strands as in Fig. 3.4a. This defines a.
(2) The radial force per unit length, p, as calculated from Eq.
2.7 (p = p/R) is assumed to be uniformly applied over the duct bear
ing arc length between the two lines scribed during step 1. Q is the
equivalent uniform pressure along the loaded arc segment, as illus-
trated in Fig. 3.4b.
(3) The lateral force that would have to be resisted by spiral
reinforcing, F, as shown in Fig. 3.4c, can be calculated by a simple
equilibrium analysis from ~F = a as: y
where F
a-n/2
(Qsr d~) cos ~ - 2F
-TTl 2
a-n/2
Qsr sin IX
-n/2
Qsr(l - cos Q) = 2F
F Qsr(l - cos IX)
2
a
2F
force to be resisted by the spiral (lbs.)
(3.10)
Q equivalent uniform pressure along the arc segment as calculated in step 2 = 90P
RnQr

TENDON DUCT
O---t---·~
(a) GEOMETRY AT STRESSING LOAD
101
INDIVIDUAL STRANDS
0---+----...,..,;..
+C"A-.!!.. 2
{ b} APPROXIMATE LOADING
r = INSIDE RADIUS OF TENDON DUCT
Q = EQUIVALENT PRESSURE
Q= 90P = _ 90P (l.1Tr Ro<.1Tr
ARC LENGTH = 2 Q(. 21Tr = ~ (oC. in DEGREES) 360 90
0--
ol..
----F
11 2"
(c) EQUILIBRIUM
IF =0 y F = FORCE IN SPIRAL
Fig. 3.4 Spiral confinement for mu1tistrand loading

102
P design post-tension load (lbs.)
R minimum radius of curvature of tendon at critical loca-tion (in.)
r = tendon duct radius (in.)
s = pitch of the spiral (in.)
a = 1/2 the loaded arc angle (degree) but not greater than 90 0
•
If the allowable steel stress in the spiral is given by f = 0.6 f , s y
then the required rod area to be used in fabricating the spiral would
be:
A F ~r {l - cos a)
sp f 2f s s
(3.11)
Using the expression for Q above
45P s(l - cos a) A
TIexRf > 0.05 sq. in. sp
s (3. 12)
The amount of spiral reinforcement needed to resist the
forces set up by the multistrand effect is not excessive. As an
example, a 45° inclined, curved tendon with a minimum radius of
curvature of 143 in, and duct inside diameter of 2-1/2 in., at a
design load of 400'kips, ex = 90° (tendon duct 1/2 full), a spiral
pitch of 2 in., and an allowable steel stress of f = 0.6f s y
0.6(60) = 36 ksi (Grade 60 reinforcement) would require a spiral rod
diameter of 3/16 in. In this case the arbitrary minimum size of a
1/4 in. spiral would govern. The spiral hoop diameter, as previously
mentioned, should be as large as possible while meeting cover require
ments and minimizing placement difficulties.
Spirals to control multistrand effects should be provided
throughout any region where significant lateral forces may be set up.
This may be conservatively estimated as regions where the nominal
shear stress on a horizontal plane through the cover over the tendon
would exceed the usual limiting shear diagonal tension stress of
2/~ This would be where c .
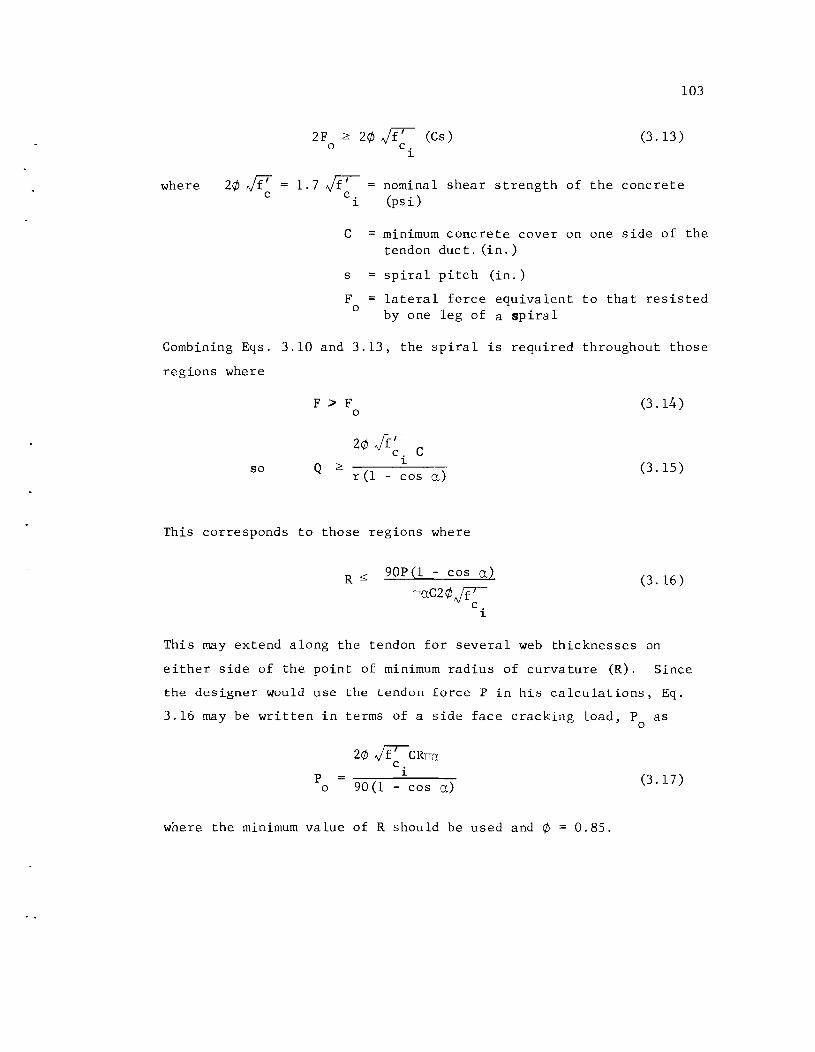
where 2¢ Ji' c
103
2F ~ 2¢ ~ (Cs) o c.
(3.13)
1.7~ c. ~
C
s
F o
~
nominal shear strength of the concrete (psi)
minimum concrete cover on one side of the tendon duc t. (in. )
= spiral pitch (in.)
lateral force equivalent to that resisted by one leg of a spiral
Combining Eqs. 3.10 and 3.13, the spiral is required throughout those
regions where
so
F > F o
2¢ Jf~. C
Q ~
r (1 - cos a)
This corresponds to those regions where
R ~ 90P (1 - cos a)
TTaC2¢~ c. ~
(3.14 )
(3. 15)
(3. 16)
This may extend along the tendon for several web thicknesses on
either side of the point of minimum radius of curva.ture (R). Since
the designer would use the tendon force P in his calculations, Eq.
3.16 may be written in terms of a side face cracking load, P as o
P o
2¢ ~CRrrrr c. ~
90(1 - cos a)
where the minimum value of R should be used and ¢
(3.17)
0.85.

104
To check the general applicability of these expressions,
results of several of the full-scale tests may be examined using
¢ = 1.0 since all properties are known. For example, specimen FS2B
had a 2.5 in. ID duct with a 12 strand 1/2 in. ¢ 270 ksi tendon in a
12 in. wide web. In FS2B the measured P was 330 kips, Pd
. was cr es~gn
400 kips, the minimum R was 191 in., a was 67.5°, f' was 4627 psi and c
r = 1.25 in. Thus
c 12 - 2.5 2
4.75 in.
From Eq. 3.17 with ¢ = 1.0
P o
(2.02.J4"62l<4. 75) Cl912n(67.5) 90 (1 - cos 67.5)
471 kips
Since Pdes = 400 kips < Po no side face cracking near the point of
minimum radius of curvature would be expected until after anchorage
zone cracks had appeared. Similarly, use of Eq. 3.16 would indicate
R to be 162 in. Since the minimum R was 191 in., R > R so no sup-o 0
plementary spiral in the area of maximum curvature is needed. Speci-
men FS2B did crack in the anchorage zone at 330 kips and did not
experience initial-side face distress.
For FS4A, first cracking occurred at 400 kips and was
definitely due to multistrand effects. A 17 strand 1/2 in. ¢ 270
ksi tendon was used in a 12 in. wide web. The original ductwork was
removed to provide extra space so that r = 1.5 in., C = 4.5 in.,
~ = 90° for this case, f' was 5200 psi and minimum R = 178 in. Thus c
from Eq. 3.17 with ~ = 1.0
P o
~(4.5)(178)n(90) 90(1 - cos 90)
363 kips

105
Since P = 567 kips> P des 0 initial
cracking would be expected to
occur in the region of maximum curvature. The 400 kip level at
which the cracking occurred is in good agreement with P. Equation o
3.16 indicates R o
to be 278 in. Since the minimum R was 178 in.,
a spiral is required in the tendon curvature zone.
In design applications the side face cracking limit state
should be checked by using P from Eq. 3.7 for P in Eq. 3.17 nom cr 0
with ¢ = 1.0 in that expression. In reality such a calculation is
only a crude approximation. To achieve ultimate rupture, failure
must occur on at least two radial planes connected to the duct (see
Fig. 2.8c). This would tend to raise the capacity. Likewise, the
use of the value ~ for the limiting shear strength of the con-c
crete in this type application is a very approximate and conservative
value. However, the results indicate the use of this model is
reasonably consistent with test results. In view of the seriousness
of this type failure the provision of spiral reinforcement in areas
defined by Eqs. 3.16 and 3.17 is a prudent requirement pending further
experimental study.
3.5.4 Anchor Bearing Area. Both the experimental and the
analytical results .shown in Fig. 2.13 indicated that the cracking load
is relatively insensitive to appreciable changes in bearing area and
that bearing stress should not be the primary criteria for anchorage
zone design. However, it is a useful tool in sizing anchor plates
and web thicknesses. In addition, all tests in this investigation
were short-term tests and did not reflect possible creep effects at
extremely high stressing levels.
Comparison of the results of this study with the various
specification trends indicated in Fig. 2.13 show that agreement is
much better when an increase in anchorage bearing stress is allowed
for increased concrete surrounding the anchor. Thus, AASHTO should
consider adoption of an expression similar to ACI and CEB-FIP. As

106
suggested in Sec. 2.3.3, an effective bearing stress design criterion
for post-tensioned anchorages is:
where
f' c. ~
0.8 f' c. ~
~ 1. 33 f' c.
(3.18) ~
permissible concrete bearing stress under the anchor plate of post-tensioning tendons
= bearing area of anchor plate
= maximum area of the portion of the anchorage surface that is geometrically similar to, and concentric with, the area of the anchor plate
= compressive strength of concrete at time of initial prestress.
3.6 Suggested Code or Specification Requirements
The general des criteria and recommendations contained in
Sees. 3.4 and 3.5 are difficult to reduce to simple, concise language
suitable for direct inclusion in tions such as the AASHTO
Specifications or the ACI Building Code. The provisions are best
expressed as general performance requirements in the Specification
or Code but with accompanying commentary indicat
satisfying the performance requirements.
possible ways of
Section 3.6.1 contains suggested performance requirements and
Section 3.6.2 provides more detailed commentary text to assist
des and fabricators in meeting these requirements.
3.6.1 Code Provisions
A.O Notation
A ps
f pu
= nominal area of post-tensioning tendon (in.2
)
= specified tensile strength of prestressing tendons (psi)

107
A.l Post-Tensioned Tendon Anchorage Zones
A.l.l Reinforcement shall be provided where required in tendon anchorage zones to resist bursting, splitting, and spalling forces. Regions of abrupt change in section shall be adequately reinforced.
A.l.2 End blocks shall be provided where required for support bearing or for distribution of concentrated prestressing forces.
A.l.3 Post-tensioning anchorages and supporting concrete shall be designed to resist maximum jacking forces for strength of concrete at time of prestressing.
A.l.4 Post-tensioning anchorage zones shall be designed such that the minimum load producing cracking along the tendon path shall be at least equal to 1.10 f A
pu ps
A.l.S Post-tensioning anchorage zones shall be designed such that their minimum strength shall be at least equal to 1.60 f A
pu ps
A.l.6 Supplementary anchorage zone reinforcement required for control of cracking or development of minimum strength may consist of passive reinforcement such as spirals or orthogonal closed hoops or mats. Active reinforcement such as lateral posttensioning may be used.
A.l.7 Supplementary reinforcement such as spirals shall be provided to resist web face rupture in regions of high tendon curvature when multiple strand tendons are used.
A.l.B Unless structural adequacy is demonstrated by comprehensive tests or a more comprehensive analysis, anchorage bearing stress at 1.1 f A shall not exceed
where
f' c. ~
pu ps
0.8f~.~A2/Al ~ 1.33f' ~ c i
maximum concrete bearing stress under the anchor plate of post-tensioning tendons
bearing area of anchor plate
maximum area of the portion of the anchorage surface that is geometrically similar to, and concentric with, the area of the anchor plate.
compressive strength of concrete at time of initial prestress.

108
3.6.2 Commentary
C.A.l The general problems of anchorage of post-tensioned tendons are significantly different from the development of pretensioned reinforcement. Items c.oncerning pretensioned element anchorage zones such as now included in AASHTO Sec. 1.6.15 should be put in a separate section.
C.A.l.l This general performance statement alerts the user to the fact that the actual stresses around post-tensioning anchorages may differ substantially from those obtained by means of usual engineering theory of strength of materials. Consideration must be given to all factors affecting bursting, splitting, and spalling stresses. A refined strength analysis should be used whenever possible considering both the cracking and ultimate limit states.
C.A.l.2 Where convenient, widening of the anchorage region to distribute the high localized forces is an effective way of reducing bursting and spalling stresses and raising the cracking and ultimate capacities. The effect of increased width is indicated in Eq. A in Sec. A.l.4.
C.A.l.3 In application of all anchorage zone design the level of prestress applied and the concrete strength at time of application must be considered. This is particularly important with stage prestressing.
C.A.1.4 It is highly desirable that the anchorage zone remain uncracked at service levels to protect this vital area from corrosive and "freeze-thaw deterioration" This can be ensured by proportioning the anchorage zone so that the cracking load is greater than any anticipated stressing load. In this proportioning the anchor zone can be designed to remain crack free without supplementary anchorage zone reinforcement by use of Eqs. A through 1). The zone can be designed to remain surface crack free through provision of supplementary reinforcement which will raise the level of the cracking loads as indicated by Eqs. E through G. The service load level specified 1.10 f A contains allowances for jacking errors, material toleranceR~ ps and a margin of variability.
C.A.l.4.l Cracking Loads. The cracking load for thin web post-tensioned sections without supplementary anchorage zone reinforcement can be determined for certain conditions as:

109
p cr
252 (e/a)f ] sp
103(e/a) 9 = t[:ZE(3sa 120): --8~[2e
+ 39a' + ~[166 - 975 (a' /t)2] - 9.1 5
where p cr
cracking load in kips
e
2a
2a'
t
e f sp
= tendon eccentricity (in.)
section height (in.)
width of anchor plate (assumed square, in.)
= section thickness (in.)
tendon inclination at loaded face (degrees)
split cylinder tensile strength (ksi) may be estimated as 6.5 Jt; psi)
All variables are illustrated in Fig. A.1 (Fig. 3.1 in text, not repeated). Limitations on the use of Eq. A assume
a. e, e are both positive as defined in Fig. A.1 b. 0.05 ~ t/2a ~ 0.25 c. anchors are assumed square, plate type d. single tendon anchored in the web.
~)
The equation can be easily extended to other practical applications as shown in Fig. A.2 (Fig. 3.2 in text, not repeated).
For sections which do not meet the above criteria cracking loads can be obtained using three-dimensional finite element analysis techniques, or by comprehensive physical tests.
The cracking load can be calculated from a threedimensional finite element computer analysis which has been calibrated to extensive physical tests. One such calibration indicates:
1. The maximum spa11ing strain (transverse tensile strain parallel to the loaded face) at the anchor plate edge must be calculated. For most cases this will require a detailed mesh refinement in the vicinity of the anchor plate edge following a preliminary analysis with a coarse grid. This is particularly necessary for inclined tendon b1ockouts with square corners. Anchorage zone reinforcement need not be modeled for this analysis.

110
2. The peak spalling strain corresponding to a load of 1 kip should be computed. The approximate cracking load (for a section without supplementary reinforcement) can be calculated as follows:
where P
p cr
E 1 kip (FEM)
(1 kip(FEM) (B)
cracking load (kips)
threshold cracking strain (~()
peak spalling strain at plate edge from program with unit post-tension load of 1 kip.
Calibration studies indicate that appropriate values of ( are 172 ~E for plate anchors with straight tendons aga 1092 ~( for plate anchors with inclined tendons in which a right angle blockout is used.
For other than plate bearing-type anchorages, the cracking loads obtained from Eqs. A and B should be modified as follows:
Conical Anchor P 0.61 P (plate) (C) cr cr
Bell Anchor P 1. 08 P (plate) (D) cr cr
These coefficients apply only when the anchorages present approximately t,he same projected bearing area.
In any physical tests to determine cracking loads, the conditions to be expected during construction of the actual structure must be replicated as precisely as possible. These include the effects of tendon eccentricity, inclination, curvature and mUltiple strands, as well as anchor size, section width and height, and supplementary reinforcement,
C.A.l.4.2 Effect or Reinforcement on Cracking --Cracking loads as calculated from Eqs. A through D represent the minimum value to be expected for a section with no supplementary reinforcing in the anchorage zone. The addition of supplementary reinforcing will raise both the cracking and ultimate load. For sections provided with spiral, orthogonal, or active reinforcement designed in accordance with A.l.4.6, the cracking load can be determined as
..

111
Spiral Reinforcement: pi = (2.03 - 0.0328)P cr cr
Orthogonal Reinforcement: pi = (1.61 - 0.019B)p cr cr
Active Reinforcement: pi = (2.37 - 0.0372B)P cr cr
where pi cr
e p cr
cracking load for the reinforced section (kips)
= angle of tendon inclination (degrees)
cracking load for the unreinforced section as calculated above (kips)
(E)
(F)
(G)
C.A.l.S The proper development of the post-tensioning force in unbonded tendons and prior to completion of grouting in bonded tendons is completely dependent on proper anchorage of the tendons. The anchorage capacity must be greater than any anticipated tendon load with a reasonable factor of safety. The capacity specified 1.60 fpuAps contains allowance for tendon tolerances, actual strength range rather than guaranteed minimum strength, and a margin of safety against the explosive type failure which would occur if an anchorage zone failed.
The ultimate load for sections without supplementary anchorage zone reinforcement is conservatively assumed to be equal to the cracking load. With the addition of reinforcement designed according to A.l.6 the ultimate load will be:
No Supplementary Reinforcement: Pult P cr
Spiral Reinforeement: P (3.18 0.OS3B)P ult cr
Orthogonal Reinforcement: P ult (1. 71 0.017B)P
Active
where
cr
Reinforcement: Pult (3.89 0.06408)
Pult 8
P cr
ultimate load for the reinforced section (kips)
angle of tendon inclination (degrees)
cracking load for the unreinforced section as calculated above.
(H)
(I)
(J)
(K)
C.A.l.6 In order to obtain the strength increase indicated in Eqs. E through K, supplementary anchorage zone reinforcement must meet the following minimum requirements.
C.A.l.6.l Spiral Reinforcement--Spiral confinement must be adequate to resist cracking and fully develop the anchorage. To

ll2
ensure a sturdy unit the minimum spiral wire diameter is 1/4 in. Minimum spiral area is
where
A :2: sp
0.6f' c.
----------~~ Ds :2: 5f
y 0.05 si
. 1 . . 1 . 2 sp~ra w~re cross-sect~ona area, ~n.
post-tension load divided by the area confined by the spiral = 4Pt/nD2 , psi
f' = specified concrete compressive strength at time of c. . ~ stress~ng, psi
D overall diameter of spiral, in.
s pitch of spiral, in.
f spiral yield strength. y
In thin webs, the spiral diameter, D, should be as large as possible while still satisfying cover requirements. In general, the spiral diameter should be the maximum linear dimension of the anchor projected bearing surface (the diagonal for square anchor plates). Spiral pitch should be as small as possible but must allow for concrete placement. The spiral should begin at the anchor plate and have a minimum length of twice the anchor plate depth or width, whichever is larger.
C.A.l.6.2 Orthogonal Reinforcement--While spiral reinforcement is usually superior to orthogonal reinforcement, in some applications an orthogonal grid of closely spaced closed stirrups or a mesh of orthogonal bars' may be used. The minimum area of bars in such closed stirrups or meshes should be calculated using the expression given in A.l.6.l with the minimum lateral dimension of the orthogonal closed stirrup or mesh substituted for D and the stirrup spacing substituted for s.
C.A.l.6.3 Active Reinforcement--kateral post-tensioning (LPT) is highly effective as active reinforcement. Such reinforcement should be designed on the following basis:
1. LPT tendons should be placed as close as possible to the loaded face and should extend throughout the height of the web.
2. LPT tendons should produce a m~n~mum lateral precompression in the anchor zone of 100 psi after losses. Initial stressing should provide 150 to 200 psi. The nominal effective area for stress calculation should be taken as the weh thickness times a length equal to half the section height.

3. LPT tendons should be placed in pairs equidistant from the tendon centerline to minimize lateral moments in the web.
113
4. LPT tendons should be grouted and should utilize the most positive seating load lock-off mechanism available.
C.A.l.7 Reinforcement for Multistrand Effects-·-For post-tensioning applications with significant tendon curvatures and with multiple strand tendons, a side face failure mechanism may govern the failure of the section. Any time a loaded tendon follows a curved path, normal and friction forces are set up along the length of the duct. In regions of small radius of curvature lateral forces due to the flattening out of the multi-strand tendon under stressing loads can cause tendon path cracking at loads below those which would initiate cracking in the anchorage zone proper. Such cracking will be likely if
or
where P des P
o
P des 2: P
o
R. ~ R m~n 0
2¢ ~CRTI(), c. ~
90 (1 - cos oJ
90P(1 - cos 0..)
TIo..C2¢ ~ c. ~
P = the minimum cracking design load (1.10 fA) pu ps
side face cracking load
¢ strength reduction factor for shear = 0.85
f' compressive strength of concrete at time of c.
1 stressing, psi
C minimum concrete cover on one side of duct
R minimum radius of curvature of tendon, in.
Ct 1/2 the duct loaded arc angle, degrees (but not more than 90°)
If Pdes 2: Po or Rmin ~ Ro then supplementary reinforcement will be required in the region where R ~ Ro. Since the region of minimum radius of curvature is typically some distance removed from the anchorage zone (and the benefit of the supplemental reinforcement there) additional reinforcement must be provided. This can be accomplished most efficiently through the use of spiral reinforcement designed as follows:

114
1. The radius of curvature along the tendon profile is calculated as;
where x is the dependent vertical variable and z is the longitudinal variable.
Most tendon profiles can be defined by the equation
x Az 3 + Bz2 + Cz + D
The minimum radius of curvature R can thus be calculated.
2. Given the internal diameter of the tendon duct and the number of strands used, make a scale drawing of the duct with all strands placed as close as possible to the concave side of the duct as would occur when the stressing load is applied. Draw two tangential lines from the center of the duct, to the outside of the outermost stran~ as in Fig. A.3 (Fig. 3.4 in text, not repeated). This defines a. The area of spiral required is then
A = sp
45Ps(1 - cos ~)
naRO.6f y
~ 0.05 sq. in.
General spiral proportioning should follow the requirements in Sec. A.l.6.l. The spiral should extend throughout those regions where R ~ Ra but at least 2t (where t = web thickness) to either side of the point of minimum radius of curvature. Such spiral reinforcement designed for multistrand cracking need not be placed in areas where equivalent or stronger primary anchorage zone reinforcement has already been supplied.
C.A.l.B Bearing Stress--In many cases the adequacy of anchorage assemblies will have been demonstrated by comprehensive tests or analyses. However, in other cases it is desirable to have a relatively simple method to proportion the size of bearing plates. Comprehensive tests and analyses show the tendon anchorage cracking load is relatively insensitive to bearing area and bearing stress. However, the confinement provided by concrete surrounding the bearing plate does increase the cracking load somewhat. The value of allowable bearing stress given in

lls
Sec. A.l.8 reflects recent test experience and tends to be a conservative bearing stress for use in sizing bearing plates. The expression given represents a slight liberalization over ACI 318-77 values and a substantial liberalization over current AASHTO values for anchors which do not extend fully across the web.
3.7 Illustrations of Design Procedure
3.7.1 Example 1. Assume a preliminary design for a
post-tensioned, segmental precast box girder bridge has developed a
tendon profile and cross section as shown in Fig. 3.5. The maximum
temporary prestress in each web section is 495 kips (tendon has
fifteen 1/2 in. diameter 270 ksi strands), and a plate bearing-type
anchor 13.25 in.2
will be used to anchor the tendon. The compres
sive strength of the concrete will be 5000 psi within tolerance
levels to be expected at the precast yard. Given the above data:
(a) Will the anchor plate satisfy the bearing stress require
men ts of A. 1.87
(b) Will the section satisfy Sec. A.lo4 and A.loS with no
supplementary reinforcement?
(c) If the answer to (a) is no
(1) Design a reinforcing scheme that will satisfy all requirements of Secs. A.1.4 and A.l.s.
(2) Redesign the section for no cracking with no supplemental reinforcement. Then supply a suitable passive reinforcing scheme to meet ultimate strength requirements.
(d) Since the tendon is curved, check to see if the section
satisfies A.l.7 (multi-strand effects). Reinforce as needed.
Solution
Available information:
t 14 in. 2a' 13.25 in. Al (13.25)2 = 176
2a 120 in. S 25 degrees A2 (14)2 = 196
e 12 in. f 6.s.jfT = 6. sJsOOO sp c
460 psi = 0.46 ksi

116
~r---~====~---' 48"
p~ P
PIER
I 1--
0:::::::::::::: :::::::= 0 ~ + 1- = Iii
r- 120'
60"
t
Fig. 3.5 Example 1 cross section and tendon profile

p 0.8f A nom pu ps
495 kips 1.10 f A = 680 kips pu sp
1. 60 f A = 990 kips pu sp
a) Check Sec. A.1. 8 Bearing Stress
1.1£ A fb l2u sl2 :5: 0.8f~.JA/A1 < 1. 33f'
A1 c. 1 1
fb 680000 = 3864 psi :5: (0.8) (5000)) i~~ < 4221 :5: 6620
176
bearing stress OK
b) Check Sec. A.1 4 Service Level Cracking
p = 1.10f A 680 kips pu sp
From Eq. A:
p cr 120] - ~i[2(25) - 252(12/60)(0.46)]
2 _ 103(12/60) _ 7 ·1' + 39(13.25) + 0.46[166 - 975(13.25) ] - 9.1
9 . J 2 5 2 (14)
= 630 kips
p = 680 kips > P cr 630 kips
Therefore, the section does not meet the cracking strength
requirement of Sec. A.1 4.
If spiral reinforcement is provided the new cracking load
from Eq. E would be
pi = (2.03 cr
0.0328)p cr
[2.03 - 0.032(25)](630)
== 775 kips
117

118
This is greater than the 680 kips required by Sec. A.l.4, and thus
the section will not crack. This spiral reinforcement can be
designed as shown later. Alternatively, from Eq. G active rein
forcement in the form of lateral post-tensioning will also provide
the necessary increase in cracking load:
pi (2.37 - 0.0372S)P = [2.37 - 0.0372(25)]630 cr cr
= 907 kips
which is considerably higher than the required 680 kips. A.l.4 OK
if either a spiral or active reinforcement is provided.
c) Check Sec. A.l.5 Minimum Strength
p u
1. 60f A pu ps
990 kips
To meet service load cracking requirements either spiral
reinforcement or active reinforcement is required in the section.
Therefore the minimum strength check should be made for these cases.
With spiral reinforcement, from Eq. I
P ult
(3.18 0.053S)P cr
[3.18 - (0.053)(25)J(630)
P = 990 kips ~ 1169 kips u
with active reinforcement, from Eq. K
P ult
(3.89 0.064S)P cr
[3.89 - (0.064)(25)] (630)
1443 kips
1169 kips
OK
OK
Either type of reinforcement must be provided to allow the section
tome etA. 1. 5 .

d) Proportion active reinforcement to meet A.l.6.3
The recommended minimum initial lateral precompression of
150-200 psi across the web can be achieved by:
0.200 ksi
A ps
0.8f A pu ps ta
0.888 sq.
0.8(270)A ps
(16) (60)
in.
119
The required area A (LPT) can be provided by three sets of 1/2 in. ps
270 ksi U stirrups with grouted tendons placed so that the resultant
load will act as close as possible to the primary load face as shown
in Fig. 3.6.
e) Proportion spiral reinforcement to meet A.l.6.1
where
From Commentary A.l.6.1
A ~ s
(£1 - 0.6f' ) c. ~
Sf Y
(Ds) cross-sectional area of bar ~ 0.05 sq.
used to fabricate the spiral
2 (4) (990)/n(13)2 = 7460 psi fl 4P /nD = u f' 5000 psi
c D 9 in.
s 1-1/2 in. pitch
A 7460 - 0.6{5000) (9)(1.5) 0.20 in.
2 s (5) (60000)
d = J 4(0.20) = 0.50 bar n
in.
Use 1/2 in. ¢ 60 ksi smooth rod spiral 9 in. overall diameter, at
1-1/2 in. pitch. The length of the spiral should be 4a' = 27 in.;
details as shown in Fig. 3.7.
in.

120
-r 60"
t ~-60"~1
P LPT (J" LPT ~ ( ) =200 psi.
Initio I 20 t 2
PLPT= .8PULT = 200psi (60)(15)
P LILT = 240 kips
USE (3) - 1/2" 270 ksi V GROUTED STIRRUPS
Fig. 3.6 Lateral post-tensioning details
1::=fo4---- 9 II DIA.---''''=:::::j
COVER
#8 BAR
.... 1.1------ t = 14"-----......,.~1
Fig. 3.7 Sizing spiral diameter

f) Check Sec. A.1.7 mu1tistrand effects
The tendon profile shown in Fig. 3.8 can be described by
the following equation:
A ( - z) 3
- B (z - z) 2 x = x2 - z2 2
where the boundary conditions are assumed to be:
e 0.436 radians
x = xl 72 in.
z zl = 0 in.
a 0.0 radians
x = s2 114 in.
z = z2 = 96 in.
based upon these assumptions
-2 (x - x ) A 2 1
3 (z2 - z ) 1
B 3(s2 - xl)
2 (z - zl) 2
for this problem
A -4.75 (10)-5
B 9.13 (10)-3
+ e
(x -2 zl)
e (z -2 zl)
(25 0)
2
substituting these values into the tendon profile equation and
differentiating yields
121

122
/ X
/ I X
-1.425(10)-4(96 - z)2 + 1.826(10)-3(96 - z)
2.85(10)-4(96 - z) - 1.826(10)-3
The radius of curvature is given by ,-
R = 11 + [-1.425(10)-4(96 - z)2 + 1.826 10 -3 96 - z
1 2 . 85 (10)-4(96 - z)2 _ 1.826(10)-3
These values are tabulated in Fig. 3.8. A survey of these values
shows that the minimum radius of curvature is 81.9 in. at which
point Q is calculated to be 2045 psi for a tendon duct with a
diameter of 2.75 in. (the recommended flexible duct for a 15 strand
commercial anchor). This minimum value of R can be checked
against the expression for R in Sec. C.A.1.7 o
R o
90P (1 - cos a)
rraC2¢ /'£'-c. ~
For 15 strands the duct will be half full so a
1/2(14 - 2.75) = 5.625 in. Thus
R o
(90)(680000)(1 - cos 90)
n(90) (5.625) (1. 7)J5000 320 in.
Thus the spiral to resist mu1tistrand effects is required wherever
the curvature radius is less than 320 in. From Fig. 3.8 it can be
seen that a confining spiral for approximately 78 in. in horizontal
projection extending from the anchor over 80 percent of the curved
zone is required.
The spiral area is given by
45Ps(1 - cos ex) A 2 0.05 si
sp na,RO.6f y

P=495kips
,.....----96"----~
(lb/inch) (psi) z(inches) R(inches) p = P/R Q = p/20r
0 136.1 5319 1231 10 106.8 6779 1568 20 89.7 8071 1867 30 82.3 8497 1965 35 81.9 8840 2045 40 83.7 8649 2001 50 94.98 7621 1763 60 121. 5983 1384 70 179.7 4022 930 80 366. 1978 457 90 547 1323 306
Fig. 3.8 Data for design of spiral reinforcement to resist mu1tistrand cracking
123

124
A sp (45)(680000)(1-1/2)(1 - cos 90)
n(90)(82)(0.6)(60000) 0.054 sq. in.
Thus a 1/4 in. diameter spiral rod with a pitch of 1-1/2 in. and an
overall diameter of 9 in. should be used.
3.7.2 Example 2. Determine the web thickness required for
the box girder in Example 1 if no supplementary reinforcement is to
be provided in the anchorage zone at cracking load levels. Determine
if supplementary anchorage zone reinforcement is required at ultimate
strength levels.
In Example 1 the design cracking load to meet A.1.4 was 680
kips. The original box girder with 14 in. webs had P = 630 kips cr
from Eq. A. Thus the cracking load has to be raised (680/630
1.08) about 8 percent to satisfy this requirement with no supple
mentary reinforcement. Of the three major geometric variables
(inclination, eccentricity, and cover) the most practical and most
effective change in the cracking load can be achieved through modi
fication of web thickness. Since the ultimate capacity of a section
with no supplementary reinforcement as irrlicated by Eq. H is the same
as the cracking load, it is obvious that a section designed to just
satisfy the cracking load requirement (680 kips) will not meet the
ultimate requirements (990 kips) without additional confining rein
forcement. Assume that in this case the required increase (990/630
1,57) of 57 percent is considered excessive to handle by web thicken
ing. The designer decides to increase the web width to control
cracking without relying on confinement, but to provide confinement
for ultimate.
On this basis, an approximate web width is selected for trial
as 110 percent t = (1.10)(14) = 15.4 in. Thus t = 16 in. is selected
as a practical dimension checking Eq. A for:

p cr
t 16 in.
2a 120 in.
e 12 in.
P 495 kips nom
1. 10f A 680 kips pu sp
1.60f A 990 kips pu sp
16[0.46(38)(60) _ 24
J _ 103 (1)
9 (60)
2a I 13.25
B 25 0
f 0.46 ksi sp
A1 176 sq. in.
A2 256 sq. in.
161 (12) ( -I 120) - 811_ (2)(25) - (252) (60) 0.46)
+ (39) (13.25) + .461 166 13.25 2_, 2 51_ - 97SC2) (16») I
- 9.1 = 669 kips
This is still less than the 680 kips required although it is close.
The next practical increase would use a web width t of 18 in.
Rechecking Eq. A for t = 18 in. yields P = 712 kips which satis-cr fies the requirement P = 712 kips ~ 1.10f A = 680 kips.
cr pu sp
However, with no supplementary reinforcement the section
does not satisfy the ultimate load requirement of 1.60 f A pu sp
125
Further widening of the webs to meet this requirement would probably
result in webs over 2 ft. wide so it is necessary to include con
fining reinforcement for satisfying the ultimate conditions. This
indicates that most sections will require such confinement so that it
might as well be considered for crack control. Using Eq. I for
spiral reinforcement
P = (3.18 - 0.053B)P u1t cr
(3.18 - (0.053)(25)(712) 1321 kips
This more than satisfies the requirement
P = 1321 kips ~ 1.60 f A ult pu sp
990 kips

126
For a web width of 18 in., a maximum spiral diameter D of 13 in. can
be used.
A s
Rechecking the spiral
(f 1 - 0.6 f' ) c.
Sf y
~ Ds
equation
A ~ (7460 - 0.6 (5000)\13) (1 5) s (5) (60000) . 0.29 sq. in. > 0.05
Thus a 5/8 in. ¢ rod at a pitch of 1-1/2 in. would be required. The
larger diameter of 13 in. results in a slightly heavier spiral than
in Example 1. Bearing stress would be no problem for this wider
web.
Side face mu1tistrand effect confining reinforcement should
be Techecked because of the greater side face cover thickness.
Checking R for the new cover C = 1/2(18 - 2.75) = 7.625 o
R o
(90)(680000)(1 - cos 90)
IT (90) (7.625) (1. nJ5000 236 in.
Since the minimum R is 82 in., a confining spiral is still
required. The expression for spiral area is not affected by the
cover so a 1/4 in. Biameter spiral rod with a pitch of 1-1/2 in.
and an overall diameter of 9 in. should be used along the tendon
path for approximately 75 in. in the horizontal direction.
3.7.3 ExamEle 3. Suppose that tre cracking load is desired
for a section identical to that of prototype specimen FS2B (t = in. , 2a = 82 in. , 2a I = 10.5 in. , f' = 5000 psi, = 0, e = 30° ) e
c with the exception that the angle of inc lination e is to be 45°
rather than 30°. Since no experimental data were obtained beyond
a 30° inclination, an approximate solution is to be determined
12
using a three-dimensional finite element analysis. In this case the
program PUZGAP 3D was used. The mesh used is shown in Figs. 3.9
through 3.13. The rezoned portion of the mesh (indicated by the

T'IIJW= ~4 l UPPER SECTION
~ t
LOWER SECTION
1 PART
V f..-' f..-' --I-" ----V v ,..- ,...-~
I-" f..-' f..-'
v ~ I--
~
3 57911131517 19
CDI ® I 21 23 25 27 29
@ I
1 3 5 7 33
3
29
27
2123~
19 17
15
13 II 9 7 5 3 I
,
d
A 8
. 3.9 Overall mesh pattern--inclined tendon proto specimen I-' N -....J

128
(0) COARSE MESH DETAIL
ANCHOR
X (TRANSVERSE)
LZ(LONG)
1=13 K=3
(b) REZONE MESH DETAIL
K=5 K=7
F · 3 10 Rezone mesh detail 19. .
K=9

CROSS SECTION
135 7
0' 6" 6"
15
II
7
5
3
BLOCK
:3
2-".,J SPACING
I
BLOCK - C
5 5 7 9 II
6" 6"
Q) ®
18"
I 1 ___
--~ ------------
-
I -
13 15 17 17 19 21
3d'
Fig. 3.11 Bottom mesh detail
BLOCK-C
23 25 27
CID
120"
'15
i 3
9
7
5
3
II 29
....... N \Q

(0)
II 30" 56'" SEGMENT 2
TENDON AREA MESH ~OCK C
tl \ ! I -;~:~ 19
25 BLOCK C
J 2 3 4
25 SEGMENT 3
5 6 7
27
23~~ • ~. .J CROSS CONNECT 5 I 6
PRISM C
21~ f 3 I t FACE C
r--t-y--, ( b) 1 I f 2 I l CONNECT I I I
~-+-19~ I
4 + t FACE C j 17 .
BLOCK C
~ ~ PRISM -. • • 2 3 4 5 6 7
Fig. 3.12 Duct mesh detail
..§LOCK C 29
r-' W a

BLOCK -C 0 0DE NO. 15 17 19
331 I jill r I I~
31
29
25 5-
2=0"
17
15 ~=24"
SECTION 2
19
BLOCK- C
21 Z3 25 27
23
21
SECTION 3
GRADE MESH WITH CUBIC ORDER PRISMS
Fig. 3.13 Top mesh detail
29
2~120"
r-' W r-'

132
shaded area in Fig. 3.9) is detailed in Fig. 3.10. The peak spalling
strain calculated was on the shaded element shown in Fig. 3.l0b. At
a load of 200 kips this value was 1010 micros train. The unit load
value is then 1010/200 = 5.05 microstrain, and the cracking load, as
determined from the inclined tendon threshold strain, is:
1092/5.05 = 216 kips. For f' c
imately 6.5 JfT = 0.459 ksi. c
in Fig. 2.12 was calculated as
= 5000 psi the value of f is approxsp
Thus the value of P /f for e = 45° cr sp
216/0.459 = 470 (full-scale) or 29.4
(m8del-scale) . (P /2at f = 0.487.) This illustrates the level of cr sp
detail required in an analysis to extrapolate to other cases.
3.8 Sununary
This chapter dealt with th~ development of a limit state
design procedure for proportioning supplemental anchorage zone rein
forcement. Two methods were presented. The first is used to design
the section to remain uncracked at the maximum temporary post
tensioning load. The second is used to allow cracking at the maximum
load, but maintain crack widths within acceptable limits. The former
procedure is reconunended for conservative design.
The concept of limit state design of the post-tensioned
anchorage is discu~sed and factors of safety are developed with
respect to cracking and ultimate load.
A generalized equation based upon regression analysis of
experimental data was presented for calculating the expected cracking
load for an unreinforced section. The ma.jor variables include the
tensile splitting strength of concrete, the section width and
height, the anchor width, and tendon eccentricity and inclination.
The cracking and ultimate load can be increased through the addi
tion of supplemental anchorage zone reinforcement and appropriate
factors are presented for calculating the increases to be expected
for a given reinforcing scheme. The recommendations are presented
in typical Specification or Code and Commentary format. Example
problems are solved to illustrate the design procedure.
C HAP T E R 4
CONCLUSIONS AND RECOMMENDATIONS
4. 1 General
At the inception of this study in 1975 the common American
practice for post-tensioned anchorage zone reinforcement design was
for the structural designer to specify tendon force and location ~nd
to allow the contractor to choose a post-tension system. Both then
usually relied on the hardware supplier to furnish detailed advice on
the use of the system. Often the suppliers' knowledge was based on
limited tests, on practical experience (generally with enlarged
cast-in-place end blocks), and on the published work of such
investigators as Guyon or Zielinski and Rowe who relied on the
classical bursting stress approach to design of supplementary
anchorage zone reinforcement.
Although these designs usually worked well for straight
tendon applications with little eccentricity, they were insufficient
to control anchorage zone cracking in some thin member applications
such as in precast segmental box girder bridge web sections. In
these applications, the tendons were often not only eccentric, but
also highly inclined in order to pick up a portion of the dead load
shear. Because of the highly proprietary nature of the industry
those companies which did have experience with such problems were
often reticent to publish this knowledge in the public literature.
American specifications such as AASHTO and the ACI Building Code
were framed in very limited terms of allowable bearing stresses, and
did not reflect the effects of section aspect ratio, of tendon eccen
tricity, curvatur~ and inclination, nor of the effect of supple
mentary reinforcement.
133

134
This investigation provides a starting point for the
practicing engineer to address many common thin web post-tensioning
applications as well as a separate check method to evalua te the
recommendations of the hardware supplier.
The results of this study reflect a composite formed from
three sources. These include physical tests of approximately forty
quarter-scale microconcrete models, physical tests of nine full-scale
prototype concrete specimens designed to replicate post-tensioning
conditions found in thin web sections and results of an extensive
series of three-dimensional linear elastic finite element computer
analyses.
The model test results were found to match the prototype
behavior when scaled properly through the use of the geometric scale
factor and the measured split cylinder tensile strength of the con
crete. A linear regression analysis of the experimental data yielded
an empirical equation for the load causing formation of the tendon
path crack in sections without supplementary anchorage zone rein
forcement. This type of crack has previous ly beell referred to as
the "bursting" crack in the literature. These values could then be
modified by appropriate factors to yield results where reinforcement
was present. The effect of variable trends indicated was also
observed in the computer analysis results. The empirical equation
for cracking load has the following limitations:
(1) For inclined tendons, the eccentricity e and inclination e must always be assumed positive.
(2) Thin web sections are assumed. 0.05 < web thickness < section depth
(3) Multiple tendons anchored in the same web section are not expressly covered.
0.25.
(4) The anchorage is assumed to be square. Rectangular plates with the long dimension oriented parallel to the web face can also be used. Equivalent areas of circular plates may be used.

135
For those applications which fall outside these limits, such as
multiple tendons, solutions can be obtained from comprehensive three
dimensional finite element analysis programs such as the program
PUZGAP using calibration techniques described in Secs. 2.2.6
and 3.6.2.
An extensive strain analysis was performed using both
physical strain gage data and the results of the analytical pro
gram. Good correlation was found between the predicted and measured
strains. The end result of this study was a theory which explains
tendon path crack initiation based upon attainment of specified peak
spalling strains at the edge of the anchorage. Two threshold
spalling strains were presented, one for straight tendon applica
tions and one for inclined tendons where right angle block-outs are
used to achieve tendon inclination. The theory agreed well with
experimental data over a wide range of variables, and thus was used
to extrapolate cracking loads beyond the range of physical test data
by use of the 3D FEM analysis.
Various reinforcing schemes (both active and passive) were
investigated and a general reinforcement design procedure was
developed. Experimental data from the prototype tests revealed an
interesting additional failure mechanism due to "multistrand"
effects. Sections with significant tendon curvature and with
multiple strands in the same duct generated large lateral splitting
forces at the point of minimum radius of curvature due to the
flattening out of these multiple strands within the confines of the
duct. A method of designing reinforcement to resist this effect
was presented.
4.2 Major Conclusions
The results of this study indicate a radical departure from
previous methods of analyzing the anchorage zone cracking problem
which were basically limited to concentric, straight tendon anchors.

136
For the general range of variables investigated, the major conclu-
sions are:
(1) Design of anchorage zone reinforcement using bursting stress
criteria is erroneous when the tendon is inclined or eccentric.
(2) Bearing stresses as high as 2.5f' were routinely achieved c
before ultimate failure. Specifications limiting allowable bearing
stresses to less than f' are overly conservative and inappropriate c
for controlling the complex anchorage phenomena.
(3) While anchorage zone design based upon the ACI Building Code
Commentary formula using the square root of relative bearing areas
will be conservative under certain circumstances, it cannot be relied
upon to be conservative when the tendon is highly eccentric or
inclined, or when very thin web sections are used.
(4) A new failure theory which recognizes the complex role of the
end face spalling stress in the vicinity of the anchor as the trigger
mechanism for an anchorage zone shear failure was confirmed experi-
mentally. Application of this failure theory and experimentally
determined spalling strain limits resulted in a general solution to
the problem using a three-dimensional finite element analysis. This
analysis predicts cracking loads which were confirmed experimentally
over a wide range of var iables.
(5) The load required to cause formation of the tendon path
crack increases with increasing web width. Increasing the angle of
inclination, or the eccentricity of the tendon decreases the cracking
load. The cracking load for plate-type bearing anchors with no sup
plementary anchorage zone reinforcement can be calculated as:
p cr
plate
f
t . ~!(J8a - 120) - ~l [28 252 (e/a)f 1 sp
f ,sn 'I 2 + 39a + ~[166 - 975(a t) 1 - 9.1
103 (e/a) - 7 9

where P cr
e
2a
2a J
t
8
f sp
137
cracking load in kips for section without supplementary anchorage reinforcement
eccentricity of tendon (in.) (always positive)
section height (in.)
width and depth of bearing plate (assumed square) (in.)
section thickness (in.)
tendon inclination at loaded face (degrees)(always positive)
split cylinder tensile strength (ksi) (psi) for normal readymix concrete.
approx. 6.s.Jf' c
~) Tendon path cracks can occur at points well removed from the
anchorage zone in sections where the tendon profile has significant
curvature and multiple strand tendons are used. This is due to the
tendency for the bundle to flatten out within the confines of the
duct, thus creating lateral forces sufficiently high to cause not
only cracking but side face rupture as well.
(7) The failure mechanism for plate type anchors is:
(a) The large friction forces developed beneath the anchor plate locally constrain the lateral expansion of the concrete due to Poisson's ratio effect.
(b) A complex, triaxial compressive stress state is set up which permits development of extremely high direct bearing stresses (up to 3f') beneath the plate.
c (c) The confining lateral forces at the edge of the plate
are reduced by the presence of the spalling tensile stresses.
(d) At some load level which depends on section and tendon geometry, the confining stress is sufficiently reduced that a shear failure occurs along the plate of approximately 45°, and thus the shear crack propagates to form a 45° pyramidal "cone" ber..eath the anchor.
(e) Simultaneous with the formation of the cone, a tendon path crack propagates from the tip of the cone. The cone is then forced into the anchorage zone setting up large lateral forces which eventually produce a set of "upper and lower" diagonal cracks which typically form at the corners of the anchor and propagate away from the tendon path at angles of approximately 45°.

138
(f) Increases in load above that required for formation of the diagonal cracks lead to ultimate explosive failure of the side faces, bounded by the upper and lower diagonal cracks.
(8) Anchor geometry can affect the cracking load. Tests using
plate-, bell- and cone-type anchors indicate the following factors
should be applied to calculated cracking loads for plate anchors:
P cr
Plate 1. 00 P plate cr
Bell 1. 08 P plate cr
Cone 0.61 P plate cr
These values are for sections without supplementary anchorage
zone reinforcement. Ultimate loads for unreinforced plate- and cone
type anchors occurred at loads only nominally above the cracking
load. Unreinforced bell anchors exhibited ultimate failure at loads
approximately 25 percent above those which cause cracking.
Tests of spirally reinforced plate and cone anchorages
indicated nearly identical factors were still applicable. No tests
were done on spiraJly reinforced bell anchors. Since the bell action
somewhat simulates the spiral action, it was felt further confinement
was redundant.
4.3 Reinforcement Conclusions
(1) When using passive reinforcement, spirals exhibit much better
performance than standard orthogonal reinforcement both for increas
ing cracking and ultimate loads, and for controlling crack widths.
Spiral reinforcement has the effect of changing the cracking pattern
from a single tendon path crack to a series of parallel cracks which
exhibit a reduction in the average crack width. The spiral advantage

139
is greater for thinner web sections, making it the preferred choice
of passive reinforcement. Design equations for the spirals are pre
sented which are similar to those used for design of spiral column
reinforcement.
(2) The ultimate load for anchorages with spiral reinforcement is
as much as 45-60 percent higher than that for anchorages with orthog
onal reinforcement (bar grid) with ten times the reinforcement ratio
of the spiral.
(3) For a given volumetric percentage of spiral reinforcement, the
spirals fabricated from smaller wires performed better than spirals
fabricated from larger wires. This indicates that spirals should use
close pitch.
(4) Within the range investigated long spirals (2t to 2.5t in
length affixed to the anchor) performed no better than short spirals
(t in length).
(5) With inclined, curved, multiple strand tendons careful
attention must be paid to the possibility of cracking along the tendon
path at the point of maximum curvature. In most practical applica-
tions that point would be well removed from the anchorage zone, and
from the influence of any short spiral reinforcement in the anchorage
zone. Con~inuing anchorage zone reinforcement into the zone of
maximum curvature is logical in some cases. However, calculations
indicate that the reinforcement required to resist multi-strand
effects is usually much smaller than that required in the anchorage
zone. A secondary calculation method is presented in Sec. 3.5.3.4
to design the additional reinforcement required for curved tendon
applications.
(6) Active reinforcement (lateral post-tensioning) is the most
efficient means of controlling anchorage zone cracking. A rela
tively small precompression of 100 psi across the anchorage zone of
a section with an inclined, curved, multiple strand tendon raised

140
the cracking load 33 percent above that for an unreinforced section.
The optimum location for the lateral prestress is as close to the
loaded face as is feasible.
4.4 Similitude Conclusions
(1) The tensile strength of the microconcrete used for
constructing the models was found to be substantially higher than
that for the corresponding prototype concrete.
(2) Cracking and ultimate loads must be normalized with respect
to the indirect tensile strength (f ) when using model results for sp
prediction of cracking in ~orresponding prototype structures.
(3) When adjusted for geometric scale factor and split tensile
strength, excellent reliability (+/- 10%) can be expected for model
tests using straight tendons, including the effects of cover,
eccentricity, and bearing area.
(4) Specimens with inclined tendons can also be accurately
modeled; however, careful attention must be made to detailing the
model tendon, when sharply curved multiple strand prototype sec
tions are to be modeled. Due to the importance of multistrand
effects in full-scgle structures the model tendon should be a pre-
cise scaled-down version of the prototype tendon and duct system.
(5) Crack patterns observed in prototype specimens can be
accurately reproduced in the models. However, crack widths in the
models (after adjustment by the scale factor) were on the average
40 percent smaller than those observed in the full-scale specimens.
(6) As with the full-scale tests, the formation of upper and
lower diagonal cracks around the anchor act as a visual indicator
of the proximity of ultimate failure. For unreinforced plate
anchors a cone of crushed concrete was observed beneath the anchor
at failure.
)

141
4.5 Analytical Study Conclusions
(1) Static, linear elastic, three-dimensional finite element
analyses can be used to predict the state of stress of the anchorage
zone with reasonable accuracy up to the cracking load.
(2) Calibration studies show that for straight tendons, a peak
spalling tensile strain of 172 ~£ near the edge of the anchorage as
calculated by thE program corresponded to i3itiation of tendon path
cracking in test specimens without supplementary reinforcement. The
corresponding strain for inclined tendons in which a right angle
blockout is modeled is l150~£, due to the high stress concentration
induced by the presence of the idealized corner.
4.6 Recommendations for Further Research
The limitations imposed on the empirical cracking equation
indicate most directly the areas where further research would be
useful. Specifically these would include:
(1) A small series of microconcrete models to investigate the
effect of inclined tendons which have "negative" eccentricities
(e g., below the section centroid) or "negative" inclinations.
(2) Extension of the 3D FEM analytical study to investigate the
effect of multiple tendons anchored in the same web section.
Experimental test results from Cooper [3] and Kashima [14] are pre
sently available for checking the analytical model predictions.
(3) A small series of microconcrete models, backed by analytical
predictions to investigate the effect of rectangular-shaped anchors
and their orientation with respect to the end face geometry.
(4) A similar series to investigate the effect of lateral
eccentricity of the anchor, a subject of some importance when
several anchors are placed across a wider web section.
(5) A series of full-scale tests to investigate the most efficient
reinforcement design for resisting multistrand effects.
• j I
• j
• j
. j
• j
. j
, j
j
j
j
j
j
j
j
j
j
j
j
j
~ j
j
j
j
j
j
j
j

•
BIB L lOG RAP H Y
1. Stone, w. C., and Breen, J. E., "Analysis of Post-Tensioned Girder Anchorage Zones," Research Report 208-1, Center for Transportation Research, The University of Texas at Austin, August 1980.
2. Stone, W. C., Paes-Filho, W., and Breen, J E., "Behavior of Post-Tensioned Girder Anchorage Zones," Research Report 208-2, Center for Transportation Research, The University of Texas at Austin, August 1980.
3. Breen, J. E., Cooper, R. L., and Gallaway, T M., "Minimizing Construction Problems in Segmentally Precast Box Girder Bridges," Research Revort No. l2l-6F, Center for Highway Research, The University of Texas at Austin, August 1975.
4. Dilger, W. H., and Ghali, A., "Remedial Measures for Cracked Webs of Prestressed Concrete Bridges," Journal of the Prestressed Concrete Institute, Vol. 19, No.4, July-August 1974.
5. American Association of State Highway and Transportation Officials, Standard Specifications for Highway Bridges, 12th Edition, 1977 ..
6. American Concrete Institute, Building Code Requirements for Reinforced Concrete and Commentary (ACI 318-77), Detroit, Michigan, 1977.
7. Guyon, Y., The Limit State Design of Prestressed Concrete, Vol. II: The Design of the Member, Translated by F. H. Turner, John Wiley & Sons, New York, 1974.
8. Rhodes, B., and Turner, F. H., "Design of End Blocks for PostTensioned Cables," Concrete, December 1967.
9. Comit~ Euro-International Du B~ton (CEB) and the F~deration Internationale de La Pr~contrainte (FIP) , Model Code for Concrete Structures, English Translation, 1978.
10. Rlisch, H., Grasser, E. and Rao, P. S., "Fundamentals of Design for Uniaxial Stress-conditions in Concrete Members," Munich, August 1961 (Translation from German, Oct. 1963, by J. V . McMahon and J. E. Breen, University of Texas at Austin).
143

] 44
11. Peterson, R. E., Stress Concentration Design Factors, New York, Wiley, 1953.
12. Berezovytch, W. N., "A Study of the Behavior of a Single Strand Post-Tensioning Anchor in Concrete Slabs," unpublished Master's thesis, The University of Texas at Austin, May 1970.
13. MacGregor, J. G., "Safety and Limit States Design of Reinforced Concrete," Canadian Journal of Civil Engineering, Vol. 3, No.4, 1976.
14. Kashima, S., and Breen, J. E., "Construction and Load Tests of a Segmental Precast Box Girder Bridge Model," Research Report 121-5, Center for Highway Research, The University of Texas at Austin, February 1975.
\
. ,