Embed Size (px)
Citation preview

The 3rd International Conference on Coastal and Delta Areas - PROCEEDINGS
475 ICCDA#3 Problem, Solution and Development of Coastal and Delta Areas
Design Of Pavement Using Buton Natural Rock Asphalt
Stabilized Subgrade Soil
Lely Rizkiyawati, Wilujeng Ashri Nastiti
Student of Civil Engineering Department, Engineering Faculty of UNISSULA
Jl. Raya Kaligawe Km.04, Semarang, Jawa Tengah, Indonesia
[email protected]; [email protected]
Gatot Rusbintardjo, Prabowo Setiyawan
Sultan Agung Islamic University, Department of Civil Engineering
Jl. Raya Kaligawe Km.04, Semarang, Jawa Tengah, Indonesia
Abstrak- The performance of pavements is governed by the strength of the subgrade, because
subgrade is roadbed soil where the pavement structure is laid. If bearing capacity of the subgrade
high, deformation of pavement will not occur and it is not easy to deteriorate. In the contrary, if
bearing capacity of the subgrade low, pavement deformation will occur and pavement will
deteriorate. This research have objectives to analysis the pavement structure of using existing
subgrade soil and using subgrade stabilized with Buton Natural Rock Asphalt (BNRA). The road
connecting Semarang - Purwodadi where always in worst condition was used for study in this
research. Semarang – Purwodadi road is laid over montmorillonite expansive clay with lower
bearing capacity or have low CBR value only 1 to 2 %. To analysis the pavement structure, both
flexible and rigid pavement, AASHTO 1993 pavement design are used. The result show that
flexible pavement structure laid over stabilized soil have thinner pavement structure compare to
the one laid over the subgrade of original expansive clay soil. Similarly for rigid pavement, the
thick of concrete slab over the subgrade of expansive clay is 30 cm, and if laid over the subgrade
of stabilized expansive clay with Buton Natural Rock Asphalt (BNRA) is only 25cm. It can be
concluded that Buton Natural Rock Asphalt (BNRA), have significant influence to the strength
and bearing capacity of expansive clay soil.
Keywords: asbuton, stabilized subgrade, expansive clay soil, AASHTO
1. Introduction 1.1. Background
From the beginning of mankind, transportation, especially land transportation has
been a main aspect in human lives. Communication and trade would not have been
possible without it. For this purpose, thousands kilometres of road have been built over
the world.
In its development, pavements can be broadly classified into two types, flexible
and rigid pavement. Flexible pavement is the pavement where the surface or wearing
course constructed using hot mix asphalt concrete, where rigid pavement the surface
pavement constructed with the slab of cement concrete.
The purpose of a pavement is to provide a smooth surface over which vehicles
may pass under all climatic conditions. In turn, the performance of the pavement is
affected by the characteristics of the subgrade. Desirable properties that the subgrade
should possess include strength, drainage, ease of compaction, permanency of
Proceedings of International Conference : Problem, Solution and Development of Coastal and Delta Areas Semarang, Indonesia – September 26th, 2017
Paper No. C-41

PROCEEDINGS - The 3rd International Conference on Coastal and Delta Areas
Problem, Solution and Development of Coastal and Delta Areas ICCDA#3 476
compaction, and permanency of strength. Therefore, design of the pavement is depend on
the quality of the subgrade.
1.2. The Objective of the research
From the above description, the objective of the research are as follows:
a. Make redesign of existing pavement a using unstabilized expansive clay soil
as subgrade.
b. Make redesign the pavement Semarang – Purwodadi using BNRA Stabilized
expansive clay soil as subgrade.
c. Comparing pavement design over existing subgrade and over stabilized
subgrade
2. Design 2.1. Introduction
Pavement layer thickness depends on subgrade strength where the pavement
structure laid. The higher bearing capacity of subgrade improves its strength. In this
chapter the bearing capacity expressed in CBR value which will be calculate. The final
result of the calculation will prove that the higher CBR value of the subgrade could make
the pavement layer thinner or not, and the using of stabilized subgrade might has thinner
pavement layer than the using of existing subgrade.
As described in the previous chapter, pavement layers were calculated by using
AASHTO 1993 method both for pavement over the existing subgrade and for pavement
over the stabilized subgrade.
2.2. Time constraints
The analysis period selected for this design was the maximum performance
period or service live 15 years. There are two comprehension of period, analysis and
performance period.
2.3. Performance period
Performance period is the period of time that an initial pavement structure will
last before it needs rehabilitation. It also refers to the performance time between
rehabilitation operations. The performance period is equivalent to the time elapsed as a
new, reconstructed, or rehabilitated structure deteriorates from its initial serviceability to
its terminal serviceability. For the performance period, the designer must select minimum
and maximum bounds that are established by agency experience and policy.
2.4. Analysis Period
This refers to the period of time for which the analysis is to be constructed, i.e.,
the length of time that any design strategy must cover. The analysis period is analogous to
the term design life used by designer in the past. Because of the consideration of the
maximum performance period, it may be necessary to consider and plan for stage
construction (i,e., an initial pavement structure followed by one or more rehabilitation
operations) to achieve desired analysis period.
2.5. Traffic
Based on 2016 average daily traffic and axle weight data from Bina Marga
Central Java Services (Dinas Bina Marga Provinsi Jawa Tengah) the estimated two-way
8.16 ton equivalent single axle load (ESAL) applications during the first year of the
The 3rd International Conference on Coastal and Delta Areas - PROCEEDINGS
477 ICCDA#3 Problem, Solution and Development of Coastal and Delta Areas
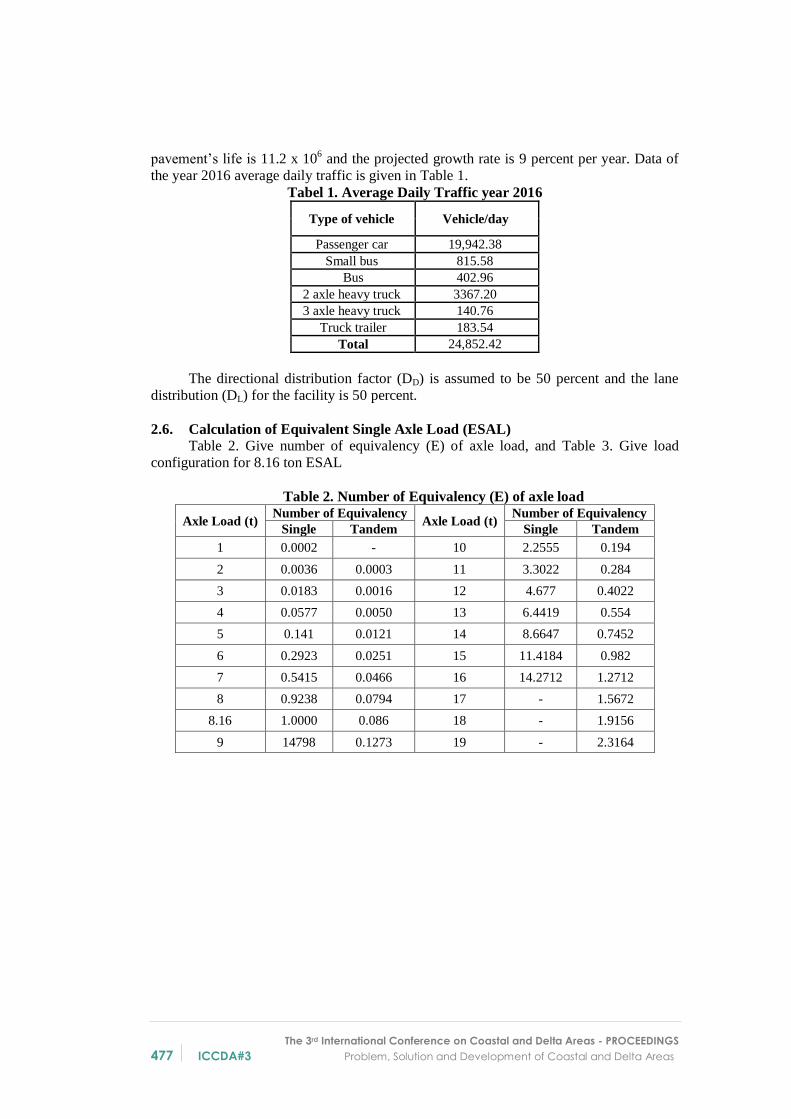
pavement’s life is 11.2 x 10⁶ and the projected growth rate is 9 percent per year. Data of
the year 2016 average daily traffic is given in Table 1.
Tabel 1. Average Daily Traffic year 2016
Type of vehicle Vehicle/day
Passenger car 19,942.38
Small bus 815.58
Bus 402.96
2 axle heavy truck 3367.20
3 axle heavy truck 140.76
Truck trailer 183.54
Total 24,852.42
The directional distribution factor (DD) is assumed to be 50 percent and the lane
distribution (DL) for the facility is 50 percent.
2.6. Calculation of Equivalent Single Axle Load (ESAL)
Table 2. Give number of equivalency (E) of axle load, and Table 3. Give load
configuration for 8.16 ton ESAL
Table 2. Number of Equivalency (E) of axle load
Axle Load (t) Number of Equivalency
Axle Load (t) Number of Equivalency
Single Tandem Single Tandem
1 0.0002 - 10 2.2555 0.194
2 0.0036 0.0003 11 3.3022 0.284
3 0.0183 0.0016 12 4.677 0.4022
4 0.0577 0.0050 13 6.4419 0.554
5 0.141 0.0121 14 8.6647 0.7452
6 0.2923 0.0251 15 11.4184 0.982
7 0.5415 0.0466 16 14.2712 1.2712
8 0.9238 0.0794 17 - 1.5672
8.16 1.0000 0.086 18 - 1.9156
9 14798 0.1273 19 - 2.3164

PROCEEDINGS - The 3rd International Conference on Coastal and Delta Areas
Problem, Solution and Development of Coastal and Delta Areas ICCDA#3 478
Table 3. Load Configuration for 8,16 Ton ESAL
VDF = Value damage factor
Use Table 2. and Table 3., number of equivalency for heavy vehicle (passenger
car was neglected) can be determined as follows:
1. Light bus (8 ton) = 3 ton (front wheel) + 5 ton (rear wheel single axle)
Number of equivalency = 0.0183 + 0.1410 = 0.1593
2. Bus (11 ton) = 5 ton (front wheel) + 8 ton (rear wheel single axle)
Number of equivalency = 0,1410 + 0,9238 = 1,0648
3. Light Truck (11 ton) = 5 ton (front wheel) + 8 ton (rear wheel single axle)
Number of equivalency = 0,1410 + 0,9238 = 1,0648
4. Heavy Truck (27 ton) = 5 ton (front wheel) + 7 ton (midle wheel single) + 15ton
(rear wheel tandem axle)
Number of equivapency = 0,1410 + 0,5415 + 0,9820 = 1,6645
5. Truck Trailer (32 ton) = 5 ton (front wheel) + 7 ton (midle wheel single) + 20ton
(rear wheel triple axle)
Number of equivalency = 0,1410 + 0,5415 + 2,3164 = 2,9989
Worksheet for calculating 8,16 ton ESAL applications for analysis period 15
years and assumed SN or D = 4” was given in Table 4.
Table 4 Worksheet for calculating 8.16 ton ESAL applications
Vehicle types Current
traffic (a)
Growth
factors
(b)
Design
traffic (c)
ESAL
factor (d) Design ESAL (e)
Light bus 815.58 29.46 8769850.2 0.1593 1397037.134
Bus 402.96 29.46 4332988.6 1.0648 4613766.244
CATEGORY CONFIGURATION
VDF

The 3rd International Conference on Coastal and Delta Areas - PROCEEDINGS
479 ICCDA#3 Problem, Solution and Development of Coastal and Delta Areas
The equation to calculate the traffic during the first year is:
W8,16 = DD x DL x Design ESAL
(1)
Where:
DD = a directional distribution factor, expressed as a ratio, that accounts for the
distribution of ESAL units by direction
Mentioned above, in this design DD was taken 50 percent
DL = a lane distribution factor, expressed as a ratio, that accounts for
distribution of traffic when two or more lanes are available in one
direction. As mentioned above, in this design DL was taken 50 percent
ŵ8.16 = the cumulative two-directional 8.16-kip ESAL units predicted for a
specific section of highway during the analysis period (from the planning
group)
Thus, the traffic during the first year is:
= 0,5 x 0,5 x 55857579.73= 11.2 (8,16ton) ESAL
Traffic growth rate for road Semarang to Purwodadi is 9 percent per year constant.
By using equation for traffic growth:
(2)
The curve of traffic growth can be drawn, and given in Figure 4.
Light truck 2909.04 29.46 31280616 1.0648 33307600.15
Heavy truck 605.82 29.46 6514321.9 1.6645 10843088.77
Truck trailer 176.64 29.46 1899392.3 2.9989 5696087.437
All vehicles 4910.04 52797169 55857579.73

PROCEEDINGS - The 3rd International Conference on Coastal and Delta Areas
Problem, Solution and Development of Coastal and Delta Areas ICCDA#3 480
Figure 2.1. Plot of cumulative 8.16 ton – ESAL traffic vs time
2.7. Reliability
The road which the pavement structure is designing is in rural situation where daily
traffic columns should never exceed half of its capacity. Thus 90 percent overall
reliability level was selected for design.
Another criteria required for the consideration of reliability is the overall
standard deviation (So). An appropriate value of 0.40 will be used for the design purposes
of this problem.
Application of the reliability concept requires the requires the following steps :
1. Define the funtional classification of the facility and determine whether a rural or
urban condition exists.
2. Select a reliability level from the range given in Table 2.3. the greater the value of
reliability, the greater the value of reliability, the more pavement structure required.
3. A standard deviation (S0) should be selected that is representative of local
conditions.The range of value (S0) 0,4 - 0,5
Based on this information, an overall reliability level of 90 percent was chosen for
design, and from Tabel 2.4, of the value standard normal deviation of reliability can be
found = -1,282, and the standard deviation = 0,40.
Tabel 5. Suggested levels of reliability for various functional classifications
Functional/Classification of the Road Recommended level of Reliability
Urban Rural
Intersate and other freeways 85-99.9 80 - 99.9
principle arterials 80 - 99 75 - 95
Collector* 80 - 95 77 - 95*
Local 50 - 80 50 - 80

The 3rd International Conference on Coastal and Delta Areas - PROCEEDINGS
481 ICCDA#3 Problem, Solution and Development of Coastal and Delta Areas
Table 6. Relation betwen Reliability and Standard Normal Deviate
Reliability, R% Standard Normal
Deviate, ZR Reliability, R%
Standard Normal
Deviate, ZR
50 0 93 -1.476
60 0.253 94 -1.555
70 0.254 95 -1.645
75 0.674 96 -1.751
80 0.841 97 -1.881
85 -1.037 98 -2.054
90 1.282 99 -2.327
91 1.34 99.9 -3.09
92 1.405 99.99 -3.75
2.8. Serviceability
Based on the traffic volume and functional classification of the facility (2 lane
provincial road), a terminal serviceability (pt) of 2.0 was selected. The initial
serviceability (p0) normally acheived for flexible pavements is take 2.2.
Figure 2. Environmental Serviceability
Δ PSI = p0 – pt = 4.2 – 2.0 = 2.2 (3)
2.9. Effective Roadbed Soil Resilient Modulus
The value of resilient modulus MR for soil in Semarang – Purwodadi road is 1,500
psi for wet condition, and 3,000 for dry condition. These values are also reflective of the
roadbed support that the moisture conditions provided by the “fair” drainage system.
2.10. Pavement Layer Materials Characterization
Three types of pavement materials will constitute the individual layers of the
structure. The moduli for each, determined using recommended laboratory test
procedures, are as follows:
- Asphalt Concrete : = 400,000 psi
- Concrete : = 4,200,000 psi
- Granular Base : = 22,000 psi
- Subbase : = 11,000 psi
- Subgrade : = 3,000 psi

PROCEEDINGS - The 3rd International Conference on Coastal and Delta Areas
Problem, Solution and Development of Coastal and Delta Areas ICCDA#3 482
These values correspond to the average year-round moisture conditions that
would be expected without any type of pavement drainage system.
2.11. Layer Coefficients
This section describes a method for estimating the AASHTO structural layer
coefficient ( values) required for standard flexible pavement structural design. A value
for this coefficient is assigned to each layer material in the pavement structure in order to
convert actual layer thicknesses into structural number (SN).
This layer coefficient expresses the empirical relathionship between SN and
thickness and is a measure of the relative ability of the material to function as a structural
component of the pavement.
The following general equation for structural number reflects the relative impact
of the layer coefficients ( and thickness ( .
a. Surface Layer
Provides a chart (Figure 2.6) that may be used to estimate the structural layer
coefficient of a asphalt concrete surface course based on its elastic (resilient) modulus
(EAC) at 68ᵊF.
Caution is recommended for modulus values above 400,000 psi. Although higher
modulus asphalt concretes are stiffer and more resistant to bending, they are also more
susceptible to thermal and fatigue cracking. Using the graph in Figure 4.6 retrieved
surface layer coefficient 0.42
Figure 3. Chart to determine coefficient of surface layer
b. Base
Figure 2.7 provides a chart that may be used to estimate a structural layer
coefficient, from one the four different laboratory test results on a granular base
material, including base resilient modulus, Ebase. The AASHTO Road Test Basis for these
correlations is :
Ebase = 22000 psi (from Figure 4.7) CBR = 29.5 %
(4)
The following relationship may be used in lieu of Figure 2.2 to estimate the layer
coefficient, for a granular base material from its elastic (resilient) modulus,
= 0,249 (log10 Ebase) – 0,977
The 3rd International Conference on Coastal and Delta Areas - PROCEEDINGS
483 ICCDA#3 Problem, Solution and Development of Coastal and Delta Areas
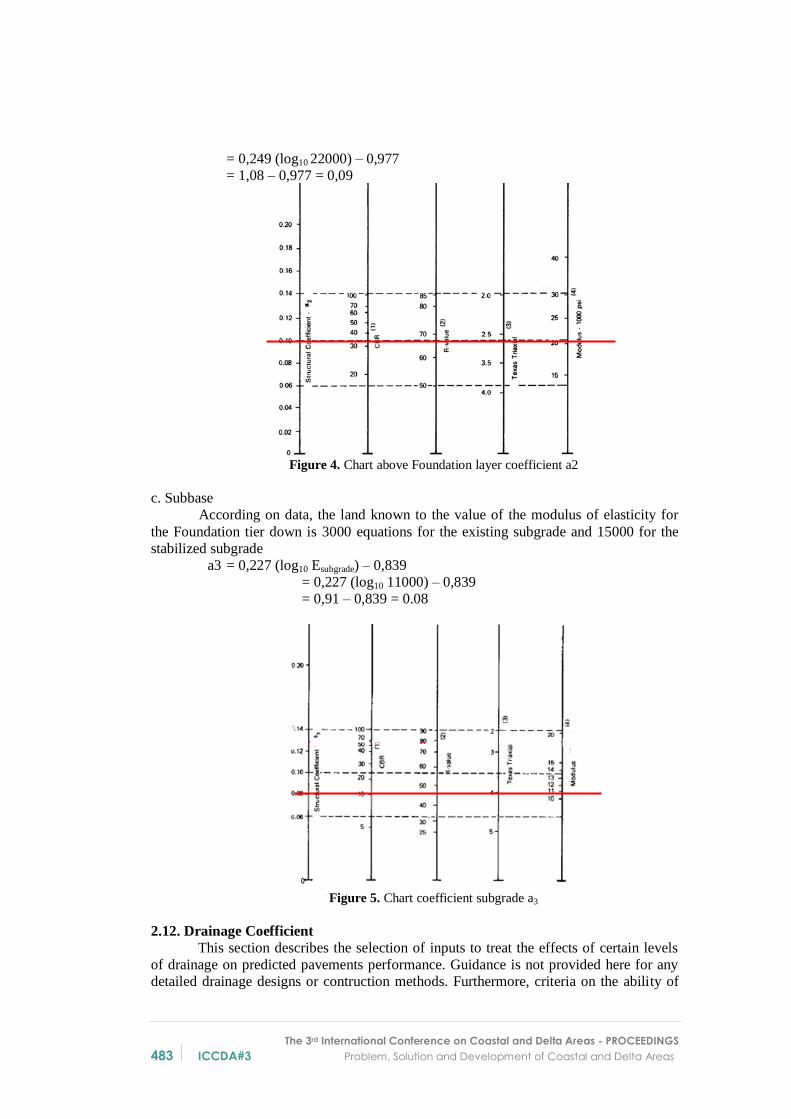
= 0,249 (log10 22000) – 0,977
= 1,08 – 0,977 = 0,09
Figure 4. Chart above Foundation layer coefficient a2
c. Subbase
According on data, the land known to the value of the modulus of elasticity for
the Foundation tier down is 3000 equations for the existing subgrade and 15000 for the
stabilized subgrade
a3 = 0,227 (log10 Esubgrade) – 0,839
= 0,227 (log10 11000) – 0,839
= 0,91 – 0,839 = 0.08
Figure 5. Chart coefficient subgrade a3
2.12. Drainage Coefficient
This section describes the selection of inputs to treat the effects of certain levels
of drainage on predicted pavements performance. Guidance is not provided here for any
detailed drainage designs or contruction methods. Furthermore, criteria on the ability of

PROCEEDINGS - The 3rd International Conference on Coastal and Delta Areas
Problem, Solution and Development of Coastal and Delta Areas ICCDA#3 484
various drainage methods to remove moisture from the pavement are not provided. it is
up to the design engineer to identify what level(or quality) of drainage conditions. Below
are the general definitions corresponding to different drainage levels from the pavement
structure :
Tabel 7. Drainage levels from the pavemnet structure
Quality of Drainage Water removed from the road
surface within:
Excellent 2 hours
Good 1 day
Fair* 1 week*
Poor 1 month
Very Poor water will not drain
Tabel 8. The quality of drainage based on humidity levels
Quality of
drainage
Percent of time pavement structure is exposed to moisture level
approaching saturation
<1% 1 - 5% 5 - 25% >25%
Excellent 1.40 - 1.35 1.35 - 1.30 1.30 - 1.20 1.20
Good 1.35 - 1.25 1.20 - 1.15 1.15 - 1.00 1.00
Fair* 1.25 - 1.15 1.15 - 1.05 1.00 - 0.80* 0.80
Poor 1.15 - 1.05 1.05 - 0.95 0.80 - 0.60 0.60
Very Poor 1.05 - 0.95 0.95 - 0.75 0.75 - 0.40 0.40
For the quality of selected good-quality drainage with humidity levels >25%, so
that the obtained values of drainage (m) is 0.8
3. Result
Using design chart, structural number SN for the layer structure over subgrade
SN3 was found = 6.2 The result is SN1 = 3.4 and. The result is SN2 = 4.4 and the
thickness required is:
D*1 = SN1/a1 = 3.4/0.42 = 8.09 cm ~ 8 cm.
SN*1 = a1 x D*1 = 0.42 x 8 = 3.3 cm
D*2 = (SN2 – SN*1) / (a2m2) = (4.4 – 3.3) / (0.09 x 0.8) = 16cm
SN*2 = 16 x 0.09 x 0.8 = 1.16
D*3 = (SN3 – (SN*1 + SN*2)) / (a3m3)
= (6.2 – (3.3 + 1.16)) / (0.08 x 0.8) = 28 cm
SurfaceCourse
8cm Base Course
16cm
Subgrade ~
Subbase
28cm
Figure 3.1 Flexible pavement structure layer thicknesses over existing subgrade

The 3rd International Conference on Coastal and Delta Areas - PROCEEDINGS
485 ICCDA#3 Problem, Solution and Development of Coastal and Delta Areas
Using design chart, structural number SN3 for the layer structure over subgrade
SN3 was found = 3.9. Solve for SN1, the result is SN1 = 3.2 and SN2 = 4. Thus, the
thickness required is:
D*1 = SN1/a1 = 3.2/0.42 = 7.62 cm ~ 8 cm.
SN*1 = a1 x D*1 = 0.42 x 8 = 3.3 cm
D*2 = (SN2 – SN*1) / (a2m2)
= (4 – 3.3) / (0.09 x 0.8) = 9 cm
SN*2 = 9 x 0.09 x 0.8 = 0.6
D*3 = (SN3 – (SN*1 + SN*2)) / (a3m3)
= (3.9 – (3.3 + 0.6)) / (0.08 x 0.8) = 0
For pavement structure over stabilized subgrade, the thickness of base layer take 9
cm and the subbase layer is eliminated. The cross section of the pavement is given in
Figure 6. Flexible pavement structure layer thicknesses over stabilized subgrade
From the calculation of flexible pavement design above has known that the total
layer thickness of flexible pavement structure over existing subgrade is 52cm. Then, for
the total layer thickness of flexible pavement structure over stabilized subgrade is 17cm.
Using design charts, the rigid pavement structure of concrete over the existing
subgrade , the slab thickness has known 11.5 inch or 30 cm as shown in figure below:
Surface Course
8cm
Base Course
9cm
Subgrade ~
Figure 3.3 Rigid pavement structure layer thicknesses over existing subgrade
Concrete
30cm
Subgrade ~
Dowel
bar

PROCEEDINGS - The 3rd International Conference on Coastal and Delta Areas
Problem, Solution and Development of Coastal and Delta Areas ICCDA#3 486
For rigid pavement structure of concrete over stabilized subgrade, the slab thickness is
10inch or 30cm as shown in figure below:
From the calculation of rigid pavement design above has known that the slab
thickness of the rigid pavement structure over existing subgrade is 30cm. Then, for the
slab thickness of rigid pavement structure over stabilized subgrade is 25cm.
4. Conclusions
From the results obtained in this study, the following conclusions can be drawn
as follows:
1. The thickness of pavement structure over existing subgrade, for the flexible
pavement is 52cm and for the rigid pavement is 30cm.
2. The thickness of pavement structure over stabilized subgrade, for the flexible
pavement is 17cm and for the rigid pavement is 25cm.
3. Thicknesses of pavement structure over stabilized subgrade are less than the
pavement structure over existing subgrade, both for the flexible pavement and
rigid pavement.
The overall conclusion is that the using of soil stabilized with BNRA is good
enough for flexible pavement and rigid pavement
Acknowledgements Alhamdulillahirabbil’alamiin, Innalhamdalillahnahmaduhuwanasta-’iynuhu. Upon
Ridho and Rahmat Allah SubhanawaTa’ala this final assignment report can be
completed.
In preparing this report, I was in contact with many people, researchers,
academicians, and practitioners. They have contributed towards my understanding and
thoughts. In particular, I wish to express my sincere appreciation to my main research and
thesis supervisor, Ir. Gatot Rusbintardjo, M.R.Eng.Sc., Ph.D., for his encourages,
guidance, criticism, and friendship. I am also very thankful to my co-supervisor Ir. H.
Prabowo Setiyawan, M.T., PhD. for his guidance, advice and motivation. Without their
continued support and interest, this final assignment report would not have been the same
as presented here.
Figure 7. Rigid pavement structure layer thicknesses over stabilized subgrade
Dowel
bar
Concrete
25cm
Subgrade ~

The 3rd International Conference on Coastal and Delta Areas - PROCEEDINGS
487 ICCDA#3 Problem, Solution and Development of Coastal and Delta Areas
References Rusbintardjo, G (2011). Oil Palm Fruit Ash (OPFA) Modified Bitumen – a New
Binder for Hotmix Asphalt (HMA) Pavement Mixtures. LAMBERT Academic Publishing
– Germany. pp. 1 dan 2
Yoder, E.J.and Witchak, M.W. (1975). Principles of Pavement Design. A Wiley-
Interscience Publication. JOHN WILEY & SONS, ING. pp. 3
American Association of State Highway and Transportation Officials(1993).
AASTHO’s Guide for Design of Pavement Structures. Published by American Association
of State Highway and Transportation Officials
www.eapa.org.com
www.pavingexpert.com
Robert D Krebs, Richard Walker (1971) Highway Materials. McGraw-Hill Book
Company – America. pp. 2
Hamade, H and Utami, W.D. (2016). Soil Stabilization With Buton Natural Rock
Asphalt (BNRA). Final Assigment, Engginering
www.butonasphaltindonesia.com