Embed Size (px)
Citation preview

The Pennsylvania State University
The Graduate School
Eberly College of Science
DESIGN AND SYNTHESIS STRATEGIES FOR SMALL MOLECULE
AND POLYMER AMPLIFICATION REAGENTS
A Dissertation in
Chemistry
by
Travis J. Cordes
2016 Travis J. Cordes
Submitted in Partial Fulfillment
of the Requirements
for the Degree of
Doctor of Philosophy
December 2016

The dissertation of Travis J. Cordes was reviewed and approved* by the following:
Scott T. Phillips
Associate Professor of Chemistry
Dissertation Advisor
Chair of Committee
Przemyslaw Maslak
Associate Professor of Chemistry
Robert Rioux
Associate Professor of Chemical Engineering
Kenneth S. Feldman
Professor of Chemistry
Chair of the Graduate Program of the Department of Chemistry
*Signatures are on file in the Graduate School
iii
ABSTRACT
Self-replicating and self-amplifying systems provide the foundation for the
evolution of life and are an inherent component of many biological processes. For over a
century, scientists have studied these reactions in an attempt to elucidate the mechanisms
responsible for the origin of life, as well as to create chemical reaction systems that
mimic these biological phenomena. However, relatively few synthetic amplification
reactions are used in commercial applications due to their complexity, or because of
limitations such as slow rates of reaction and thermal instability.
Amplification reactions are currently sought after in the context of creating
reagents for point-of-need assays and stimuli-responsive materials. Reactions that
amplify the presence of a molecular signal are particularly attractive due to their ability to
produce a large readout signal in response to trace quantities of an analyte. In particular,
this dissertation will focus on the development of two approaches to signal amplification:
i) autocatalytic reagents and ii) depolymerizable polymers.
More specifically, this dissertation will address methods for accelerating the rate
of various signal amplification reactions. This includes i) studying the effects of
proximity and effective concentration on a base-mediated autocatalytic reaction; ii)
designing novel polymer backbones for rapid depolymerization; iii), increasing the rate of
solid-state depolymerization in aqueous environments; and iv) mechanoresponsive
properties of depolymerizable polymers.

iv
TABLE OF CONTENTS
List of Figures .......................................................................................................................... vii
Acknowledgements .................................................................................................................. xvi
Chapter 1: Base-Mediated Autocatalytic Signal Amplification......................................... 1
1.1 Introduction ................................................................................................................ 1
1.2 Catalytic Amplification Systems................................................................................ 2
1.2.1 Transition Metal Catalytic Amplification ....................................................... 2
1.2.2 Enzyme-Based Amplification ......................................................................... 5
1.2.3 Summary of Catalytic Amplification .............................................................. 6
1.3 Autocatalytic Amplification ....................................................................................... 6
1.3.1 Introduction to Autocatalysis .......................................................................... 6
1.3.2 Examples of Autocatalysis .............................................................................. 8
1.3.3 Limitations of Amplification Reagent 1-13 .................................................... 12
1.4 Experimental Design .................................................................................................. 12
1.5 Results and Discussion ............................................................................................... 15
1.5.1 Synthesis of the Reagents ................................................................................ 15
1.5.2 LCMS Mechanistic Studies ............................................................................. 16
1.5.3 UV/Vis Kinetic Studies ................................................................................... 18
1.6 Conclusion ................................................................................................................. 23
1.7 References .................................................................................................................. 24
Chapter 2: Head-to-Tail Depolymerizable Polymers ........................................................ 27
2.1 Introduction to Depolymerizable Polymers ............................................................... 27
2.1.1 Classification of Depolymerization Mechanisms ............................................ 28
2.1.2 Continuous, Reaction-Based Depolymerization ............................................. 30
2.1.2.1 CDr Poly(carbamates) .......................................................................... 31
2.1.2.2 CDr Poly(benzyl ethers) ...................................................................... 34
2.1.2.3 Intramolecular Cyclizing CDr Polymers ............................................. 36
2.1.2.4 CDr Poly(phthalaldehyde) ................................................................... 38
2.1.2.5 CDr Poly(glyoxalates) ........................................................................ 39

v
2.1.3 Summary of CDr Polymers ............................................................................. 41
2.2 Efforts to Improve the Rate of Quinone Methide Elimination ................................... 41
2.3 Experimental Design .................................................................................................. 43
2.4 Results and Discussion ............................................................................................... 45
2.4.1 Synthesis and Testing of a Model Furan Repeating Unit ................................ 45
2.4.2 Synthesis of Furan-based Poly(carbamates) .................................................... 50
2.4.3 Summary of 2-furylcarbamates ....................................................................... 50
2.4.4 Synthesis and Testing of a Model Thiophene Repeating Unit ........................ 52
2.4.5 Synthesis of Thiophene-based Poly(carbamates) ............................................ 54
2.5 Conclusion and Future Directions ............................................................................. 55
2.6 References.................................................................................................................. 56
Chapter 3: Solid-State Depolymerization of Poly(benzyl ethers) ...................................... 63
3.1 Introduction ................................................................................................................ 63
3.2 Experimental Design .................................................................................................. 68
3.3 Results and Discussion ............................................................................................... 70
3.3.1 Synthesis of the Monomers ............................................................................. 70
3.3.2 Synthesis of Poly(benzyl ethers) ..................................................................... 71
3.3.3 Solution Phase Studies for Selective Depolymerization of Poly(benzyl
ethers) ............................................................................................................... 72
3.3.4 Solid-State Depolymerization of Poly(benzyl ethers) ..................................... 74
3.3.5 Verification of the Head-to-Tail Depolymerization Mechanism .................... 77
3.3.6 Characterization of Material Properties .......................................................... 76
3.4 Conclusions................................................................................................................ 82
3.5 References.................................................................................................................. 83
Chapter 4: Mechanically-Induced Responses of CDr Polymers ........................................ 84
4.1 Introduction of Mechanoresponsive Materials ........................................................... 84
4.2 Mechanochemical Responses of CDr Polymers ......................................................... 90
4.3 Experimental Design .................................................................................................. 91
4.4 Results and Discussion ............................................................................................... 93
4.4.1 Responses of Multiple Polymer Backbones .................................................... 93

vi
4.4.2 Mechanistic Studies and Trapping Experiments ............................................. 96
4.4.3 Effect of Degree of Polymerization on Rate of Cleavage ............................... 100
4.4.4 Cyclization Hypothesis ................................................................................... 102
4.5 Conclusion and Future Directions .............................................................................. 104
4.6 References.................................................................................................................. 105
Chapter 5: Materials, Methods, Experimental Procedures, and Characterization ......... 109
5.1 Materials..................................................................................................................... 109
5.2 Methods ...................................................................................................................... 110
5.3 Chapter 1: Experimental Procedures and Characterization ........................................ 112
5.4 Chapter 2: Experimental Procedures and Characterization ....................................... 123
5.5 Chapter 3: Experimental Procedures and Characterization ....................................... 138
5.6 Chapter 4: Experimental Procedures and Characterization ....................................... 153
5.7 References ................................................................................................................. 154
Appendix A: NMR Spectra .................................................................................................. 155
Chapter 1 NMR Spectra ................................................................................................... 155
Chapter 2 NMR Spectra ................................................................................................... 169
Chapter 3 NMR Spectra ................................................................................................... 192
Appendix B: Data Tables for Kinetics Experiments .......................................................... 216
Data for Chapter 1 ............................................................................................................ 216
Data for Chapter 2 ............................................................................................................ 220
Data for Chapter 3 ............................................................................................................ 225

vii
LIST OF FIGURES
Chapter 1
Figure 1-1. Schematic depiction of catalytic signal amplification .......................................... 2
Figure 1-2. Catalytic signal amplification by Anslyn ............................................................. 3
Figure 1-3. Allosterically-regulated catalytic amplification by Mirkin .................................. 4
Figure 1-4. Enzymatic signal amplification by Rotello. ......................................................... 5
Figure 1-5. Schematic illustration of autocatalytic signal amplification ................................ 7
Figure 1-6. Allosterically-regulated autocatalysis by Mirkin. ................................................ 8
Figure 1-7. Autocatalytic fragmentation of reagent 1-9 by Ichimura ..................................... 9
Figure 1-8. Base-mediated autocatalysis for photo-induced cross-linking by Ichimura ......... 9
Figure 1-9. Base-mediated autocatalytic amplification reaction by Mohapatra ..................... 10
Figure 1-10. Tandem autocatalytic reaction for the detection of Pd(0) by Mohapatra ........... 11
Figure 1-11. Schematic depiction of the functional group proximity hypothesis ................... 13
Figure 1-12. Structures of three model autocatalytic reagents. ............................................... 14
Figure 1-13. Revised reaction mechanism for base-mediated autocatalytic amplification ..... 14
Figure 1-14. Synthetic scheme for reagent 1-25 ..................................................................... 15
Figure 1-15. Synthetic schemes for reagents 1-15, 1-16, and 1-17 ......................................... 16
Figure 1-16. Products of the autocatalytic reaction of 1-17 with piperidine ........................... 17
Figure 1-17. LCMS traces of the autocatalytic reaction of 1-17 with piperidine ................... 17

viii
Figure 1-18. Product concentration and composition data for the autocatalytic reaction of
1-17 with piperidine via LCMS .......................................................................... 18
Figure 1-19. Time lapsed UV/Vis data of the reaction of 1-15 with piperidine ..................... 19
Figure 1-20. Comparison of kinetics of autocatalytic reagents 1-15, 1-16, and 1-17 ............. 19
Figure 1-21. Graphs depicting relative reaction rates of reagents 1-15, 1-16, and 1-17 ......... 20
Figure 1-22. Structures of autocatalytic reagents and intermediates....................................... 21
Figure 1-23. Comparison of kinetics profiles of reagents and intermediates .......................... 22

ix
Chapter 2
Figure 2-1. Classification of four types of depolymerizable polymers ................................... 28
Figure 2-2. Schematic depiction of CDr poly(carbamate) depolymerization .......................... 31
Figure 2-3. A novel carbamate spacer for controlled release by Katzenellenbogen ............... 31
Figure 2-4. Dendritic amplification reagent 2-2 by Shabat ..................................................... 32
Figure 2-5. Synthesis of linear poly(carbamate) 2-4 by Shabat .............................................. 31
Figure 2-6. Schematic depitction of CDr poly(benzyl ether) depolymerization ..................... 34
Figure 2-7. Selective disassembly of benzyl ether oligomer 2-5 by McGrath ........................ 34
Figure 2-8. Synthesis and depolymerization of poly(benzyl ether) 2-7 by Olah .................... 35
Figure 2-9. Schematic depiction of intramolecular cyclizing CDr polymers .......................... 36
Figure 2-10. Schematic depiction of CDr poly(phthalaldehyde) depolymerization ................ 38
Figure 2-11. Illustration of the selective depolymerization of patterned plastics ................... 39
Figure 2-12. Schematic depiction of CDr poly(ethyl glyoxalate) depolymerization .............. 39
Figure 2-13. Depolymerization of NVOC end-capped 2-13 ................................................... 40
Figure 2-14. Depolymerization mechanism of benzene-based CDr poly(carbamates) ........... 42
Figure 2-15. Release rates for carbamate spacers of varying aromaticity............................... 43
Figure 2-16. Proposed release mechanism of heterocyclic poly(carbamates) ........................ 44
Figure 2-17. Comparison of resonance energies in benzene, thiophene, and furan ................ 44
Figure 2-18. Synthetic scheme for model furan reagent 2-23 ................................................. 45

x
Figure 2-19. Expected mechanism of response of 2-23 to base .............................................. 45
Figure 2-20. Response of reagent 2-23 to 1 equiv of piperidine ............................................. 46
Figure 2-21. NMR spectra of the degradation of 2-23 after exposure to piperidine ............... 47
Figure 2-22. Kinetics comparison of 2-23 and control reagent 2-24 ...................................... 47
Figure 2-23. Kinetics of the decomposition of 2-23 in solution ............................................. 48
Figure 2-24. NMR spectra of the decomposition of 2-23 in solution .................................... 49
Figure 2-25. Proposed mechanism for the autooxidation of 2-23 ........................................... 49
Figure 2-26. Proposed Diels-Alder reaction between 2-23 and 2-27 ...................................... 50
Figure 2-27. Synthetic scheme for furan monomer 2-33 ........................................................ 50
Figure 2-28. Proposed mechanisms of resonance in 2-furylcarbamates ................................. 51
Figure 2-29. Strategies for increasing the stability of 2-furylcarbamates ............................... 51
Figure 2-30. Synthetic scheme for thiophene model reagent 2-39 ......................................... 52
Figure 2-31. Kinetics and NMR data: exposure of 2-39 to a 10% piperidine solution ........... 53
Figure 2-32. Kinetics comparison of 2-39 and control reagent 2-40 ...................................... 54
Figure 2-33. Synthetic scheme for thiophene monomer 2-47 ................................................. 55

xi
Chapter 3
Figure 3-1. Depolymerization mechanism of poly(benzyl ethers) containing a single
reaction-based detection unit at the terminus of the polymer ............................... 64
Figure 3-2. Depolymerization mechanism of poly(benzyl ethers) with reaction-based
detection units on each monomer unit .................................................................. 65
Figure 3-3. Structures of polymers 3-1, 3-2, and 3-3 by Yeung ............................................. 65
Figure 3-4. Photographs of solid-state studies exposing 3-1 to TBAF by Yeung ................... 66
Figure 3-5. Photographs of solid-state studies exposing 3-2 to TBAF by Yeung ................... 67
Figure 3-6. Photographs of solid-state studies exposing 3-3 to TBAF by Yeung ................... 67
Figure 3-7. Poly(phthalaldehyde) polymers with end caps of differing polarity .................... 68
Figure 3-8. Structures of Pd(0)-responsive poly(benzyl ethers) with varying degrees of
polarity on each repeating unit of the polymer ..................................................... 69
Figure 3-9. Synthetic scheme for monomer 3-7 ...................................................................... 70
Figure 3-10. Synthetic scheme for monomer 3-8 .................................................................... 70
Figure 3-11. Synthetic scheme for monomer 3-9 .................................................................... 71
Figure 3-12. Conditions for anionic polymerization of polymers 3-4, 3-5, and 3-18 ............. 71
Figure 3-13. Synthesis of polymer 3-6 via azide/alkyne cycloaddition .................................. 72
Figure 3-14. Depolymerization reaction and conditions for solution phase studies ............... 73
xii
Figure 3-15. GPC chromatograms of polymers 3-4 and 3-6 in response to Pd(PPh3)4 and
DBU in THF ....................................................................................................... 73
Figure 3-16. GPC chromatograms of solution phase control studies for 3-4 and 3-6 ............. 74
Figure 3-17. Time lapsed photographs of the solid-state depolymerization of discs
prepared from polymers 3-4, 3-5, and 3-6 .......................................................... 75
Figure 3-18. Photographs of solid-state control studies of 3-4, and 3-6 ................................. 76
Figure 3-19. GPC chromatograms of the solution surrounding solid-state control studies
of polymers 3-4 and 3-6 ...................................................................................... 77
Figure 3-20. GPC analysis of the solution surrounding a solid-state depolymerization
experiment with polymer 3-6 .............................................................................. 78
Figure 3-21. LCMS analysis of the solution surrounding a solid-state depolymerization
experiment with polymer 3-6 .............................................................................. 78
Figure 3-22. Contact angle measurements of polymer films of 3-4, 3-5, and 3-6 ................. 79
Figure 3-23. SEM images of discs fabricated from 3-4, 3-5, and 3-6 ..................................... 80
Figure 3-24. Young’s modulus measurements of polymers 3-4, 3-5, and 3-6 ........................ 81

xiii
Chapter 4
Figure 4-1. Mechanophores used to create mechanoresponsive polymers ............................. 85
Figure 4-2. Illustration of the mechanism of polymer chain scission in response to
ultrasound sonication ............................................................................................ 86
Figure 4-3. Proposed mechanims for the heterolytic cleavage of poly(ethylene glycol) in
water by Aktah and Frank .................................................................................... 88
Figure 4-4. Proposed mechanism of heterolytic cleavage using a triarylsulfonium salt
mechanophore by Moore ...................................................................................... 88
Figure 4-5. Proposed mechanism for heterolytic cleavage and subsequent
depolymerization of poly(phthalaldehyde) by Moore and Boydston ................... 89
Figure 4-6. Trapping experiment data of poly(phthalaldehyde) by Moore ............................. 90
Figure 4-7. Synthetic schemes for polymers 4-1, 4-2, and 4-3 ............................................... 91
Figure 4-8. Setup of the sonication apparatus ......................................................................... 92
Figure 4-9. Response of 4-1 (45.4 kDa, DP = 224) to ultrasound sonication ......................... 93
Figure 4-10. NMR spectra of 4-4 production following sonication of 4-1 ............................. 94
Figure 4-11. Response of 4-2 (44.2 kDa, DP = 151) to ultrasound sonication ....................... 95
Figure 4-12. Response of 4-3 (21.0 kDa, DP = 165) to ultrasound sonication ....................... 96
Figure 4-13. Response of 4-1 (59.0 kDa, DP = 290) to ultrasound sonication ....................... 97
Figure 4-14. Trapping experiment of 4-1 (59.0 kDa, DP = 290) with 2-methylindole ........... 98

xiv
Figure 4-15. Trapping experiment of 4-1 (59.0 kDa, DP = 290) with TBC-Cl/pyridine ........ 99
Figure 4-16. Comparison of 4-1 end group trapping efficiency ............................................ 99
Figure 4-17. Trappping experiment of 4-2 (44.2 kDa, DP = 151) with 2-methylindole ......... 100
Figure 4-18. Responses of varying lengths of 4-1 to ultrasound sonication ........................... 101
Figure 4-19. Graphs depicting the production of 4-4 in response to ultrasound sonication
of multiple lengths of 4-1 ................................................................................... 102
Figure 4-20. Schematic illustration of terminating depolymerization of 4-1 through back-
biting cyclization ................................................................................................ 103

xv
Chapter 5
Figure 5-1. Synthetic scheme for compound 1-25 .................................................................. 112
Figure 5-2. Synthetic scheme for compound 1-15 .................................................................. 116
Figure 5-3. Synthetic scheme for compound 1-16 .................................................................. 117
Figure 5-4. Synthetic scheme for compound 1-17 .................................................................. 118
Figure 5-5. Synthetic scheme for compound 2-23 .................................................................. 123
Figure 5-6. Synthetic scheme for monomer 2-33 .................................................................... 126
Figure 5-7. Synthetic scheme for compound 2-39 .................................................................. 128
Figure 5-8. Synthetic scheme for monomer 2-46 .................................................................... 132
Figure 5-9. Synthetic scheme for monomer 3-7 ...................................................................... 137
Figure 5-10. Synthetic scheme for monomer 3-8 .................................................................... 139
Figure 5-11. Synthetic scheme for compound 3-16 ................................................................ 140
Figure 5-12. Synthetic scheme for monomer 3-9 .................................................................... 142
Figure 5-13. Synthetic scheme for compound 3-22 ................................................................ 143
Figure 5-14. Synthetic scheme for polymer 3-4 ...................................................................... 144
Figure 5-15. Synthetic scheme for polymer 3-5 ...................................................................... 145
Figure 5-16. Synthetic scheme for polymer 3-18 .................................................................... 147
Figure 5-17. Synthetic scheme for polymer 3-6 ...................................................................... 148
xvi
ACKNOWLEDGEMENTS
I would have never made it this far without the unwavering support and love I’ve
received from my mother, Janet, and my father, Tim, to whom I dedicate this thesis. From the
classroom to the baseball field, they always provided everything I needed to succeed throughout
my entire life. Additionally, to my grandmother, Karen, and her father, Nis, for paving the way
and setting high standards for producing chemists in our family.
To my advisor, Scott Phillips, for giving me every opportunity I needed to develop into a
true scientist. He helped to cultivate my intellectual curiosity and instilled the confidence I
needed to work independently through scientific challenges. His drive and creativity will leave a
lasting impression on my career as a scientist and as a professional. I would also like to thank
committee members Ken Feldman, Rob Rioux, Alex Radosevich, and especially Pshemak
Maslak, who pinch-hit in a crucial moment when scheduling conflicts arose for my defense.
Phillips Group members, past and present, have been an astounding collection of
intelligent, passionate, and hard-working scientists. I could not have asked for better mentors
early on in my graduate school than Kyle Schmid, Hemakesh Mohapatra, and Kimy Yeung, who
constantly helped instill in me the standards of conducting high-quality research. Furthermore, to
Anthony DiLauro and Mike Olah, who provided invaluable guidance in my transition to
becoming a polymer chemist. Finally, to Adam Brooks, who I’ve literally spent more time with
over the past four years than anyone else, for being a great friend and coworker who I could
always count on to have thoughtful, detailed conversations about chemistry.
To my roommates, Sean, and Mark, as well as our good friends from Founders, Oskar
Blues, Tröegs, and Ommegang, for always being the outlet I needed to escape the rigors of grad

xvii
school. As well as my friends Brittney, Ryan, Nick, Matt, Steve, Brian, Erica, and Ina, who
helped me to create a wealth of memories during my five years in State College. Additionally to
the inventors of streaming online radio, who allowed me to keep up with the Huskers, Cyclones,
Bluejays, Royals, Angels, and Chiefs during countless late night spent in the lab.
And last, but not least, to my girlfriend Jenny, who has been the most constant source of
inspiration, motivation, and support throughout my graduate school career. I cannot even begin to
describe how valuable it has been to have someone that has been through this gauntlet before to
help guide and encourage me every step of the way. I am so excited to move to Cincinnati to
begin a new chapter in our lives together.

1
Chapter 1
Base-Mediated Autocatalytic Signal Amplification
1.1 Introduction
There is an increasing demand for inexpensive, stable, and easy-to-use diagnostic
tests.1 Current efforts are focused on creating assays that do not require the use of
instrumentation, since electricity often is not accessible in resource-limited environments.
In the absence of instrumentation, low intensity readouts and high limits of detection are
common drawbacks of traditional point-of-use assays.2 Thus, steps are currently being
taken to overcome these limitations, including the development of small molecule
reagents for signal amplification.3–8
The ideal reagent would be thermally stable in all environmental conditions and
provide a readout that is visible to the naked eye in response to only trace quantities of a
desired analyte. In order for the reagent to be practical in a point-of-use assay, it must
amplify a signal rapidly in response to concentrations of the analyte that are below
biologically-relevant thresholds. An attractive approach to this challenge is to develop a
reagent that is capable of amplifying a signal autonomously only after exposure to a trace
level of a specific stimulus.

2
1.2 Catalytic Amplification Systems
Catalytic amplification is a process in which a single molecule is responsible for
converting multiple copies of the same substrate into a desired product. As the reaction
progresses, the amount of product will increase proportionally as long as catalyst
turnover does not diminish. This is an appealing strategy toward creating signal
amplification reagents for diagnostic assays. Amplification systems have been developed
using two predominant classes of catalytic amplification: i) transition metal catalysis and
ii) enzyme-based catalysis.
1.2.1 Transition Metal Catalytic Amplification
Transition metal catalysts are commonly employed as a method for performing
complex chemical transformations while using small amounts of expensive metal
reagents. While known predominantly for their use in synthetic chemistry, transition
metal catalysts have been adapted for use in signal amplification reactions due to their
ability to execute the same reaction on multiple equivalents of a substrate. As long as the
catalyst continues to convert reactants to products (i.e. the catalyst is not poisoned or
degraded), signal amplification is achieved until the substrate is consumed (Figure 1-1).
Figure 1-1. Schematic depiction of catalytic signal amplification.

3
In 2004, Anslyn and coworkers developed one of the first examples of transition
metal catalysis for signal amplification.9 Activation of this system occurs in response to
Cu(II), which preferentially displaces an inactive Pd(II) catalyst from a polyazacyclam
inhibitor (Figure 1-2). Once the palladium species is activated by release, it catalyzes an
intramolecular Heck cross-coupling reaction of 1-1, which amplifies the signal by
forming highly fluorescent indole 1-2 as a readout. This signal amplification reaction is
capable of detecting Cu(II) concentrations as low as 30 nM over the course of 1.5 h.
Figure 1-2. Catalytic signal amplification based on Cu(II) detection and a subsequent
Heck cross-coupling reaction to produce an amplified fluorescent produc.9 Reproduced
with permission from J. Am. Chem. Soc. 2004, 126 (45), 14682−14683. Copyright 2004
American Chemical Society.
A second approach to stimulus-induced activation of a transition metal catalyst
was reported by Mirkin and coworkers.10
This allosterically-regulated system is based on
the activation of a zinc catalyst at the center of a macrocyclic compound (Figure 1-3).
The initial structure of macrocycle 1-3 is compressed, and the zinc catalyst is sterically
hindered due to the bulky surrounding ligands. The catalyst is consequently incapable of
reacting with the amplification substrate (1-4). However, two tetravalent rhodium atoms

4
within the macrocycle change geometry in the presence of Cl− and CO, which
subsequently expands the macrocycle and exposes the interior of the zinc catalysts
(compound 1-5). Following activation, the zinc atoms perform catalytic cleavage of the
phosphate group on 2-(hydroxypropyl)-p-nitrophenyl phosphate (1-4). Reaction progress
can be monitored with UV/Vis spectroscopy, measuring the generation of yellow 4-
nitrophenol (1-6), the amplified reaction product.
Figure 1-3. Allosterically-regulated catalytic signal amplification as demonstrated by
Mirkin and coworkers.10
Activation of macrocycle 1-3 leads to catalytic amplification of
the chemical reporter, 4-nitrophenol (1-6). Reproduced with permission from J. Am.
Chem. Soc. 2007, 129 (46), 14182−14183. Copyright 2007 American Chemical Society.

5
1.2.2 Enzyme-Based Amplification
Enzyme-based amplification works in a similar capacity to transition metal-
catalyzed amplification, but does not require a preliminary step to activate the enzyme for
catalysis. Instead, the enzymes are predisposed to perform substrate-specific reactions.
Enzymes typically contain one or more active sites, which are regions capable of
selectively binding a substrate, performing a particular chemical transformation, and then
releasing the products to make the active site available for another substrate.
For example, β-galactosidase is a hydrolase enzyme that catalyzes the hydrolysis
of β-galactosides into monosaccharides through cleavage of a glycosidic bond.11
Rotello
and coworkers demonstrated a signal amplification system predicated on the cleavage of
a galactose unit from 4-methylumbelliferyl-β-D-galactopyranoside (1-7) to catalytically
amplify highly fluorescent 4-methylumbelliferone12
(1-8, Figure 1-4). The reaction rate is
dose-dependent, as the production of 1-8 can be monitored and used to calculate the
amount of β-galactosidase in a given sample.
Figure 1-4. Enzymatic signal amplification using β-galactosidase to facilitate the
production of a fluorescent coumarin derivative (1-8).12

6
Rates of amplification in enzymatic catalysis reactions can be correlated to the
concentration of β-galactosidase in solution, providing a versatile strategy for detecting
the presence of the enzyme in a given sample. Other systems have been developed in a
similar manner to create diagnostic reactions for enzymes such as alkaline phosphatase
and horseradish peroxidase.13
1.2.3 Summary of Catalytic Amplification
While catalysis is a versatile approach to signal amplification, many assays still
fall short of the requirements necessary for viable point-of-need diagnostics. Assays
containing biological molecules (i.e., enzymes or proteins) are often not thermally stable,
and thus decrease in activity when stored a ove 0 C. Additionally, since there is a fixed
concentration of the catalyst (e.g., Pd(0)), these methods often are not sensitive enough to
enable rapid trace-level detection of contaminants or biomarkers for disease. Overcoming
this limitation requires the development of more sensitive reaction systems that amplify
the reaction stimulus itself while simultaneously providing a visible readout.
1.3 Autocatalytic Amplification
1.3.1 Introduction to Autocatalysis
Autocatalysis is a unique type of amplification in which the product of a reaction
is capable of catalyzing the formation of more of itself.14
It may be argued that
autocatalysis is the most efficient method for signal amplification, as the amount of
chemical signal is amplified exponentially while never itself being consumed. As a result,

7
an autocatalytic reaction displays sigmoidal kinetics. The initial step in an autocatalytic
process is activation of a catalyst, which in turn exponentially amplifies the concentration
of the initiating species in the reaction. (Figure 1-5).15
Figure 1-5. Schematic illustration of an autocatalytic signal amplification reaction.
While many naturally-occurring autocatalytic systems exist, there are relatively
few examples of small molecule autocatalytic amplification.1,14,16–19
One well-known
autocatalytic process is the “vinegar syndrome,” in which acid-sensitive cellulose acetate
films produce acetic acid upon degradation, which further amplifies the rate of hydrolysis
of the acetal functionality in cellulose.20
This mechanism is also responsible for the
autocatalytic degradation of acetylsalicylic acid (aspirin). Additionally, autocatalysis can
occur during i) silver reduction21
(where the reduction of Ag(I) to Ag(0) is catalyzed by
Ag(0)), ii) formation of tin pest22
(the transformation of β-tin to α-tin), and iii) the
Belousov-Zhabotinsky (BZ) reaction23
(an oscillating reaction catalyzed by metal-ion
oxidation and the bromination of malonic acid by bromates).

8
1.3.2 Examples of Autocatalysis
A landmark advancement in small molecule autocatalysis was published by
Mirkin and coworkers in 2008 by modifying the previously discussed allosteric zinc
catalysis reaction7 (Figure 1-3). Instead of using Cl
− and CO as activating reagents, the
revised system employs an acetate ion as the initiator for selective opening of the
macrocyclic cage. Once activated, the available zinc atoms catalyze the cleavage of acetic
anhydride, which produces an additional equivalent of the acetate initiator (Figure 1-6). A
pH-sensitive colorimetric dye was included in the mixture to report the increase in acidity
of the reaction medium following autocatalytic production of acetic acid.
Figure 1-6. Schematic depiction of the autocatalytic reaction performed by the enzyme
mimic system developed by Mirkin and coworkers.7
Ultimately, autocatalytic chemical reactions are rare, the majority of which are
not suitable for use in diagnostics or point-of-need assays. As a starting point for
addressing this challenge, our group adapted a non-linear reaction previously identified
by Ichimura and coworkers24
(Figure 1-7). Following an initial detection event of an
amine base by deprotonation of Fmoc, the system exponentially amplifies the

9
concentration of aliphatic amines through carbamate elimination and subsequent
regeneration of the initial amine.
Figure 1-7. Autocatalytic fragmentation of 1-9 developed by Ichimura and coworkers.24
Ichimura used the base proliferation reaction for photolithography (Figure 1-8),24–
26 where exposure of photo-sensitive compound 1-10 to light leads to the release of a
diamine. The diamine catalytically deprotonates the fluorenylmethyloxycarbonyl (Fmoc)
groups on compound 1-11. Deprotection of 1-11 subsequently releases 1,6-
hexanediamine, which is used as a crosslinking reagent for epoxide polymer 1-12.
Figure 1-8. Base-mediated autocatalysis as a method for photo-induced crosslinking to
create chemically-amplified photoresists.25
Reproduced with permission from J. Mater.
Chem. 2004, 14 (3), 336−343. Copyright 2004 Royal Society of Chemistry.

10
Mohapatra and Phillips later applied this autocatalytic reaction toward the
development of 1-13, the first autocatalytic signal amplification reagent for use in point-
of-need assays (Figure 1-9a).8 Included in the output of each reaction cycle is a
dibenzofulvene chromophore, which can be quantified easily throughout the reaction by
UV/Vis spectroscopy. When used as a signal amplification reagent, 1-13 is capable of
detecting trace levels of piperidine (.001 equiv) over the course of 18 h (Figure 1-9b).
Figure 1-9. a) Fmoc carbamate-based autocatalytic amplification. b) Response profiles of
the reaction when exposed to piperidine.8 Reproduced with permission from Chem.
Commun. 2012, 48 (24), 3018−3020. Copyright 2012 Royal Society of Chemistry
a)
b)

11
Additionally, Mohapatra and Phillips adapted the same signal amplification
mechanism toward the detection of multiple analytes8 (Figure 1-10). Their approach
creates an avenue for tailoring diagnostics to detect numerous analytes using the same
underlying mechanism of autocatalytic signal amplification. For example, by replacing
Fmoc with an allyloxycarbonyl (Alloc) group, piperidine can be released from activity-
based detection reagent 1-14 in the presence of Pd(0). If piperidine-sensitive signal
amplification reagent 1-13 is included in the same solution, the concentration of
piperidine will be amplified in response to Pd(0) (Figure 1-10). This particular tandem
amplification system has a limit of detection of 12 ppm Pd(0), which is near the
government-regulated threshold for the concentration of palladium in drugs (5−10 ppm).8
Figure 1-10. A reagent (1-14) designed for a tandem system to detect palladium (0), and
subsequently amplify the signal via base-mediated autocatalysis using reagent 1-13.8
Reproduced with permission from Chem. Commun. 2012, 48 (24), 3018−3020. Copyright
2012 Royal Society of Chemistry

12
1.3.3 Limitations of Amplification Reagent 1-13
While this autocatalytic system successfully detects trace quantities of analytes,
the rate of the core signal amplification reaction in this system is far slower than is
desirable for use in practical point-of-need assays. This is primarily a result of the slow
initial induction period. Thus, we conducted research on a series of reagents with the goal
of reducing the time necessary to achieve amplified responses in a base-mediated
amplification reaction.
1.4 Experimental Design
To improve the rate of base-mediated signal amplification, we investigated the
extent to which two physical properties affect the rate of the autocatalytic reaction: i) the
proximity of reactive units to each other, and ii) the presence of a high local effective
concentration of base. By tethering multiple reactive carbamates to a single structure, the
distance a released molecule of piperidine must travel to react with a neighboring Fmoc
carbamate is decreased compared to a solution consisting solely of reagents with a single
reactive moiety (Figure 1-11). As more reactive carbamates are added to a single
molecule, the process of amplification may produce a transient area of high effective
signal concentration near the reagent, perhaps accelerating the rate of the autocatalytic
reaction.

13
Figure 1-11. Schematic depiction of the functional group proximity hypothesis. By
tethering multiple reactive groups to a single molecule (left), a higher density of reactive
groups exists within the same volume of solution.
As a proof of concept for this hypothesis, a series of small molecule reagents (1-
15, 1-16, and 1-17) were synthesized with one, two, and three reactive carbamates,
respectively (Figure 1-12). The benzyl carbamate spacer was removed from the
previously-studied reagent to prevent possible side reactions with the electrophilic
azaquinone methide byproduct or subsequent amine adducts. The removal of the spacer
will also, in theory, accelerate the release of piperidine by providing direct elimination of
carbon dioxide and the amine following a detection event (Figure 1-13). In agreement
with our hypothesis, kinetics experiments showed that attaching additional carbamates to
a single molecule increases the rate of reaction. We studied the reagents in detail to
further understand these effects.

14
Figure 1-12. Three test reagents designed to determine how additional reactive
carbamates on a single molecule affect the rate of signal amplification in response to
piperidine.
Figure 1-13. Revised reaction mechanism for base-mediated autocatalytic signal
amplification.

15
1.5 Results and Discussion
1.5.1 Synthesis of the Reagents
Model compounds (1-15, 1-16, 1-17) were synthesized from the same core
compound (1-25) containing the autocatalytic Fmoc piperidine carbamate. Compound 1-
25 was synthesized in seven steps with a 22% overall yield by following procedures
partially adapted from Mutter and Bellof27
(Figure 1-14). Due to the reactive nature of the
9-position on the fluorene ring, care was taken to minimize exposure to heat, air, and base
to prevent spurious oxidation, release of piperidine, and premature initiation of the
autocatalytic process.
Figure 1-14. Synthetic scheme for key reagent 1-25.

16
Following the synthesis of 1-25, the appropriate isocyanate linker was coupled to
the free alcohol to produce 1-15, 1-16, and 1-17, also referred to as the monomer, dimer,
and trimer, respectively (Figure 1-15).
Figure 1-15. Coupling reactions used to synthesize 1-15, 1-16, and 1-17 from 1-25.
1.5.2 LCMS Mechanistic Studies
In order to corroborate the expected reaction mechanism, liquid chromatography
mass spectrometry (LCMS) studies were performed to identify each product during the
autocatalytic reaction. In separate experiments, 100 mM solutions of each reagent (i.e., 1-
15, 1-16, or 1-17) was exposed to 0.1 equivalents of piperidine. Aliquots of 2 μL were
removed from the reaction mixture, diluted in 250 μL THF, and then injected into the
LCMS at 60 min intervals. Peaks corresponding to each expected intermediate in the
autocatalytic reactions of 1-16 and 1-17 revealed that the signal amplification reactions
proceeded as desired (Figures 1-16, 1-17 and 1-18 show an example for reagent 1-17).

17
Figure 1-16. Expected products and mass values for the reaction of 1-17 with piperidine.
Figure 1-17. LCMS traces of the autocatalytic reaction of 1-17 at hour intervals,
measured at 254 nm. Reagent 1-17 is represented by the peak ~3.5 min, and each
successive reaction product (Figure 1-16) has an increasingly lower retention time.
Naphthalene (~1.5 min) was used as an internal standard.
M+ H+ = 1553.7 M + H+ = 1424.6
M + H+ = 1295.5 M + H+ = 1166.4
1-17 1-26
1-27 1-28
0 1 2 3 4 5Retention Time (min)
1 h
2 h
3 h
4 h
5 h
6 h
7 h

18
Figure 1-18. Plot of LCMS data indicating relative concentrations of each reaction
species throughout the course of the autocatalytic reaction of 1-17. Colors correspond to
reagents in Figure 1-16: 1-17 (black), 1-26 (blue), 1-27 (orange), 1-28 (green).
1.5.3 UV/Vis Kinetic Studies
A series of UV/Vis experiments were then designed to measure the rates of
reaction for each model compound. Each reagent (100 mM in THF) was exposed to 0.1
equivalents of piperidine. Every hour, 1 μL of the solution was removed and diluted in 1
mL THF, and the absorbance was analyzed via UV/Vis spectroscopy (Figure 1-19).
Formation of dibenzofulvene following elimination of carbon dioxide generates a new
peak maximum at 310 nm. The increase in absorbance at this wavelength was used to
generate the kinetics graph in Figure 1-20.
1 2 3 4 5 6 7
LCM
S In
tegr
atio
n(r
ela
tive
to n
aph
thal
en
e)
Time (h)

19
Figure 1-19. Time lapsed UV/Vis data of dibenzofulvene formation following the
reaction of 1-15 with 0.1 equiv piperidine.
Figure 1-20. Reaction rate comparison of autocatalytic reagents 1-15, 1-16, and 1-17 in
THF in response to 0.1 equiv piperidine. The data points are the average of three
measurements, and the error bars reflect the standard deviation of these averages.
290 300 310 320 330
Ab
sorb
ance
Wavelength (nm)
t = 0
t = 18 h
0 2 4 6 8 10 12 14
(A −
Ao)/
(Am
ax−
Ao)
Time (h)
1-15, 1-16, 1-17

20
While incorporating more reactive functional groups per molecule increases the
rate of reaction, the duration of the reaction (time necessary for the reaction to reach 80%
completion) does not decrease proportionally with the addition of each carbamate (i.e.,
the duration of reaction for the dimer was not half of the duration of reaction for the
monomer) (Figure 1-21a). This non-proportional relationship also holds true for the rate
of dibenzofulvene production for all three reagents. By plotting dibenzofulvene
concentration against time, the slope of the data at any given point within the kinetics
profile expresses the instantaneous rate of change in dibenzofulvene concentration. The
largest rate of dibenzofulvene production found in the reactions of 1-15, 1-16, and 1-17
with 0.1 equiv piperidine is illustrated in Figure 1-21b.
Figure 1-21. a) Time required to reach 80% completion for the autocatalytic reactions of
reagents 1-15, 1-16, and 1-17 (100 mM in THF) after exposure to 0.1 equiv piperidine
(Figure 1-20). b) Maximum rate of change of dibenzofulvene concentration in the
reaction described in a) for reagents 1-15, 1-16, and 1-17.
1-15 1-16 1-171-15 1-16 1-17
7.47 h
4.71 h
3.56 h16.2 M/h
25.5 M/h
31.8 M/ha) b)

21
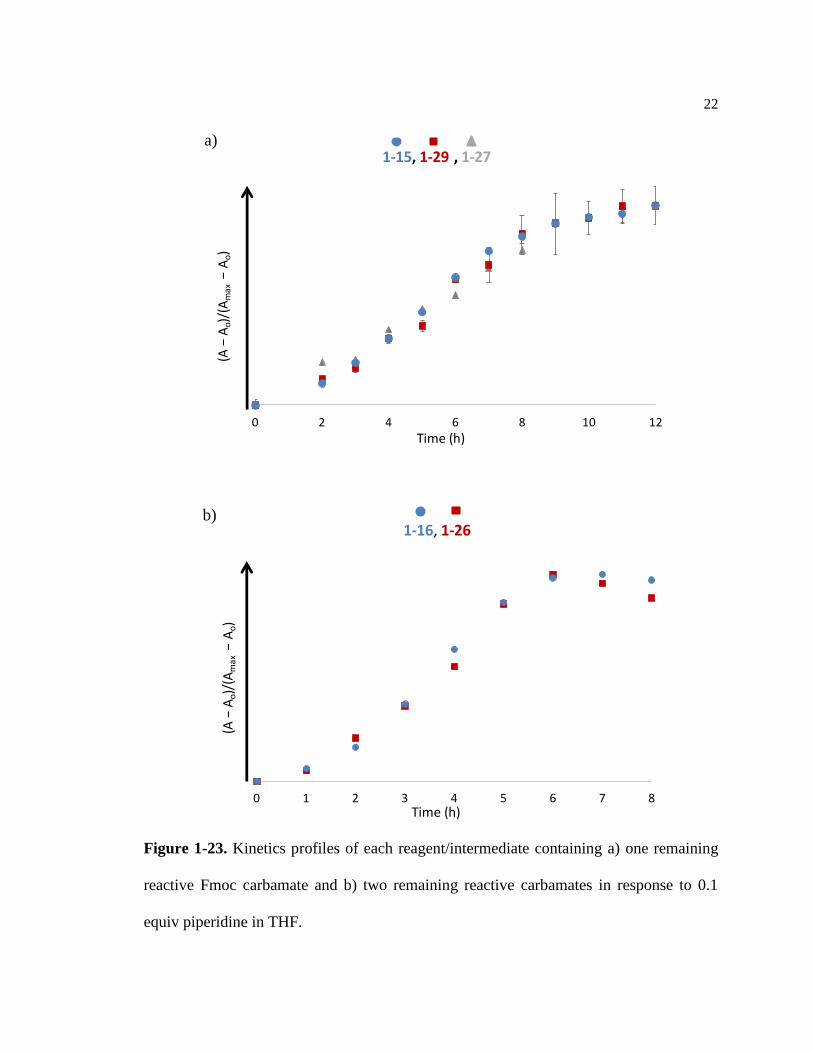
We hypothesized that, due to the increased planarity of dibenzofulvene, it is
possible that a structural conformation change following the first detection event on the
dimer or trimer may inhibit future piperidine units from accessing remaining carbamates
on the molecule. To test this theory, intermediates of each autocatalytic reagent (Figure
1-22) were isolated by column chromatography and used for individual kinetics
experiments. If the conformation hypothesis is correct, 1-15 and 1-26 should exhibit
different kinetics profiles. In this case, we could expect the rate of the dimer intermediate
to be visibly slower than the rate of the monomer. The results of these kinetics studies are
shown in Figure 1-23.
Figure 1-22. Autocatalytic reagents and intermediates containing a) a single reactive
Fmoc carbamate and b) two reactive Fmoc carbamates.
a)
b)
22
Figure 1-23. Kinetics profiles of each reagent/intermediate containing a) one remaining
reactive Fmoc carbamate and b) two remaining reactive carbamates in response to 0.1
equiv piperidine in THF.
0 2 4 6 8 10 12
(A −
Ao)
/(A
max
− A
o)
Time (h)
1-15, 1-29 , 1-27a)
0 1 2 3 4 5 6 7 8
(A −
Ao)/
(Am
ax−
Ao)
Time (h)
1-16, 1-26b)

23
The latter UV/Vis experiments reveal that any conformational effects occurring
as a result of prior carbamate elimination reactions have no effect on the subsequent rates
of reaction for each reagent.
1.6 Conclusions
In conclusion, we have shown that the rate of a base-mediated autocatalytic
reaction can be increased by attaching multiple reactive functionalities onto a single
molecule. However, the rates and durations of the reactions do not change proportionally
to the number of Fmoc carbamates added to the structure. On reagents containing more
than one reactive functionality, it was determined that changes in structure or
conformation resulting from prior detection events do not affect succeeding rates of
reaction. These results have provided guidance for potentially incorporating a base-
mediated autocatalytic reaction into a stimuli-responsive material.

24
1.7 References
(1) Scrimin, P.; Prins, L. J. Sensing through Signal Amplification. Chem. Soc. Rev.
2011, 40 (9), 4488–4505.
(2) Yager, P.; Edwards, T.; Fu, E.; Helton, K.; Nelson, K.; Tam, M. R.; Weigl, B. H.
Microfluidic Diagnostic Technologies for Global Public Health. Nature 2006, 442,
412–418.
(3) Amir, R. J.; Pessah, N.; Shamis, M.; Shabat, D. Self-Immolative Dendrimers.
Angew. Chem. Int. Ed. 2003, 42 (37), 4494–4499.
(4) Zhu, L.; Anslyn, E. V. Signal Amplification by Allosteric Catalysis. Angew. Chem.
Int. Ed. 2006, 45 (8), 1190–1196.
(5) Song, F.; Garner, a L.; Koide, K. Highly Sensitive Fluorescent Sensor for
Palladium Based on the Allyl Oxidative Insertion Mech. J. Am. Chem. Soc. 2007,
129 (41), 12354–12355.
(6) Masar, M. S.; Gianneschi, N. C.; Oliveri, C. G.; Stern, C. L.; Nguyen, S. T.;
Mirkin, C. A. Allosterically Regulated Supramolecular Catalysis of Acyl Transfer
Reactions for Signal Amplification and Detection of Small Molecules. J. Am.
Chem. Soc. 2007, 129 (33), 10149–10158.
(7) Hyo, J. Y.; Mirkin, C. A. PCR-like Cascade Reactions in the Context of an
Allosteric Enzyme Mimic. J. Am. Chem. Soc. 2008, 130 (35), 11590–11591.
(8) Mohapatra, H.; Schmid, K. M.; Phillips, S. T. Design of Small Molecule Reagents
That Enable Signal Amplification via an Autocatalytic, Base-Mediated Cascade
Elimination Reaction. Chem. Commun. 2012, 48 (24), 3018–3020.
(9) Wu, Q.; Anslyn, E. V. Catalytic Signal Amplification Using a Heck Reaction. An
Example in the Fluorescence Sensing of Cu(II). J. Am. Chem. Soc. 2004, 126 (45),
14682–14683.
25
(10) Hyo, J. Y.; Heo, J.; Mirkin, C. A. Allosteric Regulation of Phosphate Diester
Transesterification Based upon a Dinuclear Zinc Catalyst Assembled via the
Weak-Link Approach. J. Am. Chem. Soc. 2007, 129 (46), 14182–14183.
(11) McCarter, J. D.; Withers, S. G. Mechanisms of Enzymatic Glycoside Hydrolysis.
Curr. Opin. Struct. Biol. 1994, 4 (6), 885–892.
(12) Miranda, O. R.; Chen, H. T.; You, C. C.; Mortenson, D. E.; Yang, X. C.; Bunz, U.
H. F.; Rotello, V. M. Enzyme-Amplified Array Sensing of Proteins in Solution and
in Biofluids. J. Am. Chem. Soc. 2010, 132 (14), 5285–5289.
(13) Porstmann, B.; Porstmann, T.; Nugel, E.; Evers, U. Which of the Commonly Used
Marker Enzymes Gives the Best Results in Colorimetric and Fluorimetric Enzyme
Immunoassays: Horseradish Peroxidase, Alkaline Phosphatase or ??-
Galactosidase? J. Immunol. Methods 1985, 79 (1), 27–37.
(14) Bissette, A. J.; Fletcher, S. P. Mechanisms of Autocatalysis. Angew. Chem. Int. Ed.
2013, 52 (19), 12800–12826.
(15) Robertson, A.; Sinclair, A. J.; Philp, D. Minimal Self-Replicating Systems. Chem.
Soc. Rev. 2000, 29 (2), 141–152.
(16) Bachmann, P. A.; Luisi, P. L.; Lang, J. Autocatalytic Self-Replicating Micelles as
Models for Prebiotic Structures. Nature 1992, 357, 57–59.
(17) Blackmond, D. G. Asymmetric Autocatalysis and Its Implications for the Origin of
Homochirality. Proc. Natl. Acad. Sci. U. S. A. 2004, 101 (16), 5732–5736.
(18) Gerdts, C. J.; Sharoyan, D. E.; Ismagilov, R. F. A Synthetic Reaction Network:
Chemical Amplification Using Nonequilibrium Autocatalytic Reactions Coupled
in Time. J. Am. Chem. Soc. 2004, 126 (20), 6327–6331.
(19) Meyer, A. J.; Ellefson, J. W.; Ellington, A. D. Abiotic Self-Replication. Acc.
Chem. Res. 2012, 45 (12), 2097–2105.

26
(20) Allen, N. S.; Edge, M.; Appleyard, J. H.; Jewitt, T. S.; Horie, C. V.; Francis, D.
Degradation of Historic Cellulose Triacetate Cinematographic Film: The Vinegar
Syndrome. Polym. Degrad. Stab. 1987, 19 (4), 379–387.
(21) Newman, G. R.; Jasani, B. Silver Development in Microscopy and Bioanalysis: A
New Versatile Formulation for Modern Needs. Histochem. J. 1998, 30 (9), 635–
645.
(22) Plumbridge, W. J. Tin Pest Issues in Lead-Free Electronic Solders. J.Mat. Sci.
Mater. Electron. 2007, 18, 307–318.
(23) Sirimungkala, A.; Försterling, H.-D.; Dlask, V.; Field, R. J. Bromination Reactions
Important in the Mechanism of the Belousov−Zha otinsky System. J. Phys. Chem.
A 1999, 103 (8), 1038–1043.
(24) Arimitsu, K.; Miyamoto, M.; Ichimura, K. Applications of a Nonlinear Organic
Reaction of Carbamates to Proliferate Aliphatic Amines. Angew. Chem. Int. Ed.
2000, 39 (19), 3425–3428.
(25) Arimitsu, K.; Ichimura, K. Nonlinear Organic Reaction of 9-Fluorenylmethyl
Carbamates as Base Amplifiers to Proliferate Aliphatic Amines and Their
Application to a Novel Photopolymer System. J. Mater. Chem. 2004, 14 (3), 336–
343.
(26) Igarashi, A.; Arimitsu, K.; Seki, T.; Ichimura, K. Novel Base-Sensitive Polymers
Generating Amino Groups from Their Side Chains in a Nonlinear Manner and
Their Application to Photoimaging Materials. J. Mater. Chem. 2008, 18 (5), 560–
566.
(27) Mutter, M.; Bellof, D. A New Base-Labile Anchoring Group for Polymer-
Supported Peptide Synthesis. Helv. Chim. Acta 1984, 67, 2009–2016.

27
Chapter 2
Head-to-Tail Depolymerizable Polymers
2.1 Introduction to Depolymerizable Polymers
In addition to small molecule systems, stimuli-responsive polymers are an
attractive, versatile approach for realizing reaction-based signal amplification.1–3
These
polymers have been designed to change their surface properties,4,5
shape,6,7
or color8 in
response to a specific external stimulus. The response is typically a result of structural
changes to the polymer, which range from intermolecular interactions, reversible
dynamic bond formation, cross-linking, or depolymerization.
Depolymerization can be generally defined as the conversion of a polymeric
material to smaller species in the presence of chemical, physical, or thermal stimuli. This
loose interpretation often is used in the literature to describe a variety of polymer
degradation processes that occur through different means with vastly different outcomes.
Compared to traditional responsive polymers, certain types of depolymerizable polymers
are capable of producing amplified responses as a result of a single detection event. As
the field of depolymerizable polymers continues to advance, new polymers are needed
that are i) easily prepared, with control over molecular weights and polydispersity; ii)
easily outfitted with reaction-based detection groups; iii) stable to acid, base, and heat;
and iv) capable of depolymerizing rapidly and completely in both high and low polarity
environments.

28
2.1.1 Classification of Depolymerization Mechanisms
There are four general categories of depolymerizable polymers, which are
classified by two defining characteristics: i) whether the polymers depolymerize via
repetitive, continuous fragmentation or completely following a single detection event and
ii) whether the initiating signal can be detected selectivity9 (Figure 2-1).
Figure 2-1. Classes of depolymerizable polymers. a) fragmentation depolymerization
following random scission of the polymer backbone (FDb), b) continuous
depolymerization following random scission of the polymer backbone (CDb), c)
fragmentation depolymerization upon cleavage of a reaction-based detection unit (FDr),
d) continuous depolymerization upon cleavage of a reaction-based detection unit (CDr).9
c) FDr
b) CDb
a) FDb
d) CDr

29
All depolymerizable polymers can be separated into one of two classes based on
the mechanism of depolymerization. Fragmentation depolymerization polymers (FD)
simply produce two smaller polymer chains following the initial bond cleavage event,
and do not offer any amplification of the signal. In order for the resulting polymer
fragments to break down further, they must react with additional equivalents of the
desired stimulus. Once the stimulus is either consumed or removed from the system, the
polymer is incapable of depolymerizing further. Alternatively, continuous
depolymerization polymers (CD) produce an electron cascade that can propagate through
the polymer backbone, unzipping the polymer from the point of reaction to the terminus
of the polymer. This electron cascade continuously releases small molecule products
from the polymer chain, providing significant signal amplification as a result of a single
reaction-based detection event. The overall magnitude of signal amplification from the
detection event will increase proportionally to the length of the polymer chain. In this
case, the depolymerization process will continue even if the initiating stimulus is
removed.
Each of the polymers described above can be further classified depending on the
mechanism by which depolymerization is initiated: those that occur following random
bond cleavage in the polymer backbone (b), and those that respond only following the
cleavage of a specific reaction-based detection unit (r). The majority of depolymerizable
polymers fall into category (b), where chain scission occurs at a reactive functionality
within the repeating unit of the polymer backbone. This includes the hydrolysis or
biodegradation of condensation polymers such as polyesters and poly(lactic acid).10
Control over the response of these polymers is limited, as the stimulus cannot be

30
modified and the location at which the stimulus reacts along the polymer chain is
unpredictable.
In contrast, polymers in category (r) contain built-in reaction-based detection
units that provide greater jurisdiction over the specificity of the depolymerization.
Polymers containing these detection groups are designed to respond only in the presence
of a desired stimulus. Since detection units are independent of the polymer backbone, the
reactive groups can be modified to respond in the presence of numerous types of analytes
including light,11
palladium,12
fluoride,13,14
enzymes,15
and multiple, orthogonal stimuli.16
In addition, the location at which the detection event takes place can be manipulated with
specific positioning of reaction-based detection units, which can either be employed as
“end-caps” placed at the terminus of the polymer or as pendant groups along the polymer
backbone.
2.1.2 Continuous, Reaction-Based Depolymerization (CDr)
The greatest degree of amplification is achieved by depolymerizable polymers
that are capable of continuous depolymerization following the cleavage of a reaction-
based detection unit (CDr). A great deal of growth and innovation has occurred in the
field in recent years9,17–19
due to the unique ability of the polymer to provide both
selective and amplified responses. A variety of depolymerizable backbones have been
developed with mechanisms ranging from quinone methide elimination, propagation of a
hemiacetal ion, isocyanate formation, and cyclization. Specific mechanisms and uses of
these polymers are detailed below.

31
2.1.2.1 CDr Poly(carbamates)
Figure 2-2. Schematic depiction of CDr poly(carbamate) depolymerization.
One of the first CDr systems was developed from a previously reported benzyl
carbamate linker used in an innovative platform for the controlled release of a prodrug20
(Figure 2-3). A model release system was developed using reagent 2-1, which was
synthesized containing an enzyme-responsive detection unit, a benzyl carbamate spacer,
and a model drug to demonstrate a stimuli-responsive system for drug activation.
Figure 2-3. a) Scheme depicting the first design of a controlled release carbamate spacer.
b) Model prodrug 2-1 selectively releases 4-nitroaniline in the presence of trypsin.20
a)
b)

32
Release of the model drug occurs following donation of electrons into the ring
from a free amine and subsequent formation of an azaquinone methide intermediate. This
controlled release mechanism was later adapted by Shabat and coworkers21–25
to create
stimuli-responsive dendrimers, which employed quinone methide eliminations and/or
cyclizations to disassemble branched benzyl carbamate systems (Figure 2-4).
Figure 2-4. Dendritic amplification reagent 2-2 developed by Shabat and coworkers.22
Through a series of 1,4-quinone methide eliminations and cyclization events, the
molecule releases eight copies of a model drug in response to a single reaction-based
detection event.
2-2

33
To eliminate the labor-intensive step-wise synthesis of dendritic reaction systems,
Shabat later developed analogous linear polymers through the step growth polymerization
of monomer 2-3. The polymerization was end-capped with 4-hydroxy-2-butanone to
make polymer 2-4, which will respond selectively in the presence of bovine serum
albumin (BSA)26
(Figure 2-5).
Figure 2-5. The lengthy synthesis of dendritic amplifiers was improved with the
synthesis of linear polymer 2-4 through step-wise polymerization of monomer 2-3.26
Ultimately, small polymers consisting of 15 repeating units were used for
depolymerization tests, which were monitored by the increase of aniline products using
fluorescence spectroscopy. The polymer depolymerized completely in approximately 10
h in response to 1 mg/mL BSA in pH 7.4 buffered water, but exhibited significant non-
specific degradation in the absence of the analyte. Numerous challenges have limited the
viability of poly(carbamates) toward many applications, including the inherent instability
of the repeating unit, slow depolymerization times, inefficient synthetic routes, and the
inability to depolymerize in non-polar solvents. Efforts to increase the rate of
poly(carbamate) depolymerization will be discussed later in this chapter.

34
2.1.2.2 CDr Poly(benzyl ethers)
Figure 2-6. Schematic depiction of CDr poly(benzyl ether) depolymerization.
The development of poly(benzyl ethers) as a new class of CDr polymers has
helped to circumvent the numerous limitations of poly(carbamates). The first instance of
using benzyl ethers as a responsive controlled release unit was published in 2003 by
McGrath and coworkers, who used the linkage within a dendritic scaffold.27–30
Benzyl
ether amplification systems depolymerize in a similar manner to poly(carbamates).
Cleavage of the reaction-based detection unit under basic conditions unmasks a
phenoxide anion, which induces an electron cascade and a series of 1,6-quinone methide
eliminations to release the monomeric species (Figure 2-6). McGrath and coworkers
demonstrated the selective depolymerization of a linear enzyl ether oligomer (1−4
repeating units, synthesized in a step-wise fashion) in response to both palladium and UV
light in under two minutes (Figure 2-7).30
However, the longer oligomers failed to
depolymerize to completion, raising additional questions over the ability for poly(benzyl
ethers) to fully depolymerize, especially in low polarity solvents or in the solid state.
Figure 2-7. The selective disassembly of a benzyl ether oligomer.
30

35
Lin and coworkers later demonstrated seminal work resulting in the first
homopolymerization of a poly(benzyl ether) through use of a stable quinone methide
monomer.31
Due to its extremely electrophilic 7-position, quinone methide species are
often too unstable to isolate. However, Lin discovered that adding electron withdrawing
groups to the ring or extending conjugation into a pi system at the 7-position helps
mitigate the molecule’s intrinsic electrophilicity. This strategy provides a more efficient
method for synthesizing poly(benzyl ethers) of higher molecular weights compared to
previous approaches. Olah and coworkers later employed quinone methide anionic
polymerization to synthesize the first stimuli-responsive depolymerizable poly(benzyl
ethers).14
Importantly, this class of CDr polymers has exhibited extensive stability to acid,
base and heat as well as the ability to depolymerize within hours in relatively low polarity
solvents. This was first demonstrated by exposing tert-butylsilyl end-capped polymer 2-7
to tetrabutylammonium fluoride (TBAF) in THF14
(Figure 2-8).
Figure 2-8. a) Synthesis of polymer 2-7 from a stable quinone methide monomer. The
reaction is terminated by end-capping with a silyl ether group. b) Cleavage of the
detection unit and subsequent depolymerization of 2-7 in the presence of TBAF.14
a)
b)

36
Furthermore, the directly reversible procedure of monomer polymer
monomer has produced a novel, and far more efficient, approach to creating a closed-
loop system for the recycling of plastics.32
Development of the poly(benzyl ether)
backbone has also provided a versatile platform for designing a library of stimuli-
responsive depolymerizable polymers with a variety of material properties. This includes
cross-linkable responsive polymers, polymers with adhesive or elastomeric properties,
and polymers capable of depolymerizing in the solid state. Efforts to develop the latter
will be discussed in Chapter 3 of this dissertation.
2.1.2.3 Intramolecular Cyclizing CDr Polymers
Figure 2-9. Schematic depiction of depolymerizable polymers utilizing an alternating
cyclization/quinone methide elimination mechanism.33
A unique approach toward CDr polymers developed by Gillies and coworkers
employs an intramolecular cyclization in tandem with quinone methide formation as a
design for a biodegradable polymer.33
Following cleavage of the reaction-based detection
unit, the unmasked end of an ethylene linker cyclizes to release a free phenol, which then

37
proceeds through 1,6-quinone methide elimination and loss of CO2 to unmask the next
available ethylene linker (Figure 2-9). The Gillies group ultimately developed this design
by drawing from their own previous work,34–36
as well as the work of others.22,37
The first generation design was based on an N,N-ethylenediamine linker (2-8) and
exhibited extremely slow depolymerization kinetics. The polymer depolymerized
completely in ~7 days.34
In order to optimize the rate-limiting cyclization step, Gillies
and coworkers later synthesized polymer 2-9, which replaced the carbamate linker with a
more electrophilic carbonate. The substitution of a single atom in the repeating unit
greatly reduced the time necessary for complete depolymerization of 2-9, which occurred
in less than 7 h.33
Furthermore, Gillies and coworkers synthesized polymer 2-10
containing a 2-thioethanol linker, which increased the nucleophilicity of the cyclizing
species compared to the previously used secondary amine. This second alteration further
accelerates the depolymerization reaction to 5 h.33
However, the delicate balance of
stability vs. reactivity was affected as a result of these transformations, as background
hydrolysis was also found to increase with the inclusion of enhanced nucleophiles and
electrophiles along the polymer backbone. No solid-state depolymerization studies have
been published using cyclizing CDr polymers.

38
2.1.2.4 CDr Poly(Phthalaldehyde)
Figure 2-10. Schematic depiction of poly(phthalaldehyde) depolymerization.
In contrast to poly(carbamates) and poly(benzyl ethers), CDr poly(phthalaldehyde)
is an acetal-based polymer that depolymerizes at an exceptionally fast rate in both
solution and the solid state. Poly(phthalaldehyde) was first synthesized in 1967 by Aso
and Tagami,38
and was further developed in 1983 by Ito and Wilson as a photoacid-
sensitive substrate for lithography resists.39
The acetal linkages in the polymer backbone
are exceedingly sensitive to acidic conditions, which will trigger rapid and complete
depolymerization of the polymer following the cleavage of a single acetal unit anywhere
along the polymer backbone. By end-capping the polymer with a reaction-based detection
unit, Phillips and coworkers developed the first examples of poly(phthalaldehyde) that
satisfy the criteria of CDr polymers.12,13,40–42
Poly(phthalaldehydes) are also unique in that
they are capable of being end-capped on both termini of the polymer chain, providing an
opportunity to functionalize the polymer with two reaction-based detection units selective
for two separate analytes.
The first generation design of poly(phthalaldehyde) was synthesized from
commercially available o-phthalaldehyde, and demonstrated the ability to depolymerize
selectively in the solid-state within a patterned plastic13
(Figure 2-11). Following the
addition of a specific stimulus (i.e. TBAF), the patterned plastic sheet only exhibited
depolymerization in areas containing fluoride-responsive 2-11. In contrast, allyl end-

39
capped polymer 2-12 remained intact following exposure to fluoride. This example led to
future solid-state applications of poly(phthalaldehyde), including responsive coatings for
non-mechanical pumps40,41
and controlled release microcapsules.42
Figure 2-11. A cartoon illustrating selective depolymerization of a plastic patterned with
different stimuli responsive materials. In the presence of TBAF, only the fluoride-
responsive core of the plastic depolymerizes.13
Adapted with permission from J. Am.
Chem. Soc., 2010, 132 (17), 9234−9235. Copyright 2010 American Chemical Society.
2.1.2.5 Depolymerizable Poly(glyoxylates)
Figure 2-12. Schematic depiction of poly(ethyl glyoxylate) depolymerization.
The final class of CDr polymers, poly(glyoxylates), was first developed in 1979
by Monstanto for use in biodegradable detergent formulations.43
Due to its susceptibility
to hydrolysis and low toxicity of the products, poly(glyoxylates) have been an appealing
patterned plastic sheet
Specific stimulus (TBAF)
plastic sheet with altered features

40
polymer for use in biomaterials.44
More recently, poly(glyoxylates) have gained attention
as a new backbone for CDr polymers, which was first reported by Gillies and coworkers
in 2014.45
These acetal-based polymers, which are synthesized in a similar manner to
poly(phthalaldehydes), can reach high molecular weights and can be end-capped with
reaction-based detection units at both termini of the polymer. Notably, the significantly
higher ceiling temperature of poly(ethyl glyoxylate) (Tc = 38 °C)45
compared to
poly(phthalaldehyde) (Tc = −43 °C)46
likely leads to slower depolymerization rates.
Gillies demonstrated the depolymerization of UV-responsive poly(ethyl
glyoxylate) 2-13 (containing a 6-nitroveratryloxycarbonyl (NVOC) end cap) following
exposure to 300-350 nm UV light for 80 min in 9:1 CD3CN−D2O (Figure 2-13).47
Polymer 2-13 exhibited only 70% depolymerization over the course of 24 h, producing
ethyl glyoxylate hydrate (2-14) as the primary observed small molecule product. The
incomplete depolymerization likely is a consequence of the polymer ceiling temperature
being above room temperature. Further studies detailed the solid-state depolymerization
of poly(ethyl glyoxylate), as polymer films made from 2-13 showed complete mass loss
after 17 d in buffered water following 17 h of exposure to UV light.47
These polymers
have also been adapted for use in amphiphilic triblock copolymers for self-assembly into
micellar nanoparticles and subsequent controlled release in aqueous environments.47
Figure 2-13. Depolymerization of NVOC end-capped 2-13 in response to UV light.47

41
2.1.3 Summary of CDr Polymers
CDr polymers are unique macromolecules due to their ability to depolymerize
continuously and completely only in the presence of a specific stimulus. In contrast to
most stimuli-responsive materials, CDr polymers provide large, amplified responses and
can be tailored to respond to a variety of different analytes. However, few examples of
CDr backbones have been reported to date and several challenges must be overcome
before they are suitable for potential commercial applications such as recycling,
controlled release, and analyte detection. CDr polymers must ultimately be easy to
synthesize from cheap commercial chemicals, provide rapid rates of depolymerization,
and be stable during the manufacturing process and daily consumer use.
The ensuing chapters of this dissertation detail efforts to increase the rates of
depolymerization in poly(carbamates) and poly(benzyl ethers). Specifically, we will
discuss the design and synthesis of a novel CDr backbone as well as demonstrate a
strategy for increasing the rate of solid-state depolymerization in predominantly aqueous
environments.
2.2 Efforts to Improve the Rate of Quinone Methide Elimination
Previous studies of poly(carbamate) polymers by Phillips and coworkers have
suggested that azaquinone methide formation is the rate-limiting step of
depolymerization,48–53
especially in low polarity environments. The most notable
limitation to this process is the energetic penalty that must be surmounted to generate the
azaquinone methide intermediate from its more stable aromatic precursor (Figure 2-14).

42
Figure 2-14. Depolymerization mechanism of benzene-based poly(carbamates).
Through a series of physical organic studies to determine the rate of release for a
benzyl carbamate unit, Phillips discovered two techniques for decreasing the HOMO-
LUMO gap between the two species: i) increasing the electron density within the ring49,50
and ii) reducing the aromaticity of the ring in each repeating unit of the polymer.50,51
The
addition of a methyl ether to an oligomeric test reagent provided a 136-fold increase the
rate of release for a single benzyl carbamate unit.50
It was proposed that added electron
density likely increases the molecular orbital interactions between π(ring) and σ*(C-O),
which subsequently lengthens the benzylic C–O bond and facilitates more rapid
azaquinone methide formation. Similarly, by decreasing the aromatic character of the
repeating unit, the energetic penalty that must be paid to form azaquinone methide is also
decreased. This result was demonstrated by Schmid and Phillips by studying the relative
rates of release between a series of aromatic hydrocarbons with differing aromaticities
(Figure 2-15).

43
Figure 2-15. Relative aromaticities and release rates for carbamate spacers with benzene
(2-15), naphthalene (2-16), and phenanthrene (2-17) rings.51
Reproduced with permission
from J. Phys. Org. Chem. 2013, 26 (7), 608−610. Copyright 2013 Wiley & Sons.
Compounds 2-15, 2-16, and 2-17 were exposed to palladium in THF, transferred
to a 1:1 mixture of MeCN and pH 7.1 buffered water, and then injected into an LCMS for
product analysis. The use of phenanthrene-based repeating unit 2-17 (approximately 20%
less aromatic than benzene)54
exhibited a 51-fold increase in rate of release for a single
poly(carbamate) repeating unit.50
Although decreasing aromaticity increases the rate of
release, each compound still requires polar solvents (MeCN and water) to facilitate
quinone methide elimination. This led to the design of a new class of poly(carbamates)
with the goal of imparting the ability to depolymerize in lower polarity solvents.
2.3 Experimental Design
Based on these previous results, we reasoned that faster depolymerization in
poly(carbamates) might be realized by omitting azaquinone intermediates from the
Test Reagent:
Relative
aromaticity54
t ½ for release
of phenol (min) ~23 h
2-15 2-16 2-17
114
3.7 min
24.9
4.8 min
1.00 0.912 0.813

44
depolymerization mechanism. Thus, we suspected that aromatic rings other than benzene
might give rise to faster depolymerization. Smaller heterocyclic rings, such as furan or
thiophene, have reduced aromatic stabilization, which might allow depolymerization to
occur through lower activation pathways than with benzene (Figure 2-16).
Figure 2-16. Proposed electron cascade and elimination mechanism of furan- or
thiophene-based depolymerizable poly(carbamates).
Furan and thiophene have lower resonance energies than benzene due to reduced
π-delocalization on the heteroatom lone pair. Furthermore, the electronegativity of the
heteroatom influences the extent to which the lone pair participates in cyclic
delocalization. The higher magnitude of electronegativity in oxygen compared to sulfur
results in the notably decreased aromaticity of furan. A summarization of the relative
aromaticity of each ring via resonance energy is located in Figure 2-17.
Figure 2-17. A comparison of resonance energies in benzene, thiophene, and furan.

45
2.4 Results and Discussion
2.4.1 Synthesis and Testing of a Model Furan Repeating Unit
We prepared model compound 2-23 to investigate the viability of using furan as
the repeating unit of a CDr polymer (Figure 2-18). Compound 2-23 was synthesized in 5
steps with a 28% overall yield; the reagent contains the core furan ring, a base-sensitive
Fmoc carbamate as the reaction-based detection unit, and phenol as a reporter molecule.
Exposure of 2-23 to basic conditions ideally will cause an electron cascade through the
furan ring and subsequent release of the pendant reporter molecule (Figure 2-19).
Figure 2-18. Synthetic scheme for model furan reagent 2-23.
Figure 2-19. Expected mechanism of response to base and subsequent release of phenol
from model compound 2-23.

46
To investigate the selective, controlled release of phenol from 2-23, the reagent
was exposed to piperidine (1 equiv.) in CDCl3 and analyzed via NMR by integrating the
furan benzylic peak with respect to tetramethylsilane (TMS). Release of phenol from
reagent 2-23 reached 80% completion in less than 10 h (Figure 2-20a). However, NMR
spectra provide little evidence for the formation of dibenzofulvene, indicating that release
of phenol is not primarily occurring as a result of selective Fmoc deprotection. Free
piperidine is also consumed throughout the course of the reaction (Figure 2-21). LCMS
analysis of the reaction mixture suggests that phenol likely is released through i) an SN2
reaction with piperidine or ii) deprotonation of the carbamate and a subsequent quinone
methide-like electron cascade (Figure 2-20b). This substitution did not take place when
N,N-diisopropylethylamine (DIEA) was used in place of piperidine.
Figure 2-20. a) NMR kinetics for the degradation of compound 2-23 in the presence of 1
equiv. piperidine. b) Proposed reaction in Figure 2-20a (confirmed by LCMS analysis).
0%
20%
40%
60%
80%
100%
0 10 20 30 40
Re
age
nt
Re
mai
nin
g
Reaction Time (h)
a)
b)

47
Figure 2-21. NMR spectra of the degradation of 2-23 in the presence of 1 equiv.
piperidine. The blue rectangle highlights the disappearance of the furan benzylic peak,
and the red rectangles highlight production of free phenol (left) and consumption of
piperidine (right).
In order to verify the proposed mechanisms, we synthesized a second model
compound containing an alloc group (2-24), which is not sensitive to base. NMR and
LCMS experiments reveal that compound 2-24 reacts similarly to 2-23 (Figure 2-22),
indicating that both reagents likely degrade through SN2 or carbamate deprotonation
mechanisms rather than the selective removal of a reaction-based detection unit.
Figure 2-22. Kinetics comparison of compounds 2-23 (blue) and 2-24 (red) following
exposure to 1 equiv. piperidine in CDCl3.
0 h
18 h
0%
20%
40%
60%
80%
100%
0 10 20 30 40 50
Re
age
nt
Re
mai
nin
g
Reaction Time (h)

48
Additional control experiments indicate that 2-furylcarbamates are also
significantly unstable in solution at room temperature. NMR analysis shows nearly
complete disappearance of the furan benzylic peak of 2-23 over the course of 36 hours
under ambient conditions in CDCl3 (Figure 2-23).
Figure 2-23. NMR kinetics of the degradation of 2-23 in CDCl3.
Additionally, the degradation products of compound 2-23 differ from those
generated following the addition of piperidine (Figure 2-24). We hypothesize that 2-23
degrades similarly to the previously reported ring transformation of 2-furylcarbamates to
5-hydroxy-3-pyrrolin-2-ones via autooxidation or photooxidation.55,56
Yakushijin and
coworkers demonstrated that electron-rich 2-furylcarbamates react with molecular
oxygen to create an endoperoxide (2-25) that may further degrade to numerous products
(Figure 2-25). A mass peak corresponding to products 2-26 and 2-27 (M + H+
= 428.1)
was detected following the degradation of 2-23. NMR and LCMS analyses also provided
evidence of the formation of Diels-Alder product 2-28, which is likely formed through
the cyclization of 2-23 with 2-27 (Figure 2-26).
0%
20%
40%
60%
80%
100%
0 10 20 30 40
Re
age
nt
Re
mai
nin
g
Reaction Time (h)
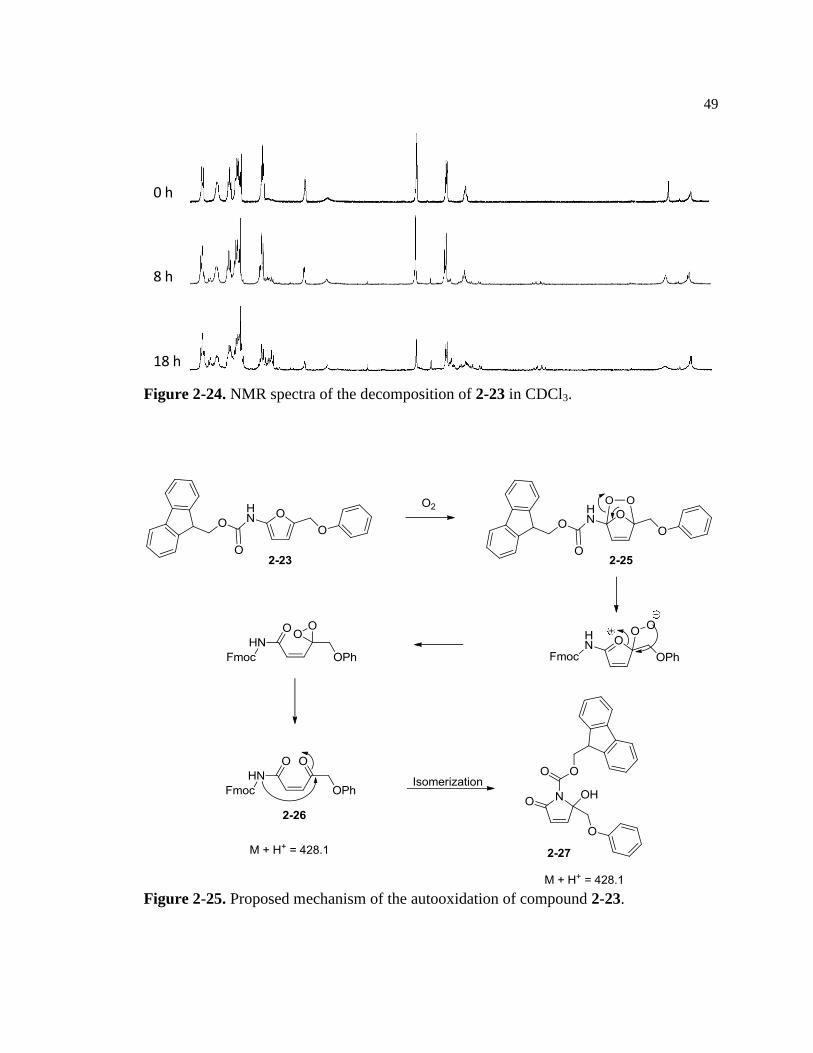
49
Figure 2-24. NMR spectra of the decomposition of 2-23 in CDCl3.
Figure 2-25. Proposed mechanism of the autooxidation of compound 2-23.
0 h
8 h
18 h

50
Figure 2-26. Proposed Diels-Alder reaction occurring between autooxidation product 2-
27 and model compound 2-23.
2.4.2 Synthesis of Furan-based Poly(carbamates)
While model compound 2-23 exhibited significant instability, we proceeded with
attempts to synthesize a furan-based polymer to gauge whether the polymeric structure
provided additional stability to the system. Thus, we synthesized step-wise
polymerization monomer 2-33 in four steps with a 4% overall yield (Figure 2-27).
Figure 2-27. Synthetic scheme for furan monomer 2-33.
2.4.3 Summary of 2-furylcarbamates
Unfortunately, the metastable nature of furan monomer 2-33 frustrated most
attempts to achieve oligomers and/or polymers. The reduced aromaticity in 2-furyl
carbamates limits its ability to stabilize the considerable amount of electron density

51
within the ring. This inherent instability gives rise to decomposition through undesirable
cycloaddition and substitution reactions. We hypothesize that the ring is particularly
susceptible to SN2 reactions due to a partial positive charge at the furan benzylic carbon,
which may lengthen the C−O ond and help facilitate release of phenol (Figure 2-28).
Figure 2-28. Proposed mechanisms of resonance within 2-furylcarbamates that may
elucidate the susceptibility of compound 2-23 toward SN2 reactions.
Based on these results, we have reasoned three approaches toward reducing the
reactivity of 2-furyl carbamates: i) introduce an electron withdrawing group at the 4-
position of the ring; ii) attach an alkyl group at the benzylic position; and iii) change the
heteroatom within the ring (Figure 2-29). These strategies ideally will help to increase
aromaticity and/or reduce electron density within the ring, or increase steric congestion,
thus subsequently discouraging unwanted side reactions.
Figure 2-29. Proposed strategies for increasing the stability of 2-furyl carbamates: i)
addition of an electron withdrawing group on the ring; ii) addition of an alkyl group at the
benzylic position; and iii) introduction of a more aromatic ring structure (thiophene).

52
2.4.4 Synthesis and Testing of a Model Thiophene Repeating Unit
We reasoned that the increased aromaticity of a thiophene ring relative to furan
would eliminate the susceptibility of the reagent toward both SN2 reactions and
autooxidation. To test this hypothesis, we synthesized thiophene model compound 2-39
in 5 steps with a 6% overall yield (Figure 2-30).
Figure 2-30. Synthetic scheme for thiophene model reagent 2-39.
Although compound 2-39 responds slowly to 1 equiv. of piperidine in CDCl3,
NMR analysis illustrates the successful formation of dibenzofulvene. The rate of
selective release of phenol from 2-39 increases significantly under traditional conditions
used for Fmoc deprotection.57
For example, exposure of the reagent to a 10% solution of
piperidine in CDCl3 resulted in complete cleavage of the Fmoc group in 5 h (Figure 2-
31a). However, deprotection of the Fmoc carbamate does not instantaneously result in the
release of phenol. This indicated that either i) the subsequently formed 2-aminofuran
intermediate is relatively stable or ii) the thiophene ring is also susceptible to carbamate

53
deprotonation or an SN2 reaction at the benzylic position. NMR spectra indicate that,
following exposure to a 10% solution of piperidine in CDCl3, release of phenol is 80%
complete in approximately 22 h (Figures 2-31a and 2-31b).
Figure 2-31. a) Data depicting deprotection of Fmoc from 2-39 (blue) and release of
phenol (red) after exposure to 10% piperidine in CDCl3. b) Corresponding NMR spectra.
We then synthesized control reagent 2-40, which released phenol at a similar rate
as 2-39 following exposure to a 10% piperidine solution in CDCl3 (Figure 2-32). This
result indicates that phenol is likely released through a similar non-specific reaction as
a) 2-39 phenol
0 h
3 h
12 h
b)
0%
20%
40%
60%
80%
100%
0 10 20 30 40 50
Re
age
nt
in S
olu
tio
n
Reaction Time (h)

54
proposed with reagent 2-23 and not the desired quinone methide-like elimination.
Although still reactive, the thiophene model reagent degrades and reacts at a far slower
rate than its furan analog. Compound 2-39 also exhibited greater stability in solution than
2-23, as the reagent remained stable over the course of one week. In order for this
structure to be viable for a CDr polymer backbone, future studies will require additional
strategies for increasing the stability of heterocyclic carbamates.
Figure 2-32. Kinetics comparison of compounds 2-39 (blue) and 2-40 (red), monitoring
release of phenol following exposure to 1 equiv. piperidine in CDCl3.
2.4.5 Synthesis of Thiophene-based Poly(carbamates)
To evaluate whether the increased stability of the thiophene model system could
be applied to a depolymerizable polymer, we synthesized monomer 2-47 in 8 steps with a
5% overall yield (Figure 2-33). Several attempts to polymerize 2-47 through step-wise
condensation failed to produce poly(thiophenecarbamates). Typical reaction conditions
consisted of heating 2-47 in the presence of a strong base, resulting in no reaction or
0%
20%
40%
60%
80%
100%
0 10 20 30 40 50 60
Rel
ease
d P
hen
ol
Reaction Time (h)

55
decomposition of the monomer. Further work is required to determine ideal conditions
for the polymerization of a thiophene-based carbamate monomer.
Figure 2-33. Synthetic scheme for thiophene monomer 2-47.
2.5 Conclusion
In conclusion, we have shown that thiophene rings may be viable for use in
synthesizing novel stimuli-responsive poly(carbamates) that may depolymerize in low
polarity environments. In comparison to traditional benzene-based poly(carbamates), the
decreased aromatic character of thiophene may help accelerate formation of the
azaquinone methide derivative, a process that traditionally requires highly polar solvents.
We expect that this work will provide additional insight to design principles for
increasing the depolymerization rate of poly(carbamates). Further research will focus on
the synthesis, characterization, and depolymerization of thiophene-based CDr polymers.

56
2.6 References
(1) Stuart, M. a C.; Huck, W. T. S.; Genzer, J.; Müller, M.; Ober, C.; Stamm, M.;
Sukhorukov, G. B.; Szleifer, I.; Tsukruk, V. V; Urban, M.; Winnik, F.; Zauscher,
S.; Luzinov, I.; Minko, S. Emerging Applications of Stimuli-Responsive Polymer
Materials. Nat. Mater. 2010, 9 (2), 101–113.
(2) Liu, F.; Urban, M. W. Recent Advances and Challenges in Designing Stimuli-
Responsive Polymers. Prog. Polym. Sci. 2010, 35, 3–23.
(3) Spruell, J. M.; Hawker, C. J. Triggered Structural and Property Changes in
Polymeric Nanomaterials. Chem. Sci. 2011, 2 (1), 18–26.
(4) Zhai, L. Stimuli-Responsive Polymer Films. Chem. Soc. Rev. 2013, 42 (17), 7148–
7160.
(5) Wagner, N.; Theato, P. Light-Induced Wettability Changes on Polymer Surfaces.
Polymer, 2014, 55 (16), 3436–3453.
(6) Liu, C.; Qin, H.; Mather, P. T. Review of Progress in Shape-Memory Polymers. J.
Mater. Chem. 2007, 17 (16), 1543−1558.
(7) Meng, H.; Li, G. Reversible Switching Transitions of Stimuli-Responsive Shape
Changing Polymers. J. Mater. Chem. A 2013, 1 (27), 7838.
(8) Seeboth, A.; Lötzsch, D.; Ruhmann, R.; Muehling, O. Thermochromic Polymers--
Function by Design. Chem. Rev. 2014, 114 (5), 3037–3068.
(9) Phillips, S. T.; Dilauro, A. M. Continuous Head-to-Tail Depolymerization: An
Emerging Concept for Imparting Amplified Responses to Stimuli-Responsive
Materials. ACS Macro Lett. 2014, 3 (4), 298–304.
(10) Song, J. H.; Murphy, R. J.; Narayan, R.; Davies, G. B. H. Biodegradable and
Compostable Alternatives to Conventional Plastics. Philos. Trans. R. Soc. London
B Biol. Sci. 2009, 364, 2127–2139.

57
(11) Jochum, F. D.; Theato, P. Temperature- and Light-Responsive Smart Polymer
Materials. Chem. Soc. Rev. 2013, 42 (17), 7468–7483.
(12) Dilauro, A. M.; Robbins, J. S.; Phillips, S. T. Reproducible and Scalable Synthesis
of End-Cap-Functionalized Depolymerizable Poly(phthalaldehydes).
Macromolecules 2013, 46 (8), 2963–2968.
(13) Seo, W.; Phillips, S. T. Patterned Plastics That Change Physical Structure in
Response to Applied Chemical Signals. J. Am. Chem. Soc. 2010, 132 (27), 9234–
9235.
(14) Olah, M. G.; Robbins, J. S.; Baker, M. S.; Phillips, S. T. End-Capped Poly(benzyl
Ethers): Acid and Base Stable Polymers That Depolymerize Rapidly from Head-
to-Tail in Response to Specific Applied Signals. Macromolecules 2013, 46 (15),
5924–5928.
(15) Zelzer, M.; Todd, S. J.; Hirst, A. R.; McDonald, T. O.; Ulijn, R. V. Enzyme
Responsive Materials: Design Strategies and Future Developments. Biomater. Sci.
2013, 1 (1), 11–39.
(16) Schattling, P.; Jochum, F. D.; Theato, P. Multi-Stimuli Responsive Polymers – the
All-in-One Talents. Polym. Chem. 2014, 5 (1), 25–36.
(17) Peterson, G. I.; Larsen, M. B.; Boydston, A. J. Controlled Depolymerization:
Stimuli-Responsive Self-Immolative Polymers. Macromolecules 2012, 45 (18),
7317–7328.
(18) Phillips, S. T.; Robbins, J. S.; Dilauro, A. M.; Olah, M. G. Amplified Responses in
Materials Using Linear Polymers That Depolymerize from End-to-End When
Exposed to Specific Stimuli. J. Appl. Polym. Sci. 2014, 131 (19), 40992.
(19) Roth, M. E.; Green, O.; Gnaim, S.; Shabat, D. Dendritic, Oligomeric, and
Polymeric Self-Immolative Molecular Amplification. Chem. Rev. 2016, 116 (3),
1309–1352.

58
(20) Carl, P. L.; Chakravarty, P. K.; Katzenellenbogen, J. a. A Novel Connector
Linkage Applicable in Prodrug Design. J. Med. Chem. 1981, 24 (5), 479–480.
(21) Amir, R. J.; Pessah, N.; Shamis, M.; Shabat, D. Self-Immolative Dendrimers.
Angew. Chem. Int. Ed. 2003, 42 (37), 4494–4499.
(22) Shabat, D. Self-Immolative Dendrimers as Novel Drug Delivery Platforms. J.
Polym. Sci. Part A Polym. Chem. 2006, 44 (5), 1569–1578.
(23) Sagi, A.; Segal, E.; Satchi-Fainaro, R.; Shabat, D. Remarkable Drug-Release
Enhancement with an Elimination-Based AB3 Self-Immolative Dendritic
Amplifier. Bioorg. Med. Chem. 2007, 15 (11), 3720–3727.
(24) Shamis, M.; Shabat, D. Single-Triggered AB6 Self-Immolative Dendritic
Amplifiers. Chem. Eur. J. 2007, 13 (16), 4523–4528.
(25) Adler-Abramovich, L.; Perry, R.; Sagi, A.; Gazit, E.; Shabat, D. Controlled
Assembly of Peptide Nanotubes Triggered by Enzymatic Activation of Self-
Immolative Dendrimers. ChemBioChem 2007, 8 (8), 859–862.
(26) Sagi, A.; Weinstain, R.; Karton, N.; Shabat, D. Self-Immolative Polymers. J. Am.
Chem. Soc. 2008, 130 (16), 5434–5435.
(27) Li, S.; Szalai, M. L.; Kevwitch, R. M.; McGrath, D. V. Dendrimer Disassembly by
Benzyl Ether Depolymerization. J. Am. Chem. Soc. 2003, 125 (35), 10516–10517.
(28) Szalai, M. L.; McGrath, D. V. Phototriggering of Geometric Dendrimer
Disassembly: An Improved Synthesis of 2,4-Bis(hydroxymethyl)phenol Based
Dendrimers. Tetrahedron 2004 60 (34), 7261–7266.
(29) Ortiz, A.; Shanahan, C. S.; Sisk, D. T.; Perera, S. C.; Rao, P.; McGrath, D. V.
Improved Iterative Synthesis of Linearly Disassembling Dendrons. J. Org. Chem.
2010, 75 (18), 6154–6162.
59
(30) Kevwitch, R. M.; Shanahan, C. S.; McGrath, D. V. Vanillin and O-Vanillin
Oligomers as Models for Dendrimer Disassembly. New J. Chem. 2012, 36 (2),
492–505.
(31) Lin, L. W.; Bromps, W.; Ching, T. Y. Polymerization of 7-Phenyl-2,6-
Dimethylquinone Methide and Its Derivatives. J. Polym. Sci. Part A Polym. Chem.
1993, 31, 3239–3243.
(32) Baker, M. S.; Kim, H.; Olah, M. G.; Lewis, G. G.; Phillips, S. T. Depolymerizable
Poly(benzyl Ether)-Based Materials for Selective Room Temperature Recycling.
Green Chem. 2015, 17 (9), 4541–4545.
(33) Chen, E. K. Y.; McBride, R. A.; Gillies, E. R. Self-Immolative Polymers
Containing Rapidly Cyclizing Spacers: Toward Rapid Depolymerization Rates.
Macromolecules 2012, 45 (18), 7364–7374.
(34) DeWit, M. A.; Gillies, E. R. A Cascade Biodegradable Polymer Based on
Alternating Cyclization and Elimination Reactions. J. Am. Chem. Soc. 2009, 131
(51), 18327–18334.
(35) Dewit, M. A.; Beaton, A.; Gillies, E. R. A Reduction Sensitive Cascade
Biodegradable Linear Polymer. J. Polym. Sci. Part A Polym. Chem. 2010, 48 (18),
3977–3985.
(36) DeWit, M. a; Gillies, E. R. Design, Synthesis, and Cyclization of 4-Aminobutyric
Acid Derivatives: Potential Candidates as Self-Immolative Spacers. Org. Biomol.
Chem. 2011, 9 (6), 1846–1854.
(37) Blencowe, C. A.; Russell, A. T.; Greco, F.; Hayes, W.; Thornthwaite, D. W. Self-
Immolative Linkers in Polymeric Delivery Systems. Polym. Chem. 2011, 2 (4),
773–790.
(38) Aso, C.; Tagami, S. Cyclopolymerization of o-phthalaldehyde. J. Polym. Sci. Part
B Polym. Lett. 1967, 5 (3), 217–220.

60
(39) Ito, Hiroshi; Willson, G. Chemical Amplification in the Design of Dry Developing
Resist Materials. Polym. Eng. Sci. 1983, 23 (18), 1012–1018.
(40) Zhang, H.; Yeung, K.; Robbins, J. S.; Pavlick, R. A.; Wu, M.; Liu, R.; Sen, A.;
Phillips, S. T. Self-Powered Microscale Pumps Based on Analyte-Initiated
Depolymerization Reactions. Angew. Chem. Int. Ed. 2012, 51 (10), 2400–2404.
(41) Dilauro, A. M.; Zhang, H.; Baker, M. S.; Wong, F.; Sen, A.; Phillips, S. T.
Accessibility of Responsive End-Caps in Films Composed of Stimuli-Responsive,
Depolymerizable Poly(phthalaldehydes). Macromolecules 2013, 46 (18), 7257–
7265.
(42) Dilauro, A. M.; Abbaspourrad, A.; Weitz, D. A.; Phillips, S. T. Stimuli-Responsive
Core-Shell Microcapsules with Tunable Rates of Release by Using a
Depolymerizable Poly(phthalaldehyde) Membrane. Macromolecules 2013, 46 (9),
3309–3313.
(43) Crutchfield, M. M., Papanu, V. D., Warren, C. B. Polymeric Acetal Carboxylates.
US Patent 4,144,226A, May 13, 1979.
(44) Kim, J. K.; Garripelli, V. K.; Jeong, U. H.; Park, J. S.; Repka, M. A.; Jo, S. Novel
pH-Sensitive Polyacetal-Based Block Copolymers for Controlled Drug Delivery.
Int. J. Pharm. 2010, 401 (1-2), 79–86.
(45) Belloncle, B.; Burel, F.; Oulyadi, H.; Bunel, C. Study of the in Vitro Degradation
of Poly(ethyl Glyoxylate). Polym. Degrad. Stab. 2008, 93 (6), 1151–1157.
(46) Aso, C.; Tagami, S.; Kunitake, T. Polymerization of Aromatic Aldehydes. II.
Cationic Cyclopolymerization of Phthalaldehyde. J. Polym. Sci. Part A Polym.
Chem. 1969, 7, 497–511.
(47) Fan, B.; Trant, J. F.; Wong, A. D.; Gillies, E. R. Polyglyoxylates: A Versatile
Class of Triggerable Self-Immolative Polymers from Readily Accessible
Monomers. J. Am. Chem. Soc. 2014, 136 (28), 10116–10123.

61
(48) Lewis, G. G.; Ditucci, M. J.; Phillips, S. T. Quantifying Analytes in Paper-Based
Microfluidic Devices without Using External Electronic Readers. Angew. Chem.
Int. Ed. 2012, 51 (51), 12707–12710.
(49) Schmid, K. M.; Jensen, L.; Phillips, S. T. A Self-Immolative Spacer That Enables
Tunable Controlled Release of Phenols under Neutral Conditions. J. Org. Chem.
2012, 77 (9), 4363–4374.
(50) Robbins, J. S.; Schmid, K. M.; Phillips, S. T. Effects of Electronics, Aromaticity,
and Solvent Polarity on the Rate of Azaquinone-Methide-Mediated
Depolymerization of Aromatic Carbamate Oligomers. J. Org. Chem. 2013, 78 (7),
3159–3169.
(51) Schmid, K. M.; Phillips, S. T. Effect of Aromaticity on the Rate of Azaquinone
Methide-Mediated Release of Benzylic Phenols. J. Phys. Org. Chem. 2013, 26 (7),
608–610.
(52) Lewis, G. G.; Robbins, J. S.; Phillips, S. T. Phase-Switching Depolymerizable
Poly(carbamate) Oligomers for Signal Amplification in Quantitative Time-Based
Assays. Macromolecules 2013, 46 (13), 5177–5183.
(53) Lewis, G. G.; Robbins, J. S.; Phillips, S. T. Point-of-Care Assay Platform for
Quantifying Active Enzymes to Femtomolar Levels Using Measurements of Time
as the Readout. Anal. Chem. 2013, 85 (21), 10432–10439.
(54) Randić, M. Aromaticity of Polycyclic Conjugated Hydrocar ons. Chem. Rev.
2003, 103 (9), 3449–3605.
(55) Waldemar, A.; Rodriguez, A. Cyclic Peroxides. 92. Oxygen Atom Transfer by
Furan Endoperoxides. J. Am. Chem. Soc. 1980, 102 (1), 404–406.
(56) Yakushijin, K.; Suzuki, R.; Kawaguchi, N.; Tsuboi, Y.; Furukawa, H. Ring
Transformation of 2-Furylcarbamates to 5-Hydroxy-3-Pyrrolin-2-Ones. Chem.
Pharm. Bull. 1986, 34 (5), 2049–2055.

62
(57) Wuts, P. G. M. Greene’s Protective Groups in Organic Synthesis: Fifth Edition;
2014.

63
Chapter 3
Solid-State Depolymerization of Poly(benzyl ethers)
3.1 Introduction
The ability to efficiently depolymerize in the solid state could considerably
expand the scope of potential applications for CDr polymers.1 Compared to other current
polymer technologies, the ability to impart a self-amplified response to a solid stimuli-
responsive material would i) bring about large changes in global properties of the
material in response to a specific signal; ii) substantially increase the rate of change in the
material; and iii) decrease the amount of signal required to induce the transformation.2
Since depolymerization is based on the interaction of a specific analyte with a
reaction-based detection group, the rate with which the CDr polymer-based material
depolymerizes in the solid state is determined largely by the number of responsive
functional groups found at the surface of the plastic material2,3
(Figure 3-1b). As the
number of detection groups at the surface is increased, so too are the opportunities for
initiating depolymerization of a polymer chain with a signal in the air or fluid that
contacts the material. Thus, a polymer containing only a single detection group at the
terminus of the polymer (Figure 3-1a) possesses limited opportunities to interact with the
surrounding substrate, as a significant portion of the reactive groups likely are buried
beneath the surface of the hard plastic. Typically, a small amount (less than 1%) of
detection groups in these polymers are accessible to a stimulus in the surrounding

64
solution.3 Once all available detection groups at the solid-liquid interface have been
exhausted, the solid-state plastic often ceases to depolymerize.
Figure 3-1. a) Depolymerization mechanism of a poly(benzyl ether) containing a single
reaction-based detection group at the terminus of the polymer. b) Cross section of a
plastic depicting accessibility of detection groups at the solid-liquid interface of the
material.2 Adapted with permission from J. Am. Chem. Soc. 2015, 137 (16), 5324−5327.
Copyright 2015 American Chemical Society.
Using fluoride-responsive poly(benzyl ethers) as a model, Yeung and coworkers
previously demonstrated that the number of accessible detection groups can be increased
by attaching detection units to each repeating unit along a polymer chain2 (Figure 3-2).
While this modification increases the likelihood of reaction between an applied signal
and a detection unit, the magnitude of signal amplification achieved from a single
accessible to a stimulus in solution
inaccessible to a stimulus in solution
a)
b)
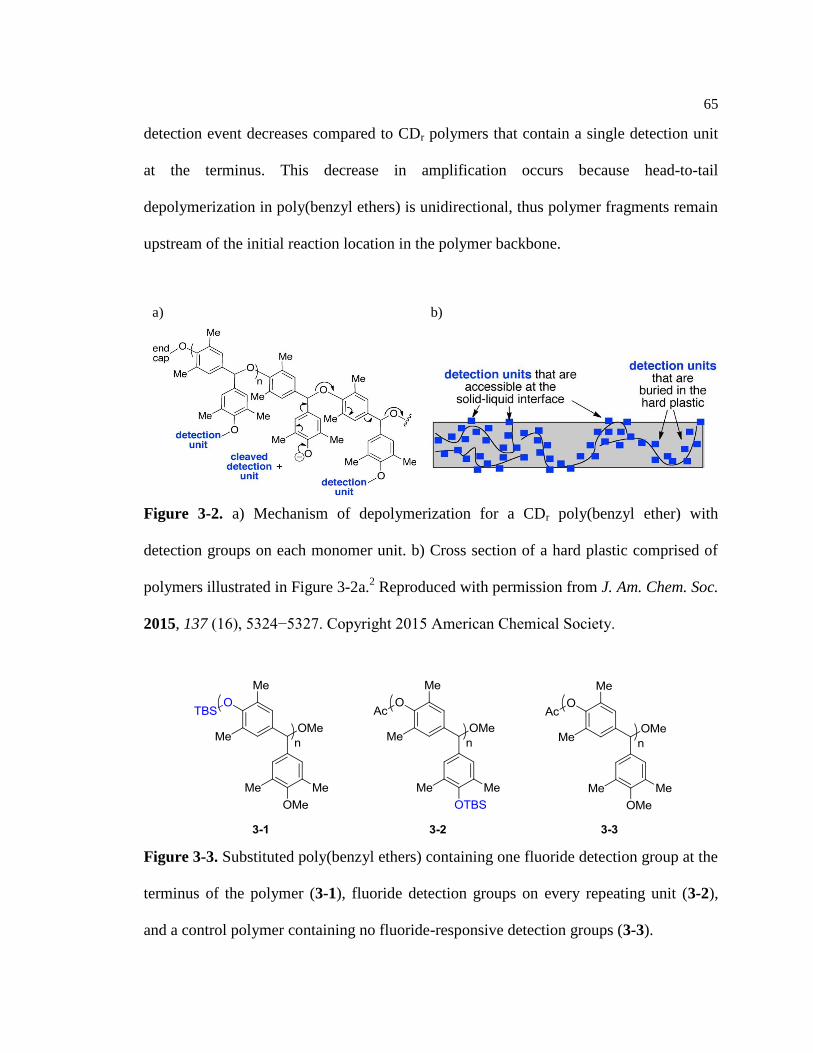
65
detection event decreases compared to CDr polymers that contain a single detection unit
at the terminus. This decrease in amplification occurs because head-to-tail
depolymerization in poly(benzyl ethers) is unidirectional, thus polymer fragments remain
upstream of the initial reaction location in the polymer backbone.
Figure 3-2. a) Mechanism of depolymerization for a CDr poly(benzyl ether) with
detection groups on each monomer unit. b) Cross section of a hard plastic comprised of
polymers illustrated in Figure 3-2a.2 Reproduced with permission from J. Am. Chem. Soc.
2015, 137 (16), 5324−5327. Copyright 2015 American Chemical Society.
Figure 3-3. Substituted poly(benzyl ethers) containing one fluoride detection group at the
terminus of the polymer (3-1), fluoride detection groups on every repeating unit (3-2),
and a control polymer containing no fluoride-responsive detection groups (3-3).
a) b)

66
Yeung and coworkers illustrated the stark difference of reaction rate between a
poly(benzyl ether) containing a single detection group (3-1), and a poly(benzyl ether)
with pendant detection groups on each repeating unit of the polymer2 (3-2) (Figure 3-3).
Discs fabricated from each polymer were submersed in a 3.6 M solution of tetra-n-
butylammonium fluoride (TBAF) in MeCN. While polymer 3-1 initially exhibits
diffusion of the colored monomer species, the available detection groups are quickly
consumed and the remaining polymer disc is stable for one week (Figure 3-4). In
contrast, polymer 3-2 depolymerizes completely under identical conditions over the
course of four hours (Figure 3-5). Control polymer 3-3, containing no silyl ether
detection groups, shows no depolymerization over the course of a week (Figure 3-6).
Figure 3-4. Photographs of solid-state studies with a disc prepared from polymer 3-1 (Mn
= 6.8 kDa) after exposure to 3.6 M TBAF in MeCN. After the fluoride solution is added,
a purple/yellow color is generated, indicating depolymerization is occurring, yet the disc
remains intact over the course of a week.2 Reproduced with permission from J. Am.
Chem. Soc. 2015, 137 (16), 5324−5327. Copyright 2015, American Chemical Society.
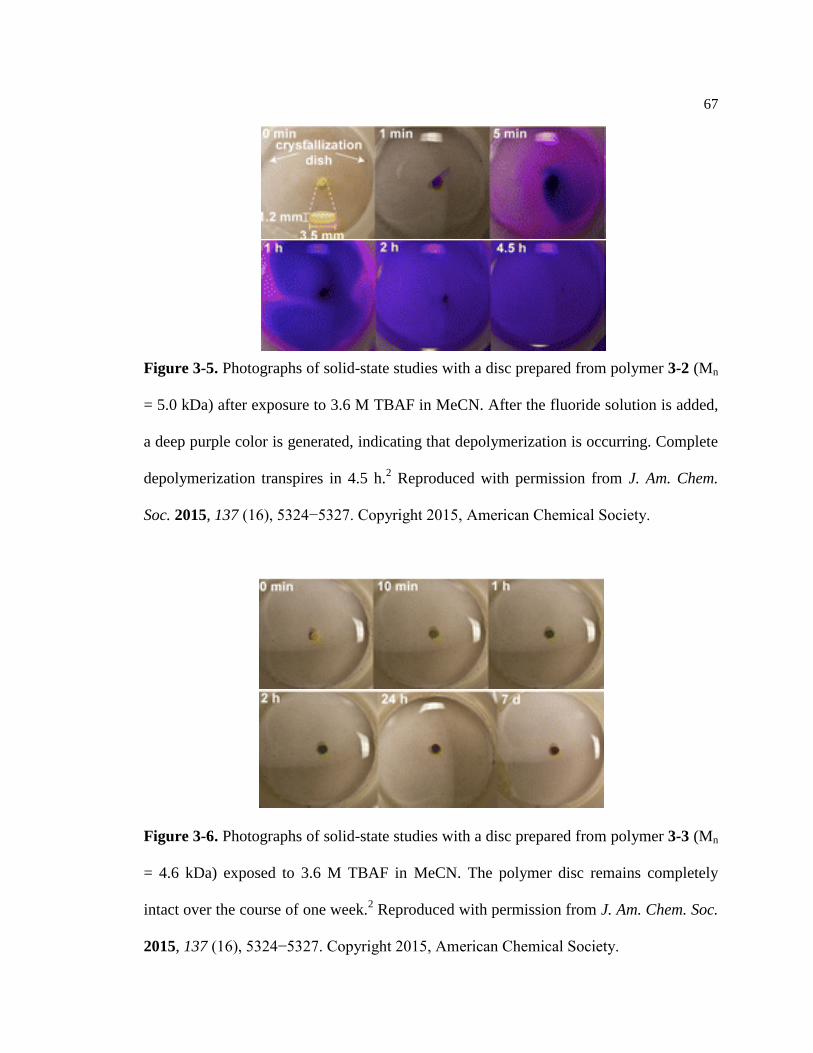
67
Figure 3-5. Photographs of solid-state studies with a disc prepared from polymer 3-2 (Mn
= 5.0 kDa) after exposure to 3.6 M TBAF in MeCN. After the fluoride solution is added,
a deep purple color is generated, indicating that depolymerization is occurring. Complete
depolymerization transpires in 4.5 h.2 Reproduced with permission from J. Am. Chem.
Soc. 2015, 137 (16), 5324−5327. Copyright 2015, American Chemical Society.
Figure 3-6. Photographs of solid-state studies with a disc prepared from polymer 3-3 (Mn
= 4.6 kDa) exposed to 3.6 M TBAF in MeCN. The polymer disc remains completely
intact over the course of one week.2 Reproduced with permission from J. Am. Chem. Soc.
2015, 137 (16), 5324−5327. Copyright 2015, American Chemical Society.
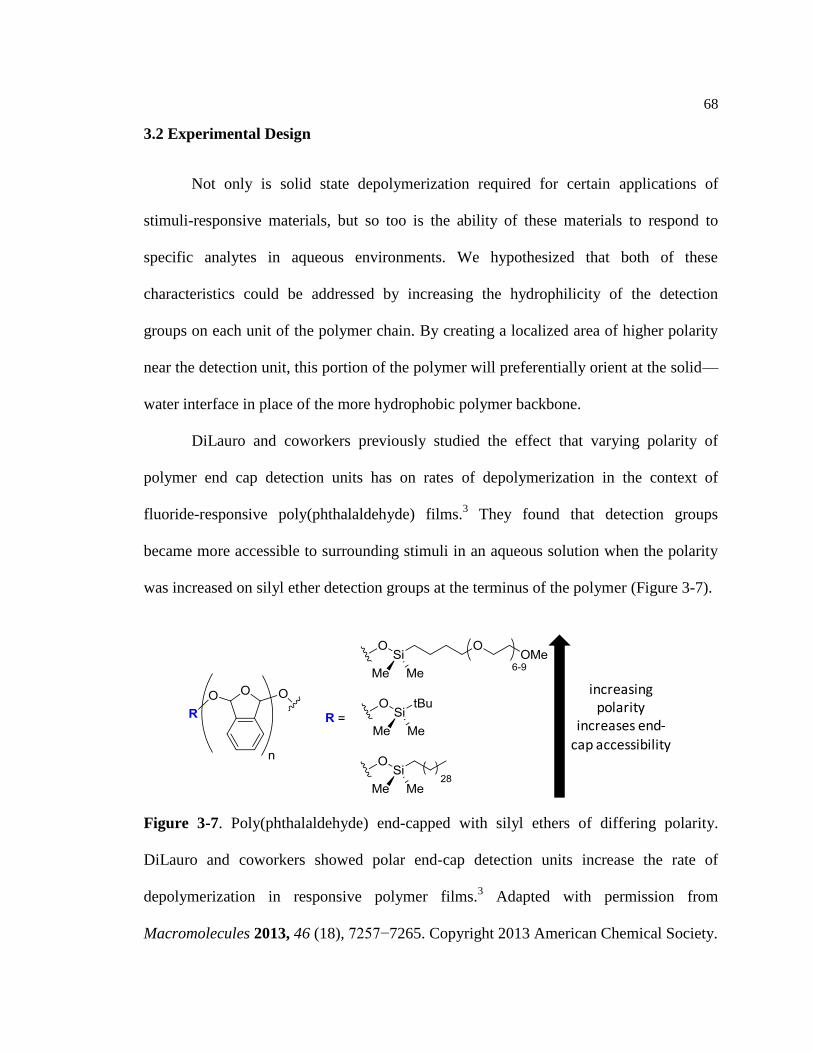
68
3.2 Experimental Design
Not only is solid state depolymerization required for certain applications of
stimuli-responsive materials, but so too is the ability of these materials to respond to
specific analytes in aqueous environments. We hypothesized that both of these
characteristics could be addressed by increasing the hydrophilicity of the detection
groups on each unit of the polymer chain. By creating a localized area of higher polarity
near the detection unit, this portion of the polymer will preferentially orient at the solid—
water interface in place of the more hydrophobic polymer backbone.
DiLauro and coworkers previously studied the effect that varying polarity of
polymer end cap detection units has on rates of depolymerization in the context of
fluoride-responsive poly(phthalaldehyde) films.3 They found that detection groups
became more accessible to surrounding stimuli in an aqueous solution when the polarity
was increased on silyl ether detection groups at the terminus of the polymer (Figure 3-7).
Figure 3-7. Poly(phthalaldehyde) end-capped with silyl ethers of differing polarity.
DiLauro and coworkers showed polar end-cap detection units increase the rate of
depolymerization in responsive polymer films.3 Adapted with permission from
Macromolecules 2013, 46 (18), 7257−7265. Copyright 2013 American Chemical Society.
increasing polarity
increases end-
cap accessibility
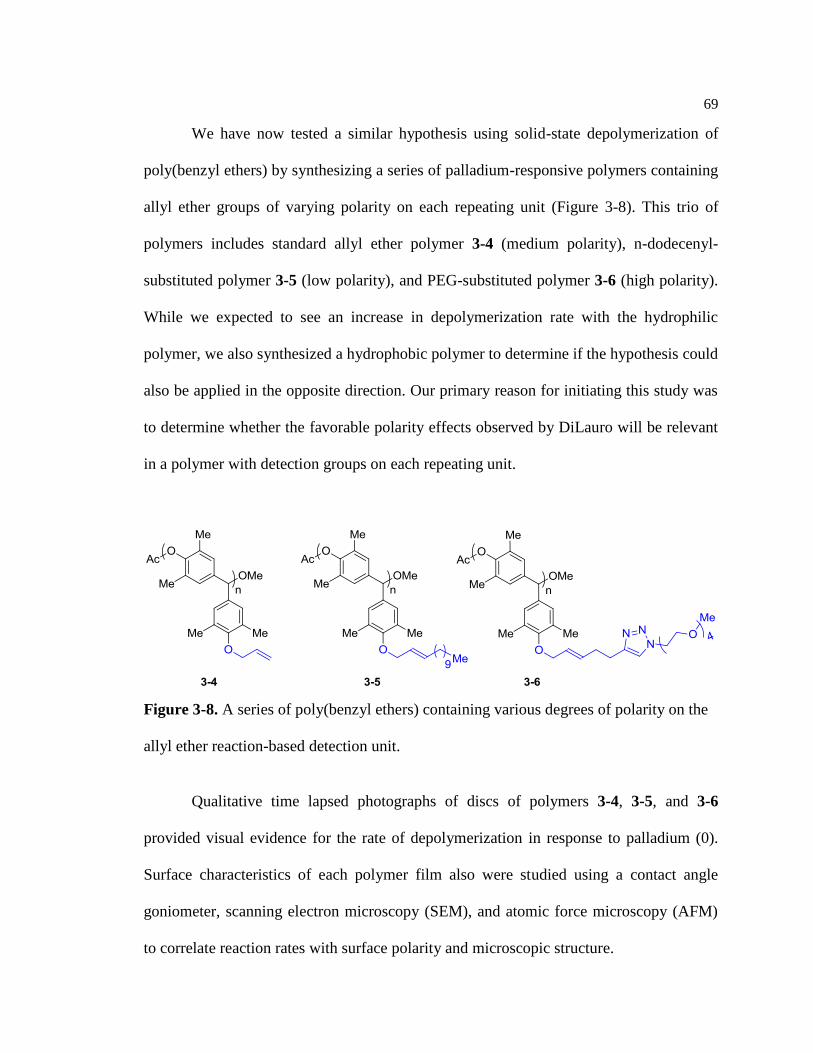
69
We have now tested a similar hypothesis using solid-state depolymerization of
poly(benzyl ethers) by synthesizing a series of palladium-responsive polymers containing
allyl ether groups of varying polarity on each repeating unit (Figure 3-8). This trio of
polymers includes standard allyl ether polymer 3-4 (medium polarity), n-dodecenyl-
substituted polymer 3-5 (low polarity), and PEG-substituted polymer 3-6 (high polarity).
While we expected to see an increase in depolymerization rate with the hydrophilic
polymer, we also synthesized a hydrophobic polymer to determine if the hypothesis could
also be applied in the opposite direction. Our primary reason for initiating this study was
to determine whether the favorable polarity effects observed by DiLauro will be relevant
in a polymer with detection groups on each repeating unit.
Figure 3-8. A series of poly(benzyl ethers) containing various degrees of polarity on the
allyl ether reaction-based detection unit.
Qualitative time lapsed photographs of discs of polymers 3-4, 3-5, and 3-6
provided visual evidence for the rate of depolymerization in response to palladium (0).
Surface characteristics of each polymer film also were studied using a contact angle
goniometer, scanning electron microscopy (SEM), and atomic force microscopy (AFM)
to correlate reaction rates with surface polarity and microscopic structure.

70
3.3 Results and Discussion
3.3.1 Synthesis of the Monomers
Quinone methide monomers containing pendant detection groups of varying
polarity (3-7, 3-8, 3-9) were prepared using short syntheses (3 steps, 28–39% yields), and
were polymerized under anionic conditions to produce polymers 3-4, 3-5, and 3-6
(Figures 3-9, 3-10, and 3-11), respectively.
Figure 3-9. Synthetic scheme for monomer 3-7.
Figure 3-10. Synthetic scheme for monomer 3-8.

71
Figure 3-11. Synthetic scheme for monomer 3-9.
3.3.2 Synthesis of Poly(benzyl ethers)
Phosphazene base (P1-t-Bu) and methanol were used to initiate polymerization.
The reaction temperature is held at −20 oC for one hour, and then the polymer is end-
capped with acetic anhydride and slowly warmed to room temperature (Figure 3-12).
Figure 3-12. Conditions for anionic polymerization of poly(benzyl ethers) 3-4, 3-5, and
3-6 as well as corresponding data for each polymer used in depolymerization studies.
(Mn = molecular weight, DP = degree of polymerization, PDI = polydispersity index).
R Mn (kDa) DP PDI Yield (%)
3-4 77.0 ± 2.0% 262 1.4 82
3-5 30.6 ± 0.9% 71 1.5 61
3-18 39.3 ± 2.0% 114 1.2 84

72
Polymerization yields generally exceeded 80% with the exception of polymer 3-5,
which suffered due to poor solubility of the monomer under optimized polymerization
conditions. The synthesis of 3-6 requires a post-polymerization azide-alkyne
cycloaddition, which allows for efficient coupling of hydrophilic, reactive, or unstable
functional groups to the polymer without sacrificing yield or length during
polymerization (Figure 3-13). Due to the hygroscopic nature of PEG-functionalized
monomers, it proved difficult to obtain consistent, controllable length and dispersity
values for polymer 3-6 without the use of post-polymerization modification.
Figure 3-13. The azide/alkyne cycloaddition used to complete the synthesis of 3-6.
3.3.3 Solution Phase Studies for Selective Depolymerization of Poly(benzyl ethers)
We first evaluated how each poly(benzyl ether) responds when exposed to
palladium (0) in solution, using gel permeation chromatography (GPC) to monitor the
depolymerization reaction (Figure 3-14). For example, treatment of polymer 3-4 (Mn =
72.8 kDa, 17 mM) with Pd(PPh3)4 (34 mM) and 1-8-diazabicycloundec-7-ene DBU (85
mM) in THF showed complete depolymerization after 1 h (Figure 3-15a). The reaction

73
mixture quickly turned a deep purple color, indicating release of deprotected monomer 3-
19. Polymer 3-6 (70.1 kDa, 8.6 mM) also depolymerized completely when exposed to
Pd(PPh3)4 (17 mM) and DBU (85 mM) in THF, but at a slower rate than polymer 3-4
(Figure 3-15b). This decreased rate might occur as a result of the steric bulk neighboring
the functional allyl ether in polymer 3-6. Very little or no depolymerization was observed
for both polymers in the absence of Pd(PPh3)4 (Figure 3-16).
Figure 3-14. Depolymerization reaction and conditions used for solution phase studies.
Figure 3-15. Responses of polymers a) 3-4 and b) 3-6 as monitored by GPC after
exposure to Pd(PPh3)4 (34 mM) and DBU (85 mM) in THF.
Elapsed time (h):0.0, 1.0, 3.0
Elapsed time (h):0.0, 0.5, 1.0
GP
C R
efr
acti
ve I
nd
ex
GP
C R
efr
acti
ve I
nd
ex
Retention Time (min) Retention Time (min)
a) b)
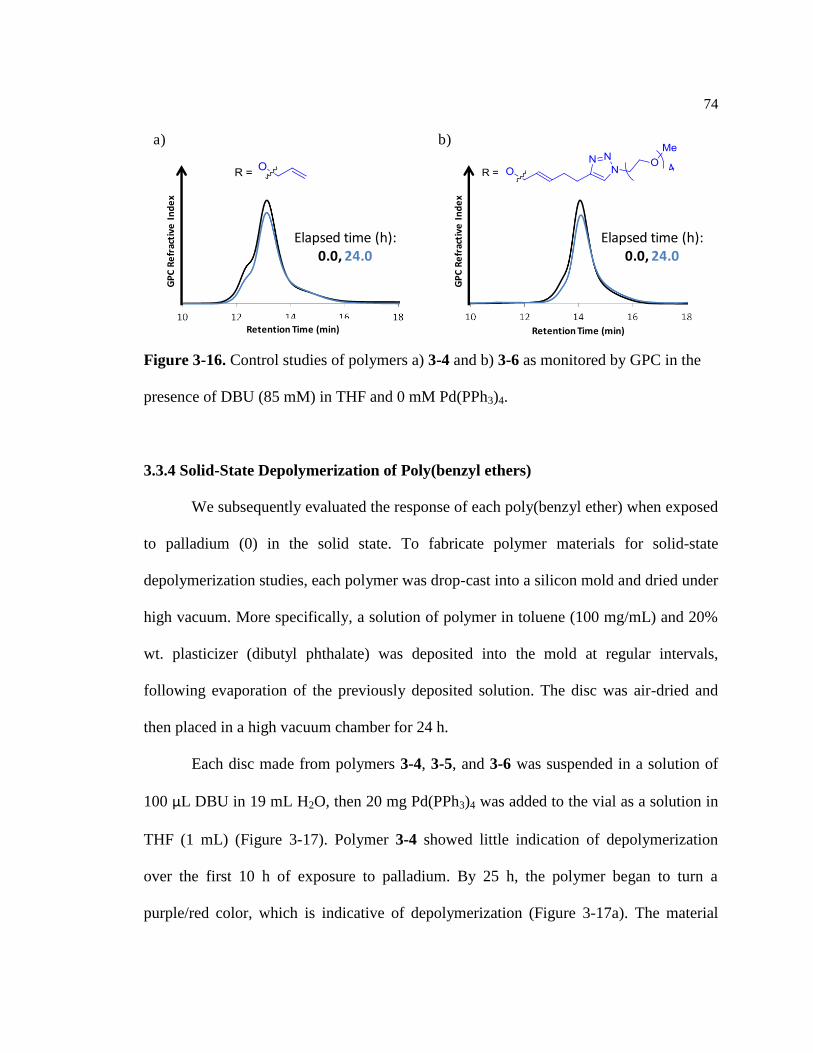
74
Figure 3-16. Control studies of polymers a) 3-4 and b) 3-6 as monitored by GPC in the
presence of DBU (85 mM) in THF and 0 mM Pd(PPh3)4.
3.3.4 Solid-State Depolymerization of Poly(benzyl ethers)
We subsequently evaluated the response of each poly(benzyl ether) when exposed
to palladium (0) in the solid state. To fabricate polymer materials for solid-state
depolymerization studies, each polymer was drop-cast into a silicon mold and dried under
high vacuum. More specifically, a solution of polymer in toluene (100 mg/mL) and 20%
wt. plasticizer (dibutyl phthalate) was deposited into the mold at regular intervals,
following evaporation of the previously deposited solution. The disc was air-dried and
then placed in a high vacuum chamber for 24 h.
Each disc made from polymers 3-4, 3-5, and 3-6 was suspended in a solution of
100 μL DBU in 19 mL H2O, then 20 mg Pd(PPh3)4 was added to the vial as a solution in
THF (1 mL) (Figure 3-17). Polymer 3-4 showed little indication of depolymerization
over the first 10 h of exposure to palladium. By 25 h, the polymer began to turn a
purple/red color, which is indicative of depolymerization (Figure 3-17a). The material
Elapsed time (h):0.0, 24.0
Elapsed time (h):0.0, 24.0
GP
C R
efr
acti
ve I
nd
ex
GP
C R
efr
acti
ve I
nd
ex
Retention Time (min) Retention Time (min)
a) b)

75
slowly released monomers into the surrounding solution, yet the disc maintained a
constant shape over 100 h of reaction time.
In contrast, polymer 3-6 began changing color and releasing monomers much
faster than 3-4 (Figure 3-17b). By approximately 30 h the polymer had depolymerized
completely, leaving only a residue at the bottom of the vial, which we observe frequently
when the palladium catalyst becomes inactive. Finally, polymer 3-5 displayed a similar
response to polymer 3-4, as a significant portion of the polymer disc still remained after
100 h of exposure to the analyte in solution (Figure 3-17c).
Figure 3-17. Time lapsed photographs of the solid-state depolymerization of discs
prepared from polymers a) 3-4, b) 3-6, and c) 3-5. Each polymer was submerged in 20
mL of a 95% H2O−THF solution containing 20 mg Pd(PPh3)4 and 100 μL DBU.
Time (h) 0 5 15 25 33
Time (h) 0 5 25 50 100
Time (h) 0 5 25 50 100
3-4
3-6
3-5
a)
b)
c)

76
Control tests also were performed in the absence of palladium (0). Each polymer
disc was photographed for one week while suspended in a 95% H2O−THF solution
containing 100 μL DBU (Figure 3-18a). No change was observed in the shape of polymer
3-4 over the course of one week, while polymer 3-6 exhibited swelling and slight color
changes during the same time period (Figure 3-18b). This change in color and size is
likely due to a small number of hydrolysis events occurring at the acetate end-cap of the
polymer that makes up the disc. The basic reaction mixture has greater access to the end-
caps of polymer 3-6 as opposed to polymer 3-4 due to swelling properties and the
increased hydrophilic nature of the material.
Figure 3-18. Photographs of solid-state control studies with discs prepared from
polymers a) 3-4 and b) 3-6 in the absence of palladium. Each polymer disc was
photographed for one week while suspended in a 19:1 H2O−THF solution containing 100
μL DBU.
Time (d) 0 1 3 5
3-4
3-6
a)
b)

77
GPC analysis of the surrounding solution following solid-state control tests of
polymers 3-4 and 3-6 confirmed that the polymer disc was not dissolving or diffusing
into the surrounding aqueous solution. After two months, aliquots of the solution were
removed and injected into the GPC (Figure 3-19).
Figure 3-19. Gel permeation chromatograms of a) 3-4 and b) 3-6 comparing the initial
polymer from which the disc is made (black), and the solution surrounding the disc
following two months of submersion in THF, H2O, and DBU (blue).
3.3.5 Verification of the Head-to-Tail Depolymerization Mechanism
To confirm that polymer 3-6 is depolymerizing from head-to-tail, we performed a
series of analytical tests on the solution surrounding the solid-state disc in Figure 3-17b.
The absence of polymer 3-6 from the surrounding solution was verified by GPC (Figure
3-20). Additionally, LCMS analysis of the surrounding solution identified deprotected
quinone methide 3-19 (M + H+ = 255.1) as well as unreacted PEG monomer 3-20 (M +
H+ = 580.2) (Figure 3-21). The presence of both products confirms that the polymer
depolymerizes through a head-to-tail mechanism without requiring allyl ether
deprotection on each unit in order for depolymerization to occur.
5 15 25 5 15 25G
PC
Re
frac
tive
In
de
x
Retention Time (min)
GP
C R
efr
acti
ve I
nd
ex
Retention Time (min)
a) b)

78
Figure 3-20. GPC analysis of the surrounding solution (blue) from solid-state
depolymerization tests of polymer 3-6 (black), indicating only small molecules remain.
Figure 3-21. LCMS analysis of the solution surrounding the solid-state studies of 3-6
after being exposed to Pd(PPh3)4 and DBU in THF. Masses of both deprotected monomer
3-19 and unreacted monomer 3-20 indicate successful head-to-tail depolymerization.
GP
C R
efr
acti
ve In
de
x
Retention Time (min)
3-19M+ H+ = 255.1
3-20M + H+ = 580.2
O=PPh3
DBU

79
3.3.6 Characterization of Material properties
In addition to reaction-based studies, we analyzed the material properties of the
discs made from polymers 3-4, 3-5, and 3-6. Contact angle measurements of each
polymer were obtained using goniometry. Films were created by spin-casting 10 mg/mL
solutions of each polymer in chloroform onto glass slides, which were then dried in a
vacuum oven overnight. High-resolution photographs were taken of 5 μL water droplets
on the polymer films. The contact angles from polymer 3-6 were found to e
approximately 25 less than those from hydrophobic polymers 3-4, and 3-5 (Figure 3-22).
The measurements shown are an average of three trials. The enhanced hydrophilicity of
polymer 3-6 indicates that the wettability of the polymeric material allows it to interact
more favorably with the surrounding solution, and this characteristic likely plays an
important role in determining the rate of depolymerization in the solid state.
Figure 3-22. Contact angle measurements of polymer films fabricated by spin-casting of
polymers 3-4, 3-5, and 3-6 on glass substrates.
The surface morphologies of the polymer discs were characterized using FE-SEM
imaging (Figure 3-23). At 5,000× magnification, the surfaces of 3-4 and 3-6 appear to be
96.3 ± 1.04°93.9 ± 1.25° 69.7 ± 0.25°
3-4 3-5 3-6

80
smooth and relatively free of imperfections or changes in surface area. These images
provide little indication that surface characteristics of PEG-substituted polymer 3-6 are a
significant factor in its increased rate of solid-state depolymerization. Additionally, the
lack of significant roughness on polymers 3-4 and 3-6 indicates that there are no
morphological changes which affect the contact angle measurements in Figure 3-23.
Thus, the difference in contact angle likely is caused primarily by the pendant chemical
functionalities on the polymer backbone.
Figure 3-23. SEM images showing the surface morphologies of polymer discs fabricated
from 3-4, 3-5, and 3-6 at 5,000× magnification.
10 μm
3-4 3-5
3-6
10 μm 10 μm

81
Films comprised of polymers 3-4, 3-5, and 3-6 (with 20 wt% plasticizer) were
spin-coated onto mica discs and used to acquire Young’s modulus values (the resistance
of a substance to elastic deformation) via Atomic Force Microscopy (AFM) (Figure 3-
24). Measurements exhibited a significant dichotomy in rigidity between polymer 3-4
(1303 ± 96.2 MPa) and polymers 3-5 (29.5 ± 3.3 MPa) and 3-6 (32.7 ± 1.7 MPa).
Previous methods used to increase detection group accessibility in solid-state materials
have not compromised or changed the overall rigidity of the plastic.2,3
In this case
polymer 3-6 is significantly softer than polymer 3-4, but the lack of material rigidity does
not directly lead to rapid solid-state depolymerization. The similar softness of polymer 3-
5 compared to polymer 3-6 indicates that the elastic nature of these polymers is likely not
a primary factor in the increased rate of depolymerization of 3-6.
Figure 3-24. Young’s modulus measurements of 3-4, 3-5, and 3-6 acquired by Atomic
Force Microscopy (AFM). The data are an average of three measurements.
You
ng
’s M
od
ulu
s (M
Pa)
3-4 3-5 3-6

82
3.4 Conclusions
In an effort to induce efficient solid-state depolymerization in predominately
aqueous environments, we have developed a poly(benzyl ether) functionalized with
hydrophilic detection groups on each repeating unit of the polymer chain. This polymer
showed fast rates of depolymerization and increased hydrophilicity compared to
poly(benzyl ethers) with pendant detection groups containing less polar functionalities.
Material property analysis of the polymers indicated that the increased hydrophilicity is a
primary factor in accelerating the rate of solid-state depolymerization in water. We
envision that these results will contribute to the future design of CDr polymers with
applications in mind such as responsive coatings and plastics that are recycled easily and
selectively.

83
3.5 References
(1) Baker, M. S.; Kim, H.; Olah, M. G.; Lewis, G. G.; Phillips, S. T. Depolymerizable
Poly(benzyl Ether)-Based Materials for Selective Room Temperature Recycling.
Green Chem. 2015, 17 (9), 4541–4545.
(2) Yeung, K.; Kim, H.; Mohapatra, H.; Phillips, S. T. Surface-Accessible Detection
Units in Self-Immolative Polymers Enable Translation of Selective Molecular
Detection Events into Amplified Responses in Macroscopic, Solid-State Plastics.
J. Am. Chem. Soc. 2015, 137 (16), 5324–5327.
(3) Dilauro, A. M.; Zhang, H.; Baker, M. S.; Wong, F.; Sen, A.; Phillips, S. T.
Accessibility of Responsive End-Caps in Films Composed of Stimuli-Responsive,
Depolymerizable Poly(phthalaldehydes). Macromolecules 2013, 46 (18), 7257–
7265.

84
Chapter 4
Mechanically-Induced Responses of CDr Polymers
4.1 Introduction to Mechanoresponsive Materials
The pursuit of new stimuli-responsive materials has recently expanded beyond the
scope of chemically- or thermally-induced transformations. Due to the abundant
mechanical energy stored along linear polymer chains, mechanoresponsive materials
have become an attractive approach for inciting chemical transformations with an
externally applied physical stimulus.1,2
Materials capable of remodeling their structural
and physical properties in response to force-induced chain scission could be attractive for
several applications, including medical devices, packaging, and electronics.
The study of mechanical stress on materials was pioneered by Staudinger and
coworkers in the 1930’s.3–5
Early work in the field was predominantly centered on
mechanical degradation, including the measurement of stress loads required to reach
mechanical failure and the resulting effect on polymer chain length. However, a new
focus in this area has been the development of mechanoresponsive materials with
“productive” rather than “destructive” outcomes.1 Instead of leading to mechanical
failure, next generation stimuli-responsive materials are being designed to serve specific
functions upon cleavage of scissile chemical bonds.
Interest in this field expanded with the development of “mechanophores,” a
mechanically-sensitive functionality that undergoes chemical change at specific sites

85
along a polymer chain when exposed to mechanical force. This approach was first
demonstrated by Moore in 2005 with an azo-functionalized poly(ethylene glycol).6
Figure 4-1. A list of mechanophores embedded within polymer chains that are designed
to cleave/activate in the presence of ultrasound sonication. Blue arrows indicate polymer
chains and the direction of applied elongational force.2

86
In the past 10 years, a considerable number of mechanophores have been reported
towards the development of “productive” mechanically-responsive polymers7 (Figure 4-
1). These mechanophores can lead to desired material transformations in response to
mechanical stress, including color/fluorescence changes,8 activation of catalysts,
9–11
isomerizations,12
ring-opening reactions,13,14
and depolymerization.15–17
Structural
changes within mechanoresponsive materials range from simple conformational changes
and chain entanglement to bond-stretching deformations and complete chain scission.
The most commonly used method for applying stress in mechanoresponsive
studies is ultrasound sonication. Pressure variations created by a sonication probe
immersed in a polymer solution will create bubbles, which subsequently collapse and
generate solvodynamic shear. Polymers within the pressure gradient generated by the
cavitation of bubbles elongate in one direction (toward the collapsing bubble), which
induces tension—and ultimately scission—along the polymer backbone (Figure 4-2).1
Figure 4-2. Ultrasound sonication of polymers. Collapsing bubbles create a pressure
gradient, which elongates the polymer, and the resulting tensile forces cleave the polymer
at a weak bond near the center of the chain.1 Reproduced with permission from Chem.
Rev., 2009, 109 (11), 5755−5798. Copyright 2009 American Chemical Society.

87
The rate of chain scission is highly dependent on the degree of polymerization in
mechanoresponsive polymers, as elongational forces acting upon the polymer chain will
increase with polymer length.18
Following an initial scission event, polymer chains will
continue to cleave in the presence of mechanical stress until the length of the polymer
decreases to a point that tensile forces along the polymer backbone are not strong enough
to induce bond cleavage.
The vast majority of scissile bonds studied in the context of mechanoresponsive
materials will cleave homolytically,1,19–21
a postulate that especially holds true for the
rupture of C−C onds. The first instrumental experiments confirming radical formation
were demonstrated by Sakaguchi and Sohma in 1975 through the use of electron spin
resonance (ESR).22–24
Ultimately, radicals forming as a result of bond cleavage may
recombine with the same or another polymer chain, disproportionate, or react with
atmospheric oxygen. While newly formed polymer termini are reactive, small molecule
species are not released from the structure in the form of depolymerization following
homolytic cleavage.
In contrast, a limited number of mechanoresponsive materials will result in
heterolytic cleavage. The possibility of heterolytic scission was initially evidenced by
Aktah and Frank, who used first-principles molecular dynamics calculations to theorize
the heterolytic ond cleavage of C−O onds in a PEG polymer dissolved in water.25
While heterolytic scission was proposed in response to mechanical stress, it required
assistance from nearby water molecules, which immediately trapped the termini
following chain cleavage (Figure 4-3).

88
Figure 4-3. Two proposed mechanisms for the heterolytic cleavage of poly(ethylene
glycol) in water.25
One of the first instances of sonication-induced heterolytic cleavage of a polymer
was reported by Moore and coworkers in 2014 with the use of a triarylsulfonium salt
(TAS) mechanophore.26
Trapping experiments of the newly formed polymer termini with
a secondary amine indicated heterolytic release of a phenyl cation from the
mechanophore following the introduction of mechanical stress (Figure 4-4). This result
was validated with the use of GPC and NMR.
Figure 4-4. The proposed mechanism of the TAS mechanophore cleavage induced by
mechanical stress, and subsequent trapping of the produced cation with a secondary
amine.26
i)
ii)

89
Perhaps the largest step toward creating heterolytically cleavable stimuli-
responsive polymers was achieved recently by Boydston, Moore and coworkers, who
demonstrated the mechanoresponsive qualities of poly(phthalaldehyde).15,16
In the
presence of ultrasound sonication, poly(phthalaldehyde) depolymerizes to monomers
following heterolytic cleavage along the polymer’s acetal-based backbone. A proposed
mechanism suggests the formation of an oxocarbenium cation and hemiacetalate anion,
both of which are capable of facilitating depolymerization in the subsequently formed
polymer fragments (Figure 4-5).
Figure 4-5. The proposed mechanism for heterolytic cleavage and subsequent
depolymerization of poly(phthalaldehyde) in response to applied ultrasound sonication.15
Adapted with permission from Nature Chem. 2014, 6 (7), 623−628. Copyright 2014,
Nature Publishing Group.
The heterolytic mechanism was proposed following a series of trapping
experiments using electrophilic (TBS-Cl and pyridine) and nucleophilic (2-methylindole)
reagents. Poly(phthalaldehyde) solutions were sonicated in the presence of each trapping
reagent (250 equiv), and exhibited a significant reduction of refractive index (RI) signal
compared to a control experiment in the absence of trapping reagents (Figure 4-6).
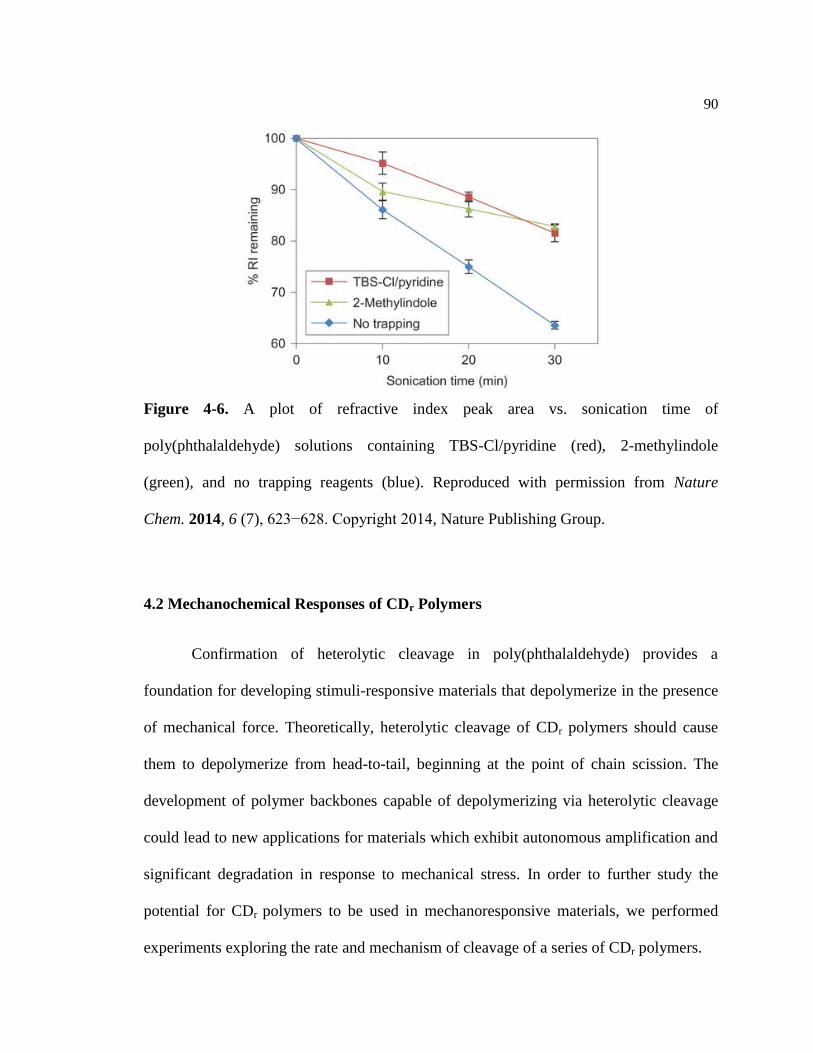
90
Figure 4-6. A plot of refractive index peak area vs. sonication time of
poly(phthalaldehyde) solutions containing TBS-Cl/pyridine (red), 2-methylindole
(green), and no trapping reagents (blue). Reproduced with permission from Nature
Chem. 2014, 6 (7), 623−628. Copyright 2014, Nature Publishing Group.
4.2 Mechanochemical Responses of CDr Polymers
Confirmation of heterolytic cleavage in poly(phthalaldehyde) provides a
foundation for developing stimuli-responsive materials that depolymerize in the presence
of mechanical force. Theoretically, heterolytic cleavage of CDr polymers should cause
them to depolymerize from head-to-tail, beginning at the point of chain scission. The
development of polymer backbones capable of depolymerizing via heterolytic cleavage
could lead to new applications for materials which exhibit autonomous amplification and
significant degradation in response to mechanical stress. In order to further study the
potential for CDr polymers to be used in mechanoresponsive materials, we performed
experiments exploring the rate and mechanism of cleavage of a series of CDr polymers.

91
4.3 Experimental Design
We analyzed the responses of three polymer backbones in the presence of
mechanical stress through a series of experiments using an ultrasonic probe processor.
These experiments were designed to investigate three parameters of each polymer: i) the
mechanism of bond cleavage; ii) the ability to depolymerize following a cleavage event;
and iii) the extent to which degree of polymerization affects the rate of chain scission.
Several different lengths of polymers 4-1, 4-2, and 4-3 were synthesized for use in
sonication experiments. Each polymer was synthesized under anionic conditions using an
alcohol initiator and strong phosphazene base (Figure 4-7).
Figure 4-7. Conditions used to synthesize varying lengths of poly(4,5-
dichlorophthalaldehyde) (4-1), poly(benzyl ether) (4-2), and poly(hexylisocyanate) (4-3)
for sonication experiments. Polymer 4-1 was prepared by Anthony DiLauro, Saptarshi
Chatterjee and Christopher Lyon. Polymer 4-3 was prepared by Kelli Ogawa.

92
Solutions of each polymer in THF (1 mg/mL) were transferred to a Suslick cell
and fastened to the sonication apparatus (Figure 4-8). In each experiment, the sonication
probe operated on intervals of one second on, and nine seconds off. By controlling
sonication on/off cycles and maintaining a constant water/ice bath around the glass cell,
we are able to limit any thermal effects that could potentially arise through heating of the
probe. Each figure representing sonication data within this chapter is a function of
sonication “on” time, as opposed to total elapsed time during the course of the
experiment. At regular intervals during the sonication process, aliquots of the solution
were removed and injected into a GPC to obtain molecular weight, molecular
composition, and intrinsic viscosity data. As a compliment to standard polymer response
tests, reagent trapping experiments and NMR analysis were also used to help elucidate
mechanisms of bond cleavage and rate of depolymerization.
Figure 4-8. A typical sonication experiment setup: the Suslick reaction cell containing a
polymer solution is fastened to the sonication probe and immersed in a cooled water bath.

93
4.4 Results and Discussion
4.4.1 Responses from Each Polymer Backbone
Polymers 4-1, 4-2, and 4-3 were initially studied to determine whether the
backbone depolymerizes in response to mechanically-induced bond cleavage. Aliquots of
the polymer solutions were removed from the sonication apparatus and injected into the
GPC in order to observe changes in composition and molecular weight over the course of
one hour. Of the three polymers tested, only poly(4,5-dichlorophthalaldehyde) 4-1
exhibited a loss of RI signal concurrently with the growth of a new peak in the small
molecule region of the GPC trace (Figure 4-9). This result indicates the possible release
of monomers through mechanically-induced depolymerization. NMR studies were used
to confirm that the small molecule byproduct from sonication of 4-1 is the expected 4,5-
dichlorophthalaldehyde (4-4) (Figure 4-10).
Figure 4-9. Gel permeation chromatograms of 4-1 (45.4 kDa, 224 DP) in response to
ultrasound sonication. The polymer peak (left) gradually loses mass over time in
association with an increase of a peak in the small molecule range (right).
12 14 16 18 20
GP
C R
efr
acti
ve In
de
x
Retention Time (min)
Elapsed Time (min): 0, 1, 5, 10, 20, 40, 60

94
Figure 4-10. a) Nuclear magnetic resonance (NMR) spectrum of 4-4. b) NMR spectra of
polymer 4-1 over time in response to ultrasound sonication. The two peaks of increasing
intensity throughout the experiment correspond to known spectra of pure 4-4.
a
b
a b
4-4
a)
Time (min)
1
20
60
b)

95
Conversely, no increase in RI signal was observed in the small molecule region
during sonication of polymers 4-2 and 4-3, which instead exhibited an increase of RI
signal in the polymer region (Figure 4-11 and Figure 4-12). The increasing RI signal of
each polymer is likely due to a narrowing of polydispersity over time without loss of
polymer mass to small molecules. This evidence suggests that poly(benzyl ethers) and
poly(isocyanates) are cleaved homolytically in response to ultrasonic sonication,
effectively eliminating the potential for subsequent depolymerization.
Figure 4-11. a) GPC analysis of 4-2 (44.2 kDa, 151 DP) in response to ultrasound
sonication. b) Proposed mechanism of cleavage for poly(benzyl ether) polymers.
12 13 14 15 16
GP
C R
efr
acti
ve In
de
x
Retention Time (min)
Elapsed Time (min): 0, 1, 5, 10, 20, 40, 60a)
b)

96
Figure 4-12. a) GPC analysis of 4-3 (21.0 kDa, 165 DP) in response to ultrasound
sonication. b) Proposed mechanism of cleavage for poly(hexylisocyanate) polymers.
4.4.2 Mechanistic Studies: Trapping Experiments
In order to verify the proposed mechanism of chain cleavage for polymer
backbones, we conducted a series of trapping experiments. Head-to-tail depolymerization
following zwitterionic cleavage of 4-1 may be prevented with the addition of a
nucleophile or electrophile, which may react with the newly formed oxocarbenium or
hemiacetalate to form stable polymer end groups. Successful trapping reactions will lead
to a reduction in depolymerization and subsequent monomer formation throughout the
Elapsed Time (min): 0, 1, 5, 10, 20, 40, 60
9 11 13 15
GP
C R
efr
acti
ve In
de
x
Retention Time (min)
a)
b)
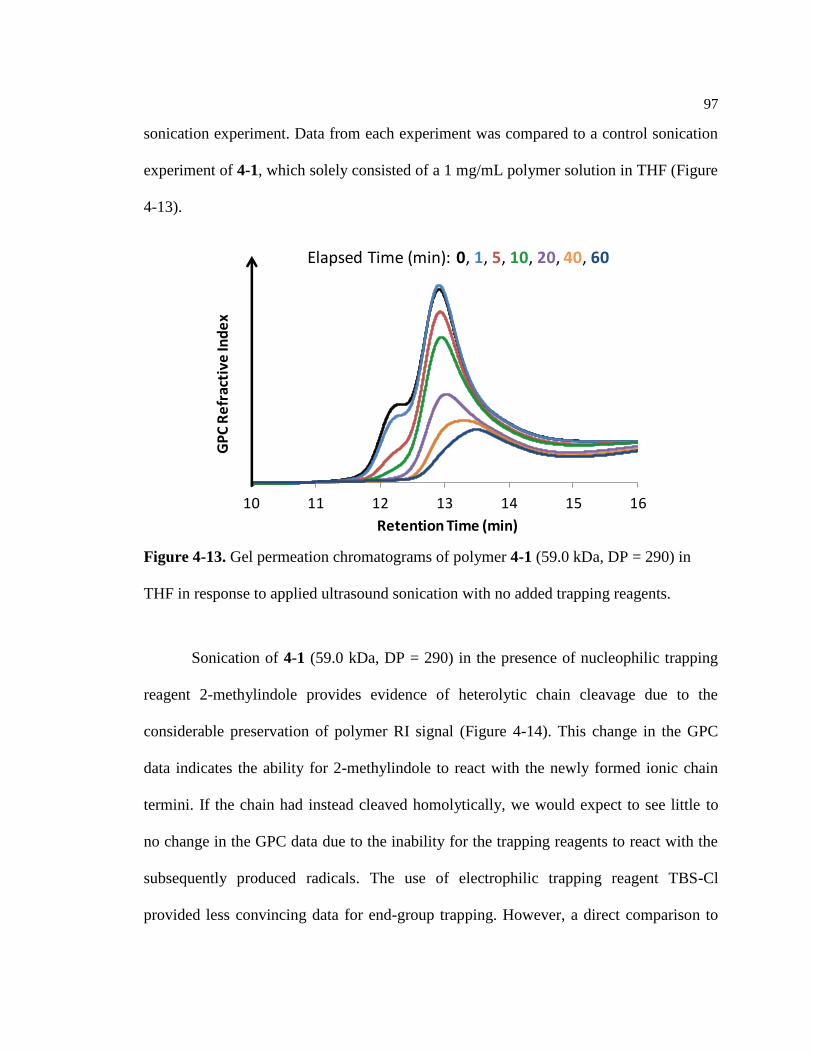
97
sonication experiment. Data from each experiment was compared to a control sonication
experiment of 4-1, which solely consisted of a 1 mg/mL polymer solution in THF (Figure
4-13).
Figure 4-13. Gel permeation chromatograms of polymer 4-1 (59.0 kDa, DP = 290) in
THF in response to applied ultrasound sonication with no added trapping reagents.
Sonication of 4-1 (59.0 kDa, DP = 290) in the presence of nucleophilic trapping
reagent 2-methylindole provides evidence of heterolytic chain cleavage due to the
considerable preservation of polymer RI signal (Figure 4-14). This change in the GPC
data indicates the ability for 2-methylindole to react with the newly formed ionic chain
termini. If the chain had instead cleaved homolytically, we would expect to see little to
no change in the GPC data due to the inability for the trapping reagents to react with the
subsequently produced radicals. The use of electrophilic trapping reagent TBS-Cl
provided less convincing data for end-group trapping. However, a direct comparison to
10 11 12 13 14 15 16
GP
C R
efr
acti
ve In
de
x
Retention Time (min)
Elapsed Time (min): 0, 1, 5, 10, 20, 40, 60
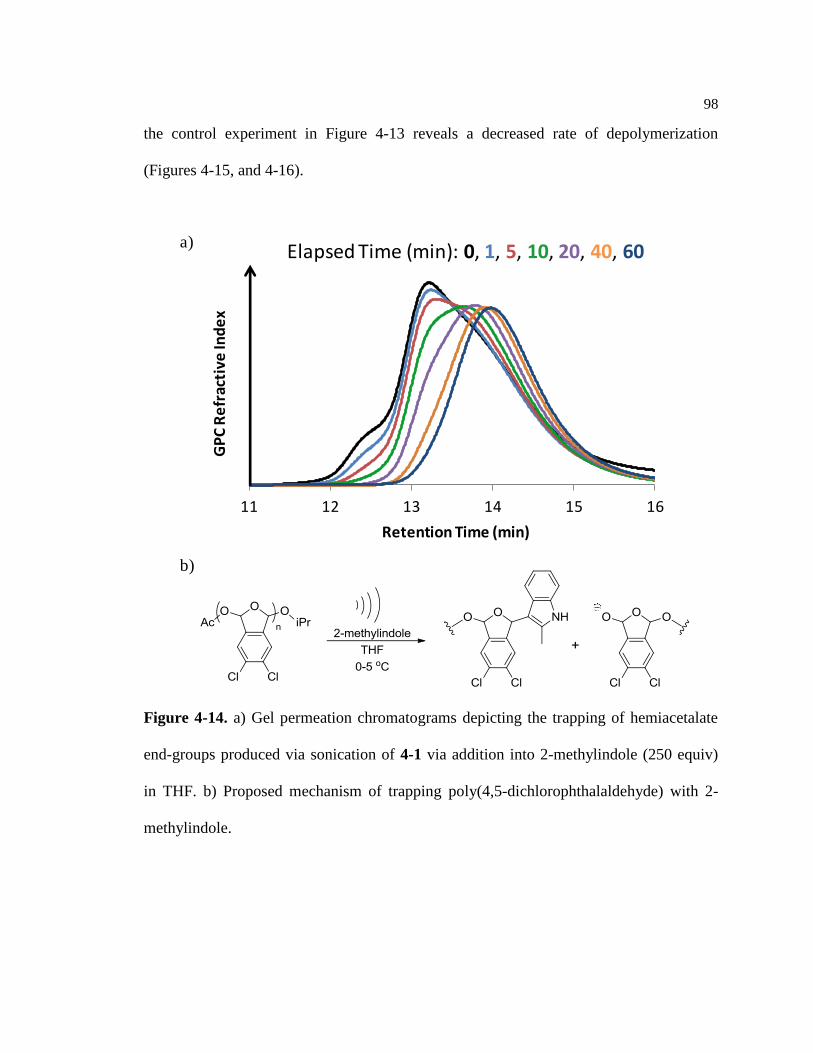
98
the control experiment in Figure 4-13 reveals a decreased rate of depolymerization
(Figures 4-15, and 4-16).
Figure 4-14. a) Gel permeation chromatograms depicting the trapping of hemiacetalate
end-groups produced via sonication of 4-1 via addition into 2-methylindole (250 equiv)
in THF. b) Proposed mechanism of trapping poly(4,5-dichlorophthalaldehyde) with 2-
methylindole.
11 12 13 14 15 16
GP
C R
efr
acti
ve In
de
x
Retention Time (min)
Elapsed Time (min): 0, 1, 5, 10, 20, 40, 60a)
b)

99
Figure 4-15. Gel permeation chromatograms depicting the trapping of oxocarbenium
end-groups produced via sonication of 4-1 via addition into TBSCl (250 equiv) in THF.
Figure 4-16. GPC traces depicting polymer end group trapping efficiency following
sonication of 4-1 for 60 minutes Key: 4-1, t = 0 (black), 2-methylindole (blue), TBS-Cl
(red), no trapping reagents (gray).
10 11 12 13 14 15 16
GP
C R
efr
acti
ve In
de
x
Retention Time (min)
Elapsed Time (min): 0, 1, 5, 10, 20, 40, 60a)
b)
11 12 13 14 15 16
GP
C R
efr
acti
ve In
de
x
Retention Time (min)

100
In addition to confirming the previously proposed chain scission mechanism of
poly(phthalaldehyde), we also performed experiments to confirm the hypothesized
homolytic cleavage mechanism of poly(benzyl ethers). Figure 4-17 exhibits nearly
identical GPC trace data seen in sonication experiments conducted on polymer 4-2 both
with and without 2-methylindole. The similarity between the two experiments likely rules
out a heterolytic chain scission mechanism.
Figure 4-17. Sonication experiments of polymer 4-2 (84.1 kDa, DP = 288) in the
presence of a) no trapping reagents and b) 2-methylindole. (250 equiv).
4.4.3 Effect of Degree of Polymerization on Rate of Cleavage
Based on these results, we proceeded to focus on the mechanoresponsive
properties of poly(4,5-dichlorophthalaldehyde) due to its unique ability to depolymerize
in the presence of ultrasound sonication. We subsequently investigated the effect that
degree of polymerization has on the rate of chain scission and depolymerization of
polymer 4-1. Three different lengths of 4-1 (82 kDa (DP = 404), 59 kDa (DP = 290), and
12 13 14 15 16
GP
C R
efr
acti
ve In
de
x
Retention Time (min)
Elapsed Time (min): 0, 1, 5, 10, 20, 40, 60a)
12 13 14 15 16
GP
C R
efr
acti
ve In
de
x
Retention Time (min)
b)

101
30 kDa (DP = 148)) were used for sonication experiments (Figure 4-18) and analysis via
GPC and NMR.
Figure 4-18. Gel permeation chromatograms displaying responses of polymer 4-1 (a) DP
= 404, b) DP = 290, c) DP = 148) in the presence of ultrasound sonication.
GPC analysis indicates that the rate of chain cleavage and magnitude of
depolymerization increase with polymer length. The rate of production of 4-4 from
sonication of polymer 4-1 was monitored further by NMR. An internal standard
(dimethyl sulfone) was added to the sonication solution in THF, and aliquots of the
solution were removed, concentrated, and dissolved in CDCl3. Over the course of one
hour, NMR peaks corresponding to 4-4 were integrated relative to the internal standard.
We observed first-order kinetics from the reaction by graphing the natural log of NMR
10 12 14 16
GP
C R
efr
acti
ve In
de
x
Retention Time (min)
10 12 14 16
GP
C R
efr
act
ive
Ind
ex
Retention Time (min)
11 12 13 14 15 16
GP
C R
efra
ctiv
e In
dex
Retention Time (min)
a) b)
c)
Elapsed Time (min): 0, 1, 5, 10, 20, 40, 60

102
peak area over time (Figure 4-19). Slopes calculated from linear regressions of this data
present relative rates of 4-4 production, which increase concomitantly with the degree of
polymerization.
Figure 4-19. Graphs illustrating the production of 4-4 in response to ultrasound
sonication of 4-1. The rate of production of 4-4 increases along with degree of
polymerization (as evidenced by the slope of the linear regression). a) DP = 404, b) DP =
290, c) DP = 148.
4.4.4 Cyclization Hypothesis
In theory, polymer 4-1 will depolymerize to completion following a single stress-
induced cleavage event along the polymer backbone. Under these ideal circumstances,
the GPC trace of each time point during a sonication experiment should fall within the
boundary of the initial polymer distribution (from t = 0). However, the GPC data in
y = 0.0857x - 4.0261
-5
-4
-3
-2
-1
0
0 5 10 15 20
ln(N
MR
Inte
grat
ion)
Sonication Time (min)
y = 0.0532x - 4.1009
-5
-4
-3
-2
-1
0
0 5 10 15 20
ln(N
MR
Inte
grat
ion)
Sonication Time (min)
y = 0.0777x - 4.1418
-5
-4
-3
-2
-1
0
0 5 10 15 20
ln(N
MR
Inte
grat
ion
)
Sonication Time (min)
a) b)
c)

103
Figure 4-18a exhibit formation of new polymer peaks outside the boundary of the initial
polymer distribution, indicating that depolymerization is prematurely terminated to some
extent. While a reduction of RI signal implies the loss of polymer mass, the shift in
retention time during the sonication of 4-1 implies that some polymer chains are being
quenched rather than depolymerizing to completion following bond cleavage.
Since it appears that this phenomenon is most prominent with long polymers, we
hypothesize that oppositely-charged chain termini may be back-biting following multiple
cleavage events along the polymer chain (Figure 4-20). In this case, longer polymer
chains are more likely to undergo multiple cleavage events, which increase the likelihood
that chain termini of opposite charges may subsequently cyclize.
Figure 4-20. Schematic illustration of our hypothesis regarding termination of
depolymerization due to back-biting cyclization of chain termini with opposite charges.

104
4.5 Conclusion and Future Directions
We anticipate that further GPC analysis of sonicated solutions containing polymer
4-1 will reveal discrepancies compared to linear polymers of similar molecular weight.
Cyclic polymers often exhibit different fundamental properties than their linear
analogues, such as glass transition temperature (Tg), hydrodynamic radius (Rh) and
intrinsic viscosity (η).27
In particular, hydrodynamic radius and intrinsic viscosity (a
measurement of a polymer’s a ility to increase the viscosity of a solvent),28
are typically
lower in cyclic polymers due to their more compact architecture.29
Lower measurements
of intrinsic viscosity and hydrodynamic radii of sonicated solutions containing 4-1
compared to standard, unsonicated 4-1 would provide further evidence for cyclization of
polymers as a result of applied mechanical stress.

105
4.6 References
(1) Caruso, M. M.; Davis, D. A.; Shen, Q.; Odom, S. A.; Sottos, N. R.; White, S. R.;
Moore, J. S. Mechanically-Induced Chemical Changes in Polymeric Materials.
Chem. Rev. 2009, 109 (11), 5755–5798.
(2) Li, J.; Nagamani, C.; Moore, J. S. Polymer Mechanochemistry: From Destructive
to Productive. Acc. Chem. Res. 2015, 48 (8), 2181–2190.
(3) Staudinger, H.; Leupold, E. O. Isoprene and Rubber. XVIII. Studies of the
Viscosity of Balata. Ber. Dtsch. Chem. Ges. B 1930, 63, 730–733.
(4) Staudinger, H.; Bondy, H. F. Isoprene and Rubber XIX. The Molecular Size of
Rubber and Balata. Ber. Dtsch. Chem. Ges. B 1930, 63, 734–736.
(5) Hyo, J. Y.; Mirkin, C. A. PCR-like Cascade Reactions in the Context of an
Allosteric Enzyme Mimic. J. Am. Chem. Soc. 2008, 130 (35), 11590–11591.
(6) Berkowski, K. L.; Potisek, S. L.; Hickenboth, C. R.; Moore, J. S. Ultrasound-
Induced Site-Specific Cleavage of Azo-Functionalized Poly(ethylene Glycol).
Macromolecules 2005, 38 (22), 8975–8978.
(7) Davis, D. a; Hamilton, A.; Yang, J.; Cremar, L. D.; Van Gough, D.; Potisek, S. L.;
Ong, M. T.; Braun, P. V; Martínez, T. J.; White, S. R.; Moore, J. S.; Sottos, N. R.
Force-Induced Activation of Covalent Bonds in Mechanoresponsive Polymeric
Materials. Nature 2009, 459 (7243), 68–72.
(8) Chen, Y.; Spiering, J. H.; Karthikeyan, S.; Peters, G. W. M.; Meijer, E. W.;
Sijbesma, R. P. Mechanically Induced Chemiluminescence from Polymers
Incorporating a 1,2-Dioxetane Unit in the Main Chain. Nat. Chem. 2012, 4 (7),
559–562.
(9) Piermattei, A.; Karthikeyan, S.; Sijbesma, R. P. Activating Catalysts with
Mechanical Force. Nat. Chem. 2009, 1 (2), 133–137.

106
(10) Tennyson, A. G.; Wiggins, K. M.; Bielawski, C. W. Mechanical Activation of
Catalysts for C-C Bond Forming and Anionic Polymerization Reactions from a
Single Macromolecular Reagent. J. Am. Chem. Soc. 2010, 132 (46), 16631–16636.
(11) Diesendruck, C. E.; Steinberg, B. D.; Sugai, N.; Silberstein, M. N.; Sottos, N. R.;
White, S. R.; Braun, P. V.; Moore, J. S. Proton-Coupled Mechanochemical
Transduction: A Mechanogenerated Acid. J. Am. Chem. Soc. 2012, 134 (30),
12446–12449.
(12) Lenhardt, J. M.; Ong, M. T.; Choe, R.; Evenhuis, C. R.; Martinez, T. J.; Craig, S.
L. Trapping a Diradical Transition State by Mechanochemical Polymer Extension.
Science 2010, 329, 1057–1060.
(13) Hickenboth, C. R.; Moore, J. S.; White, S. R.; Sottos, N. R.; Baudry, J.; Wilson, S.
R. Biasing Reaction Pathways with Mechanical Force. Nature 2007, 446, 423–427.
(14) Brown, C. L.; Craig, S. L. Molecular Engineering of Mechanophore Activity for
Stress-Responsive Polymeric Materials. Chem. Sci. 2015, 6 (4), 2158–2165.
(15) Diesendruck, C. E.; Peterson, G. I.; Kulik, H. J.; Kaitz, J. a; Mar, B. D.; May, P. a;
White, S. R.; Martínez, T. J.; Boydston, A. J.; Moore, J. S. Mechanically Triggered
Heterolytic Unzipping of a Low-Ceiling-Temperature Polymer. Nat. Chem. 2014,
6 (4), 623–628.
(16) Peterson, G. I.; Boydston, A. J. Kinetic Analysis of Mechanochemical Chain
Scission of Linear Poly(phthalaldehyde). Macromol Rapid Commun 2014, 35 (18),
1611–1614.
(17) Svaneborg, C.; Everaers, R.; Grest, G. S.; Curro, J. G. Connectivity and
Entanglement Stress Contributions in Strained Polymer Networks.
Macromolecules 2008, 41 (13), 4920–4928.
(18) May, P. A.; Munaretto, N. F.; Hamoy, M. B.; Robb, M. J.; Moore, J. S. Is
Molecular Weight or Degree of Polymerization a Better Descriptor of Ultrasound-

107
Induced Mechanochemical Transduction? ACS Macro Lett. 2016, 5 (2), 177–180.
(19) Henglein, V. A. Polymerization of Acrylamide Initiated by Ultrasonic. Makromol.
Chem 1954, 14, 15–39.
(20) Henglein, V. A. The Reaction of 2,2-Diphenyl-1-Picrylhydrazyl with Long-Chain
Free Radicals Produced from Ultrasonic Degradation of Poly(methyl
Methacrylate). Makromol. Chem. 1955, 15, 188–210.
(21) Suslick, K. S.; Price, G. J. Applications of Ultrasound to Materials Chemistry.
Annu. Rev. Mater. Sci. 1999, 29, 295–326.
(22) Sohma, J. Mechanochemistry of Polymers. Prog. Polym. Sci. 1989, 14 (4), 451–
596.
(23) Sakaguchi, M.; Sohma, J. ESR Evidence for Main Chain Scission Produced by
Mechanical Fracture of Polymers at Low Temperature. J. Polym. Sci. 1975, 13 (6),
1233–1245.
(24) Sohma, J.; Sakaguchi, M. ESR Studies on Polymer Radicals Produced by
Mechanical Destruction and Their Reactivity. Adv. Polym. Sci. 1976, 20, 109–158.
(25) Aktah, D.; Frank, I. Breaking Bonds by Mechanical Stress: When Do Electrons
Decide for the Other Side? J. Am. Chem. Soc. 2002, 124 (13), 3402–3406.
(26) Shiraki, T.; Diesendruck, C. E.; Moore, J. S. The Mechanochemical Production of
Phenyl Cations through Heterolytic Bond Scission. Faraday Discuss. 2014, 170
(217), 385–394.
(27) Gagliardi, S.; Arrighi, V.; Ferguson, R.; Dagger, A. C.; Semlyen, J. A.; Higgins, J.
S. On the Difference in Scattering Behavior of Cyclic and Linear Polymers in
Bulk. J. Chem. Phys. 2005, 122 (6), 064904.

108
(28) Lyulin, A. V.; Davies, G. R.; Adolf, D. B. Brownian Dynamics Simulations of
Dendrimers under Shear Flow. Macromolecules 2000, 33 (9), 3294–3304.
(29) Li, G.; Donghui, Z. Cyclic Poly(α-Peptoids) and Their Block Copolymers from N-
Heterocyclic Carbene-Mediated Ring-Opening Polymerizations of N-Substituted
N-Carboxylanhydrides. J. Am. Chem. Soc. 2009, 131 (50), 18072–18074.

109
Chapter 5
Materials, Methods, Experimental Procedures, and Characterization
5.1 Materials.
All reactions were performed in flame-dried glassware under a positive pressure
of argon unless otherwise noted. All reagents used were purchased commercially and
were used as received unless otherwise noted. Air-and moisture-sensitive liquids were
transferred by syringe or stainless steel cannula. Tetrahydrofuran (THF), acetonitrile
(MeCN), diethyl ether (Et2O), toluene (PhMe), dichloromethane (DCM), and N,N-
dimethylformamide (DMF) were purified by the method developed by Pangborn et al.,1
unless noted otherwise. Methanol (MeOH) and was dried over activated 3Å molecular
sieves for 24 h and then distilled from fresh activated 3Å molecular sieves. Pyridine and
N,N-diisopropylethylamine (DIEA) were distilled from ninhydrin, dried over activated
5Å molecular sieves for 24 h, and then redistilled from fresh activated 5Å molecular
sieves. Isopropanol (iPrOH) was distilled from calcium hydride and stored over 3Å
molecular sieves. Deionized water was purified using a Millipore-purification system
(Barnstead EASYpure® II UV/UF). Potassium carbonate was dried at 120 °C at 0.65
Torr for 24 h and stored in a desiccator. Acetyl chloride, ethyl formate, and N-
bromosuccinimide were purified according to published procedures.2 Flash column
chromatography was performed as described by Still et al.,3 employing silica gel (60-Å
pore size, 32–63 µm, standard grade, SiliCycle). Thin layer chromatography was carried
out on SiliCycle silica gel TLC (20 × 20 cm w/h, F-254, 250 µm).

110
5.2 Methods.
Proton nuclear magnetic resonance (1H NMR) spectra and carbon nuclear
magnetic resonance spectra (13
C NMR) were recorded using a Bruker DRX-400 (400
MHz), Bruker AV-360 (360 MHz), Bruker DPX-300 (300 MHz), or Bruker CDPX-300
(300 MHz). Proton chemical shifts are expressed in parts per mission (ppm, δ scale) and
are referenced to chloroform (CDCl3, 7.26 ppm), methanol (CD3OD, 3.31 ppm), dimethyl
sulfoxide ((CD3)2SO, 2.50 ppm), or acetone ((CD3)2CO, 2.05 ppm). Data are represented
in text form as follows: chemical shift, multiplicity (s = singlet, d = doublet, t = triplet, q
= quarter, m = multiplet and/or multiple resonances, br s = broad singlet, dd = doublet of
doublet, ddd = doublet of doublet of doublet, dt = doublet of triplet), integration, and
coupling constant (J, in Hertz). Carbon chemical shifts are expressed in parts per million
(ppm, δ scale) and are referenced to chloroform (CDCl3, 77.16 ppm), methanol (CD3OD,
49.0 ppm), or acetone ((CD3)2CO, 29.84 ppm).
UV/Vis spectroscopic data was recorded using a Beckman Coulter DU 800
spectrometer. LC-MS data was obtained using an Agilent Technologies 1200 Series
HPLE with a UV detector and a 6120 Series quadrupole mass spectrometer equipped
with an atmospheric pressure chemical ionization chamber. GPC analyses were
performed using multiple instruments 1) A Viscotek model 270 Dual Detector with right-
and left-angle light scattering, and a Viscotek T-column (300 × 7.8 mm, CLM3012) and
Agilent Resipore column (300 × 7.5 mm) in series using THF as the mobile phase (flow
rate = 1mL/min). The GPC was calibrated using monodisperse polystyrene standards
from Malvern. 2) an Agilent Technologies 1260 GPC equipped with a Wyatt
Technologies Dawn 8+ light scatterer, a Wyatt Technologies ViscoStar-II viscometer, a

111
Wyatt Technologies Optilab T-rEX refractive index detector, and an Agilent PLbel 10
μm MIXED-BLS column using THF as the mobile phase (flow rate = 1 mL/min, 25 °C).
The GPC was calibrated using monodisperse polystyrene standards from Wyatt
Technologies. Scanning electron microscopy (SEM) images were obtained using a Zeiss
Sigma FESEM, and contact angles were measured using a Ramé-Hart automated
goniometer equipped with a digital camera. Contact angles of H2O droplets (5 µL) on
dried polymer films were analyzed using the software DROPimage Advanced.
Photographs were acquired using a Nikon digital camera (D3100).

112
5.3 Chapter 1: Experimental Procedures and Characterization
Figure 5-1. Synthetic scheme for compound 1-25.
(1-19). Sodium hydroxide (NaOH) (6.35 g, 178.4 mmol, 4.0 equiv) was added to
a stirring solution of 9-oxofluorene-4-carboxylic acid (1-18) 10.0 g, 44.6 mmol, 1 equiv)
in diethylene glycol (90 mL, 0.5 M) was added and continued stirring at room
temperature until homogenous. Hydrazine monohydrate (6.5 mL, 133.7 mmol, 3 equiv)
was then added dropwise, and the mixture was heated to 120 °C for 20 minutes (or until
N2 production was visible). The mixture was then stirred for 20 minutes without further
heating, and then reheated to 120 °C for another 2 h. The mixture was again cooled to
room temperature and poured over 200 mL of ice, then acidified to pH 5 with
concentrated HCl (ca. 30 mL). The precipitated solid was filtered out, and the resulting

113
crude orange solid was dissolved in acetone and filtered again. The filtrate was dried over
MgSO4 and concentrated via rotary evaporation. The resulting crude orange mixture was
purified via flash column chromatography (10% ethyl acetate in hexanes) and dried under
high vacuum to afford compound 1-19 as a white solid (6.93 g, 30.9 mmol, 74%). 1H
NMR (400 MHz, ((CD3)2SO): δ 13.24 (s, 1 H), 8.33 (d, 1 H), 7.77 (d, 1 H), 7.73 (d, 1 H),
7.61 (d, 1 H), 7.41 (m, 3 H), 3.97 (s, 2 H); 13
C NMR (400 MHz, (CDCl3): δ 170.0, 1451,
144.5, 140.0, 139.4, 128.5, 128.1, 127.8, 127.0, 126.7, 125.4, 124.7, 36.9. The NMR data
matches the known spectra for this compound.4
(1-20). 2-methyl-2-propene (40 mL, 463.7 mL, 15 equiv) was condensed in a −78
°C dry ice/acetone bath, then transferred via cannula to a stirred solution of compound 1-
19 (6.5 g, 30.9 mmol, 1 equiv) in 10:1 dioxane-H2SO4 (66 mL) at −15 °C for 72 h under
argon. The reaction was slowly warmed to room temperature, and then vented with a
syringe needle through the septum to release excess 2-methyl-2-propene. The reaction
mixture was then poured over 200 mL of cold 1:1 1M NaOH−Et2O. The organic layer
was removed, and the aqueous layer extracted with Et2O (4 × 75 mL). The organic
fractions were combined, dried over MgSO4 and concentrated via rotary evaporation. The
crude residue was then purified by flash column chromatography (0.5% ethyl acetate in
hexanes) and dried under high vacuum to afford compound 1-20 as a white solid (5.34 g,
25.4 mmol, 65%). 1H NMR (400 MHz, (CDCl3): δ 8.36 (d, 1 H), 7.68 (d, 1 H), 7.59 (d, 1
H), 7.49 (d, 1 H), 7.36 (m, 3 H), 3.85 (s, 2 H), 1.87 (s, 9 H). The NMR data matches the
known spectra for this compound.4
(1-21). Sodium hydride (NaH) (1.3 g, 54.1 mmol, 3 equiv) was transferred to a
sealed flask and dried under vacuum for 30 min. NaH was then suspended in Et2O (40
114
mL) and stirred for 5 min. Compound 1-20 (4.80 g, 18.0 mmol, 1 equiv) was added as a
solution in Et2O (30 mL, total reaction concentration: 0.25 M), followed by freshly
distilled ethyl formate (2.90 mL, 36.0 mmol, 2 equiv). The flask was then sealed and
heated to 60 °C for 6 h. The reaction mixture was then cooled to room temperature and
poured over 100 mL ice. The flask was washed with water and added to the ice slurry,
and the resulting aqueous mixture was extracted with a 60:40 mixture of petroleum ether-
Et2O (100 mL). The aqueous layer was then acidified with conc. acetic acid (AcOH) until
it formed a milky white mixture, and was once again extracted with Et2O (3 × 50 mL).
The combined organic layers were washed with brine (2 × 50 mL) then dried over
MgSO4 and concentrated via rotary evaporation for immediate use in the succeeding
reaction.
(1-22). Sodium borohydride (NaBH4) (654 mg, 17.29 mmol, 1 equiv) was added
portion-wise 2 h apart to a stirred suspension of crude compound 1-21 (5.10 g, 17.29
mmol, 1 equiv) in iPrOH (85 mL, 0.2 M). The reaction was stirred for 6 h at room
temperature, then was diluted with H2O (80 mL) and acidified with concentrated AcOH
to pH 5. The mixture was then extracted with Et2O (3 × 50 mL), dried over MgSO4, and
solvent was removed via rotary evaporation. The crude product was then purified by flash
column chromatography (gradient of 10% ethyl acetate in hexanes increasing to 20 %
ethyl acetate in hexanes) and concentrated on high vacuum to afford compound 1-22 as a
pale yellow solid (4.54 g, 15.39 mmol, 85% over two steps). 1H NMR (400 MHz,
(CDCl3): δ 8.90 (d, 1 H), 7.72 (d, 1 H),7.68 (d, 1 H), 7.61 (d, 1 H), 7.41 (m, 3 H), 4.09 (t,
1 H), 4.03 (d, 2 H), 1.68 (s, 9 H); 13
C NMR (400 MHz, (CDCl3): δ 167.9, 146.1, 145.0,
115
140.1, 139.7, 129.1, 128.9, 127.6, 127.4, 126.3, 125.1, 124.7, 124.3, 81.8, 65.2, 49.8,
28.5, 28.3, 28. The NMR data matches the known spectra for this compound.4
(1-23). 1-piperidinecarbonyl chloride (3.15 mL, 25.1 mmol, 4 equiv) was added
via syringe pump over the course of 48 h to a stirring solution of compound 1-22 (1.86 g,
6.28 mmol, 1 equiv) in chloroform (31 mL, 0.25 M) in a flame-dried Schlenk flask. The
flask was heated to 70 °C for the duration of the reaction, which was stirred for an
additional 12 h after all of the reagent was added. The mixture was then cooled to room
temperature and solvent was removed via rotary evaporation. The crude yellow residue
was then purified by flash column chromatography (20% ethyl acetate in hexanes) and
dried via rotary evaporation to isolate 1-23 as a yellow oil (1.70 g, 4.17 mmol, 67%).
Unreacted 1-22 was also collected. 1H NMR (400 MHz, (CDCl3): δ 8.34 (d, 1 H), 7.72 (d,
1 H), 7.70 (d, 1 H), 7.61 (d, 1 H), 7.42 (m, 3 H), 4.42 (m, 2 H), 4.25 (t, 1 H), 3.43 (br, 4
H), 1.69 (s, 9 H), 1.60 (br, 2 H), 1.52 (br, 4 H); 13
C NMR (400 MHz, (CDCl3): δ 171.1,
167.7, 155.2, 145.6, 144.9, 139.8, 139.6, 128.9, 127.6, 126.2, 126.2, 124.8, 124.6, 81.7,
67.1, 60.3, 47.0, 44.9, 28.5, 28.4, 28.2, 25.6, 24.4, 21.0
(1-24). Trifluoroacetic acid (8 mL, 20% v/v) was slowly added to a stirred
solution of compound 1-23 (1.6 g, 3.72 mmol, 1 equiv) in dichloromethane (32 mL, 0.1
M, 80% v/v) at 0 °C. The mixture was stirred for 6 h as the ice bath slowly warmed to
room temperature. The mixture was then washed with brine (2 × 50 mL), dried over
MgSO4 and solvent was removed via rotary evaporation. The resulting residue was
purified by flash column chromatography (20% ethyl acetate in hexanes) and dried via
rotary evaporation to isolate 1-24 as a white solid (1.15 g, 3.27 mmol, 83%). 1H NMR

116
(400 MHz, (CDCl3): δ 8.57 (d, 1 H), 8.03 (d, 1 H), 7.81 (d, 1 H), 7.63 (d, 1 H) 7.42 (m, 3
H), 4.50 (m, 2 H), 4.27 (t, 1 H), 3.4 (br, 4 H), 1.59 (br, 2 H), 1.51 (br, 4 H).
(1-25). BH3−THF (3.0 mL, 31.3 mmol, 20 equiv) was added in two equal portions
12 h apart to a stirred solution of compound 1-24 in THF (8 mL, 0.2 M) at 0 °C. The
reaction was then stirred for an additional 4 h at room temperature. The mixture was then
concentrated and resulting residue was purified via flash column chromatography (20 %
ethyl acetate in hexanes) to afford 1-25 as a white solid (518 mg, 1.53 mmol, 98%). 1H
NMR (360 MHz, (CDCl3): δ 7.96 (d, 1 H), 7.63 (d, 1 H), 7.57 (d, 1 H) 7.43 (t, 1 H), 7.41
(d, 1 H), 7.36 (t, 1 H), 7.31 (t, 1 H), 5.11 (s, 2 H), 4.38 (t, 2 H), 4.26 (t, 1 H), 3.48 (m, 4
H), 1.60 (br, 2 H), 1.53 (br, 4 H).
Figure 5-2. Synthesis of compound 1-15.
(1-15). Phenyl isocyanate (32 μL, 0.30 mmol, 1 equiv) was added to a stirred
solution of compound 1-25 (100 mg, 0.30 mmol, 1 equiv) in toluene (1.5 mL, 0.2 M).
The mixture was stirred at 100 °C for 12 h, the solvent was removed via rotary
evaporation and the resulting crude residue was purified via flash column
chromatography (gradient of 10% ethyl acetate in hexanes increasing to 25% ethyl

117
acetate in hexanes) to afford compound 1-15 (72 mg, 0.16 mmol, 53%) as a white solid.
1H NMR (360 MHz, CDCl3): δ 7.88 (d, 1 H), 7.65 (t, 2 H), 4.74 (m, 8 H), 7.08 (t, 1 H),
6.70 (s, 1 H), 5.61 (s, 2 H), 4.40 (d, 2 H), 4.29 (t, 1 H), 3.47 (m, 4 H), 1.61 (br,2 H), 1.53
(br, 4 H).
Figure 5-3. Synthetic scheme for compound 1-16.
(1-16). 4,4’-bismethylenediphenylisocyanate (37 mg, 0.15 mmol, 0.5 equiv) was
added to a flame-dried round-bottom flask and dried under high vacuum, then backfilled
with an argon atmosphere. Compound 1-25 (100 mg, 0.30 mmol, 1 equiv) was added as a
solution in toluene (1.5 mL, 0.2 M) and the reaction mixture was heated at 100 °C for 12
h. The crude mixture was then concentrated via rotary evaporation and purified by flash
column chromatography (gradient of 10% ethyl acetate in hexanes increasing to 25%
ethyl acetate in hexanes) to afford compound 1-16 as a white solid (147 mg, 0.16 mmol,
54%). 1H NMR (400 MHz, (CDCl3): δ 7.86 (d ,2 H), 7.61 (t, 4 H), 7.43 (t, 4 H), 7.33 (m,
8 H), 7.10 (d, 4 H), 6.74 (s, 2 H), 5.59 (s, 4 H), 4.39 (d, 4 H), 4.27 (t, 2 H), 3.87 (s, 2 H),
3.46 (m, 4 H), 1.59 (m, 4 H), 1.54 (m, 8 H).

118
Figure 5-4. Synthetic scheme for compound 1-17.
(1-31). 4-Formylbenzoic acid (1-30) (1.56 g, 10.36 mmol, 1 equiv), 2-
hydroxymethyl-1,3-propanediol (330 mg, 3.11, 0.3 equiv), and 4-dimethylaminopyridine
(127 mg, 1.04 mmol, 0.1 equiv) were transferred to a flame-dried flask and dried under
vacuum, then backfilled with an argon atmosphere. The contents were then dissolved in
THF (50 mL, 0.2 M) and cooled to 0 °C. 1 equiv of 1-Ethyl-3-(3-
dimethylaminopropyl)carbodiimide hydrochloride (EDCI∙HCl) (3.0 g, 12.43 mmol, 1.5
equiv) was added and the mixture was slowly warmed to room temperature for 8 h. The
final 0.5 equiv of EDCI∙HCl was then added, and the mixture was stirred at room
temperature for an additional 8 h. The mixture was then concentrated, diluted in ethyl
acetate, and washed with sat. NaHCO3 (2 × 50 mL) and brine (3 × 30 mL), then dried
over MgSO4 and concentrated via rotary evaporation to afford compound 1-30 as a white
solid (1.38 g, 2.75 mmol, 88%). 1H NMR (400 MHz, (CDCl3): δ 10.18 (s, 3 H), 8.20 (d, 6
H), 7.96 (d, 6 H), 4.67 (d, 6 H), 2.95 (m, 1 H).

119
(1-32). To a stirred solution of compound 1-31 (1.00 g, 1.99 mmol, 1 equiv) in 1:2
THF/DCM (30 mL) was added sodium chlorite (3.60 g, 39.8 mmol, 20 equiv) and
monosodium phosphate (5.50 g, 39.8 mmol, 20 equiv), each as a separate solution in H2O
(2 × 10 mL) at room temperature. After stirring for 15 min, 2-methyl-2-butene (4.3 mL,
39.8 mmol, 20 equiv) was added and the reaction stirred for an additional 4 h. The
reaction mixture was then concentrated via rotary evaporation, then diluted in H2O (50
mL) and the solid was filtered out. The solid was then suspended in THF and filtered
once more, then concentrated via rotary evaporation and dried on high vacuum overnight
to afford compound 1-32 as a white solid (804 mg, 1.46 mmol, 73%). The solid was too
insoluble in all solvents to permit NMR analysis.
(1-33). To a suspension of compound 1-32 (400 mg, 0.73 mmol, 1 equiv) in DMF
(7 mL, 0.1 M) was added DIEA (2.50 mL, 14.54 mmol, 20 equiv) and stirred at room
temperature for 3 h. Diphenylphosphoryl azide (DPPA) (1.25 mL, 5.82 mmol, 8 equiv)
was added and the mixture, which was then stirred for 12 h at room temperature. The
mixture was concentrated via rotary evaporation and purified by flash column
chromatography (10% ethyl acetate in hexanes increasing to 20% ethyl acetate in
hexanes) to afford compound 1-33 as a white solid (143 mg, 0.23 mmol, 31%). 1H NMR
(400 MHz, (CDCl3): δ 8.08 (m, 12 H), 4.66 (d, 6 H), 2.93 (m, 1 H).
(1-17). Compound 1-32 (60 mg, .096 mmol, 0.2 equiv) was transferred to a flame-
dried flask and backfilled with an argon atmosphere. Compound 1-25 (162 mg, 0.48
mmol, 1 equiv) was added as a solution in PhMe (1 mL, 0.5M) and stirred at 100 °C for
16 h. The mixture was concentrated and purified via flash chromatography (10% ethyl
acetate in hexanes increasing to 40% ethyl acetate in hexanes) to afford compound 1-17

120
as a white solid (88 mg, .056 mmol, 59%). 1H NMR (360 MHz, (CDCl3): δ 7.94 (d, 6 H),
7.81 (d, 3 H), 7.57 (t, 6 H), 7.44-7.23 (m, 18 H), 5.54 (d, 6 H), 4.54 (d, 6 H), 4.34 (d, 6
H), 4.20 (t, 3 H), 3.43 (br, 12 H), 2.80 (m, 1 H), 1.53 (br, 20 H).
Isolation of Intermediates 1-26, 1-27, 1-29
(1-26, 1-27). A 100 mM stock solution of piperidine (19.8 μL) in THF (2.0 mL,
100 mM) was prepared and 86 μL of this solution (.0086 mmol, 0.1 equiv) was added to
a stirred solution of 1-17 (135 mg, 0.086 mmol, 1 equiv) in THF (770 μL, 110 mM). The
reaction was monitored by TLC, and when an appreciable amount of 1-26 and 1-27 had
formed (~2−3 h), the reaction mixture was concentrated via rotary evaporation. The
intermediates 1-26 and 1-27 were then separated using flash column chromatography
(gradient of 10% ethyl acetate in hexanes increasing to 40% ethyl acetate in hexanes).
Unreacted 1-17 was also collected for use in further isolation reactions.
(1-29). To a stirred solution of 1-16 (196 mg, 0.212 mmol, 1 equiv) in THF (2.1
mL, 100 mM) was added piperidine (2.1 μL, .021 mmol, 0.1 equiv). The reaction was
monitored by TLC, and when an appreciable amount of 1-29 had formed (~5−6 h), the
reaction mixture was concentrated via rotary evaporation. 1-29 was then separated using
flash column chromatography (gradient of 10% ethyl acetate in hexanes increasing to
50% ethyl acetate in hexanes). Unreacted 1-16 was also collected for use in further
isolation reactions.

121
Experimental procedure for studying the reaction mechanisms via LCMS
(1-16). An internal standard stock solution of naphthalene (12.8 mg) in THF (2
mL) was freshly prepared and 146 μL (.0081 mmol, 0.5 equiv) of the solution was added
to 1-16 (15 mg, .0162 mmol, 1 equiv). A stock solution of piperidine (19.8 μL) in THF
(2.0 mL, 100 mM) was freshly prepared, and 16 μL (.00162 mmol, 0.1 equiv) was added
to the solution of 1-16 and naphthalene (for a final concentration of 100 mM 1-16). Every
60 minutes, 2 μL of the solution was removed and diluted in 250 μL THF and injected
into the LCMS. Solution phase: 75% MeCN, 25 % H2O, flow rate: 0.6 mL/min, column:
diphenyl.
(1-17). An internal standard stock solution of naphthalene (12.8 mg) in THF (2
mL) was freshly prepared and 126 μL (.0081 mmol, 0.5 equiv) of the solution was added
to 1-17 (22 mg, .014 mmol, 1 equiv). A stock solution of piperidine (19.8 μL) in THF
(2.0 mL, 100 mM) was freshly prepared, and 14 μL (.0014 mmol, 0.1 equiv) was added
to the solution of 1-17 and naphthalene (for a final concentration of 100 mM 1-17). Every
30 minutes, 2 μL of the solution was removed and diluted in 250 μL THF and injected
into the LCMS. Solution phase: 75% MeCN, 25 % H2O, flow rate: 0.6 mL/min, column:
diphenyl.
**Each peak corresponding reaction product was then integrated against the
internal standard (naphthalene) and graphed as a function of time to demonstrate the
relative amount of each intermediate in the reaction at a given time.

122
Experimental procedure for measuring production of dibenzofulvene via UV/Vis
(1-15). A solution of piperidine (19.8 μL) in THF (2.0 mL) was freshly prepared
and 33 μL (.0033 mmol, 0.1 equiv) were added to a stirred solution of 1-15 (15 mg, .033
mmol, 1 equiv) in THF (295 μL, 110 mM) for a final 1-15 concentration of 100 mM. At
60 min intervals, a 1 μL aliquot was removed and diluted in 1 mL THF. The absorbance
at 310 nm was monitored continuously over time. The reactions were run in triplicate.
(1-16). A solution of piperidine (19.8 μL) in THF (2.0 mL) was freshly prepared
and 19.5 μL (.0020 mmol, 0.1 equiv) were added to a stirred solution of 1-16 (18 mg,
.020 mmol, 1 equiv) in THF (176 μL, 110 mM) for a final 1-16 concentration of 100
mM. At 60 min intervals, a 1 μL aliquot was removed and diluted in 1 mL THF. The
absorbance at 310 nm was monitored continuously over time. The reactions were run in
triplicate.
(1-17). A solution of piperidine (19.8 μL) in THF (2.0 mL) was freshly prepared
and 14 μL (.0033 mmol, 0.1 equiv) were added to a stirred solution of 1-17 (22 mg, .014
mmol, 1 equiv) in THF (127 μL, 110 mM) for a final 1-17 concentration of 100 mM. At
60 min intervals, a 1 μL aliquot was removed and diluted in 1 mL THF. The absorbance
at 310 nm was monitored continuously over time. The reactions were run in triplicate.

123
5.4 Chapter 2: Experimental Procedures and Characterization
Figure 5-5. Synthetic scheme for compound 2-23.
(2-19). To a stirred solution of 5-hydroxymethyl-2-furfural (2-18) (1.0 g, 7.93
mmol, 1 equiv) in CHCl3 (40 mL, 0.2 M) at 0 °C was added bromotrimethylsilane (1.57
mL, 11.9 mmol, 1.5 equiv) and slowly warmed to room temperature over 2 h. The
solution was then diluted with DCM (50 mL), washed with H2O (1 × 50 mL) and brine (1
× 50 mL), dried over MgSO4 and the solvent removed via rotary evaporation. The
resulting crude residue was purified using flash column chromatography (gradient of
10% ethyl acetate in hexanes increasing to 20% ethyl acetate in hexanes) to afford 2-19
as a viscous orange liquid (1.33 g, 7.04 mmol, 89%). 1H NMR (400 MHz, (CDCl3): δ 9.56
(s, 1 H), 7.16 (d, 1 H), 6.56 (d, 1 H), 4.45 (s, 2 H).
(2-20). Potassium carbonate (K2CO3) (1.90 g, 13.76 mmol, 2 equiv) and phenol
(971 mg, 10.32 mmol, 1.5 equiv) were added to a stirred solution of crude compound 2-
21 (1.30 g, 6.88 mmol, 1 equiv) in DMF (34 mL, 0.2 M). The mixture was stirred for 12

124
hours at 50 °C, then cooled to room temperature and concentrated via rotary evaporation.
The crude mixture was then diluted in ethyl acetate (50 mL) and washed with H2O (50
mL). The organic layer was washed with 1 M NaOH (3 × 50 mL) and brine (2 × 50 mL),
dried over MgSO4 and concentrated. The crude material was then purified via flash
column chromatography (gradient of 10% ethyl acetate in hexanes increasing to 20%
ethyl acetate in hexanes) to afford compound 2-20 (1.07 g, 5.29 mmol, 77% over two
steps). 1H NMR (400 MHz, (CDCl3): δ 9.62 (s, 1 H), 7.32 (t, 2 H), 7.22 (d, 1 H), 6.99 (t, 1
H), 6.96 (d, 2 H), 6.61 (d, 2 H), 5.08 (s, 2 H).
(2-21). NaClO2 (3.83 g, 42.33 mmol, 8 equiv) and NaH2PO4∙H2O (5.84 g, 42.33
mmol, 8 equiv) as a solution in H2O (26 mL, 0.2 M) were added to a stirred solution of
compound 2-20 (1.07 g, 5.29 mmol, 1 equiv) in acetone (26 mL, 0.2 M). 2-methyl-2-
butene (4.48 mL, 42.33 mmol, 8 equiv) was added dropwise, and the resulting mixture
was stirred vigorously for 2 h at room temperature. The reaction mixture was then diluted
with ethyl acetate (30 mL) and washed with 1 M HCl (1 × 30 mL), brine (2 × 30 mL),
saturated sodium thiosulfate (1 × 30 mL), and brine (1 × 30 mL). The resulting organic
layer was then dried over MgSO4 and concentrated via rotary evaporation to afford
compound 2-21 as a white solid (1.10 g, 5.04 mmol, 96%). 1H NMR (400 MHz,
(CD3)2CO): δ 11.18 (s, 1 H), 7.32 (t, 2 H), 7.22 (d, 1 H), 7.04 (d, 2 H), 6.96 (s, 1 H), 6.71
(d, 1 H), 5.14 (s, 2 H).
(2-22). Oxalyl chloride (400 μL, 4.77 mmol, 2 equiv) was added dropwise to a
stirred solution of compound 2-21 (520 mg, 2.38 mmol, 1 equiv) in DCM (24 mL, 0.1 M)
and catalytic DMF (100 μL) at 0 °C. The resulting mixture was stirred at 0 °C for 30 min
and then warmed to room temperature. The solvent was removed via rotary evaporation

125
and then dried further on high vacuum for 15 min. The crude mixture was then diluted in
acetone (12 mL, 0.2 M) and cooled to 0 °C. Sodium azide (465 mg, 2.42 mmol, 3 equiv)
was added as a solution in H2O (12 mL, 0.2 M), and the resulting mixture was stirred at 0
°C slowly warming to room temperature over 2 h. It was then diluted in ethyl acetate (20
mL), and the organic layer removed. The aqueous layer was extracted with ethyl acetate
(3 × 20 mL), the combined organic fractions were dried over MgSO4 and concentrated
via rotary evaporation. The crude residue was purified via flash column chromatography
(20% ethyl acetate in hexanes) to afford compound 2-22 as a pale tan solid (553 mg, 2.27
mmol, 95%). 1H NMR (400 MHz, (CDCl3): δ 7.32 (t, 2 H), 7.25 (d, 1 H), 7.00 (t, 1 H),
6.96 (d, 2 H), 6.56 (d, 1 H), 5.08 (s, 2 H).
(2-23). Compound 2-22 (100 mg , 0.411 mmol, 1 equiv) and 9-fluorenemethanol
(81 mg, 0.411 mmol, 1 equiv) were dried under vacuum, backfilled with an argon
atmosphere, and then dissolved in toluene (3.0 mL, 0.15 M). The solution was heated for
6 h at 90 °C, cooled to room temperature and the solvent removed via rotary evaporation.
The resulting crude residue was purified via flash column chromatography (gradient of
5% ethyl acetate in hexanes increasing to 20% ethyl acetate in hexanes) to afford
compound 2-23 as an off-white solid (76 mg, 0.185 mmol, 45%).1H NMR (400 MHz,
(CDCl3): δ 7.82 (d, 2 H), 7.63 (d, 1 H), 7.45 (t, 2 H), 7.31 (m, 5 H), 6.98 (m, 3 H), 6.42
(d, 1 H), 6.11 (br, 1 H), 4.92 (s, 2 H), 4.53 (d, 2 H), 4.30 (t, 1 H).
(2-24). Compound 2-23 (100 mg , 0.411 mmol, 1 equiv) and allyl alcohol (42 μL,
0.617 mmol, 1.5 equiv) were dried under vacuum, backfilled with an argon atmosphere,
and then dissolved in toluene (3.0 mL, 0.15 M). The solution was heated for 6 h at 90 °C,

126
cooled to room temperature and the solvent removed via rotary evaporation. The
resulting crude residue was purified via flash column chromatography (gradient of 5%
ethyl acetate in hexanes increasing to 10% ethyl acetate in hexanes) to afford compound
2-24 as an pale yellow solid (31 mg, 0.114 mmol, 27%).1H NMR (400 MHz, (CDCl3): δ
7.31 (m, 3 H), 6.97 (m, 3 H), 6.40 (d, 1 H), 6.10 (br, 1 H), 5.96 (m, 1 H), 5.33 (dd, 2 H),
4.91 (s, 2 H), 4.68 (d, 2 H).
Figure 5-6. Synthetic scheme for monomer 2-33.
(2-30). To a stirred solution of 5-hydroxymethyl-furan-2-carboxylic acid (2-29)
(1.0 g, 7.04 mmol, 1 equiv) in DMF (40 mL) at 0 °C was added pyridinium dichromate
(10.53 g, 28.15 mmol, 4 equiv) as a solution in cold DMF (30 mL). The solution was then
stirred at 0 °C for 7 h. The reaction mixture was diluted in Et2O and the solid precipitate
filtered out through Celite. The resulting crude mixture was then concentrated via rotary
evaporation and purified using flash column chromatography (gradient of 50% ethyl
acetate in hexanes increasing to 100% ethyl acetate in hexanes) to afford compound 2-30

127
as a yellow oil (710 mg, 5.07 mmol, 72%). 1H NMR (300 MHz, (MeOD): δ 9.67 (s, 1 H),
7.38 (d, 1 H), 7.10 (d, 1 H).
(2-31). Oxalyl chloride (850 μL, 10.13 mmol, 2 equiv) was added dropwise to a
stirred solution of compound 2-30 (710 mg, 5.07 mmol, 1 equiv) in DCM (35.0 mL, 0.15
M) and catalytic DMF (50 μL) at 0 °C. The mixture was stirred at 0 °C for 30 min and
then warmed to room temperature. The solvent was removed via rotary evaporation, and
then dried further on high vacuum for 15 min. The crude mixture was then diluted in
acetone (18.0 mL, 0.3 M) and cooled to 0 °C. Sodium azide (990 mg, 15.21 mmol, 3
equiv) was added as a solution in H2O (18.0 mL, 0.3 M), and the resulting mixture was
stirred at 0 °C for 1 h. It was then warmed to room temperature, diluted in ethyl acetate
(30 mL), and the organic layer removed. The aqueous layer was extracted with ethyl
acetate (3 × 30 mL), the combined organic fractions were dried over MgSO4 and
concentrated via rotary evaporation. The crude residue was purified via flash column
chromatography (20% ethyl acetate in hexanes) to afford compound 2-31 as a pale tan
solid (448 mg, 2.71 mmol, 54%). 1H NMR (300 MHz, (CDCl3): δ 9.83 (s, 1 H), 7.34 (d, 1
H), 7.29 (d, 1 H).
(2-32). Compound 2-31 (430 mg, 2.60 mmol, 1 equiv) and phenol (730 mg, 7.80
mmol, 3 equiv) were dried under high vacuum and backfilled with an argon atmosphere,
then dissolved in toluene (26 mL, 0.1 M). The solution was stirred at 90 °C for 10 h,
cooled to room temperature and concentrated via rotary evaporation. The crude residue
was purified using flash column chromatography (50% Et2O in hexanes) to afford
compound 2-32 as a pale yellow oil (380 mg, 1.64 mmol, 63%). 1H NMR (360 MHz,
128
(CDCl3): δ 9.36 (s, 1 H), 9.22 (br, 1 H), 7.44 (t, 2 H), 7.38 (s, 1 H), 7.30 (t, 1 H) 7.22 (d,
2 H), 6.37 (s, 1 H).
(2-33). Sodium borohydride (183 mg, 4.84 mmol, 4 equiv) and acetic acid (830
μL, 14.52 mmol, 12 equiv) were suspended in benzene (20 mL, 0.05 M) and heated to 90
°C for 15 min. Compound 2-32 (280 mg, 1.21 mmol, 1 equiv) was added and stirred at 90
°C for 30 min. The mixture was then cooled to room temperature, diluted in H2O (40
mL), and extracted with ethyl acetate (3 × 20 mL). The combined organic layers were
dried over MgSO4 and concentrated via rotary evaporation. The crude product was
purified via flash column chromatography (gradient of 10% ethyl acetate in hexanes
increasing to 20% ethyl acetate in hexanes) to afford compound 2-33 (40 mg, 0.172
mmol, 14%). 1H NMR (360 MHz, (CDCl3): δ 7.39 (t, 2 H), 7.26 t, 1 H), 7.19, d 2 H), 6.30
(d, 1 H), 6.13 (s, 1 H), 4.55 (s, 2 H).

129
Figure 5-7. Synthetic scheme for compound 2-39.
(2-35). NaClO2 (11.47 g, 126.8 mmol, 8 equiv) and NaH2PO4∙H2O (17.50 g,
126.8 mmol, 8 equiv) as a solution in H2O (80 mL, 0.2 M) were added to a stirred
solution of 5-methylthiophene-2-carboxaldehyde (2-34) (2.00 g, 15.85 mmol, 1 equiv)
and 2-methyl-2-butene (13.40 mL, 126.8 mmol, 8 equiv) in acetone (80 mL, 0.2 M). The
resulting mixture was stirred vigorously for 3 h at room temperature. The reaction
mixture was then diluted with ethyl acetate (50 mL) and washed with 1 M HCl (1 × 30
mL), brine (2 × 30 mL), saturated sodium thiosulfate (1 × 30 mL), and brine (1 × 30 mL).
The resulting organic layer was then dried over MgSO4 and concentrated via rotary
evaporation. The resulting solid was purified via flash column chromatography (gradient
of 5% ethyl acetate in hexanes increasing to 40% ethyl acetate in hexanes) to afford
compound 2-35 as a yellow-white solid (2.21 g, 15.54 mmol, 99%). 1H NMR (400 MHz,
(CDCl3): δ 7.71 (d, 1 H), 6.81 (d, 1 H), 2.56 (s, 3 H).

130
(2-36). Benzoyl peroxide (300 mg, 1.24 mmol, 0.2 equiv) was added to a stirred
solution of compound 2-35 (881 mg, 6.20 mmol, 1 equiv) in carbon tetrachloride (30 mL,
0.2 M) and the resulting suspension stirred for 10 min at room temperature. N-
bromosuccinimide (1.65 g, 9.29 mmol, 1.5 equiv) was then added; the mixture was
refluxed for 3 h, and then cooled to room temperature. The reaction mixture was filtered
through Celite and washed with DCM. The solution was concentrated via rotary
evaporation and the resulting residue was purified via flash column chromatography
(gradient of 5% ethyl acetate in hexanes increasing to 40% ethyl acetate in hexanes) to
afford compound 2-37 as a pale yellow solid (877 mg, 3.97 mmol, 64%). 1H NMR (300
MHz, (CD3)2CO): δ 7.02 (d, 1 H), 6.66 (d, 1 H), 4.33 (s, 2 H).
(2-37). Potassium carbonate (K2CO3) (2.33 g, 16.87 mmol, 10 equiv) and phenol
(1.59 g, 16.87 mmol, 10 equiv) were suspended in DMF (8.5 mL, 0.2 M) and stirred at
room temperature for 10 min. Compound 2-36 (373 mg, 1.69 mmol, 1 equiv) was then
added to the suspension as a solution in DMF (8.5 mL, 0.2 M). The mixture was stirred
for 12 hours at 50 °C and then cooled to room temperature. The crude mixture was then
diluted in ethyl acetate (50 mL), washed with sat. NH4Cl (2 × 50 mL) and brine (2 × 50
mL), and then dried over MgSO4 and the solvent was removed via rotary evaporation.
The crude material was then purified via flash column chromatography (gradient of 5%
ethyl acetate in hexanes increasing to 80% ethyl acetate in hexanes) to afford compound
2-37 (224 mg, 0.96 mmol, 57%). 1H NMR (400 MHz, (CDCl3): δ 7.78 (d, 1 H), 7.31 (t, 2
H), 7.11 (t, 1 H), 6.98 (m, 3 H), 5.25 (s, 2 H).
(2-38). Oxalyl chloride (115 μL, 1.37 mmol, 2 equiv) was added dropwise to a
stirred solution of compound 2-37 (161 mg, 0.687 mmol, 1 equiv) in DCM (7 mL, 0.1 M)

131
and catalytic DMF (30 μL) at 0 °C. The mixture was stirred at 0 °C for 30 min and then
warmed to room temperature. The solvent was removed via rotary evaporation, and then
dried further on high vacuum for 15 min. The crude mixture was then diluted in acetone
(3.5 mL, 0.2 M) and cooled to 0 °C. Sodium azide (134 mg, 2.06 mmol, 3 equiv) was
added as a solution in H2O (3.5 mL, 0.2 M), and the resulting mixture was stirred at 0 °C
for 1 h. It was then warmed to room temperature, diluted in ethyl acetate (30 mL), and the
organic layer removed. The aqueous layer was extracted with ethyl acetate (3 × 30 mL),
the combined organic fractions were dried over MgSO4 and concentrated via rotary
evaporation. The crude residue was purified by flash column chromatography (gradient
of 5% ethyl acetate in hexanes) to afford compound 2-39 as a white solid (68 mg, 0.29
mmol, 38%). 1H NMR (400 MHz, (CDCl3): δ 7.75 (d, 1 H), 7.30 (t, 2 H), 7.11 (d, 1 H),
7.01 (t, 1 H), 6.99 (d, 2 H), 5.23 (s, 2 H).
(2-39). Compound 2-38 (40 mg , 0.154 mmol, 1 equiv) and 9-fluorenemethanol
(Fmoc-OH) (30 mg, 0.154 mmol, 1 equiv) were dried under vacuum, backfilled with an
argon atmosphere, and dissolved in toluene (1.5 mL, 0.1 M). The solution was heated for
6 h at 100 °C, cooled to room temperature and the solvent removed via rotary
evaporation. The resulting residue was purified via flash column chromatography
(gradient of 5% ethyl acetate in hexanes increasing to 20% ethyl acetate in hexanes) to
afford compound 2-39 as a white solid (30 mg, 0.116 mmol, 45%). 1H NMR (400 MHz,
(CDCl3): δ 7.79 (d, 2 H), 7.60 (d, 2 H), 7.41 (t, 2 H), 7.32 (m, 4 H), 7.11 (br, 1 H), 6.98
(m, 3 H), 6.83 (d, 1 H), 6.47 (d, 1 H), 5.11 (s, 2 H), 4.58 (d, 2 H), 4.27 (t, 1 H).

132
(2-40). Compound 2-38 (50 mg , 0.193 mmol, 1 equiv) and was dried under
vacuum, backfilled with an argon atmosphere, and dissolved in toluene (1.5 mL, 0.1 M).
n-butanol (35 μL, 0.579 mmol, 3 equiv) was added, and the solution was heated for 4 h at
100 °C, cooled to room temperature and the solvent removed via rotary evaporation. The
resulting residue was purified via flash column chromatography (gradient of 2% ethyl
acetate in hexanes increasing to 10% ethyl acetate in hexanes) to afford compound 2-40
as a white solid (39 mg, 0.128 mmol, 66%). 1H NMR (400 MHz, (CDCl3): δ 7.30 (m, 3
H), 6.98 (d, 2 H), 6.82 (d, 2 H), 6.45 (d, 2 H), 5.11 (s, 2 H), 4.19 (t, 2 H), 1.65 (t, 2 H),
1.56 (s, 1 H), 1.39 (t, 2 H), 0.94 (t, 2 H).
Figure 5-8. Synthetic scheme for monomer 2-47.
(2-35). NaClO2 (43.0 g, 475.5 mmol, 6 equiv) and NaH2PO4∙H2O (65.6 g, 475.5
mmol, 6 equiv) were added as a solution in H2O (300 mL, 0.25 M) to a stirred solution of

133
5-methylthiophene-2-carboxaldehyde (2-34) (10.0 g, 79.25 mmol, 1 equiv) in acetone
(200 mL, 0.4 M). 2-methyl-2-butene (50.4 mL, 475.5 mmol, 6 equiv) was added
dropwise, and the resulting mixture was stirred vigorously for 2 h. The reaction mixture
was then diluted with ethyl acetate (150 mL) and washed with 1 M HCl (1 × 75 mL),
brine (2 × 75 mL), saturated sodium thiosulfate (1 × 75 mL), and brine (1 × 75 mL). The
resulting organic layer was then dried over MgSO4 and concentrated via rotary
evaporation to afford compound 2-35 as a white solid (11.0 g, 77.37 mmol, 98%). 1H
NMR (300 MHz, (CDCl3): δ 7.70 (d, 1 H), 6.80 (d, 1 H), 2.55 (s, 3 H).
(2-41). Sulfuric acid (H2SO4) (410 μL, 7.74 mmol, 0.1 equiv) was added to a
stirred solution of compound 2-35 (11.0 g, 77.36 mmol, 1 equiv) in MeOH (230 mL, 0.4
M) and the solution was refluxed for 16 h. The solvent was removed via rotary
evaporation, the resulting residue was dissolved in ethyl acetate (100 mL), washed with
H2O (1 × 50 mL) and brine (2 × 50 mL), dried over MgSO4 and concentrated. The crude
product was purified via flash column chromatography (gradient of 1% ethyl acetate in
hexanes increasing to 2% ethyl acetate in hexanes) to afford compound 2-41 (5.1 g, 32.6
mmol, 42%). 1H NMR (360 MHz, (CDCl3): δ 7.6 (d, 1 H), 6.75 (d, 1 H), 3.83 (s, 3 H),
2.50 (s, 3 H).
(2-42). N-bromosuccinimide (3.36 g, 18.9 mmol, 1.3 equiv) was added to a stirred
solution of compound 2-41 (2.27 g, 14.5 mmol, 1 equiv) in carbon tetrachloride (73 mL,
0.2 M) and the resulting suspension stirred for 10 min at room temperature. Benzoyl
peroxide (704 mg, 2.91 mmol, 0.2 equiv) was then added, the mixture was refluxed for
18 h, and then cooled to room temperature. The reaction mixture was filtered through
Celite, and washed with DCM. The solution was concentrated via rotary evaporation and

134
the resulting residue was purified via flash column chromatography (10% ethyl acetate in
hexanes) to afford compound 2-42 as a pale yellow oil (3.06 g, 13.0 mmol, 90%). 1H
NMR (300 MHz, (CDCl3): δ 7.63 (d, 1 H), 7.09 (d, 1 H), 4.66 (s, 2 H), 3.87 (s, 3 H).
(2-43). Silver (I) p-toluenesulfonate (10.3 g, 37.0 mmol, 1.1 equiv) was added to a
stirred solution of compound 2-42 (7.9 g, 33.6 mmol, 1 equiv) in MeCN (168 mL, 0.2 M)
at 0 °C. The resulting mixture was slowly warmed to room temperature and stirred for 4
h. The mixture was then poured over H2O (200 mL) and extracted with ethyl acetate (3 ×
100 mL), dried over MgSO4 and concentrated via rotary evaporation. The crude residue
was then dissolved in DMSO (70 mL, 0.5 M), NaHCO3 (14.1 g, 168.0 mmol, 5 equiv)
was added, and the suspension was stirred at 100 °C for 1 h. The reaction mixture was
then cooled to room temperature, concentrated via rotary evaporation and purified via
flash column chromatography (gradient of 10% ethyl acetate in hexanes increasing to
20% ethyl acetate in hexanes) to afford 2-43 as a pale yellow oil (2.24 g 13.1 mmol,
39%). 1H NMR (360 MHz, (CDCl3): δ 9.97 (s, 1 H), 7.84 (d, 1 H), 7.75 (d, 1 H), 3.94 (s,
3 H).
(2-44). A 1 M solution of LiOH in H2O (39 mL, 3 equiv) was added to a stirring
solution of compound 2-43 (2.24 g, 13.1 mmol, 1 equiv) in 8:1 THF−MeOH (90 mL,
0.15 M) at 0 °C. The solution was stirred at 0 °C for 4 h then warmed to room
temperature. The solvent was removed via rotary evaporation, diluted in ethyl acetate (75
mL), washed with 1 M HCl (2 × 30 mL) and brine (1 × 30 mL), dried over MgSO4 and
concentrated via rotary evaporation. The crude mixture was purified via flash column
chromatography (gradient of 25% ethyl acetate in hexanes increasing to 50% ethyl

135
acetate in hexanes) to afford compound 2-44 as an off-white solid (1.87 g, 12.0 mmol,
92%). 1H NMR (300 MHz, (CDCl3): δ 10.14 (s, 1 H), 8.14 (d, 1 H), 7.95 (d, 1 H).
(2-45). DPPA (830 μL, 3.84 mmol, 1.2 equiv) was added to a stirring solution of
compound 2-44 (500 mg, 3.20 mmol, 1 equiv) and (DIEA) (830 μL, 4.80 mmol, 1.5
equiv). The solution was heated to 50 °C for 3 h and allowed to cool to room temperature.
The solvent was removed by rotary evaporation and the residue was purified via flash
column chromatography (gradient of 10% ethyl acetate in hexanes increasing to 25%
ethyl acetate in hexanes) to afford compound 2-45 as a white solid (450 mg, 2.47 mmol,
77%). 1H NMR (300 MHz, (CDCl3): δ 9.98 (s, 1 H), 7.88 (d, 1 H), 7.75 (d, 1 H).
(2-46). Compound 2-45 (600 mg, 3.29 mmol, 1 equiv) was dissolved in toluene
(16 mL, 0.2 M) and heated to 100 °C for 30 min. Phenol (1.24 g, 13.2 mmol, 4 equiv)
was added as a solution in toluene (2 mL), and the resulting mixture was heated to 100 °C
for 4 h. The mixture was then cooled to room temperature, the solvent was removed via
rotary evaporation and the resulting residue was purified by flash column
chromatography (gradient of 10% ethyl acetate in hexanes increasing to 25% ethyl
acetate in hexanes) to afford compound 2-46 as an oil (497 mg, 2.01 mmol, 61%). 1H
NMR (300 MHz, (CDCl3): δ 9.80 (s, 1 H), 7.79 (br, 1 H), 7.59 (d, a H), 7.42 (t, 2 H), 7.29
(t, 1 H), 7.22 (d, 2 H), 6.79 (d, 1 H).
(2-47). Sodium borohydride (NaBH4) (80 mg, 2.10 mmol, 4 equiv) was dried
under high vacuum in a flame-dried flask, then backfilled with an argon atmosphere.
NaBH4 was suspended in benzene (10 mL, 0.05 M), then acetic acid (360 μL, 6.31 mmol,
12 equiv) was added and the reaction mixture was heated to 90 °C for 15 min. Compound

136
2-46 (130 mg, 0.526 mmol, 1 equiv) was added and stirred at 90 °C for 10 min, and then
the mixture was then cooled to room temperature. The solution was diluted with ethyl
acetate and poured over cold H2O (30 mL). The organic layer was washed with brine (3 ×
20 mL), dried over MgSO4 and concentrated via rotary evaporation. The crude product
was purified via flash column chromatography (gradient of 10% acetone in benzene
increasing to 25% acetone in benzene) to afford compound 2-47 (40 mg, 0.172 mmol,
14%). 1H NMR (360 MHz, (CDCl3): δ 7.34 (t, 2 H and br, 1 H), 7.25 (t, 1 H), 7.21 (d, 2
H), 6.78 (d, 1 H), 6.58 (d, 1 H), 4.74 (s, 2 H).
Procedures for the NMR Analysis of 2-23, 2-24, and 2-39:
Compound 2-23 (5 mg, 0.012 mmol, 1 equiv) was dissolved in CDCl3 (486 μL,
0.025M), and piperidine (1.2 μL, 0.012 mmol, 1 equiv) was added. The reaction was
monitored by integrating the furan benzylic peak (4.92 ppm) respect to tetramethylsilane
(TMS) (0.00 ppm, integrated to 1.00).
For the control study, compound 2-23 (5 mg, 0.012 mmol, 1 equiv) was dissolved
in CDCl3 (486 μL, 0.025M) and the benzylic peak was monitored with respect to TMS.
Compound 2-24 (5 mg, 0.018 mmol, 1 equiv) was dissolved in CDCl3 (486 μL,
0.025M), and piperidine (1.8 μL, 0.018 mmol, 1 equiv) was added. The reaction was
monitored by integrating the furan benzylic peak (4.91 ppm) respect to tetramethylsilane
(0.00 ppm, integrated to 1.00).
Compound 2-39 (4.5 mg, 0.011 mmol, 1 equiv) was dissolved in CDCl3 (486 μL,
0.025M), and piperidine (1.1 μL, 0.011 mmol, 1 equiv) was added. The reaction was

137
monitored by integrating the thiophene benzylic peak (5.11 ppm) respect to
tetramethylsilane (TMS) (0.00 ppm, integrated to 1.00).
Compound 2-39 (5 mg, 0.012 mmol, 1 equiv) was dissolved in a 10% solution of
piperidine in CDCl3 (486 μL, 0.025M). The reaction was monitored by integrating the
thiophene benzylic peak (5.11 ppm) respect to tetramethylsilane (TMS) (0.00 ppm,
integrated to 1.00).
For the control study, compound 2-39 (5 mg, 0.012 mmol, 1 equiv) was dissolved
in CDCl3 (486 μL, 0.025M) and the thiophene benzylic peak was monitored with respect
to TMS.

138
5.5 Chapter 3: Experimental Procedures and Characterization
Figure 5-9. Synthetic scheme for monomer 3-7.
(3-11). Concentrated hydrochloric acid (HCl) (36% w/v, 72 mL) was added
dropwise to a solution of 2,6-dimethylphenol (3-10) (50.0 g, 409.2 mmol, 1 equiv) in
petroleum ether (ligroin) (204 mL, 2.0 M) and formaldehyde in water (37% w/v, 75 mL,
920.9 mmol, 2.25 equiv) over 10 min at room temperature. The reaction mixture was
stirred at room temperature for 16 h, after which the reaction mixture was poured into
500 mL of water. The white suspension was stirred at room temperature for 20 min. The
resulting white solid was collected on a Buchner funnel, washed with water (500 mL),
and dried at 70 °C under vacuum (~1 mmHg) overnight. The white solid was
recrystallized in hot dichloromethane to afford compound 3-11 as white crystals (37.4 g,
145.9 mmol, 71%). 1H NMR (400 MHz, (CD3)2CO): δ 7.00 (s, 2 H), 6.83 (s, 4 H) 3.70 (s,
2 H), 2.25 (s, 12 H); 13
C NMR (400 MHz, (CD3)2CO): δ 150.9, 132.9, 128.5, 123.3, 40.0,
15.7. The NMR data matches the known spectra for this compound.5,6
(3-12). Allyl bromide (3.4 mL, 39.01 mmol, 1 equiv) was added dropwise to a
stirred solution of 3-11 (10.0 g, 39.01 mmol, 1 equiv) and K2CO3 (6.47 g, 46.81 mmol,
1.2 equiv) in DMF (98 mL, 0.4 M). The reaction mixture was stirred at room temperature

139
for 22 h. Saturated ammonium chloride solution (200 mL) was added to the reaction
mixture and the mixture was extracted with ethyl acetate (4 × 150 mL). The combined
organic fractions were washed with brine (100 mL) and dried over MgSO4. The solids
were removed by filtration and the solution was concentrated via rotary evaporation. The
yellow residue was purified by flash column chromatography (gradient of 5% ethyl
acetate in hexanes increasing to 10% ethyl acetate in hexanes), affording compound 3-12
as a yellow oil (5.1 g, 17.48 mmol, 44%). 1H NMR (400 MHz, CDCl3): δ 6.86 (s, 2 H),
6.84 (s, 2 H), 6.14 (m, 1 H), 5.48 (dd, 1 H), 5.30 (dd, 1 H), 4.57 (s, 1 H), 4.32 (ddd, 2 H),
3.76 (s, 2 H), 2.31 (s, 6H), 2.28 (s, 6 H); 13
C NMR (400 MHz, CDCl3): δ 154.2, 150.5,
137.1, 134.3, 133.0, 130.8, 129.1, 129.0, 123.0, 117.1, 73.2, 40.6, 16.5, 16.0; The NMR
data matches the known spectra for this compound.6
(3-7). Silver oxide (7.99 g, 34.46 mmol, 2 equiv) was added to a solution of
compound 3-12 (5.10 g, 17.22 mmol, 1 equiv) in dichloromethane (172 mL, 0.1 M) and
the reaction mixture was stirred at room temperature for 11 h. The reaction mixture was
filtered to remove the silver oxide and the yellow solution was concentrated via rotary
evaporation. The resulting yellow solid was dried under vacuum overnight, affording
compound 3-7 as a bright yellow solid (5.01 g, 17.04 mmol, 99%). IR (cm-1): 2912,
2361, 1554, 980, 930; 1H NMR (400 MHz, CDCl3): δ 7.53 (s, 1 H), 7.12 (s, 2 H), 7.03 (s,
1 H), 6.99 (s, 1 H), 6.11 (m, 1 H), 5.46 (dd, 1 H), 5.29 (dd, 1 H), 4.35 (dd, 2 H), 2.31 (s, 6
H), 2.06 (s, 3 H), 2.04 (s, 3 H); 13
C NMR (400 MHz, CDCl3): δ 187.2, 157.4, 143.0,
139.1, 137.3, 135.3, 133.7, 131.7, 131.5, 131.3, 130.9, 117.6, 73.3, 17.0, 16.6, 16.2. The
NMR data matches the known spectra for this compound.6

140
Figure 5-10. Synthetic scheme for monomer 3-8.
(3-13). DIAD (3.85 mL, 19.5 mmol, 1.25 equiv) was added dropwise to a stirred
solution of 3-11 (4.0 g, 15.6 mmol, 1 equiv), triphenylphosphine (4.91 g, 18.72 mmol, 1.2
equiv) and 2-tridecen-1-ol (4.0 mL, 17.16 mmol, 1.1 equiv) in THF (31 mL, 0.5 M) at 0
oC. The reaction mixture was then warmed to room temperature overnight and stirred for
18 h. The mixture was concentrated via rotary evaporation and diluted in 50 mL EtOAc,
then washed with NH4Cl (2 × 50 mL) and brine (1 × 50 mL), dried over MgSO4 and
concentrated via rotary evaporation. The resulting yellow residue was purified via flash
column chromatography (gradient of 2% ethyl acetate in hexanes increasing to 10% ethyl
acetate in hexanes), affording compound 3-13 as a yellow oil (2.39 g, 5.48 mmol, 35%).
1H NMR (CDCl3, 400 MHz): δ 6.87 (s, 2H), 6.85 (s, 2H), 5.84 (m, 2H), 4.64 (s, 1H), 4.27
(d, 2H), 3.77 (s, 2H), 2.29 (s, 6H), 2.25 (s, 6H), 2.14 (q, 2H), 1.45 (br, 2 H), (br, 14H),
0.95 (t, 3H); 13
C NMR (400 MHz, CDCl3): δ 154.3, 150.5, 137.0, 135.3, 133.1, 130.9,
129.0, 125.8, 123.0, 73.3, 40.6, 32.4, 32.0, 29.7, 29.6, 29.4, 29.3, 29.1, 22.7, 16.6, 16.0,
14.2.
(3-8). Silver oxide (2.53 g mg, 10.9 mmol, 2 equiv) was added to a solution of
compound 3-13 (2.38 g, 5.45 mmol, 1 equiv) in dichloromethane (55 mL, 0.1 M) and the

141
reaction mixture was stirred at room temperature for 2 h. The reaction mixture was
filtered to remove the silver oxide and the yellow solution was concentrated via rotary
evaporation. The resulting yellow solid was dried under vacuum overnight, affording
compound 3-8 as a bright yellow solid (2.02 g, 4.65 mmol, 85%). 1H NMR (CDCl3, 400
MHz): δ 7.55 (s, 1H), 7.13 (s, 2H), 7.03 (s, 1H), 7.00 (s, 1H), 5.80 (m, 2H), 4.30 (d, 2H),
2.32 (s, 6H), 2.09 (s, 3H), 2.06 (s, 6H), 2.04 (m, 2 H), 1.40 (m, 2H), 1.26 (s, 16H), 0.89
(t, 3H); 13
C NMR (400 MHz, CDCl3): δ 187.2, 157.5, 143.1, 139.2, 137.2, 136.0, 135.3,
131.8, 131.5, 131.3, 131.2, 130.9, 125.2, 73.4, 32.3, 32.0, 29.6, 29.5, 29.4, 29.2, 29.0,
22.7, 17.0, 16.7, 16.2, 14.1
Figure 5-11. Synthetic scheme for compound 3-16.
(3-15). DMSO (6.33 mL, 89.2 mmol, 2.5 equiv) was added to a stirred solution of
oxalyl chloride (4.28 mL, 49.9 mmol, 1.4 equiv) in dichloromethane (180 mL, 0.2 M) at
−78 °C. The mixture was stirred for 20 min before 4-pentyn-1-ol (3-14) (3.0 g,
35.7 mmol, 1 equiv) was slowly added. The mixture was stirred for a further 20 min
before triethylamine (30.6 mL, 178 mmol, 5 equiv) was added. This reaction mixture was
stirred for 30 min at −78 °C and then allowed to warm to room temperature and stirred
for a further 3 h. A solution of lithium chloride (2.72 g, 64.2 mmol, 1.8 equiv), triethyl
phosphonoacetate (12.7 mL, 64.2 mmol, 1.8 equiv) and 1,8-diazabicyclo[5,4,0]undec-7-
ene (8.82 mL, 64.2 mmol, 1.8 equiv) in MeCN (180 mL, 0.2 M) was then prepared and

142
stirred for 1 h. The Swern reaction solution was concentrated on high vacuum, then the
Horner–Wadsworth–Emmons solution in MeCN was added and the reaction mixture was
stirred at room temperature overnight. The reaction was quenched with a saturated
solution of ammonium chloride (100 mL) and concentrated to give an orange residue,
which was then extracted with diethyl ether (4 × 100 mL). The organic layers were
combined, dried (MgSO4), filtered and concentrated via rotary evaporation to give an oily
orange residue. Purification by flash column chromatography (10% Et2O in petroleum
ether) afforded 3-15 (3.52 g, 65%) as a yellow oil. δ1H NMR (CDCl3, 400 MHz): δ 6.90
(m, 1H), 5.80 (dd, 1H), 4.09 (q, 2H), 2.35 (t, 2H), 2.26 (q, 2H), 1.94 (s, 1H), 1.18 (t, 3H);
13C NMR (400 MHz, CDCl3): δ 166.1, 146.2, 122.4, 82.5, 69.4, 60.1, 30.9, 17.3, 14.1.
The NMR data matches the known spectra for this compound.7
(3-16). To a stirred solution of ethyl 3-15 (3.5 g, 22.0 mmol, 1 equiv) in Et2O
(110 mL, 0.2 M) at −78 oC was added DIBAL-H (1.0 M in hexanes) (50.6 mL, 50.6
mmol, 2.2 equiv). The mixture was stirred at −78 oC for 3 hours and then warmed to
room temperature overnight. The mixture was then cooled to 0 oC and
30 mL of saturated
NH4Cl was added to quench the reaction and stirred for 1 h. The suspension was then
filtered through Celite, dried over MgSO4 and concentrated via rotary evaporation. The
crude product was then purified via flash column chromatography (gradient of 20% Et2O
in petroleum ether increasing to 50% Et2O in petroleum ether) to afford 3-16 as a clear
liquid (2.14 g, 14.06 mmol, 85%). 1H NMR (CDCl3, 400 MHz): δ 5.70 (m, 2H), 4.07 (d,
2H), 2.25 (m, 4 H), 1.99 (s, 1 H), 1.95 (s, 1 H) ; 13
C NMR (400 MHz, CDCl3): δ 130.5,
130.3, 83.8, 68.8, 63.2, 31.1, 18.4. The NMR data matches the known spectra for this
compound.7

143
Figure 5-12. Synthetic scheme for monomer 3-9.
(3-17). DIAD (4.65 mL, 23.60 mmol, 1.25 equiv) was added dropwise to a stirred
solution of 3-11 (4.84 g, 18.88 mmol, 1 equiv), triphenylphosphine (5.94 g, 22.66 mmol,
1.2 equiv) and 3-16 (2.08 g, 18.88 mmol, 1.0 equiv) in THF (45 mL, 0.5 M) at 0 oC. The
reaction mixture was then warmed to room temperature overnight and stirred for 18 h.
The mixture was concentrated via rotary evaporation and diluted in 50 mL EtOAc, then
washed with NH4Cl (2 × 30 mL) and brine (1 × 30 mL), dried over MgSO4 and
concentrated via rotary evaporation. The resulting yellow residue was purified via flash
column chromatography (gradient of 5% ethyl acetate in hexanes increasing to 20% ethyl
acetate in hexanes), affording compound 3-17 as a yellow oil (2.23 g, 6.41 mmol, 34%).
1H NMR (CDCl3, 400 MHz): δ 6.86 (s, 2 H), 6.84 (s, 2 H), 5.89 (dd, 2 H), 4.61 (s, 1 H),
4.29 (d, 2 H), 3.76 (s, 2 H), 2.37 (m, 4 H), 2.34 (s, 6 H), 2.28 (s, 6 H), 2.02 (s, 1 H); 13
C
NMR (400 MHz, CDCl3): δ 154.2, 150.5, 137.1, 133.1, 132.4, 130.8, 129.0, 127.4, 123.1,
83.8, 72.6, 68.9, 40.6, 31.3, 18.4, 16.6, 16.0.
(3-9). To a stirred solution of (3-17) in diethyl ether (120 mL, 0.05 M) was added
slowly a solution of potassium ferricyanide (7.76 g, 23.56 mmol, 4 equiv) and KOH (1.37
g, 24.74 mmol, 4.2 equiv) in water (25 mL, 0.25 M). The mixture was stirred at room

144
temperature for 2 hours. The organic layer was removed from the mixture, the resulting
aqueous layer was extracted with diethyl ether (3 × 50) and the combined organic
fractions were dried over MgSO4. The solution was then concentrated by rotary
evaporation to afford compound 3-9 as a bright yellow solid (1.90 g, 5.49, 93%). 1H NMR
(CDCl3, 400 MHz): δ 7.55 (s, 1 H), 7.14 (s, 2 H), 7.06 (s, 1 H), 7.03 (s, 1 H), 5.89 (dd, 2
H), 4.33 (d, 2 H), 2.33 (m, 4 H), 2.33 (s, 6 H), 2.08 (s, 3 H), 2.06 (s, 3 H), 1.98 (s, 1 H) ;
13C NMR (400 MHz, CDCl3): δ 187.7, 157.8, 143.5, 139.6, 137.7, 135.7, 133.4, 132.2,
131.9, 131.7, 131.3, 127.3, 84.0, 73.4, 69.3, 31.6, 18.7, 17.4, 17.1, 16.7.
Figure 5-13. Synthetic scheme for compound 3-22.
(3-22). To a stirred solution of triethylene glycol 2-bromoethyl methyl ether (3-
21) (2.0 g, 7.38 mmol, 1 equiv) in DMSO (37 mL, 0.2 M) was added sodium azide (960
mg, 14.75 mmol, 2 equiv) at room temperature. The mixture was stirred for 12 hours at
room temperature. The reaction mixture was then extracted with diethyl ether (30 mL),
and the organic layer was removed. The DMSO layer was then diluted with water (40
mL), extracted with diethyl ether (50 mL × 3), then the organic fractions were combined,
dried over MgSO4 and concentrated by rotary evaporation. The resulting liquid was then
dried on high vacuum for 24 hours to afford compound 3-22 as a clear oil (1.62 g, 6.95
mmol, 94%). 1H NMR (CDCl3, 400 MHz): δ 3.60 (m, 12 H), 3.50 (t, 2 H), 3.34 (m, 5 H) ;

145
13C NMR (400 MHz, CDCl3): δ 71.8, 70.6, 70.6, 70.5, 70.4, 70.3, 69.9, 58.8, 50.5, 40.9.
The NMR data matches the known spectra for this compound.8
Figure 5-14. Synthetic scheme for polymer 3-4.
(3-4). Compound 3-7 (500 mg, 1.70 mmol, 1 equiv) was added to a flame-dried
10 mL round bottom flask with an egg-shaped stir bar, dried under vacuum and
backfilled with an argon atmosphere. Anhydrous DCM (1.7 mL, 1 M) was added to the
flask, which was cooled to –20 oC in an iPrOH bath chilled by a VWR Refrigerated
Circulating Bath. A stock solution of MeOH (138 µL, 3.41 mmol) in 1 mL anhydrous
DCM was prepared and 10 µL of this solution (1.38 µL, .034 mmol, 0.02 equiv) were
added dropwise to the reaction mixture, immediately followed by addition of the P1-t-Bu
phosphazene base (10.4 µL, .034 mmol, .02 equiv). The reaction mixture was stirred at –
20 oC for 1 h and quenched with acetic anhydride (800 µL, 8.50 mmol, 5 equiv) that was
previously mixed with K2CO3 to remove trace amounts of AcOH. After 1 h, the
circulating bath was turned off and the reaction mixture slowly warmed to room
temperature, stirring for 12 h. The polymer was precipitated into MeOH (40 mL) at 0 oC
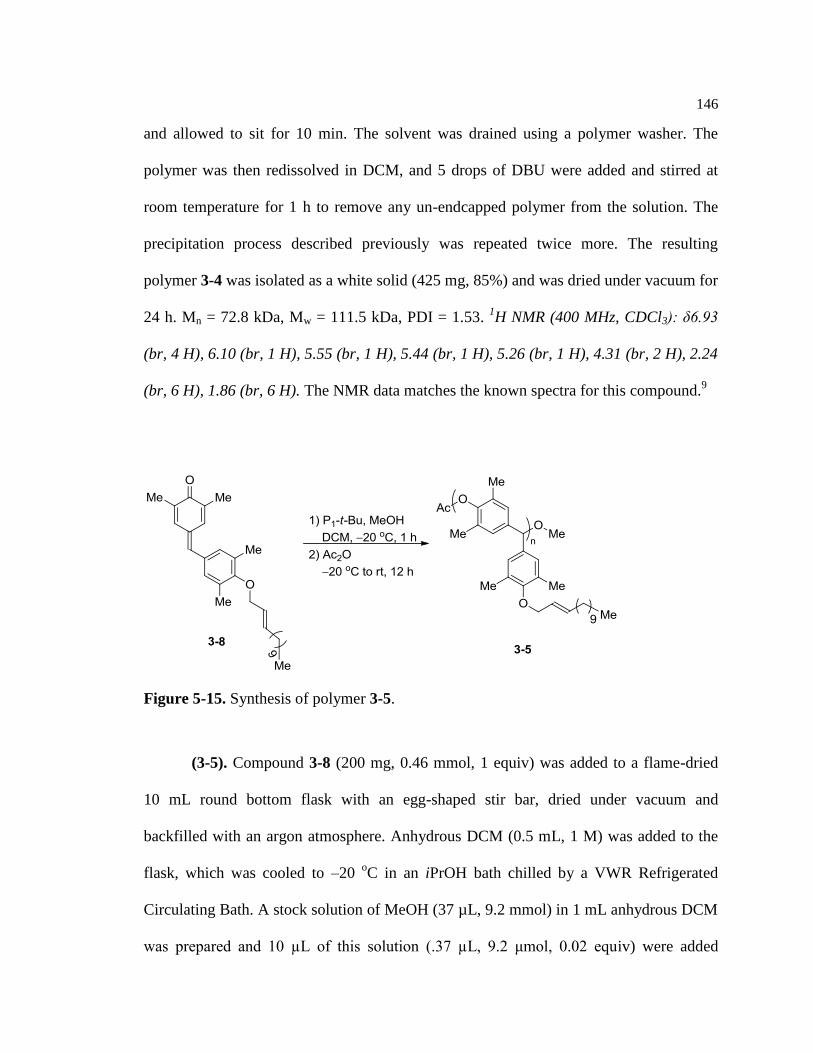
146
and allowed to sit for 10 min. The solvent was drained using a polymer washer. The
polymer was then redissolved in DCM, and 5 drops of DBU were added and stirred at
room temperature for 1 h to remove any un-endcapped polymer from the solution. The
precipitation process described previously was repeated twice more. The resulting
polymer 3-4 was isolated as a white solid (425 mg, 85%) and was dried under vacuum for
24 h. Mn = 72.8 kDa, Mw = 111.5 kDa, PDI = 1.53. 1H NMR (400 MHz, CDCl3): δ6.93
(br, 4 H), 6.10 (br, 1 H), 5.55 (br, 1 H), 5.44 (br, 1 H), 5.26 (br, 1 H), 4.31 (br, 2 H), 2.24
(br, 6 H), 1.86 (br, 6 H). The NMR data matches the known spectra for this compound.9
Figure 5-15. Synthesis of polymer 3-5.
(3-5). Compound 3-8 (200 mg, 0.46 mmol, 1 equiv) was added to a flame-dried
10 mL round bottom flask with an egg-shaped stir bar, dried under vacuum and
backfilled with an argon atmosphere. Anhydrous DCM (0.5 mL, 1 M) was added to the
flask, which was cooled to –20 oC in an iPrOH bath chilled by a VWR Refrigerated
Circulating Bath. A stock solution of MeOH (37 µL, 9.2 mmol) in 1 mL anhydrous DCM
was prepared and 10 µL of this solution (.37 µL, 9.2 μmol, 0.02 equiv) were added

147
dropwise to the reaction mixture, immediately followed by addition of the P1-t-Bu
phosphazene ase (2.9 µL, 9.2 μmol, .02 equiv). The reaction mixture was stirred at –20
oC for 1 h and quenched with acetic anhydride (220 µL, 2.30 mmol, 5 equiv) that was
previously mixed with K2CO3 to remove trace amounts of AcOH. After 1 h, the
circulating bath was turned off and the reaction mixture slowly warmed to room
temperature, stirring for 12 h. The polymer was precipitated into MeOH (40 mL) at 0 oC
and allowed to sit for 10 min. The solvent was drained using a polymer washer. The
polymer was then redissolved in DCM, and 5 drops of DBU were added and stirred at
room temperature for 1 h to remove any un-endcapped polymer from the solution. The
precipitation process described previously was repeated twice more. The resulting
polymer 3-5 was isolated as a white solid (122 mg, 61%) and was dried under vacuum for
24 h. Mn = 31.2 kDa, Mw = 45.9 kDa, PDI = 1.47. 1H NMR (400 MHz, CDCl3): δ 6.92
(br, 4 H), 5.79 (br, 2 H), 5.56 (br, 1 H), 4.25 (br, 2 H), 2.24 (br, 6 H), 2.10 (br, 2 H), 1.87
(br, 6 H), 0.91 (br, 3 H).

148
Figure 5-16. Synthesis of polymer 3-18.
(3-18). Compound 3-9 (300 mg, 0.87 mmol, 1 equiv) was added to a flame-dried
10 mL round bottom flask with an egg-shaped stir bar, dried under vacuum and
backfilled with an argon atmosphere. Anhydrous DCM (0.9 mL, 1 M) was added to the
flask, which was cooled to –20 oC in an iPrOH bath chilled by a VWR Refrigerated
Circulating Bath. A stock solution of MeOH (140 µL, 34.7 mmol) in 1 mL anhydrous
DCM was prepared and a 10 µL aliquot of this solution (1.4 µL, 34.7 μmol, 0.04 equiv)
were added dropwise to the reaction mixture, immediately followed by addition of the P1-
t-Bu phosphazene ase (10.6 µL, 34.7 μmol, .04 equiv). The reaction mixture was stirred
at –20 oC for 1 h and quenched with acetic anhydride (410 µL, 4.33 mmol, 5 equiv) that
was previously mixed with K2CO3 to remove trace amounts of AcOH. After 1 h, the
circulating bath was turned off and the reaction mixture slowly warmed to room
temperature, stirring for 12 h. The polymer was precipitated into MeOH (40 mL) at 0 oC
and allowed to sit for 10 min. The solvent was drained using a polymer washer. The
polymer was then redissolved in DCM, and 5 drops of DBU were added and stirred at

149
room temperature for 1 h to remove any un-endcapped polymer from the solution. The
precipitation process described previously was repeated twice more. The resulting
polymer 3-18 was isolated as a white solid (246 mg, 82%) and was dried under vacuum
for 24 h. Mn Mn = 38.4 kDa, Mw = 45.0 kDa, PDI = 1.17. 1H NMR (400 MHz, CDCl3): δ
6.90 (br, 4 H), 5.84 (br, 2 H), 5.53 (br, 1 H), 4.26 (br, 2 H), 2.30 (br, 4 H), 2.22 (br, 6 H),
1.96 (br, 1 H), 1.86 (br, 6 H).
Figure 5-17. Synthesis of polymer 3-6.
(3-6). To a stirred solution of polymer 3-18 (200 mg, 0.58 mmol, 1 equiv) and
triethylene glycol 2-azidoethyl methyl ether (148 mg, 0.63 mmol, 1.1 equiv) in THF (2.9
mL, 0.2 M) was added a suspension of copper(I) iodide (22 mg, 0.11 mmol, 0.2 equiv)
and N,N,N′,N′′,N′′-pentamethyldiethylenetriamine (24 μL, 0.11 mmol, 0.2 equiv) in THF
(2.9 mL, 0.2 M). The reaction was stirred vigorously with an egg-shaped stir bar
overnight at 60 oC. The mixture was then concentrated using rotary evaporation and
rediluted with DCM (50 mL). The organic layer was washed with sat. NH4Cl (30 mL ×
2) and brine (30 mL × 1), then dried over MgSO4 and concentrated via rotary

150
evaporation. The resulting crude oil was dissolved in a small amount of DCM, then
precipitated into cold Et2O (50 mL). The precipitate was filtered out of the solution, then
dissolved in DCM and precipitated into cold Et2O twice more. Resulting polymer 3-6 was
isolated as a white/tan solid (283 mg, 84%) and was dried under vacuum for 24 h. Mn =
70.1, Mw = 87.7 kDa, PDI = 1.25. 1H NMR (400 MHz, CDCl3): δ 7.46 (s, 1 H), 6.92 (s, 1
H), 6.88 (s, 2 H), 6.84 (s, 1 H), 5.84 (m, 2 H), 5.50 (s, 1 H), 4.48 (t, 2H), 4.20 (s, 2 H),
3.82 (t, 2 H), 3.58 (m, 10 H), 3.50 (t, 2 H), 3.33 (s, 3 H), 2.81 (t, 2 H), 2.47 (t, 2 H), 2.19
(s, 3 H), 2.17 (s, 3 H), 1.84 (s, 3 H), 1.82 (s , 3 H).
Solution Phase Depolymerization in Response to palladium:
For polymer 3-4 (Mn = 72.8 kDa), a 34 μM solution of
Tetrakis(triphenylphosphine)palladium(0) (Pd(PPh3)4) in THF (2.0 mL) was added to a
solution of polymer 3-4 (5.0 mg, 17 µmol, 1 equiv) and 85 mM 1,8-diazabicycloundec-7-
ene (DBU) in tetrahydrofuran (1 mL). The solution was stirred in a 2 mL shorty vial,
syringed filtered, and injected into the GPC. (Figure 3-15).
For polymer 3-6 (Mn = 70.1 kDa), a 34 μM solution of
Tetrakis(triphenylphosphine)palladium(0) (Pd(PPh3)4) in THF (2.0 mL) was added to a
solution of polymer 3-6 (5.0 mg, 17 µmol, 1 equiv) and 85 mM 1,8-diazabicycloundec-7-
ene (DBU) in tetrahydrofuran (1 mL). The solution was stirred in a 2 mL shorty vial,
syringed filtered, and injected into the GPC. (Figure 3-15).

151
Solution Phase Control Study:
Polymers 3-4 (5 mg, Mn = 72.8 kDa), and 3-6 (5 mg, Mn = 70.1 kDa) were
dissolved in 85 mM solutions of DBU in THF (2.0 mL). The solutions were stirred in a 2
mL shorty vial, syringed filtered, and injected into the GPC for analysis (Figure 3-16).
Solid-State Depolymerization in Response to Pd(0):
Fabrication of Polymer Discs:
Silicon molds were prepared on a microscope glass slide. A solution of polymer
in anhydrous toluene (100 mg/mL) with dibutyl phthalate (20% wt.) was prepared. Using
a 100-µL syringe, the solution was deposited dropwise into the silicon mold. The solution
was left to dry overnight and the dried disc was removed from the mold using an X-Acto
knife and a razor blade. The disc was dried under high vacuum (~1 mmHg) for 24 h.
Experimental Procedure for Testing the Polymer Disc When Exposed to Pd(0):
Polymer discs were prepared from polymers 3-4, 3-5, and 3-6. In a 20-mL
scintillation glass vial, the polymer disc was suspended in water (19 mL). 1,8-
diazabicyclo-7-undecene (100 µL, 0.67 mmol) was added dropwise to the suspension,
followed by a solution of Pd(PPh3)4 in tetrahydrofuran (17 mmol in 1 mL). The reaction
progress was monitored by photography (Figure 3-17).
LCMS Analysis of Products from the Depolymerization Reaction of Polymer 3-6:
To evaluate the byproducts that are generated from the solid-state
depolymerization reaction of polymer 3-6, an experiment analogous to the solid-state

152
depolymerization study outlined above was prepared with a 9:1 H2O-THF solvent
mixture. Following 12 hours, an aliquot was removed from the solution surrounding the
solid-state polymer disc. LCMS analysis of the reaction mixture showed two peaks with
masses corresponding to the expected masses of the deprotected small molecule
monomer (3-19) (M + H+ = 255.1) as well as the PEG-4 monomer (3-20) (M + H
+ =
580.2) (Figure 3-21).
Contact Angle Measurement on Polymers
After spin-coating on glass substrate, contact angles from polymer films 3-4, 3-5,
and 3-6 were measured with a 5 μL droplet of water. Three samples were measured for
each polymer after drying in vacuo. The average and standard deviation for each contact
angle were calculated.
SEM Images of Polymer Discs Prepared from Polymers 3-4, 3-5, and 3-6
A surface morphology of each polymer disc from polymers 3-4, 3-5, and 3-6 was
characterized by SEM imaging on a Zeiss Sigma FE-SEM (Figure 3-23).

153
5.6 Chapter 4: Experimental Procedures and Characterization
General Procedure for GPC Sonication Experiments
Solutions of polymers 4-1, 4-2, and 4-3 in THF (15 mg/15 mL) were transferred
to a Suslick cell, each arm was sealed with a rubber cap, and the cell was affixed to the
sonication apparatus with the cell submerged in a water/ice bath. The probe sonicator was
programmed at 30% amplification with a pulse sequence of 1 sec on, 9 sec off. At
predetermined time points, 150 μL of the polymer solution was removed, syringe filtered,
and injected directly into the GPC for analysis. The refractive index (RI) signal was
exported and graphed vs. time to create the polymer data graphs.
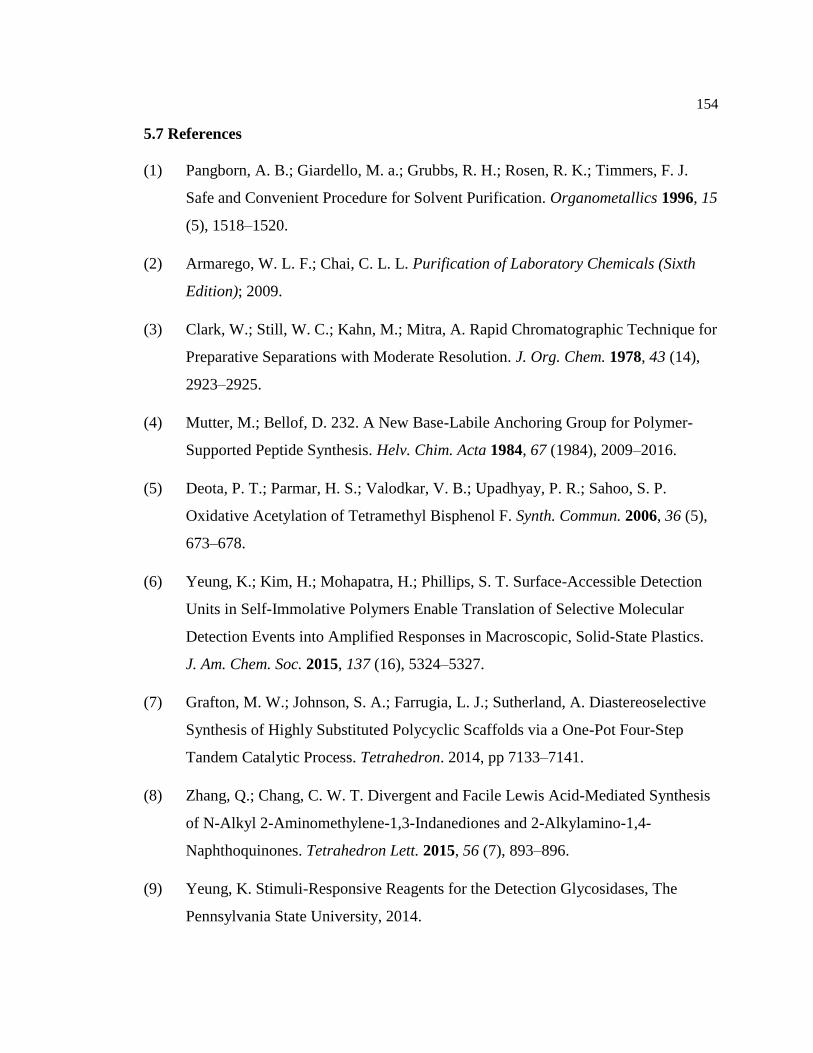
154
5.7 References
(1) Pangborn, A. B.; Giardello, M. a.; Grubbs, R. H.; Rosen, R. K.; Timmers, F. J.
Safe and Convenient Procedure for Solvent Purification. Organometallics 1996, 15
(5), 1518–1520.
(2) Armarego, W. L. F.; Chai, C. L. L. Purification of Laboratory Chemicals (Sixth
Edition); 2009.
(3) Clark, W.; Still, W. C.; Kahn, M.; Mitra, A. Rapid Chromatographic Technique for
Preparative Separations with Moderate Resolution. J. Org. Chem. 1978, 43 (14),
2923–2925.
(4) Mutter, M.; Bellof, D. 232. A New Base-Labile Anchoring Group for Polymer-
Supported Peptide Synthesis. Helv. Chim. Acta 1984, 67 (1984), 2009–2016.
(5) Deota, P. T.; Parmar, H. S.; Valodkar, V. B.; Upadhyay, P. R.; Sahoo, S. P.
Oxidative Acetylation of Tetramethyl Bisphenol F. Synth. Commun. 2006, 36 (5),
673–678.
(6) Yeung, K.; Kim, H.; Mohapatra, H.; Phillips, S. T. Surface-Accessible Detection
Units in Self-Immolative Polymers Enable Translation of Selective Molecular
Detection Events into Amplified Responses in Macroscopic, Solid-State Plastics.
J. Am. Chem. Soc. 2015, 137 (16), 5324–5327.
(7) Grafton, M. W.; Johnson, S. A.; Farrugia, L. J.; Sutherland, A. Diastereoselective
Synthesis of Highly Substituted Polycyclic Scaffolds via a One-Pot Four-Step
Tandem Catalytic Process. Tetrahedron. 2014, pp 7133–7141.
(8) Zhang, Q.; Chang, C. W. T. Divergent and Facile Lewis Acid-Mediated Synthesis
of N-Alkyl 2-Aminomethylene-1,3-Indanediones and 2-Alkylamino-1,4-
Naphthoquinones. Tetrahedron Lett. 2015, 56 (7), 893–896.
(9) Yeung, K. Stimuli-Responsive Reagents for the Detection Glycosidases, The
Pennsylvania State University, 2014.
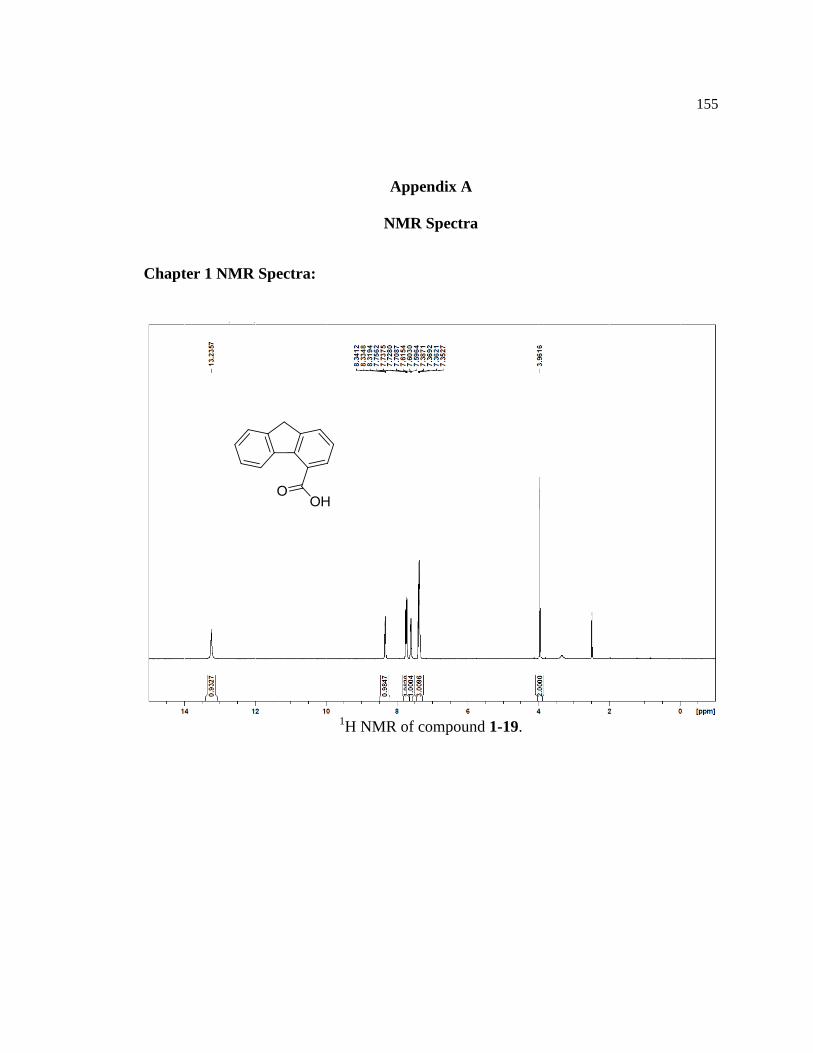
155
Appendix A
NMR Spectra
Chapter 1 NMR Spectra:
1H NMR of compound 1-19.

156
13
C NMR of compound 1-19.
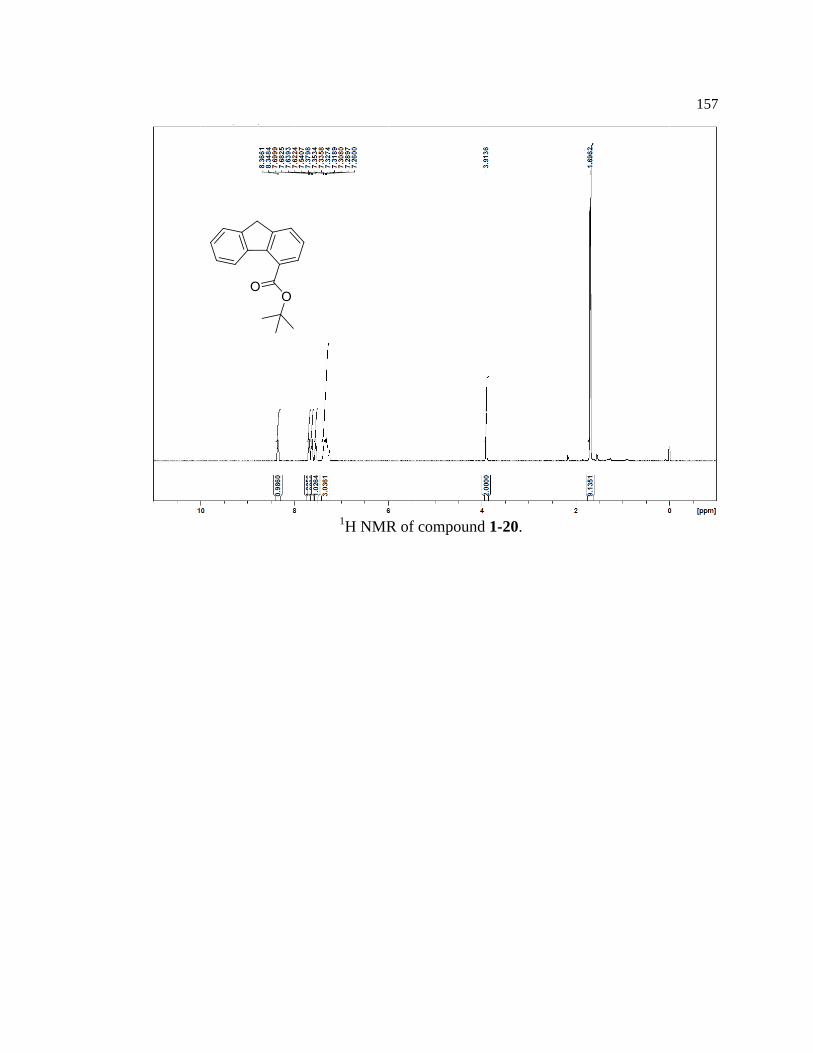
157
1H NMR of compound 1-20.
158
1H NMR of compound 1-22.

159
13
C NMR of compound 1-22.

160
1H NMR of compound 1-23.

161
13
C NMR of compound 1-23.

162
1H NMR of compound 1-24.
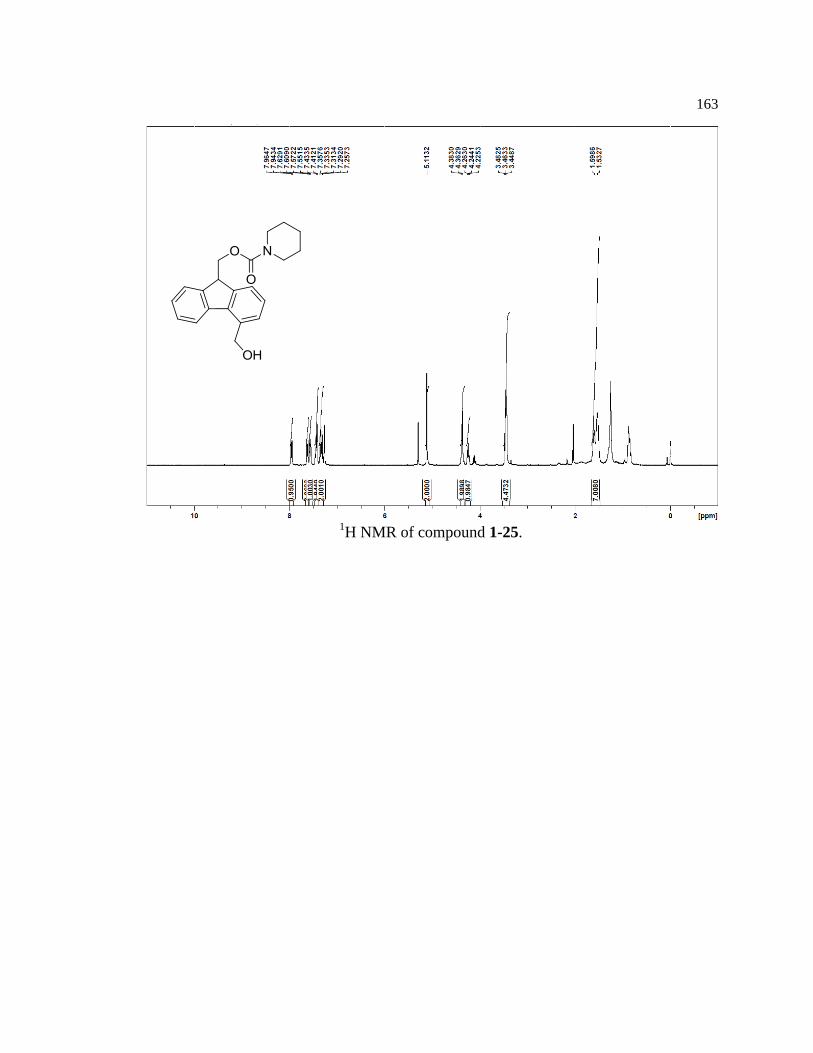
163
1H NMR of compound 1-25.

164
1H NMR of compound 1-15.

165
1H NMR of compound 1-16.

166
1H NMR of compound 1-31.

167
1H NMR of compound 1-33.

168
1H NMR of compound 1-17.

169
Chapter 2 NMR Spectra:
1H NMR of compound 2-19.

170
1H NMR of compound 2-20.

171
1H NMR of compound 2-21.

172
1H NMR of compound 2-22.

173
1H NMR of compound 2-23.

174
1H NMR of compound 2-24.

175
1H NMR spectrum of 2-30.

176
1H NMR spectrum of 2-31.
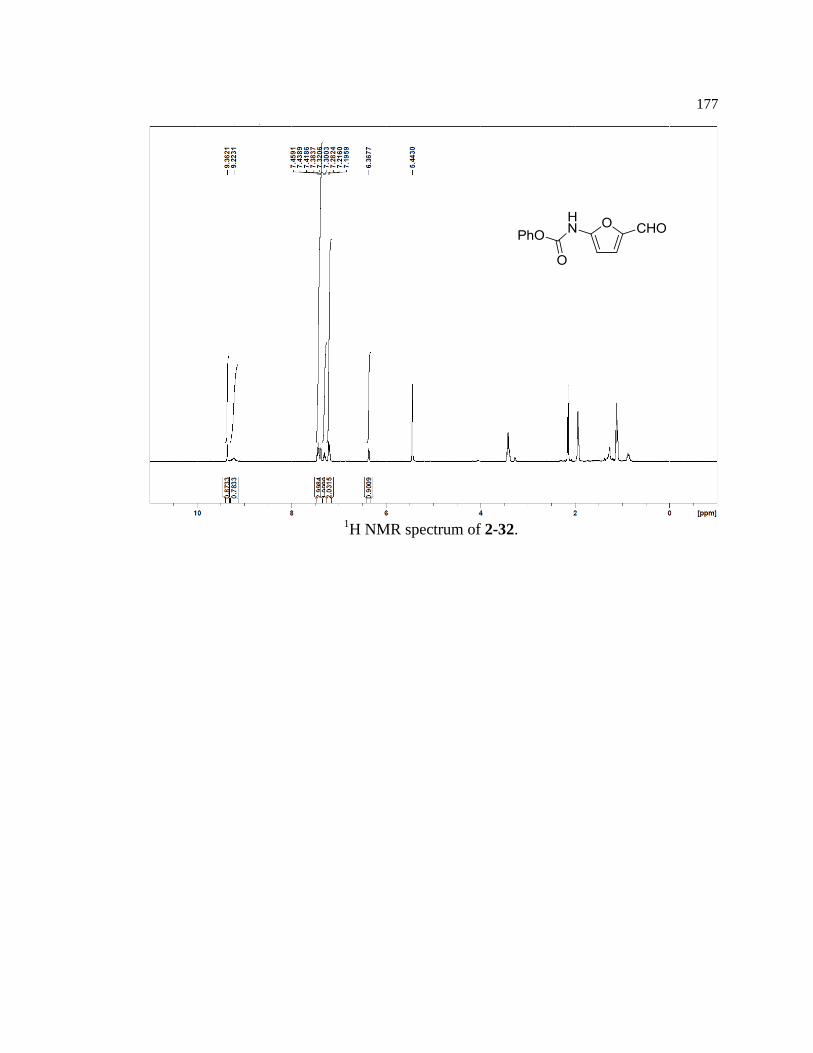
177
1H NMR spectrum of 2-32.

178
1H NMR spectrum of 2-33.

179
1H NMR spectrum of 2-35.

180
1H NMR spectrum of 2-36.

181
1H NMR spectrum of 2-37.
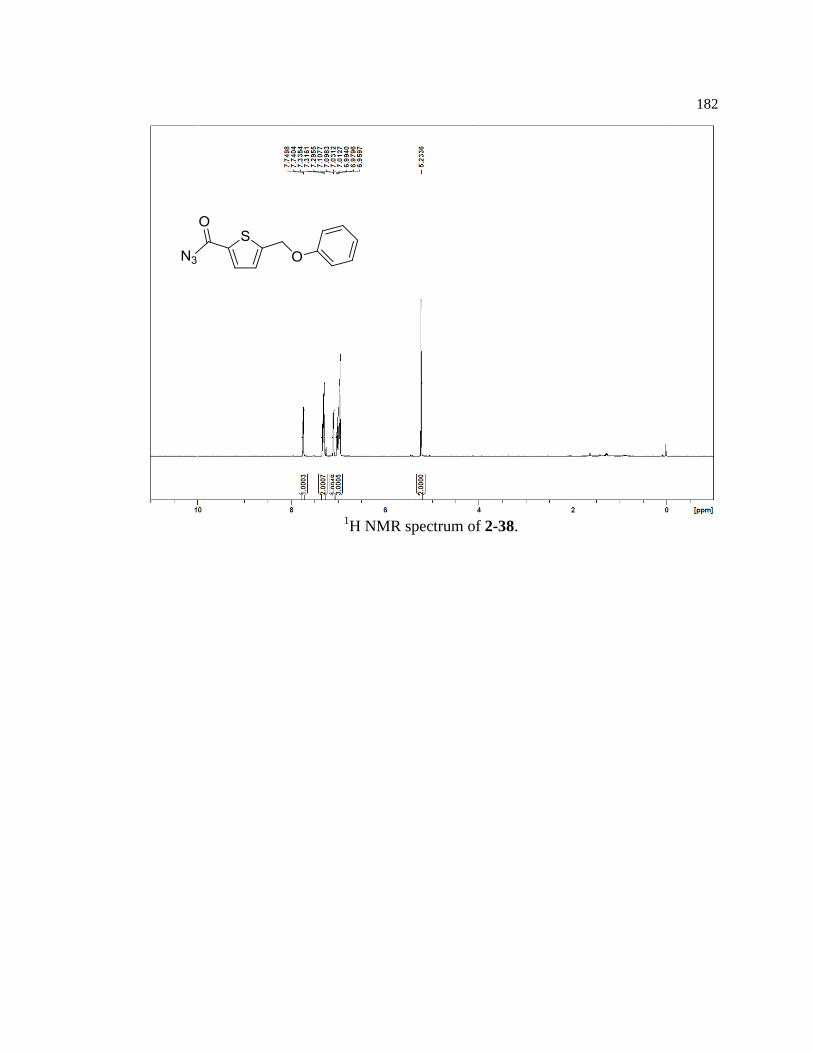
182
1H NMR spectrum of 2-38.
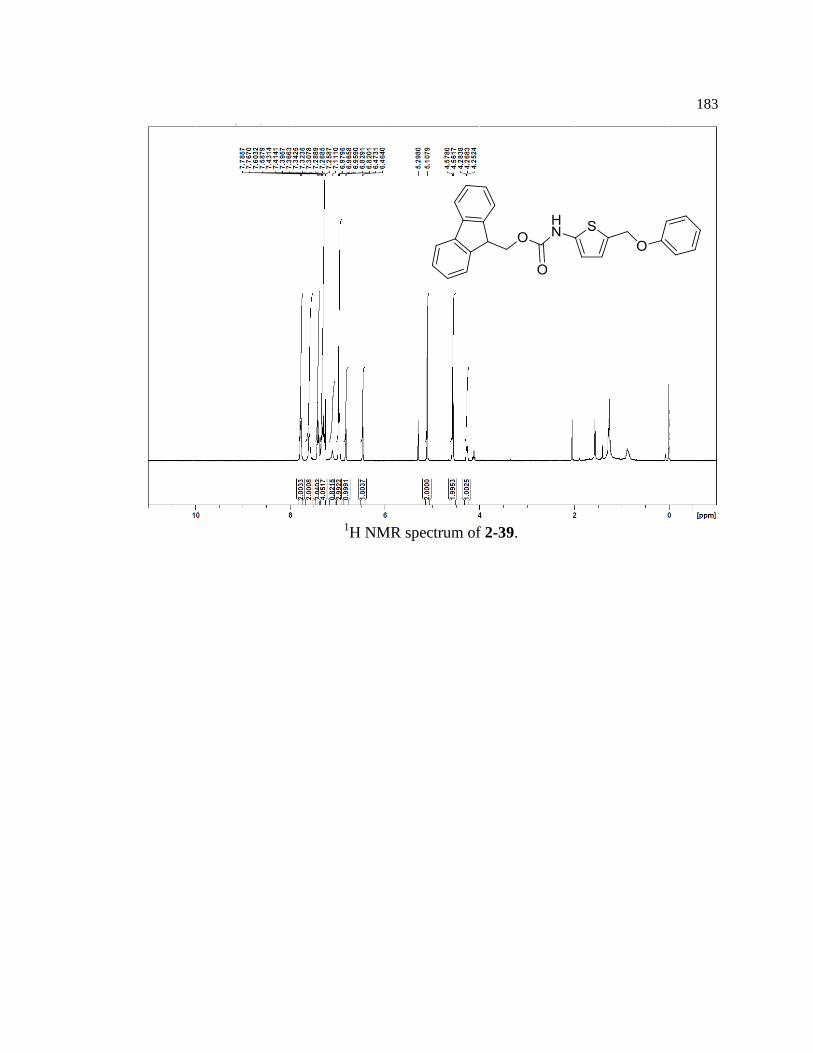
183
1H NMR spectrum of 2-39.

184
1H NMR spectrum of 2-40.

185
1H NMR spectrum of 2-41.
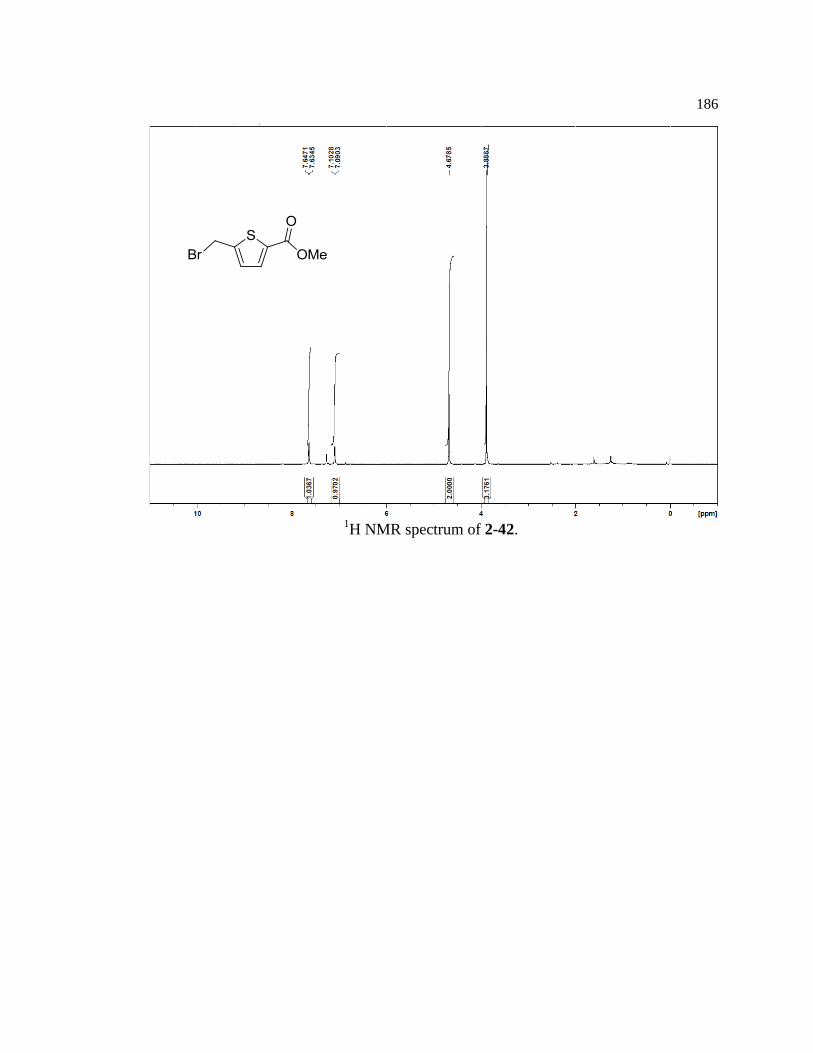
186
1H NMR spectrum of 2-42.

187
1H NMR spectrum of 2-43.

188
1H NMR spectrum of 2-44.

189
1H NMR spectrum of 2-45.

190
1H NMR spectrum of 2-46.

191
1H NMR spectrum of 2-47.

192
Chapter 3 NMR Spectra:
1H NMR spectrum of 3-11.
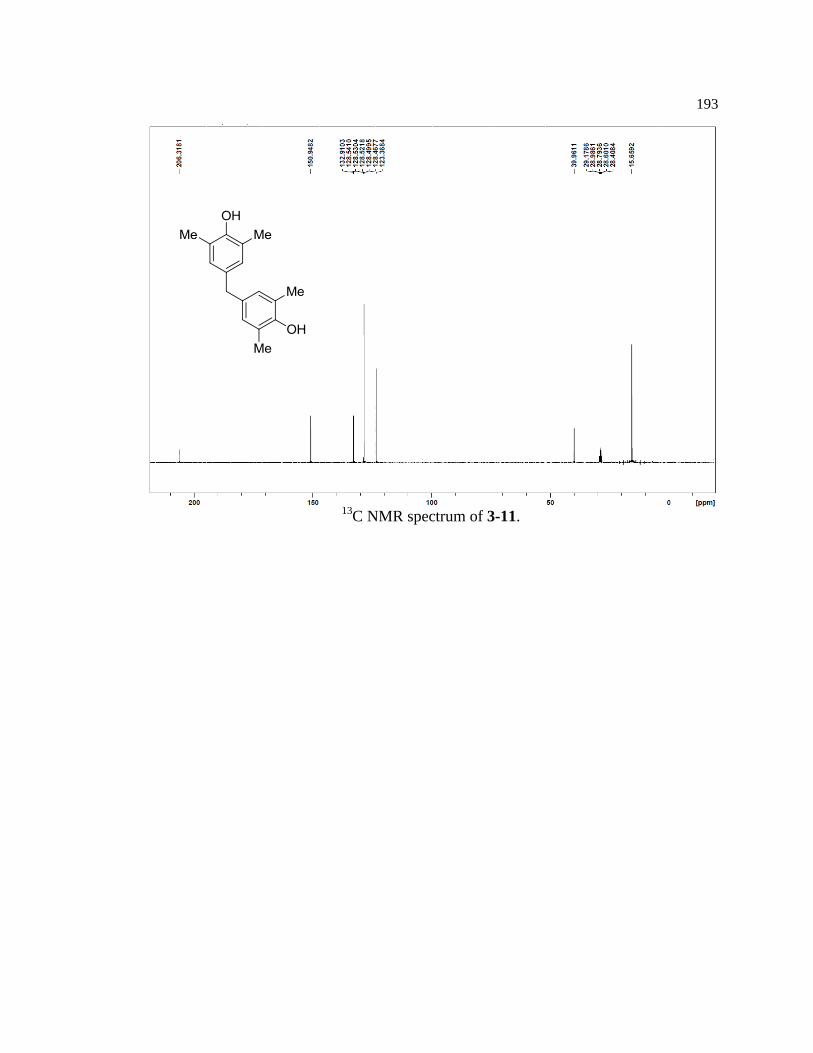
193
13
C NMR spectrum of 3-11.

194
1H NMR spectrum of 3-12.

195
13
C NMR spectrum of 3-12.

196
1H NMR spectrum of 3-7.

197
13
C NMR spectrum of 3-7.
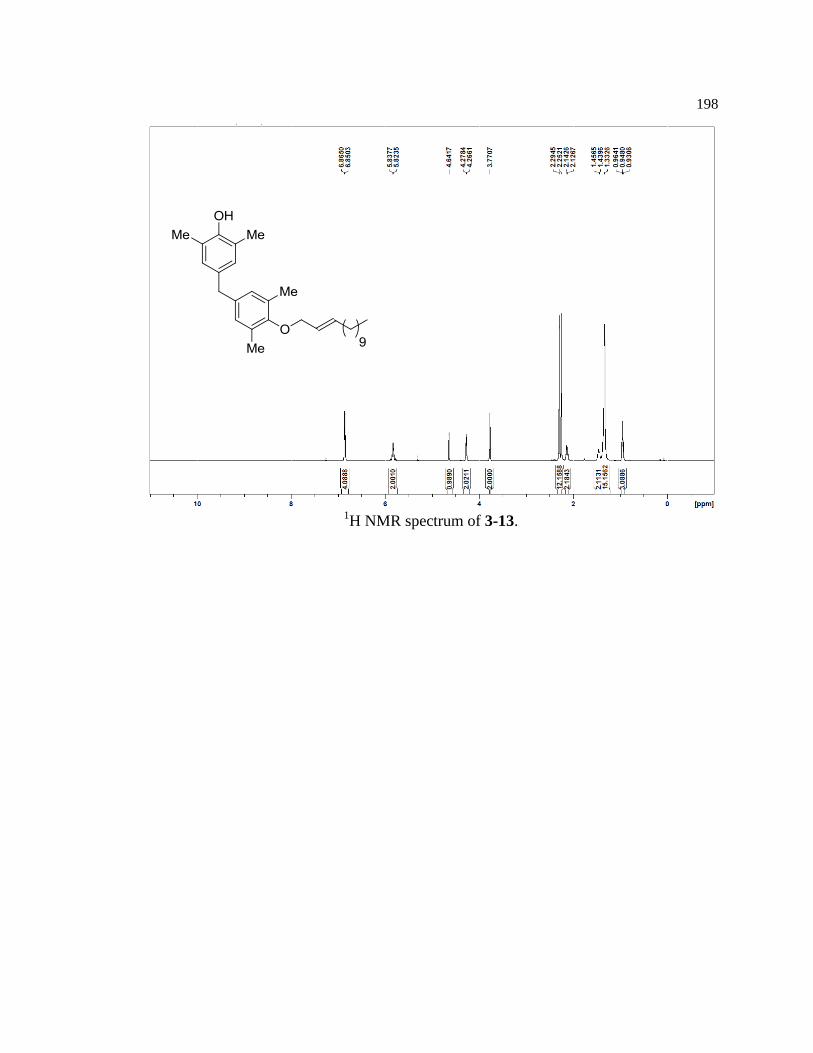
198
1H NMR spectrum of 3-13.

199
13
C NMR spectrum of 3-13.

200
1H NMR spectrum of 3-8.
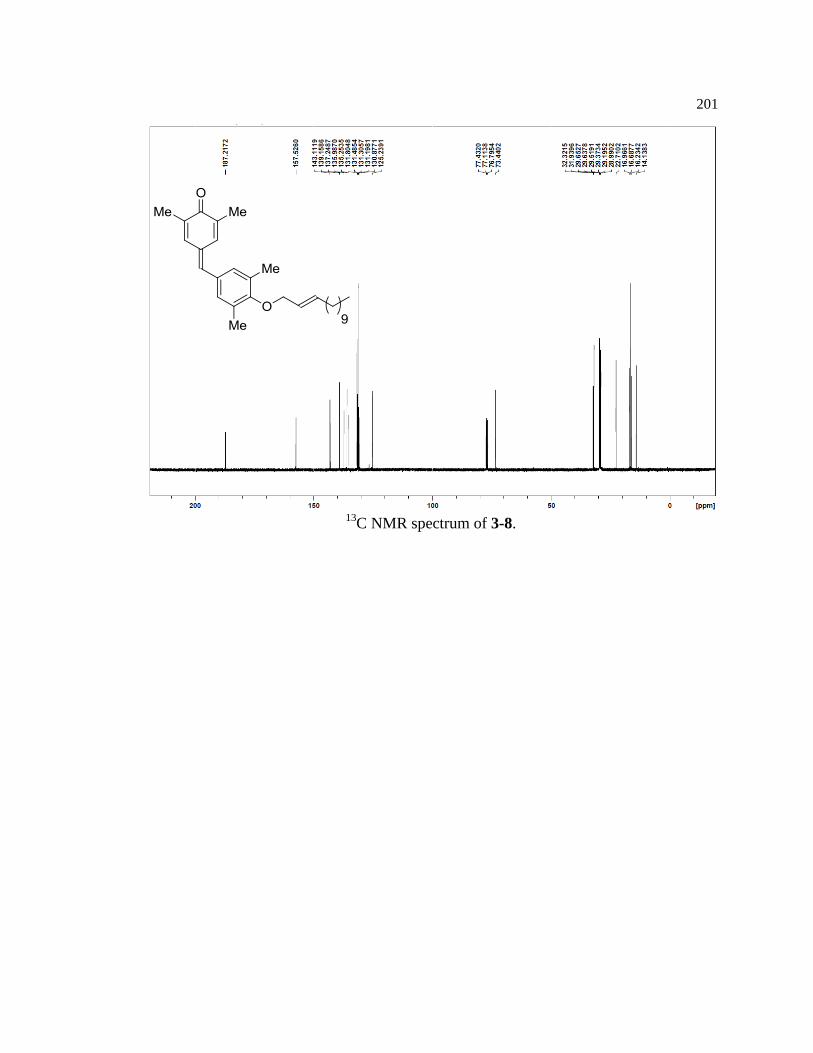
201
13
C NMR spectrum of 3-8.

202
1H NMR spectrum of 3-15.

203
13
C NMR spectrum of 3-15.

204
1H NMR spectrum of 3-16.

205
13
C NMR spectrum of 3-16.

206
1H NMR spectrum of 3-17.

207
13
C NMR spectrum of 3-17.

208
1H NMR spectrum of 3-9.

209
13
C NMR spectrum of 3-9.

210
1H NMR spectrum of 3-4.

211
1H NMR spectrum of 3-5.

212
1H NMR spectrum of 3-18.

213
1H NMR spectrum of 3-6.

214
1H NMR spectrum of 3-22.

215
13
C NMR spectrum of 3-22.

216
Appendix B
Data Tables for Kinetics Experiments
Data for Chapter 1:
The data tables below are labeled with a letter corresponding to each product within the
autocatalytic reaction of each reagent. The internal standard is abbreviated “IS”.
1-15:
1-16:
1-17:

217
LCMS data for mechanistic studies of 1-15, 1-16, and 1-17:
(1-15).
(1-16).
time (h) A int B int IS int
0 5162 0 2345
1 6353 349 3030
2 5376 470 2701
3 5063 722 2804
4 4754 1187 2898
5 3896 1507 2915
6 3232 2168 3245
7 2569 2540 3331
8 1939 2802 3436
9 1434 2862 3413
10 972 2786 3396
11 759 2920 3466
12 558 2769 3444
13 314 3810 4361
time (h) A int B int C int IS int
0 1375 6557.7 0 0
1 1462.6 6458.1 312.5 0
2 1565.8 6235.3 791.8 0
3 1471.9 4877.4 1537.7 120.1
4 1530.2 3275.3 2522.6 496.7
5 1596.9 1975.1 2728.3 1021.6
6 1687.3 962 2334.5 1629.4
7 1676.8 465 1582.8 1732.3
8 1701 185.3 1010.2 1749.6
9 1799.7 91 619.6 1543.8
10 1817.5 0 361.2 1308.9

218
(1-17).
UV/Vis data for kinetic studies (100 mM)
(1-15).
time (h) A int B int C int D int IS int
0 - - - - -
1 16131.6 4403.8 460.1 0 3551.6
2 8657.7 7642 2355.1 283.1 3449.9
3 3487.6 7330.4 5631.8 1464.3 4020.5
4 643.9 2660.1 4605.4 2635.4 3790.7
5 110.1 729.5 2363.3 2562.6 3839.1
6 0 382.3 851.7 1903.8 4323.3
7 0 0 420.9 1426.9 4856.1
time (h) A (Avg) St Dev
0 0.051 0.002
1 0.093 0.006
2 0.146 0.008
3 0.234 0.002
4 0.338 0.018
5 0.452 0.003
6 0.600 0.019
7 0.715 0.006
8 0.777 0.030
9 0.835 0.011
10 0.861 0.010
11 0.875 0.046
12 0.910 0.013
13 0.917 0.030
time (h) A (Avg) St Dev
0 0.000 0.002
1 0.049 0.006
2 0.110 0.008
3 0.213 0.002
4 0.334 0.018
5 0.467 0.003
6 0.639 0.019
7 0.773 0.006
8 0.845 0.030
9 0.912 0.011
10 0.943 0.010
11 0.959 0.046
12 1.000 0.013
13 1.008 0.030
Experimental Data Normalized Data

219
(1-16).
(1-17).
(1-26).
time (h) A (Avg) St Dev
0 0.063 0.001
1 0.155 0.018
2 0.313 0.017
3 0.629 0.021
4 1.032 0.015
5 1.378 0.061
6 1.556 0.037
7 1.583 0.065
8 1.541 0.079
Experimental Data
time (h) A (Avg) St Dev
0 0.000 0.001
1 0.060 0.018
2 0.165 0.017
3 0.373 0.021
4 0.638 0.015
5 0.865 0.061
6 0.982 0.037
7 1.000 0.065
8 0.972 0.079
Normalized Data
Experimental Data
time (h) A (Avg) St Dev
0 0.115 0.068
1 0.251 0.055
2 0.681 0.031
3 1.261 0.039
4 1.655 0.096
5 1.823 0.033
6 1.800 0.067
time (h) A (Avg) St Dev
0 0.000 0.068
1 0.080 0.055
2 0.331 0.031
3 0.671 0.039
4 0.902 0.096
5 1.000 0.033
6 0.986 0.067
Normalized Data
time (h) A (Avg) St Dev
0 0.796 0.030
2 0.906 0.014
3 0.954 0.022
4 1.078 0.023
5 1.131 0.028
6 1.330 0.017
7 1.389 0.089
8 1.518 0.098
9 1.564 0.154
10 1.588 0.082
11 1.638 0.083
12 1.639 0.095
Experimental Data
time (h) A (Avg) St Dev
0 0.000 0.030
2 0.131 0.014
3 0.187 0.022
4 0.335 0.023
5 0.398 0.028
6 0.633 0.017
7 0.704 0.089
8 0.857 0.098
9 0.912 0.154
10 0.940 0.082
11 0.999 0.083
12 1.000 0.095
Normalized Data

220
Data for Chapter 2:
NMR Data for kinetics studies of 2-23:
(2-23): Response to 1 equiv piperidine in CDCl3.
Integration is recorded through integrating the furan benzylic peak (4.92 ppm) w/r/t TMS.
(2-23): Control study in CDCl3
Integration is recorded through integrating the furan benzylic peak (4.92 ppm) w/r/t TMS.
time (h) Integration Reagent
remaining
0 1.14 100.0%
0.25 1.06 93.0%
0.5 0.97 85.1%
0.75 0.91 79.8%
1 0.86 75.4%
1.5 0.74 64.9%
2 0.66 57.9%
3 0.54 47.4%
4 0.47 41.2%
6 0.34 29.8%
8 0.27 23.7%
10 0.2 17.5%
18 0.1 8.8%
27 0.05 4.4%
36 0.02 1.8%
time (h) Integration Reagent
remaining
0 1.1 100.0%
1 1.1 100.0%
2 1.08 98.2%
4 1.02 92.7%
8 0.92 83.6%
18 0.44 40.0%
27 0.22 20.0%
36 0.07 6.4%

221
NMR Data for kinetics studies of 2-24:
(2-24): Response to 1 equiv piperidine in CDCl3
Integration is recorded through integrating the furan benzylic peak (4.91 ppm) w/r/t TMS.
(2-24): Control study in CDCl3
Integration is recorded through integrating the furan benzylic peak (4.91 ppm) w/r/t TMS.
time (h) Integration Reagent
remaining
0 0.99 100.0%
1 0.87 87.9%
2 0.65 65.7%
4 0.47 47.5%
6 0.37 37.4%
8 0.31 31.3%
10 0.26 26.3%
12 0.21 21.2%
24 0.12 12.1%
28 0.09 9.1%
36 0.07 7.1%
48 0.06 6.1%
132 0.02 2.3%
time (h) Integration Reagent
remaining
0 0.99 100.0%
1 0.98 99.0%
2 0.94 94.9%
4 0.91 91.9%
6 0.88 88.9%
8 0.84 84.8%
10 0.81 81.8%
12 0.76 76.8%
24 0.66 66.7%
28 0.6 60.6%
36 0.57 57.6%
48 0.46 46.5%
132 0.12 12.2%

222
NMR Data for kinetics studies of 2-39:
(2-39): Response to 1 equiv piperidine in CDCl3
Integration is recorded through integrating the furan benzylic peak (5.11 ppm) w/r/t TMS.
time (h) Integration Reagent
remaining
5 1.1 100.0%
30 1.1 100.0%
60 1.08 98.2%
150 1.04 94.5%
240 0.98 89.1%
360 0.94 85.5%
480 0.87 79.1%
600 0.84 76.4%
720 0.81 73.6%
840 0.75 68.2%
1260 0.68 61.8%
1740 0.6 54.5%
2280 0.5 45.5%
2820 0.44 40.0%
4320 0.33 30.0%

223
(2-39): Response to 5% piperidine in CDCl3
a) Integration recorded by integrating the furan benzylic peak (5.11 ppm) w/r/t TMS.
b) Integration recorded by integrating the triplet peak corresponding to the 3-position of
free phenol (7.20 ppm) w/r/t TMS.
a) b)
time (h) Integration Reagent
remaining
0.08 1.2 100.0%
0.17 1.15 95.8%
0.5 1.08 90.0%
1 0.93 77.5%
1.5 0.71 59.2%
2 0.63 52.5%
2.5 0.55 45.8%
3 0.47 39.2%
3.5 0.39 32.5%
4 0.34 28.3%
5.5 0.23 20.0%
6.5 0.14 13.0%
12.5 0.02 2.2%
14.5 0.01 1.4%
time (h) Integration Phenol
released
0.08 0 0.0%
0.17 0.03 2.5%
0.5 0.07 5.9%
1 0.11 9.3%
1.5 0.14 11.9%
2 0.19 16.1%
2.5 0.22 18.6%
3 0.2 16.9%
3.5 0.24 20.3%
4 0.26 22.0%
5.5 0.33 28.0%
6.5 0.37 31.4%
12.5 0.58 49.2%
14.5 0.65 55.1%
16.5 0.76 64.4%
18.5 0.81 68.6%
20.5 0.86 72.9%
22.5 0.93 78.8%
24.5 0.96 81.4%
26.5 1 84.7%
28.5 1.05 89.0%
39 1.16 98.3%
49 1.18 100.0%

224
(2-39): Response to 10% piperidine in CDCl3
a) Integration recorded by integrating the furan benzylic peak (5.11 ppm) w/r/t TMS.
b) Integration recorded by integrating the triplet peak corresponding to the 3-position of
free phenol (7.20 ppm) w/r/t TMS.
a) b)
time (h) Integration Reagent
remaining
0.08 1.38 100.0%
0.17 1.3 94.2%
0.25 1.12 81.2%
0.33 0.97 70.3%
0.50 0.77 55.8%
0.75 0.65 47.1%
1.00 0.57 41.3%
1.25 0.52 37.7%
1.50 0.31 22.5%
1.75 0.27 19.6%
2.00 0.19 13.8%
2.25 0.15 10.9%
2.50 0.13 9.4%
2.75 0.07 5.1%
3.00 0.04 2.9%
5.00 0.01 0.7%
time (h) Integration
Phenol formed
0.08 0 0.0%
0.17 0.03 2.5%
0.50 0.07 5.9%
1.00 0.11 9.3%
1.50 0.14 11.9%
2.00 0.19 16.1%
2.50 0.22 18.6%
3.00 0.2 16.9%
3.50 0.24 20.3%
4.00 0.26 22.0%
5.50 0.33 28.0%
6.50 0.37 31.4%
12.50 0.58 49.2%
14.50 0.65 55.1%
16.50 0.76 64.4%
18.50 0.81 68.6%
20.50 0.86 72.9%
22.50 0.93 78.8%
24.50 0.96 81.4%
26.50 1 84.7%
28.50 1.05 89.0%
39.00 1.16 98.3%
49.00 1.18 100.0%

225
Data for Chapter 3:
Contact Angle Data
AFM Data
3-4 3-5 3-6
1 93.0 95.7 69.7
2 95.3 95.7 69.5
3 93.3 97.5 70.0
Average (°) 93.9 96.3 69.7
Standard deviation (°)
1.3 1.0 0.3
3-4 3-5 3-6
1 1375.0 26.3 30.7
2 1341.0 29.3 33.7
3 1194.0 32.8 33.6
Average (MPa) 1303.3 29.5 32.7
Standard deviation (MPa)
96.2 3.3 1.7

226
VITA
Travis J. Cordes
Travis J. Cordes was born and raised in Omaha, Nebraska and graduated from
Ralston High School in 2006. He then attended Iowa State University, and in 2008 he
began his undergraduate research career with Professor Don Beitz in the Department of
Animal Science. Working with Dr. Jon Schoonmaker, he did chemical analysis of beef
and milk samples to study the correlation between the diets of farm animals and the
healthfulness of the food products they provide. In 2009 he joined the lab of Professor
George Kraus in the Department of Chemistry, where he participated in research within
the National Science Foundation Engineering Research Center for Biorenewable
Chemicals. Here, he applied chemical catalysis to develop new strategies for converting
biomass into relevant industrial chemicals. For his work at Iowa State, he was twice
awarded the Glen A. Russell Memorial Scholarship for excellence in organic chemistry.
He graduated cum laude in 2010 with a B.S. degree in chemistry and a minor in
mathematics. Upon graduation, he enrolled as a graduate student in the Department of
Chemistry at Penn State University and joined the la of Professor Scott Phillips. Travis’
graduate research spanned a variety of methods for signal amplification, including
autocatalysis, depolymerizable polymers, and mechanoresponsive materials. In the fall of
2016, he will begin a career at PPG Industries in Cincinnati, Ohio as a Polymer
Development Chemist in the Packaging Coatings division.