Embed Size (px)
Citation preview

1
DESIGN AND SIMULATION OF A SOLAR PV SYSTEM
FOR BRAC UNIVERSITY
Shaika Tamanna Eshita;ID:09221111
Alima Hossain;09221198
Md.Ovik Raihan;Id:09221118
Department of Electrical and Electronics
December, 10
BRAC University, Dhaka, Bangladesh

2
Table of Contents
Declaration……………………………………………………… . 5
Acknowledgement ……………………………………………… 6
1.0 Objective…………………………………………………………7
2.0 Overview………………………………………………………... 7
2.1 Why use solar power……………………………………….. 7
2.2 Works on Solar Technologies Around the World…………8
2.3 Potential of solar energy ……………………………………. 10
2.4 Solar Panel…………………………………………………... 10
2.5 Types of Solar System Design ………………………………11
3.0 Solar PV Technologies ………………………………………….. 11
4.0 Components of Solar PV System ……………………………… 12
4.1 Charge Controller …………………………………………..12
4.2 Battery …………………………………………………….. 12
4.3 Inverter …………………………………………………........ 13
5.0 Load Survey of BRAC University ……………………………… 13
5.1 BRAC University’s electrical Energy Consumption ……… 13

3
5.1.1 BRAC University’s Monthly Electricity Consumption ... 13
5.2 Site Survey………………………………………………………. 16
5.2.1 Dimensional Measurement of BRAC University ………… 16
5.2.2 Irradiance and Insolation …………………………………. 21
6.0 BRAC University Solar PV System Design ………………….. 22
6.1 System Configuration …………………………................... 22
6.2 PV Module Selection ……………………………………… 24
6.3 Inverter Selection …………………………………………. 25
6.4 Combiner Box Selection …………………………………… 26
6.5 Mounting …………………………………………………… 27
6.6 System Sizing ……………………………………………… 29
6.6.1 Number of Module Selection ……………………………… 29
6.6.2 PV Array Designing …………………………………… 30
6.6.3 Number of Inverter Calculation ……………………… 31
6.6.4 Number of Combiner Box ……………………………… 31
6.6.5 Wiring .......……………………………………………… 31
6.6.6 Proposed Mounting for BRAC university… …………… 32
6.6.7 Energy Supplied By the Proposed PV Solar System.…… 32
7.0 Design Simulation ……………………………………………… 33
7.1 Simulation Results. ………………………………………… 36

4
7.2 System Capacity .…………………………………………… 41
7.3 Comparison of Results ..……………………………………… 42
8.0 Cost Calculation ………………………………………………… 42
9.0 Per Unit Energy Cost.. …………………………………………… 43
10. Conclusion ………………………………………………………… 44
11. Further Works ……………………………………………………………….. 44

5
DECLARATION
We hereby declare that the thesis titled “DESIGN and Simulation of a Solar PV
System for BRAC University” submitted to the Department of Electrical and
Electronics, Dhaka , in partial fulfillment of the Bachelor of Science in Electrical and
Electronics Engineering, is our original work and was not submitted elsewhere for the
award of any other Degree or Diploma or any other Publication.
Dhaka, Date: 8th December 2010
SUPERVISOR
Dr. ABDUL HASIB CHOWDHURY
Associate Professor, Department of
Electrical and Electronics Engineering,
BUET
SHAIKA TAMANNA ESHITA
Student ID:09221111
ALIMA HOSSAIN
Student ID:09221198
Md. OVIK RAIHAN
Student ID:09221118

6
Acknowledgement
We would like to express our sincere and firm gratitude and pay a lot of thanks to our
honorable thesis supervisor Dr. Abdul Hasib Chowdhury, Professor, Department of
Electrical and Electronics Engineering for his constant supervision to carry out the thesis.
He extended his helping hand by providing us encouragement, inspiration, facilities and
valuable feedback throughout the course of this thesis.

7
1.0 Objective
The objective of our work is to design a grid connected solar PV system for the BRAC
University campus.
2.0 Overview
2.1 Why use solar power
The main sources of world’s energy generation are the fossil fuels (gas, oil, coal) and
nuclear power plants. Due to the usage of fossil fuels, green house gases (CFC, CH4, O3,
but mainly CO2) emit into the atmosphere. From the nuclear power plant, carbon is
released in a small amount (90 grams equivalent of carbon dioxide per kilowatt hour). [1]
But the radioactive waste remains active over thousand years which is a potential source
of environmental pollution.
Figure1. Sources of carbon dioxide emissions [2]
Figure1 shows that electricity generation is source of the highest emission of carbon
dioxide. So, production of this clean energy is actually contributing the highest towards
global warming. Global warming as well as the environmental pollution is, in our times,
the greatest environmental threat to human being.
On the other hand, there is an alarming energy crisis world wide as fossil fuel reserves
decrease and the ageing power plants are going to close in near future.
From the aspect of global warming and shortage of natural gas, scientists and engineers
are looking for clean, renewable energies. Solar energy is the one of the best options.
Because the earth receives 3.8 YJ [1YJ = 1024
J] of energy which is 6000 times greater
than the worlds consumption. [3]
Bangladesh is facing an acute shortage of energy. Natural gas is the main source of

8
electricity generation in Bangladesh. But the limited gas reserves cannot fulfill the
necessities of both domestic requirements and industrial and commercial demands,
especially demands for electricity generation for long.
Our present power generation capacity is only around 4200 MW whereas the total power
requirement is 6000 MW. [4] So, we are able to generate only 70% of our total electricity
demand. Due to this shortage of electricity not only we are facing load shedding across
the country but also the industrial sector is badly affected. Resulting in reduced industrial
output and diminished export earnings.
There is a rising demand on the energy sector for rapid industrialization, urbanization,
high population growth, increasing food production, rising standard of living etc. Solar
energy could be a major source of power generation in Bangladesh.
Bangladesh government plans to make it mandatory to install solar panel on rooftops of
every multistoried and hi-rise building. As solar energy is one of the cleanest and
simplest forms of energy, we can hope to find.
Solar energy is readily available anywhere and everywhere in the earth. It can be used it
to generate electricity at the point of consumption. Solar powered building is based on
this concept.
Considering the above aspects, solar power option for the BRAC University campus is
being studied in this work.
2.2 Works on solar technologies around the world
There are huge works, research, thesis, implementation, design consideration and
Improvement on solar technologies is going on around the world as well as in our
country. That is why we have more than 35 [5] company doing business, implementation
and research on solar technologies.
University students around the globe working with solar system. Like A group of
students of Ahsanullah University of science and technology designed a solar system for
their university .
A group of students of the Pennsylvania State University has designed and simulated a
Distributed photovoltaic system for their university as their thesis. Again Rajamangala
University ofTecnology Thanyaburi of Thailand installed pv system for their university
to promote solar energy project.
Scientist working on developing the solar panels, like scientist of korea and California
has develop a new way of boosting the efficiency of plastic solar panels [6]. By this they
make it more competitive to traditional solar panels. Commercial buidings, houses,
offices, companies are installing solar system for green energy. Such as the largest solar

9
powered building in Dezhou, Shangdong Province in northwest China [7].
Figure 2. The largest solar power building in northwest china
The above picture is the largest solar powered building and it will be the venue of the 4th
world solar city congress.
We can also see 100% solar powered buildings. Like the stadium for the world game
2009 in Taiwan was 100% solar powered.
Figure 3: 100% solar powered stadium in Taiwan.

10
The fig 3 shows that the 100% solar powered building in Taiwan. It has 8,840 solar
panels in the roof and can produce 1.14 million kWh/year. By this it can prevent 660 tons
of carbon dioxide to release in the environment [8].
Many works like research, improvement etc on solar technologies is going on around the
world and in our country as well. Solar energy is mainly site based with some key factors.
Site and load based: The solar power is site or location based. Solar power is designed
and supplied from a particular location to a particular consumer/s. Such as- a house or
apartment can use its rooftop, lawn, garden etc to implement their solar system to get the
desired power. Beside a solar power plant is designed for a particular amount of load,
such as-Sarnia Photovoltaic Power Plant of Canada can deliver 80 MW of power [9],
Olmedilla Photovoltaic Park of Spain can deliver 60 MW of power [10].
2.3 Potential of solar energy
There is a huge potential of solar energy. It is so huge that the total energy needs of the
whole world can be fulfilled by the solar energy. The total energy consumption of the
whole world in the year 2008 was 474 exajoule(1EJ=1018
J) or approximately
15TW(1.504*1013
W). [11] Almost 80%-90% of this energy came from fossil fuel. [12]
From the sun earth receives 3,850,000 EJ of energy. [11] Which is equivalent to 174
petawattas (1 PW=1015
W). The earth does not hold all the energy, a part of it reflects
back. After reflection earth receives 89 PW of energy. Of this huge amount only less than
0.02% is enough to replace the fossil fuel and nuclear power supply in the whole world at
present. By this we can easily understand the great potential of solar energy. Considering
green house effect, other environmental impact, cost, risk and availability solar energy
has the greatest potential among all the energy sources.
2.4 Solar panel
Solar panels produce electricity from sunlight. The first solar panel-powered satellite was
launched in 1958 by Hoffman Electronics.
A solar panel consists of number of photovoltaic (PV) solar cells connected in series and
parallel. These cells are made up of at least two layers of semiconductor material (usually
pure silicon infused with boron and phosphorous). One layer has a positive charge; the
other has a negative charge. When sunlight strikes the solar panel, photons from the light
are absorbed by the semiconductor atoms, which then release electrons. The electrons,
flowing from the negative layer (n-type) of semiconductor, flow to the positive layer (p-
type), producing an electrical current. Since the electric current flows in one direction
(like a battery), the electricity generated is DC.
11
2.5 Types of solar system design:
There can be various types of solar system design. But there are three basic design
consideration, they are-
1. Grid tie
2. Off-grid
3. Stand alone
3.0 Solar PV technologies
With the growing demand of solar power new technologies are being introduced and
existing technologies are developing. There are four types of solar PV cells:
Single crystalline or mono crystalline
Multi- or poly-crystalline
Thin film
Amorphous silicon
Single-crystalline or mono crystalline: It is widely available and the most efficient cells
materials among all. They produce the most power per square foot of module. Each cell
is cut from a single crystal. The wafers then further cut into the shape of rectangular cells
to maximize the number of cells in the solar panel.
Polycrystalline cells: They are made from similar silicon material except that instead of
being grown into a single crystal, they are melted and poured into a mold. This forms a
square block that can be cut into square wafers with less waste of space or material than
round single-crystal wafers.
Thin film panels: It is the newest technology introduced to solar cell technology.
Copper indium dieseline, cadmium telluride, and gallium arsenide are all thin film
materials. They are directly deposited on glass, stainless steel, or other compatible
substrate materials. Some of them perform slightly better than crystalline modules under
low light conditions. A thin film is very thin-a few micrometer or less.
Amorphous Silicon: Amorphous silicon is newest in the thin film technology. In this
technology amorphous silicon vapor is deposited on a couple of micro meter thick
amorphous films on stainless steel rolls. [13] Compared to the crystalline silicon, this
technology uses only 1% of the material.
Table 1 below shows the efficiency of different types of solar cells.

12
Table1. Efficiency of different types of solar cells
Cell type Efficiency, %
Mono crystalline 12 – 18
Polycrystalline 12 – 18
Thin film 8 – 10
Amorphous Silicon 6 – 8
4.0 Components of a solar PV system
A typical solar PV system consists of solar panel, charge controller, batteries, inverter
and the load. Figure 2 shows the block diagram of such a system.
Figure 4. Block diagram of a typical solar PV system
4.1 Charge controller
When battery is included in a system, the necessity of charge controller comes forward. A
charge controller controls the uncertain voltage build up. In a bright sunny day the solar
cells produce more voltage that can lead to battery damage. A charge controller helps to
maintain the balance in charging the battery. [14]
4.2 Batteries
To store charges batteries are used. There are many types of batteries available in the
market. But all of them are not suitable for solar PV technologies. Mostly used batteries
are nickel/cadmium batteries. There are some other types of high energy density batteries
such as- sodium/sulphur, zinc/bromine flow batteries. But for the medium term batteries
nickel/metal hydride battery has the best cycling performance. For the long term option
iron/chromium redox and zinc/manganese batteries are best. Absorbed Glass Mat (AGM)
batteries are also one of the best available potions for solar PV use. [15]
Battery system
Inverter AC power
DC power
Solar panel
Charge controller

13
4.3 Inverter
Solar panel generates dc electricity but most of the household and industrial appliances
need ac current. Inverter converts the dc current of panel or battery to the ac current. We
can divide the inverter into two categories. [16] They are-
Stand alone and
Line-tied or utility-interactive
5.0 Load survey of BRAC University
Finding out and understanding the total energy consumption of BRAC University is the
first step through designing an Energy Program for BRAC University. In this part we
observed the data of energy consumption figures and facts of BRAC University. We
collected the peak and off peak data. We analyzed the monthly load from October 2009
to September 2010.
5.1 BRAC University electrical energy consumption
Annual electrical energy consumption of BRAC University is 28,62,880 kWh. The total
off peak energy consumption is 22,80,400 kWh and the peak energy consumption is
5,82,480 kWh. Average energy monthly consumption including off peak and peak is
2,38,573 kWh. [17]
5.1.1 BRAC University monthly energy consumption
By using the data of monthly electricity bill of BRAC University we can determine the
monthly, yearly and average energy consumption by BRAC University. Beside we can
show the peak and off-peak energy consumption.
Peak-hour: peak hour is from 6pm to 11pm
Off-peak hour: off-peak hour is from 12am to 5pm
The data of monthly, monthly average and peak off-peak energy consumption BRAC
University is given bellow in table no 2

14
Table 2. Monthly electricity bill, BRAC University
Month Off peak consumption
(kWh)
Peak consumption
(kWh)
October,2009 200000 90 000
November,2009 191520 82080
December,2009 118560 60800
January,2010 148960 42560
February,2010 152000 30400
March,2010 191520 39520
April,2010 182400 39520
May,2010 207760 42560
June,2010 234080 39520
July,2010 212800 36480
August,2010 218880 39520
September,2010 221920 39520
Average 190033.33 48540
The energy consumption by BRAC University is given by the bellow bar chart
Total monthly energy consumption(kWh)
0
50000
100000
150000
200000
250000
300000
350000
oct nov dec jan feb mar apr may jun jul aug sep
months(october09-december10)
Ene
rgy
con
sum
pti
on
(Kw
h)
Figure 5. Monthly energy consumption from October 2009 to September 2010
From the above fig 5 we can see the variation of monthly energy consumption of BRAC
University. From the above figure we can see that the highest energy consumption in
October 2009 and the lowest in December 2009.

15
The chart of peak and off-peak consumption is given below:
Monthly off peak energy consumption
0
50000
100000
150000
200000
250000
oct nov dec jan feb mar apr may jun july aug sep
months(october09-December10)
Ener
gy c
on
sum
pti
on
(kW
h)
Figure 6. Monthly off-peak consumption of BRAC university
From the figure 6 we can see that the month of June has the most off –peak energy
consumption
Monthly energy consumption in peak hour
0
20000
40000
60000
80000
100000
oct nov dec jan feb mar apr may jun july aug sep
months(october09-december10)
Ene
rgy
con
sum
pti
on
(kw
h)
Figure 7. Monthly peak energy consumption of BRAC University
From the figure 7 we can see that the month of October has the most energy
consumption.

16
5.2 Site survey
5.2.1 Dimensional measurement of BRAC University building
BRAC University [BRACU] is situated at Mohakhali in Dhaka city. It is a 20 storied
building with a roof area of 5500 sq-feet. The height of this building is approximately
226 feet. The latitude and longitude of BRAC university building is 23.780 and 90.41
0
respectively. [18] The building is north facing and makes an angle of 20 degrees with the
North. Figure 4 shows the roof top and 3D rendering of the BRAC University building.
Figure 8. Front look of BRAC University showing building1 and building 2

17
Figure 9. Showing the orientation (200 N
) and total roof top area
(from satellite over
view
Figure 10. Actual view of the roof top of BRAC University

18
Figure 8 we see building 1(University Building) and building 2(Aarong House) of BRAC
University. In our site Survey we have seen that building 1 in not suitable for installing
solar panel. Because it is a 5 storied building and building 2 which is a 20 storied
building standing behind this. So the shadow of building 2 is covering the whole roof of
building 1 all day long. Considering this facts we selected building 2 to use to implement
the solar panels.
Figure 9 is showing the 3-D picture of the roof top of building 2 taking from
satellite.[18]. The figure is showing the building orientation which is 200
with north. The
length of the roof top is 29.55m and the width is 17.84m. So the total area is 527.127 m2.
We considered 20% of this area for lift control room and towers etc. So, finally excluding
those 20% area we get 421.70 m2.
Figure 10 is showing the actual view of BRAC University roof top. The area of the actual
roof top is 510.96 m2. Now there is 3 lift Control room in the roof, some towers are
covering the whole roof. The lift control rooms, one of them is in the left side ,one in the
right side and another is in the middle of the roof. So, it is not possible to implement solar
panel on this roof. To solve this situation we thought to go for mounting. Excluding the
20% of total area, actually we have 408m2
to use for installation of solar panel.

19
.
Figure 11. The Southern (back side) side showing 3D picture of the horizontal and
vertical pillar from satellite
Fig. 11. is showing the 3-D picture of the building 2.Here indicating the horizontal and
vertical pillars. From this calculation we see one big vertical pillar, 4 small vertical
pillars. There are 28 horizontal pillars also. The length of big pillar is 48.96 m.(from 6
story to 20 story) and the width is 3.39m. The width of small vertical pillar is .47m and
length is 48.96m. Horizontal pillar’s length is 4.9m and width is .86 m . So,the total area
we are getting is 376.012m2.

20
Figure 12. Photograph of the back side of the building (south face) showing the
horizontal and vertical pillars.
Figure 12. is showing the actual view of horizontal and vertical pillar. It is showing one
big vertical pillar and six small vertical pillars. But we are taking four pillars under our
consideration. Because other two pillars are not usable. There are 28 horizontal pillars
between the big and small pillars. The actual length of the vertical pillar is 48.76m and
the width is 3.165m.The length of small vertical pillar is 48.76m and width is .589m. The
length of horizontal pillar is 4.648m and width is .85 m.
Now the total area of roof top and facade can be presented in a table:
Table 3. Theoretical and Practical measurement of usable area
Names of places Area calculated by Google earth (m2)
Actual area(m2)
Big pillar 165.97 154.53
Small pillar 92.04 114.932
Horizontal pillar 117.96 110.622
Roof top 421.70 408
Total 797.67 788.5
So, the total usable area 788.5 sq. meters.

21
5.2.2 Irradiance and insolation
Insolation: Insolation is the amount of solar energy that strikes a given area over a
specific time and varies with latitude or the seasons [19].
Irradiation: Irradiance means the amount of electromagnetic energy incident on the
surface per unit time per unit area. so the total solar irradiation is defined as the amount
of radiant energy emitted by the sun over all wavelengths that falls each second on 1m2
(11 ft2) outside earth’s atmosphere [19]
Irradiance of a site is given by the following relation:
2/, mkWhhourssunshinebrightdailyAverage
InsolationAverageIrradiance
It is very important to know the irradiation and insolation of a site when anyone is going
to design a solar PV system for that site. Depending on the sun shine, irradiance and
insolation varies with place to place.
The irradiance of the Dhaka city can be calculated from Tables 3 and 4.
Table 4. Monthly global solar insolation in Dhaka city
Month Solar Insolation
kWh/m2
January 5.47
February 5.91
March 6.00
April 5.85
May 5.23
June 4.55
July 4.18
August 4.60
September 4.94
October 5.44
November 5.34
December 5.38
Average 5.24

22
Table 5. Daily average bright sunshine hours in Dhaka city
Month Daily Mean Minimum Maximum
January 8.7 7.5 9.9
February 9.1 7.7 10.7
March 8.8 7.5 10.1
April 8.9 7.8 10.2
May 8.2 5.7 9.7
June 4.9 3.8 7.3
July 5.1 2.6 6.7
August 5.8 4.1 7.1
September 6.0 4.8 8.5
October 7.6 6.5 9.2
November 8.6 7.0 9.9
December 8.9 7.4 10.2
Average 7.55 6.03 9.13
The daily average bright sunshine hours in Dhaka city is 7.55 hours and the average solar
insolation is 5.24 kWh/ m2
From formula, we get the irradiance of Dhaka city is 694.04 watt/m2
. This value will be
used for BRACU solar PV system design.
6.0 BRAC University solar PV system design
6.1 System configurations
There are many poosible configurations of solar PV system. Each of these configurations
has its own advantages and disadvantages. Depending on the system requirements
appropriate system configurations has to be chosen. In our work, at first we considered
two possible configurations for BRACU campus. The first one is grid connected solar PV
system without battery (Figure 13 (a)) and the second one is stand alone solar PV system
with battery (Figure 13 (b)).

23
(a) (b)
Figure 13. (a) and (b) possible configurations of solar PV system for BRAC
University
Figure (a): The block diagram (a) shows the design configuration where the solar panels
will be connected to inverters, then the from the inverter current will be supplied to the
university’s bus bar then to the load.
Figure (b): The block diagram (b) shows a design configuration that can both supply and
store energy. When the demand is high the then the system will deliver energy same as
the block diagram (a) as described. But when the demand is low or in a off day the
battery can store energy by solar panel through charge controller. This stored energy can
be used as backup for gloomy day or at night.
But we need huge amount of energy to run the University. Monthly average energy
consumption of BRAC University is 238,573.33 kWh and we can theoretically produce
19335.607 kWh per month.
Solar panel
Inverter
Bus bar
Load
Solar
Panel
Load
Bus bar
Battery
Charge
controller
Inverter Inverter

24
At 694.04 W/m2
insolation the selected PV module can produce = 173.51 W
Daily average bright sunshine hour = 7.55
Total no. of modules = 492
So, the monthly energy generation = 173.51*7.55*492*30
= 19335.607 kwh/month
As this is a huge difference with the University’s monthly energy consumption we can
not store extra energy.
Therefore, we choose the block diagram (a) for our proposed system.
6.2 Selecting the PV module
As we need huge power supply and we do not have huge area. So, we selected mono
crystalline silicon module. Our module selection depends on cost and efficiency.
The capital investment of solar PV panel is very high. Approximately, 60% of the total
system installation cost is the price of module cost. We should consider the cost in order
to get the best output of the money spent. Cost varies on efficiency of panel and the
material has been used to make the PV panel. The cost of silicon solar cell is very high.
In our design we used mono crystalline silicon cell.
Efficiency of solar cell depends on the technology used. Silicon solar cell has the highest
efficiency. Thin film has low efficiency, but they can be ideal for some applications.
Another important consideration is temperature. Module efficiency decreases as the
module temperature increases. When modules operating on roof, it heats up substantially.
Cell inner temperature reaches to 50-70 degree Celsius. In high temperature areas, it is
better to choose a panel with low temperature co-efficient.
Considering the above factors, we have selected a module of Samsung brand.

25
Figure 14. Samsung LPC250S solar module
Fig. 14 shows the Samsung solar module and the model is LPC250S. Its maximum output
power is 250 watt. If irradiance is 1000 watts per meter square then the module’s nominal
power output is 200 watt if irradiance is 800 watts per meter square. The irradiance of
Dhaka City is 694.04 watts per meter square. So we will get power less than 200 watts,
approximately 173.51 watts. 25 years power output warranty is 80%. The panel
efficiency is 15.62%. Short circuit current of the panel is 8.66A at standard test condition
and 6.90A at nominal condition. [20]
6.3 Inverter selection
Figure 15. ZONZEN ZZ-ZB 10kW grid tie inverter

26
We selected a PV grid tied inverter. The model is ZZ-ZB10kW. It is a product of
ZONZEN of China [21].
The MPPT voltage range: 100-150 V
Output power: 10kW
Connection: 50Hz grid frequency and 3 phase 4 wire connection
The efficiency of this inverter: 97%.
AC voltage: 230 Volt.
6.4 Combiner box selection
Figure 16. The SMA SCCB-10 combiner box
The model of selected combiner box is SMA SCCB-10 [22]
The no of input circuit: 12
Maximum input fuse rating: 20 A, 600V DC

27
Maximum output current: 240 A DC
6.5 Mounting
There are various types of mounting of solar panel can be done. Depending on the
location and system several types of mounting is done. They are described bellow
Pole mounting
There are 3 types of pole mounting [23]
1. Top of pole: In this type of mounting with a pole and metal rack the pv module is
installed. The base of the pole is generally concrete
2. Side of pole: Generally small PV modules are placed be side of electricity or
telephone pole
3. Tracking pole mounting: it is special type of mounting. This is done to maximize
the output of the PV module by tracking with the sun path.
Ground mounting
Solar modules can also be mounting in the ground. In case of more power needs or
insufficient space at the roof PV panels can be mount in the ground.
Building Integrated Photovoltaic (BIPV)
This is a unique kind of mounting system; the PV modules are placed on the building
surface, vertical walls and also atriums. There are huge advantage of it [24], they are-
Mounting can be done in such a way that blend with the architecture to make the
building more beautiful
It is unique and versatile
Many benefits like shedding, protection, cooling etc.
Roof mounting
Roof mounting is two type pitched roof mount and flat roof mount
Pitched-roof mounting
Roof mounting is difficult because depending in the orientation and angle, proper
mounting has to done. Need to fix the tilt angle for the optimum output.

28
We can not hope all these categories a roof can match. That is why there are 3 types of
roof mounting. They are-
1. Flush mount:
Figure17. Flush Mounting on roof
Those roof which faces south are best for this mounting. Any slope is suitable but a
steeply slope is best. Fig17 shows a flush mount PV system.
2. Angle mount:
Figure18. Angle Mounting on roof
For the roof which has lower pitch-this system is best suited. Fig18 shows a angle
mount pv system.
3. Fin Mount:

29
Figure19. Fin mounting on roof
Flat roof mounting: In this category there are three steps of mounting, they are-
1. Attached: This category need penetration and connection to the franing
2. Ballasted: In this category it does not need penetration, without this it can
withstand 90 mph of wind [25].
Hybrid: It is combination of ballasted and structural system. The concept of hybrid
system is less penetration and more ballast or vice versa.
6.6 System sizing
In this section we will select the number of PV module can be installed in the selected
area. The no. of inverter, combiner box and other equipments is needed to complete the
whole designing .we will also find that.
6.6.1 Number of module selection
The no of module can be accommodate on both roof top and facade can be calculated by
the following formula,
No. of module accommodation =Total usable area/area of a selected PV module
By using this formula we get

30
Table 5. Possible number of modules using rooftop and façade area
Panel installation
location
Usable
area(m2)
No. of
modules
Roof top 408 252
Facade 380.50 240
Total 788.50 492
6.6.2 PV array designing
To design the array there are some parameter to check. The most important thing to
choose proper inverter and combiner box. So that, they can withstand the PV modules’
voltage and current.
ZONZEN ZZ-ZB 10kW inverter’s MPPT voltage range = 100-500 V
SAMSUNG LPC250S module’s open circuit voltage = 37.6 V
12 module in series = 37.6* 12
= 451.2 V
This is within the inverter’s MPPT voltage range. We didn’t put more module due to
safety.
Module’s maximum power voltage = 30.9 V
Inverter MPPT voltage range : 100-500V.
(100-500V)/12 = 8.33-41.66 (module maximum power voltage = 30.9)
So, power maximum power voltage is in the inverter’s voltage range.
ZONZEN ZZ-ZB 10kW inverter’s current rating:
Inverter’s rated voltage = 360 V
Maximum current : (10000/360) = 27.77 A
At 694.04 W/m2
maximum short circuit current = 6.01 A
If we put 3 parallel string (1 string consist of 12 series module) = 3*6.01
= 18.03 A

31
We can not put more string, because if there rise a weather condition with low
temperature and high insolation excessive current can flow.
For safety considering 35% excessive current = 24.34 A
This is also in inverter’s capacity
SMA SCCB-10 combiner box maximum input fuse rating = 600 V , 20A
This is also can withstand 3 parallel string each consist of 12 series modules
Therefore, our chosen PV array design is 3 parallel string each consist of 12 series
modules for 1 combiner box and 1 inverter.
As we need to arrange 492 modules we need such 14 configuration
6.6.3 Number of inverter calculation
No of inverter =Total no of module/(no. of module in series in a string*no. of parallel
string)
= 492 / (12*3)
= 13.66
= 14
6.6.4 Number of combiner box
We will need combiner box is equal to the number of inverter. So, we will need 14
combiner boxes.
6.6.5 Wiring
Rated short circuit current is 8.66 A from the PV module. If there is a effect of higher
insolation and lower temperature access current can flow. To prevent these to happen the
safety factor is considered. Average insolation at Dhaka city is 694.04 W/m2
.
Therefore maximum short circuit current will be = 6.01 A
For 3 parallel string = 3*6.01
= 18.03 A
Considering 35% safety factor Maximum current rating is 25 A.

32
So, we have chosen 25A rating wiring.
6.6.6 Proposed mounting for BRAC University
There are three lift room at top of the building 2. So we have to mount our solar panel
above those three rooms. So we have to made a false roof and then have to hybrid mount
it.
Our mounting will be BIPV. Because we will use both the surface and vertical column of
southern side of BRAC university.
We have to construct a false roof for setting up our modules. From local market we are
going to purchase the materials for mounting to reduce cost.
6.6.7 Energy supplied by the proposed PV solar system
Figure 20. Designed Solar PV system

33
The figure 20 shows the designed solar system of BRAC University. This configuration
showing that there is one combiner connected with 36 PV module. 12 PV modules in
series in a string and there are 3 strings in parallel. For our system there would such 14
configuration.
The solar irradiance in Dhaka is 694.04 watt/day [ 5.2.2]. The energy supplied by the
solar PV system in a year can be found by the following formula.
Total energy supply = Maximum Power at defined irradiance of a solar panel *
Average bright sunshine hour * 365 days * total no. of solar
panels
= 173.51 * 7.55 * 365 * 492
= 235.249 MWh/year
Considering 80% of panel’s output efficiency the total energy supply = 188.39
MWh/year
The daily output energy is 515.62 kWh/day
7.0 Design simulation
For the PV system designed for BRAC University campus, we have chosen for
simulation is PVSYST software. PVSYST has several built-in mathematical models for
component such as photovoltaic module, inverter and other tools.
PVSYST gives two types of designing options as preliminary design and project design.
Using these options there are various kinds of system can be developed.
For preliminary design:
Grid connected system, stand alone and pumping – these three types of system can be
designed. Actually this is used to get a primary idea for users. There are three steps to
design a system like have to define location and system sizing (select PV module type,
technology, ventilation and mounting disposition). Then PVSYST will show users a
result for that system.
For project design:
This is more elaborate than preliminary design. There are many options to define
parameters for designing a project of different types of systems like grid connected /stand
alone /dc grid connected/pumping.

34
To design such types of systems, this section has different steps such as location, horizon
and system sizing. To construct a system, there are many components like module,
battery and inverter choosing, sizing array which show a number of module connected in
series and parallel etc. PVSYST makes the users to interconnect this component to
develop a virtual PV system and simulates that. After simulation, users get the simulation
result. By using the PVSYST software, we have developed one.
Simulation for BRACU:
First we have done preliminary design to gain primary knowledge and after that designed
a project of grid connected system for BRACU. Here we have defined our location,
orientation, and horizon. For location choosing, we have selected India as country instead
of Bangladesh because we did not get Bangladesh in country selection option. Under
India we have selected Dhaka as our site which matches with our latitude and longitude.
Since we want to develop a PV system so we have chosen a module and an inverter,
defined our monthly energy consumption rates and declared our planned power we want
to generate. The parameters are given below in table 6 :

35
Table 6: Simulation Variant
Simulation parameters Description
Collector plane orientation Tilt : 23 degree
Horizon Free horizon
PV module Si-mono, Model EOS156 M60_250
Total no. of modules 493 (in series: 17 ; in parallel:29 strings)
Array global power Nominal: 123 kwp ;
effective power: 112kWp (50o c)
Array operating
characteristics
U mpp: 506 V ; Impp: 222 A
System parameter System type: Grid connected System
Inverter Model: Protect-PV 100000
No. of inverter: 10 units
Inverter Characteristics Operating voltage: 200-800 V
Unit Nominal power: 10kW AC
Total power: 100 kW AC

36
7.1 Simulation results
A PV system, designed for BRACU campus, has developed in PVSYST and its
performance has simulated.
Figure 21.System schema
Figure 22. Simulation result
It shows that the designed PV system could be produced 186 MWh per year.
37
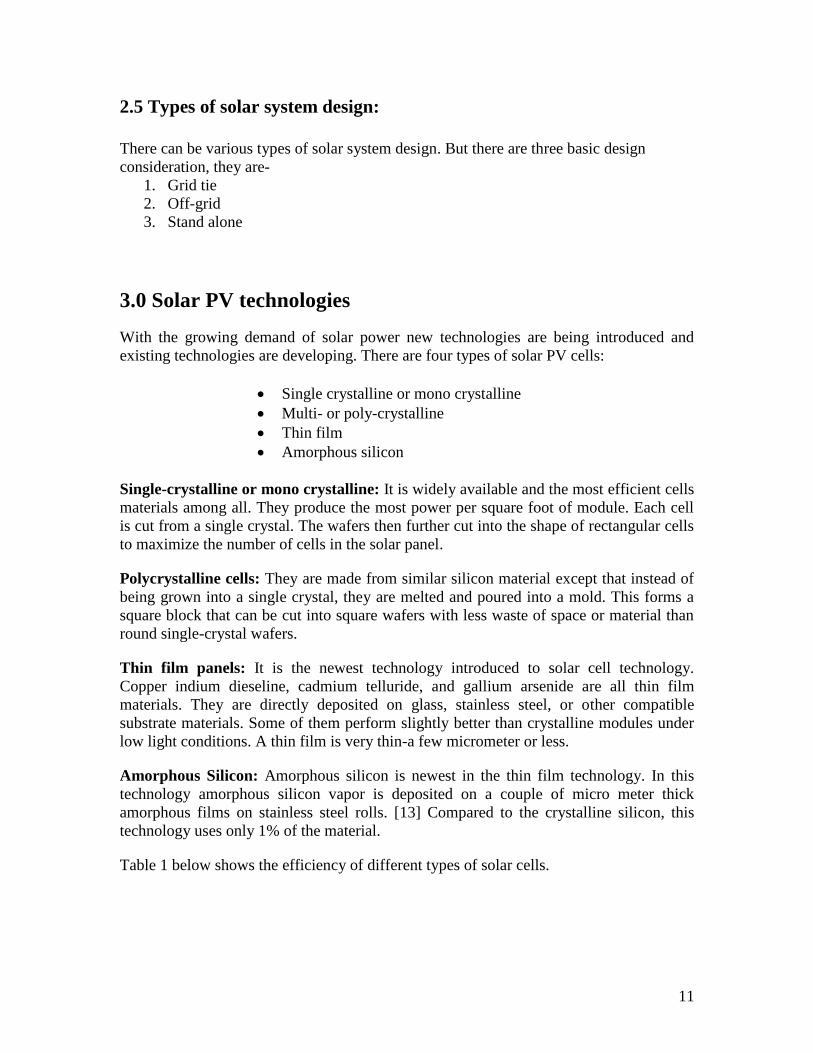
Figure 23. Daily energy output
The fig 23 shows that the daily energy output by our system throughout the year. From
the figure we can see that the energy graph fluctuates depending on the insolation.

38
Detail simulation results are presented here :
Figure 24. Simulation result

39
Figure 25. Simulation result

40
Figure 26. Simulation result

41
7.2 System capacity:
Figure 27. Monthly nominal power graph for 123 kW system
Our PV system’s nominal power output is 123 kWp. Due to various factors such as site
location, weather condition, insolation, irradiance, performances of PV modules and
inverters and system losses, the power capacity of the system is reduced.
Results from theoretical calculation
Considering these factors, the operating power output = (total no. of solar
panel*maximum power at defined irradiance of a solar panel) kWp
= (492*173.51) kWp
= 86 kWp
So, the total effective power output of designed PV system is 86 kW at 25o
C.
From simulation results we have got the effective system capacity is 110 kW.
42
7.3 Comparison of results From our previous calculation,
Our theoretically calculated energy production is 188MWh/year and
The energy production using PVSYST software is 186 MWh/year
For energy generation per year the theoretical value is nearly same to the simulation
result.
For the designed system capacity, our theoretical value is little bit far away from
simulation result.
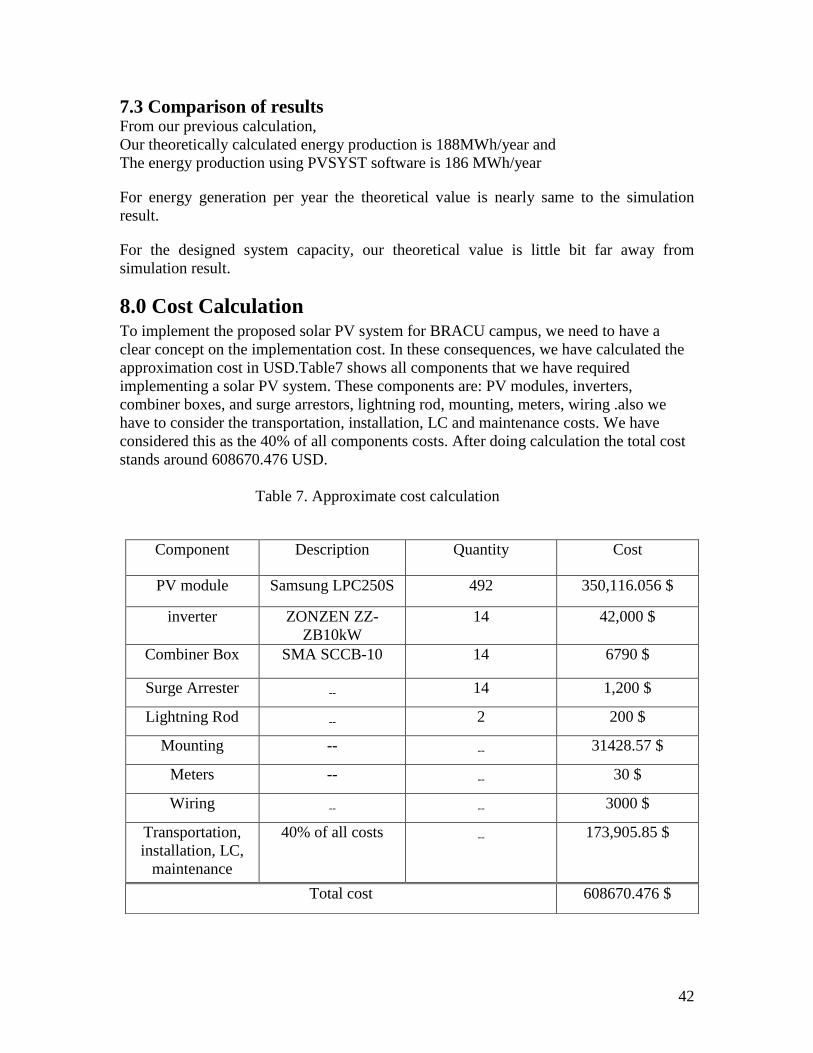
8.0 Cost Calculation To implement the proposed solar PV system for BRACU campus, we need to have a
clear concept on the implementation cost. In these consequences, we have calculated the
approximation cost in USD.Table7 shows all components that we have required
implementing a solar PV system. These components are: PV modules, inverters,
combiner boxes, and surge arrestors, lightning rod, mounting, meters, wiring .also we
have to consider the transportation, installation, LC and maintenance costs. We have
considered this as the 40% of all components costs. After doing calculation the total cost
stands around 608670.476 USD.
Table 7. Approximate cost calculation
Component Description Quantity Cost
PV module Samsung LPC250S 492 350,116.056 $
inverter ZONZEN ZZ-
ZB10kW
14 42,000 $
Combiner Box SMA SCCB-10 14 6790 $
Surge Arrester -- 14 1,200 $
Lightning Rod -- 2 200 $
Mounting -- -- 31428.57 $
Meters -- -- 30 $
Wiring -- -- 3000 $
Transportation,
installation, LC,
maintenance
40% of all costs -- 173,905.85 $
Total cost 608670.476 $

43
57%
7%
28%
8%
Module
Inverter
Installetion
Other cost
Figure28. Cost calculation in pie chart
From the fig. 28 the pie chart shows that 57% of total cost is the module cost, 36% cost is
for installation, 7% inverter cost .
9.0 Per unit energy cost
We consider our proposed PV system life is 25 years. So, the cost per unit of energy by
the designed system will be:
Total cost of the system : 608670.476 $ (from table6)
Average daily bright sunshine hours : 7.55
Estimated capacity of the designed system in kW : 86 [Chapter 7.2]
Avg. energy produced per day in kWh : 86*7.55 = 649.3
Energy produced in 25 years in kWh : 649.3*25*365 = 5924862.5
Cost per unit of energy in USD : (Total cost of the system/ Energy
produced in 25 years)
= (608670.476 /5924862.5 )
= 0.1027
So we could be able to generate per unit of energy at 0.1027 $ or (0.1027*70) TK
= 7.189 TK.

44
10. Conclusion
We are facing fuel shortage for electricity generation and in the near future the whole
world going to face the same scarcity because of world’s limited fuel stock. So
worldwide renewable energy demand and research are rising and our government also
taking steps for green energy. So, we choose solar energy for BRAC University as
secondary energy source.
11. Further works
Load calculation
Reducing system cost
System’s cost payback analysis

45
References
[1] http://wiki.answers.com/Q/Do_nuclear_power_plants_cause_any_type_of_pollution
[2] ENVIRONMENTAL PROTECTION AGENCY
[3] http://en.wikipedia.org/wiki/World_energy_resources_and_consumption
[4] http://www.energybangla.com
[5] http://energy.sourceguides.com/businesses/byGeo/byC/Bangladesh/byP/solar/byN/byName.shtml
[6] http://spectrum.ieee.org/energy/environment/plastic-solar-cells-get-a-boost-by-doubling-up
[7] http://www.unfillthelandfill.com/eco-architecture-world%E2%80%99s-largest-solar-powered-office-
building-unveiled-in-china
[8] http://www.metaefficient.com/architecture-and-building/worlds-100-solar-powered-stadium.html
[9] http://en.wikipedia.org/wiki/Sarnia_Photovoltaic_Power_Plant
[10] http://en.wikipedia.org/wiki/Olmedilla_Photovoltaic_Park
[11] http://en.wikipedia.org/wiki/World_energy_resources_and_consumption
[12] http://en.wikipedia.org/wiki/Solar_energy
[13] Wind and Solar power System. Writer : Mukund R.Patel U.S Merchant Marine academy king’s
point’ New York. CRC Press Boca Raton London New York Washington, D.C
[14] http://www.freesunpower.com
[15] Photovoltaics in Buildings, A Design Handbook for Architects and Engineers. Editors Friedrich Sick
and Thomas Erge, Fraunhofer Institute for Solar Energy Systems ISE Freiburg, Germany
[16] Photovoltaics in Buildings, A Design Handbook for Architects and Engineers. Editors Friedrich Sick
and Thomas Erge, Fraunhofer Institute for Solar Energy Systems ISE Freiburg, Germany
[17] BRAC University’s monthly electricity bills
[18] Google Earth
[19] http://www.enotes.com/earth-science/insolation-total-solar-irradiance
[20] http://www.samsung.com
[21] http://zonzen.en.made-in-china.coml
[22] http://www.sma-america.com/en/products/solar-inverters/sunny-central/combiner-boxes.html
[23] http://www.altpowerinternational.com/solar-pv/installations.php
[24] http://www.atlantechsolar.com/photovoltaic_solar_mounting_systems.html
[25] http://www.altpowerinternational.com/solar-pv/installations.php

46


![PV SYSTEM MODELLING AND SIMULATION USING …ijariie.com/AdminUploadPdf/PV_SYSTEM_MODELLING_AND_SIMULATION...PV SYSTEM MODELLING AND SIMULATION USING FLY ... 1PG student [PE&ES], Department](https://img.dokumen.tips/doc/110x75/5ab4bd507f8b9a7c5b8c21cb/pv-system-modelling-and-simulation-using-system-modelling-and-simulation-using.jpg)