Embed Size (px)
Citation preview

DESIGN AND EVALUATION OF CONTROLLED RELEASE LAYERED MATRIX TABLETS OF
PARACETAMOL AND VERAPAMIL HCl
SHAIKH RAHAMATHULLAH
UNIVERSITI SAINS MALAYSIA
2009

DESIGN AND EVALUATION OF CONTROLLED RELEASE LAYERED
MATRIX TABLETS OF PARACETAMOL AND VERAPAMIL HCl
by
SHAIKH RAHAMATHULLAH
Thesis submitted in fulfillment of the requirements for the degree of Master of
Science
MARCH 2009

ii
ACKNOWLEDGEMENTS
Praise for Almighty Allah (SWT), the most benevolent and merciful to us. In the first
place, I would like to record my deepest sense of gratitude to my supervisor
Dr. Yusrida Darwis for her supervision, advice and guidance from the very early
stage of this research. Furthermore, I appreciate her for lending her precious time to
read this thesis and to give her critical comments about it where-ever necessary.
Deepest gratitude to my co supervisor Dr. Nurzalina Abdul Karim Khan for her
abundantly helpful and invaluable assistance, support and guidance throughout my
work.
I am enormously indebted to Associate Professor Dr. Syed Azhar Syed Sulaiman
Dean of School of Pharmaceutical Sciences for providing me the opportunity to carry
out this project in the School of Pharmaceutical Sciences, Universiti Sains Malaysia.
I would like to convey my sincere thanks to the Institute of Postgraduate Studies for
providing the financial means. I would also like to thank Universiti Sains Malaysia
for giving me the opportunity and providing me with all necessary facilities that
made my study possible.
I would like to thank the entire laboratory staff especially Samsudin Bakar, Abdul
Malek Mustafa, Mohd. Rizal Mohd. Noor, Yusuff Md. Saud, Abdullah Ibrahim
Zainal Abidin, Mohammad Hassan Hj. Ramli, Chuah Lian Siah, Rahim Abdullah,
Roseli Hassan and Santhus Stanley Francis for their wonderful help in laboratory.

iii
I would also like to thank other staff members of School of Pharmaceutical Sciences,
Universiti Sains Malaysia who have helped me in one way or another either directly
or indirectly in contributing to the smooth progress of my research activities all these
years.
Where would I be without my family? My parents, Mr. Shaikh Obedullah & Mrs
Azmath Unnisa Begum, my siblings Inayath, Hidayath, Rizwan, Reshma Sultana and
other family members Mr. Azmathullah, Mr. Nasarullah, Mr. Hakeem and
Ms. Shameem deserve special mention for their inseparable support and prayers
throughout my life.
Words fail to express my appreciation to my best companion whose dedication, love
and persistent confidence in me, has taken the load off my shoulder. I owe her for
being unselfish, intelligent, passionate and ambitious towards my work.
I would like to thank all my friends who have been supportive in various ways
Raghuraj Singh, Mallikarjun, Ravi, Venkatesh, Mohd Kaleemullah, Fitri, Ram
Mohan, Ang Lee Fung Khursheed and Dr. Imtiyaz.
Finally, I would like to thank everybody who was important to the successful
completion of my study, as well as express my apology that I could not mention
personally one by one for the mistakes I have committed.
Shaikh Rahamathullah

iv
TABLE OF CONTENTS
ACKNOWLEDGEMENTS
ii
TABLE OF CONTENTS
iv
LIST OF TABLES
xiii
LIST OF FIGURES
xviii
LIST OF PLATES
xxiii
LIST OF ABBREVIATION & SYMBOLS
xxiv
LIST OF APPENDICES
xxvi
LIST OF PRESENTATIONS
xxix
ABSTRAK
xxx
ABSTRACT xxxii
Chapter 1: Introduction
1
1.1 Controlled release drug delivery system
1
1.2 Advantages and disadvantages of controlled release delivery system
3
1.3 Controlled release mechanism of drug
4
1.3.1 Dissolution controlled release
5
1.3.1 (a) Matrix dissolution control
5
1.3.1 (b) Reservoir dissolution control
5
1.3.2 Diffusion controlled release
6
1.3.2 (a) Matrix diffusion control
6
1.3.2 (b) Reservoir diffusion control
7
1.3.3 Osmotic controlled release
7
1.3.4 Ion exchange resins
8
v
1.3.5 Gastroretentive systems
8
1.3.6 Regulated systems
9
1.4 In vitro evaluation of controlled release formulations
9
1.4.1 Dissolution studies
9
1.4.2 Dissolution conditions
11
1.4.3 Compendial methods of dissolution
12
1.4.4 Dissolution studies for modified release dosage forms
14
1.4.5 Dissolution method selection
14
1.5 Paracetamol
15
1.5.1 Clinical pharmacology
16
1.5.2 Pharmacokinetics
16
1.6 Verapamil hydrochloride
16
1.6.1 Clinical pharmacology
17
1.6.1 (a) Angina
18
1.6.1 (b) Essential hypertension
19
1.6.1 (c) Arrhythmia
19
1.6.2 Pharmacokinetics
19
1.7 Release retarding agents for controlled drug delivery
20
1.7.1 Hydroxypropylmethyl cellulose
21
1.7.2 Polymethacrylates
22
1.7.3 Eudragit L 100-55
23
1.7.4 Eudragit S 100
24
1.7.5 Polyethylene oxide
25
1.7.6 Sodium carboxymethylcellulose
26
1.7.7 Ethyl cellulose
27

vi
1.7.8 Carbomer
29
1.8 pH modifiers
30
1.8.1 Adipic acid
31
1.8.2 Citric acid
31
1.8.3 Sorbic acid
32
1.8.4 Succinic acid
32
1.9 Experimental work and scope of the study
33
Chapter 2 : Design and Evaluation of Layered Matrix Tablets of Paracetamol for Oral Controlled Drug Delivery
35
2.1 Introduction
35
2.2 Materials and Methods
37
2.2.1 Materials
37
2.2.2 Preparation of paracetamol core matrix tablets
37
2.2.3 Preparation of layered matrix tablets
38
2.2.3 (a) Preparation of two layered matrix tablets
44
2.2.3 (b) Preparation of three layered matrix tablets
44
2.2.4 Evaluation of the physical properties of matrix tablets
45
2.2.4 (a) Determination of weight uniformity
45
2.2.4 (b) Determination of hardness
45
2.2.4 (c) Determination of thickness
45
2.2.4 (d) Determination of friability
45
2.2.5 In vitro release studies
46
2.2.6 Analysis of drug release
46
2.2.6 (a) Determination of mean dissolution time
46

vii
2.2.6 (b) Kinetic mechanism
47
2.2.7 Statistical analysis
48
2.3 Results and Discussion
49
2.3.1 Evaluation of physical properties of matrix tablets
49
2.3.2 Evaluation of in vitro release of drug from core and layered matrix tablets
51
2.3.2 (a) Hydrophilic core matrix tablets
51
2.3.2 (b) Release pattern of paracetamol from hydrophilic core matrix tablets
54
2.3.2 (c) Influence of hydrophilic barrier layers applied onto hydrophilic core matrix tablets on in vitro drug release
57
2.3.2 (d) Release pattern of paracetamol from hydrophilic layered matrix tablets
62
2.3.2 (e) Influence of hydrophobic barrier layers applied onto hydrophilic core matrix tablets on in vitro drug release
65
2.3.2 (f) Release pattern of paracetamol hydrophobic layered matrix tablets
70
2.3.2 (g) Influence of hydrophilic layer on one side and hydrophobic layer on other side applied onto hydrophilic core matrix tablets on in vitro drug release
72
2.3.2 (h) Release pattern of paracetamol from three layered matrix tablets containing hydrophilic layer on one side and hydrophobic layer on the other
76
2.3.2 (i) Influence of a mixture of hydrophilic and hydrophobic layers applied on hydrophilic core matrix tablets on in vitro drug release
78
2.3.2 (j) Release pattern of a mixture of hydrophilic and hydrophobic layers applied on hydrophilic core matrix tablets
83
2.4 Conclusions
86

viii
Chapter 3 : Design of pH-Independent Controlled Release Multilayered Matrix Tablets of Verapamil HCl
87
3.1 Introduction
87
3.2 Materials and Methods
89
3.2.1 Materials
89
3.2.2 Preparation of verapamil HCl matrix tablets
89
3.2.2 (a) Preparation of core matrix tablets
89
3.2.2 (b) Preparation of two layered matrix tablets
94
3.2.2 (c) Preparation of three layered matrix tablets
94
3.2.3 Determination of the physical properties of the matrix tablets
98
3.2.4 In vitro release studies
98
3.2.4 (a) Preparation of dissolution media
98
(i) Simulated gastric fluid without enzyme
98
(ii) Simulated intestinal fluid without enzyme
98
3.2.4 (b) In vitro release study
98
3.2.5 Analysis of drug release
99
3.2.5 (a) Determination of mean dissolution time
99
3.2.5 (b) Drug release kinetics
99
3.2.6 Statistical analysis
99
3.3 Results and Discussion
100
3.3.1 Determination of the physical properties of the matrix tablets
100
3.3.2 Influence of different concentrations of succinic acid on drug release from core matrix tablets
102
3.3.2
(a) Drug release profiles from hydrophilic core matrix tablets
102

ix
3.3.2
(b) Drug release profiles from hydrophobic core matrix tablets
104
3.3.3 In vitro evaluation of drug release from hydrophilic core matrix tablets
106
3.3.3 (a) Influence of different concentrations of hydrophilic polymer on the release of drug from core matrix tablets
106
(i) Hydrophilic polymer Methocel K15M
106
(ii) Hydrophilic polymer Methocel K100M
108
3.3.3 (b) Release kinetics of verapamil HCl from hydrophilic (Methocel K15M and K100M) core matrix tablets
112
3.3.4 In vitro evaluation of drug release from hydrophobic core matrix tablets
114
3.3.4 (a) Influence of different concentrations of hydrophobic polymer on the release of drug from core matrix tablets
114
(i) Hydrophobic polymer Ethocel 100cP
114
(ii) Hydrophobic polymer Ethocel 10cP
116
3.3.4 (b) Release kinetics of verapamil HCl from hydrophobic (Ethocel 100cP and Ethocel 10cP) core matrix tablets
120
3.3.5 Influence of matrix tablets layering on drug release profiles
122
3.3.5 (a) Drug release from hydrophilic layered matrix tablets
122
3.3.5 (b) Release kinetics of verapamil HCl hydrophilic layered matrix tablets
126
3.3.5 (c) Drug release from hydrophobic layered matrix tablets
128
3.3.5 (d) Release kinetics of verapamil HCl hydrophobic layered matrix tablets
131

x
3.3.6 Comparison of in vitro release profiles of formulation (F24) and Isoptin® SR tablets
133
3.3.7 Dose proportional formulation
134
3.4 Conclusions
137
Chapter 4 : High Performance Liquid Chromatography Method with Fluorescence Detection for Simultaneous Determination of Verapamil and Norverapamil in Rabbit Plasma
138
4.1 Introduction
138
4.2 Materials and Methods
141
4.2.1 Materials
141
4.2.2 Instrumentation
141
4.2.3 Preparation of stock and working standard solutions
142
4.2.4 Preparation of calibration standards
142
4.2.5 Sample preparation procedure
142
4.2.6 Chromatographic conditions
143
4.2.7 Bio-analytical method validation
143
4.2.7 (a) Specificity
143
4.2.7 (b) Linearity
143
4.2.7 (c) Accuracy and precision
144
4.2.7 (d) Extraction recovery
145
4.2.7 (e) Limit of detection and limit of quantification
145
4.2.7 (f) Stability
146

xi
4.3 Results and Discussion
146
4.3.1 Specificity
146
4.3.2 Linearity
148
4.3.3 Limit of detection and limit of quantification
148
4.3.4 Extraction recovery
150
4.3.5 Accuracy and precision
151
4.3.6 Stability
151
4.4 Conclusions
156
Chapter 5 : In Vivo Pharmacokinetic Studies of Verapamil HCl Layered Matrix Tablets
157
5.1 Introduction
157
5.2 Materials and Methods
159
5.2.1 Materials
159
5.2.2 Animals
159
5.2.3 In vivo study design
160
5.2.4 Administration of tablet to rabbit and blood sample collection
160
5.2.5 Analysis of plasma verapamil HCl concentration
164
5.2.6 Data and pharmacokinetic analysis
164
5.2.7 Statistical analysis
165
5.3 Results and Discussion
166
5.3.1 Pharmacokinetic study
166
5.4 Conclusion
181

xii
Chapter 6 : Summary and General Conclusions
182
Chapter 7 : Suggestions for Further Research
187
Bibliography
189
Appendices
209
Presentations

xiii
LIST OF TABLES
Page
1.1 Various types of dissolution apparatus.
13
2.1 The composition of hydrophilic core matrix tablet formulations containing different concentrations of Metolose 60SH (5, 10, 15 and 20%).
39
2.2 The composition of hydrophilic core and layered matrix tablet formulations containing Metolose 60SH in the core (15% and 20%) and in the layers (10 and 20%).
40
2.3 The composition of hydrophilic core and hydrophobic layered matrix tablet formulations containing Metolose 60SH in the core (15 and 20%) and Ethocel 10cP in the layers (5 and 10%).
41
2.4 The composition of three layered matrix tablets which consist of hydrophilic core Metolose 60SH (15and 20%) layered on one side with hydrophilic polymer Metolose 60SH (10 and 20%) and the other side with hydrophobic polymer Ethocel 10cP (5 and 10%).
42
2.5 The composition of three layered matrix tablets which consist of hydrophilic core Metolose 60SH (15 and 20%) layered on both sides with a mixture of hydrophilic polymer Metolose 60SH (10 and 20%) and hydrophobic polymer Ethocel 10cP (5and 10%).
43
2.6 Physical properties of paracetamol core and layered matrix tablets.
50
2.7 The mean T50%, MDT and statistical analysis data of paracetamol hydrophilic core matrix tablet formulations containing different concentrations of Metolose 60SH: F1 (5%), F2 (10%), F3 (15%) and F4 (20%). Mean ± S.D, N=3.
53
2.8 Kinetic data of paracetamol hydrophilic core matrix tablet formulations containing different concentrations of Metolose 60SH: F1 (5%), F2 (10%), F3 (15%) and F4 (20%). Mean ± S.D, N=3.
55
2.9 The mean T50%, MDT and statistical analysis data of paracetamol hydrophilic core and layered matrix tablet formulations containing Metolose 60SH 15% in the core: Mean ± S.D, N=3.
60
2.10 The mean T50%, MDT and statistical analysis data of paracetamol hydrophilic core and layered matrix tablet formulations containing Metolose 60SH 20% in the core. Mean ± S.D, N=3.
61
xiv
2.11 Kinetic data of paracetamol hydrophilic core and layered matrix tablet formulations. Mean ± S.D, N=3.
63
2.12 The mean T50%, MDT and statistical analysis data of paracetamol hydrophilic core and hydrophobic layered matrix tablet formulations containing Metolose 60SH 15% in the core. Mean ± S.D, N=3.
68
2.13 The mean T50%, MDT and statistical analysis data of paracetamol hydrophilic core and hydrophobic layered matrix tablet formulations containing Metolose 60SH 20% in the core. Mean ± S.D, N=3.
69
2.14 Kinetics data of paracetamol hydrophilic core and hydrophobic layered matrix tablet formulations. Mean ± S.D, N=3.
71
2.15 The mean T50%, MDT and statistical analysis data of paracetamol hydrophilic core (Metolose 60 SH 15%) and three layered matrix tablet formulations which consist of hydrophilic layer on one side and hydrophobic layer on the other. Mean ± S.D, N=3.
75
2.16 The mean T50%, MDT and statistical analysis data of paracetamol hydrophilic core (Metolose 60SH 20%) and three layered matrix tablet formulations which consist of hydrophilic layer on one side and hydrophobic layer on the other. Mean ± S.D, N=3.
75
2.17 Kinetic data of paracetamol three layered matrix tablets which consist of hydrophilic layer on one side and hydrophobic layer on the other. Mean ± S.D, N=3.
77
2.18 The mean T50%, MDT and statistical analysis data of paracetamol hydrophilic core (Metolose 60SH 15%) and three layered matrix tablet formulations which consist of mixture of hydrophilic and hydrophobic layers on both sides. Mean ± S.D, N=3.
81
2.19 The mean T50%, MDT and statistical analysis data of paracetamol hydrophilic core (Metolose 60SH 20%) and three layered matrix tablet formulations which consist of mixture of hydrophilic and hydrophobic layers on both sides. Mean ± S.D, N=3.
82
2.20 Kinetic data of paracetamol three layered matrix tablets which consist of mixture of hydrophilic and hydrophobic layered on both sides. Mean ± S.D, N=3.
84
3.1 The composition of hydrophilic core matrix tablet formulations containing different concentrations of Methocel K15M (5, 10, 15 and 20%) and K100M (5, 10, 15 and 20%).
91

xv
3.2 The composition of hydrophobic core matrix tablet formulations containing different concentrations of Ethocel 100cP (5, 10, 15, 20 and 30%) and Ethocel 10cP (5, 10, 15, 20 and 30%).
92
3.3 The composition of hydrophilic core matrix tablet formulations containing different concentrations of succinic acid (0, 5, 10, 15 and 20%).
93
3.4 The composition of hydrophobic core matrix tablet formulations containing different concentrations of succinic acid (0, 5, 10, 15 and 20%).
93
3.5 The composition of hydrophilic layered matrix tablet formulations containing different concentrations of Methocel K100M in core and layers.
95
3.6 The composition of hydrophobic layered matrix tablet formulations containing different concentrations of Ethocel 10cP in core and layers.
96
3.7 The composition of dose proportional formulation F24a. 97
3.8 Physical characterization of verapamil HCl hydrophilic and hydrophobic core and layered matrix tablets.
101
3.9 The mean T50%, MDT and statistical analysis data of verapamil HCl hydrophilic core matrix tablet formulations containing different concentrations of Methocel K15M: F1 (5%), F2 (10%), F3 (15%) and F4 (20%). Mean ± S.D, N=3.
108
3.10 The mean T50%, MDT and statistical analysis data of verapamil HCl hydrophilic core matrix tablet formulations containing different concentrations of Methocel K100M: F5 (5%), F6 (10%), F7 (15%) and F8 (20%). Mean ± S.D, N=3.
110
3.11 Release kinetics data of verapamil HCl from hydrophilic core matrix tablet formulations containing different concentrations of Methocel K15M: F1 (5%), F2 (10%), F3 (15%), F4 (20%) and Methocel K100M, F5 (5%), F6 (10%), F7 (15%), F8 (20%). Mean ± S.D, N=3.
113
3.12 The mean T50%, MDT and statistical analysis data of verapamil HCl hydrophobic core matrix tablet formulations containing different concentrations of Ethocel 100cP F9 (5%), F10 (10%), F11 (15%), F12 (20%) and F13 (30%). Mean ± S.D, N=3.
115

xvi
3.13 The mean T50%, MDT and statistical analysis data of verapamil HCl hydrophobic core matrix tablet formulations containing different concentrations of Ethocel 10cP F14 (5%), F15(10%), F16 (15%), F17 (20%) and F18 (30%). Mean ± S.D, N=3.
117
3.14 Release kinetic data of verapamil HCl from hydrophobic core matrix tablet formulations containing different concentrations of Ethocel 100cP: F9 (5%), F10 (10%), F11 (15%), F12 (20%), F13 (30%) and Ethocel 10cP: F14 (5%), F15 (10%), F16 (15%), F17 (20%), F18 (30%). Mean ± S.D, N=3.
121
3.15 The mean T50%, MDT and statistical analysis data of verapamil HCl from hydrophilic core (F7) and hydrophilic layered matrix tablet formulations (F19 to F24) containing Methocel K100M. Mean ± S.D, N=3.
125
3.16 Release kinetics data of verapamil HCl from hydrophilic layered matrix tablet formulations containing Methocel K100M in the core and layers. Mean ± S.D, N=3.
127
3.17 The mean T50%, MDT and statistical analysis data of verapamil HCl from hydrophobic core (F18) and hydrophobic layered matrix tablet formulations (F25 to F28) containing Ethocel 10cP. Mean ± S.D, N=3.
130
3.18 Release kinetics data of verapamil HCl from hydrophobic layered matrix tablets formulations containing Ethocel 10cP in the core and layers. Mean ± S.D, N=3.
132
3.19 Release kinetics data of verapamil HCl hydrophilic layered matrix tablets containing Methocel K100M: F24 (240 mg of verapamil HCl), F24a (120 mg of verapamil HCl) and Isoptin® SR 240 mg and Isoptin® SR 120 mg. Mean ± S.D, N=3.
136
4.1 Summary of the data precision and accuracy of verapamil HCl calibration curve. Mean ± SD, N=6.
149
4.2 Summary of the data precision and accuracy of norverapamil calibration curve. Mean ± SD, N=6.
149
4.3 Extraction recovery of verapamil HCl and internal standard. Mean ± SD, N=6.
150
4.4 Extraction recovery of norverapamil. Mean ± SD, N=6.
150
4.5 Intra-day and inter-day precision and accuracy of verapamil HCl. Mean ± S.D, N=6.
152

xvii
4.6 Intra-day and inter-day precision and accuracy of norverapamil. Mean ± S.D, N=6.
153
4.7 Stability of verapamil HCl in rabbit plasma placed at different conditions. Mean ± S.D, N=3.
154
4.8 Stability of norverapamil in rabbit plasma placed at different conditions. Mean ± S.D, N=3.
155
5.1 Sequence of administration of F24a (Test) and Isoptin® SR (Reference) tablets of verapamil HCl.
160
5.2 Individual numerical values of Tmax.
174
5.3 Individual numerical values of Cmax.
175
5.4 Individual numerical values of AUC verapamil.
177
5.5 Individual numerical values of AUC norverapamil.
178
5.6 Individual numerical values of Ke.
179
5.7 Individual numerical values of t1/2.
180

xviii
LIST OF FIGURES
Page
1.1 Schematic drawing of plasma concentration-versus-time profiles following administration of three immediate-release dosage forms versus one single controlled-release dosage form.
2
1.2 Dissolution apparatus (Distek 2000). 10
1.3 Dissolution testing apparatus (USP 28), basket (I) and paddle (II). 12
1.4 Structural formula of paracetamol.
15
1.5 Structural formula of verapamil HCl.
17
1.6 Structural formula of hydroxypropylmethyl cellulose. 21
1.7 Structural formula of Eudragit.
23
1.8 Structural formula of Eudragit L 100-55. 24
1.9 Structural formula of Eudragit S 100.
25
1.10 Chemical structure of polyethylene oxide. 25
1.11 Chemical structure of sodium carboxymethylcellulose. 26
1.12 Structural formula of ethyl cellulose.
27
1.13 Structural formula of carbomer.
29
1.14 Structural formula of adipic acid. 31
1.15 Structural formula of citric acid. 32
1.16 Structural formula of sorbic acid. 32
1.17 Structural formula of succinic acid. 33
2.1 Core and layered matrix tablets. 36
2.2 Release profiles of paracetamol from hydrophilic core matrix tablet formulations containing different concentrations of Metolose 60SH F1 (5%), F2 (10%), F3 (15%) and F4 (20%). Mean ± S.D, N=3.
52

xix
2.3 Paracetamol release profiles from hydrophilic core and layered matrix tablet formulations containing Metolose 60SH 15% in the core. F3 (core), F5 (core layered with Metolose 60SH 10% on one side), F6 (core layered with Metolose 60SH 10% on both sides), F7 (core layered with Metolose 60SH 20% on one side) and F8 (core layered with Metolose 60SH 20% on both sides). Mean ± S.D, N=3.
58
2.4 Paracetamol release profiles from hydrophilic core and layered matrix tablet formulations containing Metolose 60SH 20% in the core. F4 (core), F9 (core layered with Metolose 60SH 10% on one side), F10 (core layered with Metolose 60SH 10% on both sides) and F11 (core layered with Metolose 60SH 20% on one side); F12 (core layered with Metolose 60SH 20% on both sides). Mean ± S.D, N=3.
58
2.5 Release profiles of paracetamol from hydrophilic core and layered matrix tablet formulations containing Metolose 60 SH 15% in the core. F3 (core); F13 (core layered with Ethocel 5% on one side), F 14 (core layered with Ethocel 5% on both sides), F15 (core layered with Ethocel 10% on one side) and F16 (core layered with Ethocel 10% on both sides). Mean ± S.D, N=3.
66
2.6 Release profiles of paracetamol from hydrophilic core and layered matrix tablet formulations containing Metolose 60 SH 20% in the core. F4 (core); F17 (core layered with Ethocel 5% on one side), F18 (core layered with Ethocel 5% on both sides), F19 (core layered with Ethocel 10% on one side) and F20 (core layered with Ethocel 10% on both sides). Mean ± S.D, N=3.
67
2.7 Paracetamol release profiles from hydrophilic core and three layered matrix tablet formulations F3 (core containing Metolose 60 SH 15%), F21 (core layered on one side with Ethocel 5% and Metolose 60SH 10% on the other side), F22 (core layered on one side with Ethocel 10% and Metolose 60SH 20% on the other side). Mean ± S.D, N=3.
73
2.8 Paracetamol release profiles from hydrophilic core and three layered matrix tablet formulations: F4 (core containing Metolose 60SH 20%), F23 (core layered on one side with Ethocel 5% and Metolose 60SH 10% on the other side), F24 (core layered on one side with 10% Ethocel and 20% Metolose 60SH on the other side). Mean ± S.D, N=3.
73

xx
2.9 Paracetamol release profiles from hydrophilic core and layered matrix tablet formulations. F3 (core containing Metolose 60SH 15%), F25 (core layered on both sides with a mixture of Ethocel 5% and Metolose 60SH 10%), F26 (core layered on both sides with a mixture of Ethocel 10cP and Metolose 60SH 20%). Mean ± S.D, N=3.
79
2.10 Paracetamol release profiles from hydrophilic core and layered matrix tablet formulations. F4 (core containing Metolose 60SH 20%), F27 (core layered on both sides with a mixture of Ethocel 5% and Metolose 60SH 10%), F28 (core layered on both sides with a mixture of Ethocel 10% and Metolose 60SH 20%). Mean ± S.D, N=3.
79
2.11 Paracetamol release profiles from hydrophilic core and layered matrix tablet formulations. F8 and F12 (core containing Metolose 60SH 15 and 20% respectively layered on both sides with Metolose 60SH 20%), F26 and F28 (core containing Metolose 60SH 15 and 20% respectively layered on both sides with a mixture of EC 10% and Metolose 60SH 20%). Mean ± S.D, N=3.
85
3.1 Release profiles of verapamil HCl from hydrophilic core matrix tablets containing different concentrations of succinic acid at a) pH 1.2 and b) pH 6.8. Mean ± S.D, N=3.
103
3.2 Release profiles of verapamil HCl from hydrophobic core matrix tablets containing different concentrations of succinic acid at a) pH 1.2 and b) pH 6.8. Mean ± S.D, N=3.
105
3.3 Release profiles of verapamil HCl from hydrophilic core matrix tablet formulations containing different concentrations of Methocel K15M, F1(5%), F2 (10%), F3 (15%) and F4 (20%). Mean ± S.D, N=3.
107
3.4 Release profiles of verapamil HCl from hydrophilic core matrix tablet formulations containing different concentrations of Methocel K100M F5 (5%), F6 (10%), F7 (15%) and F8 (20%). Mean ± S.D, N=3.
109
3.5 Release profiles of verapamil HCl from hydrophilic core matrix tablet formulations containing different concentrations of Methocel K15M: F1 (5%), F2 (10%), F3 (15%), F4 (20%) and Methocel K100M: F5 (5%), F6 (10%), F7 (15%), F8 (20%). Mean ± S.D, N=3.
111
3.6 Release profiles of verapamil HCl from hydrophobic core matrix tablet formulations containing different concentrations of Ethocel 100cP: F9 (5%), F10 (10%), F11 (15%), F12 (20%) and F13 (30%). Mean ± S.D, N=3.
114

xxi
3.7 Release profiles of verapamil HCl from hydrophobic core matrix tablet formulations containing different concentrations of Ethocel 10cP: F14 (5%), F15 (10%), F16 (15%), F17 (20%) and F18 (30%). Mean ± S.D, N=3.
116
3.8 Release profiles of verapamil HCl from hydrophobic core matrix tablet formulations containing different concentrations of Ethocel 100cP: F9 (5%), F10 (10%), F11 (15%), F12 (20%), F13 (30%) and Ethocel 10cP: F14 (5%), F15 (10%), F16 (15%), F17 (20%), F18 (30%). Mean ± S.D, N=3.
119
3.9 Release profiles of verapamil HCl from hydrophilic core (F7) and hydrophilic layered matrix tablet formulations (F19 to F24) containing Methocel K100M: F7 (75 mg in core), F19 (18.75 mg in the core layered with 56.25 mg on one side), F20 (18.75 mg in the core layered with 28.13 mg on both sides), F21 (37.5 mg in the core layered with 37.5 mg on one side), F22 (37.5 mg in the core layered with 18.75 mg on both sides), F23 (56.25 mg in the core layered with 18.75 mg on one side) and F24 (56.25 mg in the core layered with 9.38 mg on both sides). Mean ± S.D, N=3.
123
3.10 Release profiles of verapamil HCl from hydrophobic core (F18) and hydrophobic layered matrix tablet formulations (F25 to F28) containing Ethocel 10cP: F18 (150 mg in the core), F25 (37.5 mg in the core layered with 112.5 mg on one side), F26 (37.5 mg in the core layered with 56.25 mg on both sides), F27 (112.5 mg in the core layered with 37.5 mg on one side) and F28 (112.5 mg in the core layered with 18.75 mg on both sides). Mean ± S.D, N=3.
129
3.11 Comparison of release profiles of verapamil HCl three layered matrix tablet formulation F24 containing Methocel K100M (56.25 mg in the core layered with 9.38 mg on both sides) and Isoptin® SR (240 mg verapamil HCl). Mean ± S.D, N=3.
133
3.12 Comparison of release profiles of verapamil HCl three layered matrix tablet formulation F24a containing Methocel K100M (28.13 mg in the core layered with 4.68 mg on both sides) and Isoptin® SR 120 (half tablet of Isoptin® SR 240 mg containing 120 mg verapamil HCl). Mean ± S.D, N=3.
135
4.1 Chemical structure of a) verapamil HCl b) norverapamil and c) propranolol.
139
4.2 Representative chromatogram of (a) Blank rabbit plasma (b) Rabbit plasma spiked with 100 ng/ml of propranolol (internal standard, 5.60 min), norverapamil (9.50 min) and verapamil HCl (10.50 min).
147

xxii
5.1 Plasma i) verapamil ii) norverapamil concentration profiles for rabbit 1 after administration of Isoptin® SR and F24a.
167
5.2 Plasma i) verapamil ii) norverapamil concentration profiles for rabbit 2 after administration of Isoptin ® SR and F24a.
168
5.3 Plasma i) verapamil ii) norverapamil concentration profiles for rabbit 3 after administration of Isoptin® SR and F24a.
169
5.4 Plasma i) verapamil ii) norverapamil concentration profiles for rabbit 4 after administration of Isoptin® SR and F24a.
170
5.5 Plasma i) verapamil ii) norverapamil concentration profiles for rabbit 5 after administration of Isoptin® SR and F24a.
171
5.6 Plasma i) verapamil ii) norverapamil concentration profiles for rabbit 6 after administration of Isoptin® SR and F24a.
172
5.7 Mean plasma i) verapamil ii) norverapamil concentration profiles after oral administration of Isoptin® SR and F24a. Mean ± S.D, N=6.
173

xxiii
LIST OF PLATES
Page
5.1 Chopstick, Mouth holder and Syringe loaded with tablet. 161
5.2 Holding rabbit in upright position. 162
5.3 Tablet administration by syringe (loaded with tablet) through mouth holder.
162
5.4 Use of chopstick to push the tablet into pharynx of rabbit. 163
5.5 Rabbit ear vein. 163
xxiv
LIST OF ABBREVIATION & SYMBOLS
< = Less than
> = Greater than
% = Percent
ºC = Degree centigrade
ANOVA = Analysis of variance
ADP = Adenosine diphosphate
AUC = Area under curve
BCS = Biopharmaceutical Classification System
BP = British Pharmacopoeia
cm = Centimetre
Cmax The peak plasma concentration
Cstd = Concentration of standard solution
COX 1 = Cyclooxygenase 1
CV = Coefficient of variation
EC = Ethyl cellulose
FDA = Food and Drug Administration
GC = Gas chromatography
GC-MS = Gas chromatography-mass spectrometry
GRDS = Gastroretentive drug delivery system
HPLC = High performance liquid chromatography
HPMC = Hydroxypropyl methylcellulose
HPMCAS = Hdroxypropylmethyl cellulose acetate succinate
k = Release rate constant
Ke = Elimination rate constant
LLE = Liquid-liquid extraction
LOD = Limit of detection
LOQ = Limit of quantification
MDT = Mean dissolution time
ml/min = Millilitre/minute
mg = Milligram
PEO = Polyethylene oxide
pKa = Ionization constant

xxv
mm = Millimeter
MW = Molecular weight
NaCMC = Sodiumcarboxymethyl cellulose
r = Correlation coefficient
RE = Relative error
RP-HPLC = Reversed-phase high performance liquid chromatography
RPM = Rotation per minute
RSD = Relative standard deviation
SAS = Statistical Analysis System
SD = Standard deviation
SEM = Standard error of mean
SPSS = Statistical procedures for social science
SPE = Solid phase extraction
Tmax = The time to reach peak plasma concentration
T50% = Time for 50% of drug release
t1/2 = Half life
USP = United States Pharmacopoeia
UV = Ultra violet
µg/ml = Microgram per milliliter
µl = Microliter

xxvi
LIST OF APPENDICES
Page
2.1 Dissolution profiles of paracetamol formulations (F1 to F7). Mean ± S.D, N=3.
210
2.2 Dissolution profiles of paracetamol formulations (F8 to F14). Mean ± S.D, N=3.
211
2.3 Dissolution profiles of paracetamol formulations (F15 to F21). Mean ± S.D, N=3.
212
2.4 Dissolution profiles of paracetamol formulations (F22 to F28). Mean ± S.D, N=3.
213
2.5 Statistical analysis of T50% and MDT results for in vitro release profiles of paracetamol hydrophilic (Metolose 60SH) core matrix formulations F1 to F4. Mean ± S.D, N=3.
214
2.6 Statistical analysis of T50% and MDT results for in vitro release profiles of paracetamol hydrophilic core matrix (F4) and hydrophilic layered matrix formulations (F9 to F12). Mean ± S.D, N=3.
215
2.7 Statistical analysis of T50% and MDT results for in vitro release profiles of paracetamol hydrophilic core matrix (F4) and hydrophobic layers applied onto hydrophilic core matrix tablets (F17 to F20). Mean ± S.D, N=3.
216
2.8 Statistical analysis of T50% and MDT results for in vitro release profiles of paracetamol hydrophilic core matrix (F4) and hydrophilic layer on one side and hydrophobic layer on other side applied onto hydrophilic core matrix tablets (F23 and F24). Mean ± S.D, N=3.
217
2.9 Statistical analysis of T50% and MDT results for in vitro release profiles of paracetamol hydrophilic core matrix (F4) and mixture of hydrophilic and hydrophobic layers applied on hydrophilic core matrix tablets (F27 and F28). Mean ± S.D, N=3.
218
2.10 Zero order and first order release kinetics of paracetamol hydrophilic (Metolose 60SH) core matrix tablet formulations: (a) F1; (b) F2; (c) F3 and (d) F4. Mean ± S.D, N=3.
219
2.11 Zero order and first order release kinetics of paracetamol hydrophilic core matrix containing mixture of hydrophilic and hydrophobic layer on both sides. (a) F25; (b) F26; (c) F27 and (d) F28. Mean ± S.D, N=3.
220

xxvii
3.1 Dissolution profiles of verapamil HCl formulations (F1 to F7). Mean ± S.D, N=3.
221
3.2 Dissolution profiles of verapamil HCl formulations (F8 to F14). Mean ± S.D, N=3.
222
3.3 Dissolution profiles of verapamil HCl formulations (F15 to F21). Mean ± S.D, N=3.
223
3.4 Dissolution profiles of verapamil HCl formulations (F22 to F28). Mean ± S.D, N=3.
224
3.5 Statistical analysis of T50% and MDT results for in vitro release profiles of verapamil HCl hydrophilic (K15M) core matrix formulations (F1 to F4). Mean ± S.D, N=3.
225
3.6 Statistical analysis of T50% and MDT results for in vitro release profiles of verapamil HCl hydrophilic (K100M) core matrix formulations (F5 to F8). Mean ± S.D, N=3.
226
3.7 Statistical analysis of T50% and MDT results for in vitro release profiles of verapamil HCl hydrophobic (EC 100cP) core matrix formulations (F9 to F13). Mean ± S.D, N=3.
227
3.8 Statistical analysis of T50% and MDT results for in vitro release profiles of verapamil HCl hydrophobic (EC 10cP) core matrix formulations (F14 to F18). Mean ± S.D, N=3.
228
3.9 Statistical analysis of T50% and MDT results for in vitro release profiles of verapamil HCl hydrophilic (K100M) core (F7) and layered matrix formulations (F19 to F24). Mean ± S.D, N=3.
229
3.10 Statistical analysis of T50% and MDT results for in vitro release profiles of verapamil HCl hydrophobic (EC 10cP) core (F18) and layered matrix formulations (F25 to F28). Mean ± S.D, N=3.
230
3.11 Zero order and first order release kinetics of verapamil HCl hydrophilic (K15M) core matrix tablet formulations: (a) F1; (b) F2; (c) F3 and (d) F4. Mean ± S.D, N=3.
231
3.12 Zero order and first order release kinetics of verapamil HCl hydrophilic (K100M) core matrix tablet formulations: (a) F5; (b) F6; (c) F7 and (d) F8. Mean ± S.D, N=3.
232
3.13 Zero order and first order release kinetics of verapamil HCl hydrophilic (K100M) layered matrix tablet formulations: (a) F19; (b) F20; (c) F21 and (d) F22. Mean ± S.D, N=3.
233

xxviii
3.14 Zero order and first order release kinetics of verapamil HCl hydrophilic (K100M) layered matrix tablet formulations: (a) F23 and (b) F24. Mean ± S.D, N=3.
234
4.1 Standard calibration curve of (a) verapamil and (b) norverapamil. Mean ± S.D, N=6.
235
5.1 Individual rabbit plasma concentration of verapamil at different time periods after administration of F24a (Test) formulation.
236
5.2 Individual rabbit plasma concentration of norverapamil at different time periods after administration of F24a (Test) formulation.
237
5.3 Individual rabbit plasma concentration of verapamil at different time periods after administration of Isoptin SR® (Reference) formulation.
238
5.4 Individual rabbit plasma concentration of norverapamil at different time periods after administration of Isoptin SR® (Reference) formulation.
239
5.5 Statistical analysis of Cmax for verapamil SAS output i) Untransformed data ii) Ln transformed data.
240
5.6 Statistical analysis of Cmax for norverapamil SAS output i) Untransformed data ii) Ln transformed data.
240
5.7 Statistical analysis of Tmax for verapamil and norverapamil SAS output.
241
5.8 Statistical analysis of AUC0-∞, for verapamil SAS output i) Untransformed data ii) Ln transformed data.
242
5.9 Statistical analysis of AUC0-∞ for norverapamil SAS output i) Untransformed data ii) Ln transformed data.
242
5.10 Statistical analysis output using SAS for bioequivalence limit calculations for i) verapamil ii) norverapamil.
243
5.11 Statistical analysis of Ke Untransformed data SAS output for i) verapamil ii) norverapamil.
243

xxix
LIST OF PRESENTATIONS
Page
1 Shaikh Rahamathullah, Yusrida Darwis, Nurzalina Abdul karim Khan (2007) Design and Evaluation of Multi-Layer Matrix Tablets for Oral Controlled Drug Delivery. USM-UNAIR first collaborative conference, jointly organized by Universiti Sains Malaysia and University Airlangga, June 2007, Penang, Malaysia.
2 Shaikh Rahamathullah, Yusrida Darwis, Nurzalina Abdul karim Khan (2007) The Influence of Concentration of Polymer in Different Layers of Matrix Tablets (Geomatrix®) For Constant Rate Delivery of Verapamil HCl. USM-UNAIR first collaborative conference, jointly organized by Universiti Sains Malaysia and University Airlangga, June 2007, Penang, Malaysia.
3 Shaikh Rahamathullah, Yusrida Darwis, Nurzalina Abdul karim Khan (2008) Design and In Vitro Evaluation of pH-Independent Controlled Release Layered Matrix Tablets of Verapamil Hydrochloride. Asian Scientific Conference in Pharmaceutical Technology 2008: Current Trend in Pharmaceutical Technology, June 2008, Penang, Malaysia.
4 Shaikh Rahamathullah, Yusrida Darwis, Nurzalina Abdul karim Khan (2008) Design and Evaluation of Controlled Release Layered Matrix Tablets of Paracetamol and Verapamil HCl. Universiti Sains Malaysia, Penang, Malaysia.

xxx
REKABENTUK DAN PENILAIAN TABLET MATRIKS BERLAPIS
PELEPASAN TERKAWAL PARASETAMOL DAN VERAPAMIL HCl
ABSTRAK
Tablet matriks berlapis pelepasan terkawal parasetamol dan verapamil HCl
dibangunkan menggunakan polimer hidrofilik dan hidrofobik, dan disediakan dengan
kaedah pengranulan basah. Tablet matriks parasetamol teras, dua dan tiga lapis
diformulasikan menggunakan polimer hidrofilik (Metolose 60SH) dan hidrofobik
(Ethocel 10cP). Tablet matriks teras mengandungi Metolose 60SH pada kepekatan
yang berbeza (5, 10, 15 dan 20%) manakala lapisan terdiri daripada Metolose 60SH
(10 dan 20%) atau Ethocel 10cP (5 dan 10%) atau gabungan kedua-dua polimer.
Kepekatan polimer di dalam teras dan lapisan berkadar songsang dengan kadar
pelepasan drug daripada tablet matriks. Jenis polimer juga mempengaruhi pelepasan
drug dari pada tablet matriks berlapis. Lapisan hidrofilik memanjangkan pelepasan
drug manakala lapisan hidrofobik tidak ada kesan. Walau bagaimanapun, tablet
matriks tiga lapis yang mengandungi campuran Methocel 60SH (20%) dan Ethocel
10cP (10%) dalam lapisan mempunyai jangkamasa pelepasan drug yang paling
tertahan dengan nilai T50% 10.97 jam dan MDT 10.50 jam. Pelepasan drug daripada
sediaan mengikut kinetik tertib sifar. Oleh itu, tablet matriks parasetamol tiga lapis
yang mengandungi polimer hidrofilik dan hidrofobik mempunyai pelepasan drug
yang paling tertahan. Tablet matriks verapamil HCl teras, dua dan tiga lapis
disediakan menggunakan beberapa kepekatan polimer hidrofilik Methocel K15M
dan K100M (5, 10, 15 dan 20%), dan polimer hidrofobik Ethocel 10cP (5, 10, 15, 20
dan 30%). Sebagai tambahan, beberapa kepekatan asid suksinik (5, 10, 15 dan 20%)
dimasukkan ke dalam teras. Formulasi dengan asid suksinik 15% di dalam teras

xxxi
didapati yang paling bagus untuk menghasilkan pelepasan drug daripada tablet
matriks yang tidak bergantung kepada pH. Kepekatan polimer di dalam teras
berkadar songsang dengan kadar pelepasan drug daripada tablet matriks. Pada
amnya, pelepasan drug daripada teras yang mengandungi polimer hidrofilik adalah
lebih perlahan daripada teras yang mengandungi polimer hidrofobik. Matriks tablet
dua dan tiga lapis disediakan dengan pelbagai kepekatan polimer di dalam teras dan
lapisan tetapi jumlah amaun polimer tetap malar. Formulasi mengandungi polimer
hidrofilik di dalam teras dan lapisan menghasilkan pelepasan drug lebih tertahan
daripada formulasi mengandungi polimer hidrofobik di dalam teras dan lapisan.
Tablet matriks tiga lapis yang mengandungi Methocel K100M di dalam teras
(11.25%) dan lapisan (3.75%) mempunyai jangkamasa pelepasan drug yang paling
tertahan dengan T50% 10.20 jam, MDT 10.49 jam dan mengikuti kinetik tertib sifar.
Sebelum melakukan kajian in vivo, kaedah HPLC mudah dan sensitif dengan
pengesanan pendarfluor disahkan untuk penetuan severapamil dan norverapamil
secara serentak pada plasma arnab, menggunakan propranolol sebagai piawai
internal. Sebagai tambahan, kajian in vivo rekabentuk saling melintang dua arah
dilakukan ke atas enam ekor arnab untuk membandingkan biokeperolehan tablet
matriks hidrofilik tiga lapis dengan Isoptin® SR sebagai produk rujukan. Tiada
perbezaan pada nilai Tmax, Cmax dan AUC antara tablet matriks tiga lapis verapamil
HCl dan Isoptin® SR. Oleh itu, tablet matriks verapamil HCl tiga lapis mempunyai
kadar dan takat penyerapan yang sama seperti Isoptin® SR.

xxxii
DESIGN AND EVALUATION OF CONTROLLED RELEASE LAYERED
MATRIX TABLETS OF PARACETAMOL AND VERAPAMIL HCl
ABSTRACT
Controlled release layered matrix tablets of paracetamol and verapamil HCl were
developed using hydrophilic and hydrophobic polymers by the wet granulation
method. Paracetamol core, two and three layered matrix tablets were formulated
using hydrophilic (Metolose 60SH) and hydrophobic (Ethocel 10cP) polymers. The
core matrix tablets contained different concentrations (5, 10, 15 and 20%) of
Metolose 60SH while the layers consisted of either Metolose 60SH (10 and 20%)
and/or Ethocel 10cP (5 and 10%) and combinations of both polymers. Polymer
concentrations in the core and layers were found to be inversely proportional with the
drug release rate from the matrix tablets. Polymer types also influenced the drug
release from the layered matrix tablets. Hydrophilic layers prolonged the drug release
whilst hydrophobic layers had no effect. However, a three layered matrix tablet
containing a mixture of Metolose 60SH (20%) and Ethocel 10cP (10%) in the layers
had the most sustained duration of drug release with T50% values of 10.97 hours and
MDT of 10.50 hours. The drug release from the preparation followed zero order
kinetics. Therefore, the paracetamol three layered matrix tablets containing mixture
of hydrophilic and hydrophobic polymers had the most sustained drug release.
Verapamil HCl core, two and three layered matrix tablets were prepared using
several concentrations of hydrophilic polymers Methocel K15M and K100M (5, 10,
15 and 20%), and hydrophobic polymers Ethocel 10cP and 100cP (5, 10, 15, 20 and
30%). Different concentrations of succinic acid (5, 10, 15 and 20%) were
additionally incorporated into the core. Formulation with succinic acid 15% in the
xxxiii
core was found to be the best in producing pH independent drug releases from the
hydrophilic and hydrophobic matrix tablets. Polymer concentrations in the core were
inversely proportional to the drug release rate from the matrix tablets. In general,
drug release from core containing hydrophilic polymers was slower than core
containing hydrophobic polymers. The two and three layered matrix tablets were
prepared by varying the concentrations of polymers in the core and layers whilst
keeping the total amount of the polymer in the tablet constant. Formulations
containing hydrophilic polymers in the core and layers produced more sustained drug
release than formulations containing hydrophobic polymers in the core and layers.
Three layered matrix tablets containing Methocel K100M in the core (11.25%) and
layers (3.75%) had the most sustained drug release profiles with T50% of 10.20 hours,
MDT of 10.49 hours and followed zero order kinetics. Prior to conducting the in vivo
study, a simple and sensitive HPLC method with fluorescence detection was
validated for the simultaneous determination of verapamil and norverapamil in rabbit
plasma, using propranolol as an internal standard. In vivo study with a two-way
crossover design was performed on six rabbits to compare the pharmacokinetic
parameters of the hydrophilic three layered matrix tablets and Isoptin® SR as the
reference product. There were no differences in Tmax, Cmax and AUC values between
the verapamil HCl three layered matrix tablets and Isoptin® SR. Therefore, the
verapamil HCl three layered matrix tablets containing the hydrophilic polymer had a
similar rate and extent of absorption as Isoptin® SR.

1
Chapter 1
Introduction
1.1 Controlled release drug delivery system
Oral route still remains the most popular for drug administration by virtue of its
convenience to the patient. A sizable portion of orally administered dosage forms, so
called conventional, are designed to achieve maximal drug bioavailability by
maximizing the rate and extent of absorption. Whilst such dosage forms have been
useful, frequent daily administration is necessary, particularly when the drug has a
short biological half life. This may result in wide fluctuation in peak and trough
steady-state drug levels, which is undesirable for drugs with marginal therapeutic
indices. Moreover, patient compliance is likely to be poor when patients need to take
their medication three to four times daily on chronic basis. Fortunately, these
shortcomings have been circumvented with the introduction of controlled release
dosage forms. These dosage forms are capable of controlling the rate of drug
delivery, leading to more sustained drug levels and hence therapeutic action as
outlined in Fig.1.1.
During past few decades, significant advance have been made in the area of
controlled release as evidenced by an increasing number of patents, publication, as
well as commercial controlled release products for the delivery of variety of
pharmaceutical compounds. With a controlled release formulation a predictable and
reproducible release rate can be achieved, at the target site for desired duration. This
results in optimum biological response, prolonged efficacy, decreased toxicity as
well as reduction in required dose levels as compared to the conventional mode of
delivery (Wilding et al., 1991).

2
Fig.1.1: Schematic drawing of plasma concentration-versus-time profiles following administration of three immediate-release dosage forms versus one single controlled-release dosage form (Brahmankar et al., 2000).
The first truly effective oral drug delivery system, the “Spansule” was introduced in
the 1950s. This prolonged release system was marketed by SmithKline & French
Laboratories and consisted of small coated beads placed in a capsule (US Patent No.
2738303).
Matrix tablets which were prepared by compressing granules to form matrices
appeared in 1959 (British Patent No. 808014). The inherent drawback of the matrix
system is its first order release behavior. For most controlled dosage forms zero order
release may be the “holy grail”. To overcome the inherent preponderant first order
release behavior with continuously diminishing release rate from matrix systems,
3
geometry factors have been utilized to compensate for the increasing diffusional
distance and decreasing area at the penetrating diffusion front generally encountered
in matrix system. Geomatrix is a delivery device, in the form of a multi-layer tablet,
proposed for constant drug release. It consists of matrix core, containing the active
ingredient, and one or two impermeable or semi-permeable polymeric barriers
compressed on one or both faces of the core. These barrier layers provide a
modulation of the drug dissolution profile; they reduce the release rate from the
tablets and are shown to be effective in obtaining zero order release (Colombo et al.,
1989; Colombo et al., 1990; Colombo et al., 1992; Conte et al., 1992; Conte et al.,
1993; Conte et al., 1994).
A geomatrix system has few advantages. A conventional high-speed tableting
machine can be used to produce geomatrix tablets with a high degree of product
consistency and uniformity. This system can be applied to a wide range of drug
molecules, including some with poor water solubility and can target the site of
release. The major advantage of this system being its ability to control the rate of
drug diffusion throughout the release process, ensuring 100% release of the active
drug. Moreover, the geomatrix technologies can improve drug efficacy and enhance
patient compliance.
1.2 Advantages and disadvantages of controlled release delivery system
Controlled release technology may provide increased clinical value as well as
extended product life. The advantages of an ideal controlled release dosage form
over an immediate release product include improved patient compliance due to a
reduced dosing frequency, a decreased incidence and/or intensity of the side effects,
4
greater selectivity of pharmacological activity and more prolonged therapeutic effect
as well as an increase of cost effectiveness.
However, the controlled release dosage forms also possess some disadvantages.
Potential disadvantages of controlled release dosage form include the possibility of
dose dumping, less facile dose adjustment, increased potential for hepatic first-pass
metabolism, possible delay in onset of action and possibly poor system availability.
1.3 Controlled release mechanism of drug
Mechanisms of drug release from oral controlled delivery systems can be broadly
divided into following categories:
1.3.1 Dissolution controlled release
1.3.1 (a) Matrix dissolution control
1.3.1 (b) Reservoir dissolution control
1.3.2 Diffusion controlled release
1.3.2 (a) Matrix diffusion control
1.3.2 (b) Reservoir diffusion control
1.3.3 Osmotic controlled release
1.3.4 Ion exchange resins
1.3.5 Gastroretentive systems
1.3.6 Regulated systems

5
1.3.1 Dissolution controlled release
Dissolution controlled release can be obtained by slowing down the dissolution rate
of a drug in the GI medium, incorporating the drug in an insoluble polymer, and
coating drug particles or granules with polymeric materials of varying thickness.
1.3.1 (a) Matrix dissolution control
In these systems, the drug is homogeneously dispersed throughout a rate controlling
membrane. The drugs which are highly water soluble can also be formulated as
controlled release products by controlling their dissolution rate using slowly soluble
polymers. Waxes such as beeswax, carnauba wax and hydrogenated castor oil have
been used. The wax embedded drug is generally prepared by dispersing the drug in
molten wax, congealing and granulating them (Robinson, 1990; Lloyd, 1999;
Varshosaz, 2006).
1.3.1 (b) Reservoir dissolution control
In reservoir dissolution controlled system the drug particles are coated or
encapsulated by one of the several microencapsulation techniques with slowly
dissolving materials like cellulose derivates, polyethylene glycols,
polymethacrylates, waxes etc. The resulting reservoirs (coated beads, multi-
particulate system, pellets) may be filled as such in hard gelatin capsules (Spansules)
or compressed into tablets (Biju et al., 2004). The common multi-particulate systems
are microparticles (microspheres or microcapsules), nanoparticles (nanospheres or
nanocapsules) and liposomes.

6
1.3.2 Diffusion controlled release
Diffusion of a drug molecule through a polymeric membrane forms the basis of this
controlled drug delivery system. Similar to the dissolution controlled devices, these
are manufactured either by encapsulating the drug particle in a polymeric membrane
or by dispersing the drug in a polymeric matrix.
1.3.2 (a) Matrix diffusion control
Matrix devices are very common because of ease of fabrication. Diffusion controlled
involves dispersion of drug in either water-insoluble or a hydrophilic polymer (Khan
and Reddy, 1997; Viega et al., 1997; Viega et al., 1998). Drug release from insoluble
matrices involves penetration of fluid, followed by dissolution of the drug particles
and diffusion through fluid filled pores. In case of soluble matrix containing
swellable hydrophilic substances the drug becomes available as the matrix swells or
dissolves and swollen matrix then undergoes surface erosion with little or no bulk
erosion. The surface area of the matrix decreased with the time, with a concomitant
decrease in the drug release. The diffusion depends on the solubility of the drug in
the polymer. The drug may either present below its solubility limit and dissolved in
the polymer or present well above its solubility limit and dispersed in the polymer
(Lloyd et al., 1999; Robinson et al., 1990; Marible et al., 2004; Varshosaz, 2006).
Bupropion hydrochloride (Zyban, GlaxoWellcome) is formulated using carnauba
wax and hydroxypropylmethyl cellulose (Biju et al., 2004).

7
1.3.2 (b) Reservoir diffusion control
A core of drug is coated with the water insoluble polymer. The polymer can be
applied by coating or microencapsulating technique. The drug release mechanism
across the membrane involves diffusion of dissolution media through the membrane
to the inside of the core, then dissolution of the drug and diffusion of the drug into
the surrounding fluid. Materials used in such devices are hydroxypropyl cellulose,
ethyl cellulose and polyvinyl acetate. The reservoir diffusion products are Plateau
CAPS capsules (nicotinic acid), Nio-bid (nitroglycerine) and Brankadyl SR cap
(theophylline) (Robinson et al., 1990; Sajeev et al., 2002; Mukerjee et al., 2005).
1.3.3 Osmotic controlled release
Oral osmotic pump, popularly known as ORAS® based on principle of osmotic
pressure to release the drug at constant rate. The rate of drug release from the
products is determined by the constant in flow of the water across semi-permeable
membrane into reservoir, which contains osmotic agents. The drug is either mixed
with the agent or is located in the reservoir. The dosage form contains a small hole
from which the dissolved drug moves out at a rate determined by the rate of entrance
of water due to osmotic pressure. The rate of release is constant and can be
controlled within tight limits yielding relatively constant blood concentrations. The
advantage of this type of product is that the release is unaltered by the environment
of the GIT and it relies simply on the passage of the water into the dosage form.
Altering the osmotic agent and the size of the hole can modify the rate of release. An
example of this type of product is Adalat Oros (Nifedipine) (Prabakaran et al., 2003).

8
1.3.4 Ion exchange resins
Drugs can be bound to ion exchange resins and when ingested, the ionic environment
within the GIT determines the release of the drug. The drug is released slowly by
diffusion mechanism from the resins particle structure. Examples of these types of
products are Duromine containing the basic drug phentermine complex onto an
anionic resin and MS Contin (morphine sulphate) suspension which uses a
polystyrene sulphonate resin (Lloyd et al., 1999; Anand et al., 2001).
1.3.5 Gastroretentive systems
Variability in GI transit time is a concern for oral controlled drug delivery system
(Deshpande et al., 1996). Drugs with a narrow absorption window in the GI tract are
particularly susceptible to variation in both bioavailability and times to achieve peak
plasma levels. Gastroretentive controlled release formulations could offer a potential
solution to the problem by offering a prolonged gastric residence time (Hwang et al.,
1998). Gastroretentive delivery systems (GRDS) are beneficial for such drugs by
improving their bioavailability, therapeutic efficacy and by possible reduction of
dose. Apart from these advantages, these systems offer various pharmacokinetic
advantages like maintenance of constant therapeutic levels over a prolonged period.
This would lead to reduction in fluctuation in therapeutic levels and therefore
minimizing the risk of resistance especially in case of antibiotics. Gastrointestinal
retention depends on many factors such as density of the dosage form, size of the
dosage form, fasting and fed condition, nature of the meal taken, sleep, posture etc.
It also depends strongly on a complicated and unpredictable gastric emptying with
migrating myoelectric complex motility of the stomach (Talukder and Fassihi, 2004).
Various delivery systems like floating, swellable, mucoadhesive, high-density
9
formulations, etc., have been developed to achieve gastroretention (Baumgartner et
al., 2000; Li et al., 2003).
1.3.6 Regulated systems
These devices are capable of releasing therapeutic agents by well defined kinetics
and have significant improvement over conventional controlled release systems. In
these devices drug output is adjusted in response to a physiological need. Regulated
systems can be classified into two, one is externally regulated system and the other is
self-regulatory system. Externally regulated devices can alter their drug output only
in response to an intervention externally. For example, control of diabetes is
achieved by delivering insulin in response to blood glucose levels. While, self
regulated devices can act without external intervention. The response to changes in
temperature or pH within the system leads to drug release. An example of this type
of system is insulin release from pH sensitive polymers. This approach utilizes pH
changes resulting from the conversion of glucose to gluconic acid by glucose
oxidase. Increase in glucoronic level would reduce the pH, which lead to erosion of
polymer and insulin release.
1.4 In vitro evaluation of controlled release formulations
1.4.1 Dissolution studies Dissolution and drug release tests are in vitro tests that measure the rate and extent of
dissolution or release of drug substances from products, usually in an aqueous
medium under the specified conditions. Dissolution apparatus is shown in Fig. 1.2.
Dissolution test is an important quality control for the drug product and is often
linked to the product performance in vivo. In vitro dissolution studies are most often

10
used for monitoring drug product stability and manufacturing process control.
Official book such as United States Pharmacopeia (USP) sets standard for dissolution
of most drug products.
Fig.1.2: Dissolution apparatus (Distek 2000) (Leon et al., 2004).

11
1.4.2 Dissolution conditions
The development of an appropriate dissolution test requires the investigator to try
different agitation rates, different media (including volume and medium) and
different kind of dissolution apparatus. The rate of agitation and nature of the stirrer
effect the hydrodynamic of the system (Fig. 1.3), thereby affecting the dissolution
rate. Stirrings rates must be controlled and the specification differs between the drug
products. The temperature of the dissolution medium must be controlled and
variation in temperature must be avoided. Most of the dissolution tests were
performed at 370C and the current USP 28 lists officially recognized dissolution
apparatus. Once suitable dissolution test is obtained, acceptable dissolution criteria
are developed for the drug product and its formulation. The nature of the dissolution
medium will also affect the dissolution test. The solubility of the drug must be
considered as well as the total amount of the drug in the dosage form. The
dissolution medium should not be saturated by the drug (i.e, sink conditions are
maintained). Usually, a volume of the medium larger than the amount of the solvent
needed to completely dissolve the drug is used in the dissolution test.

12
Fig. 1.3: Dissolution testing apparatus (USP 28), basket (I) and paddle (II) (Melia et al., 1989).
1.4.3 Compendial methods of dissolution
The USP 28 provides several official methods for carrying out dissolution tests of
tablets, capsules and other special products such as transdermal preparations. Tablets
are grouped into uncoated and enteric coated tablets. The selection of a particular
method for a drug is usually specified in the monograph for a particular drug product.
Table 1.1 lists various types of dissolution apparatus and the type of drug products
that is often used in apparatus.

13

14
1.4.4 Dissolution studies for modified release dosage forms
The following factors need to be considered in selecting of dissolution conditions for
evaluation of controlled release dosage forms.
1. Reproducibility of the method
2. Proper choice of medium
3. Maintenance of the sink conditions
4. Control solution hydrodynamic
5. Dissolution rate as a function of pH, ranging from pH 1 to pH 8 and including
several intermediate values
6. Selection of most discriminating variable (medium, pH and rotation speed etc) as
the basis for dissolution test and specification
1.4.5 Dissolution method selection
If a compendial dissolution method and specifications are not available for a drug
molecule then the following criteria needs to be considered in selection of an
appropriate dissolution media and to set the specification limits (Skelly and Barr,
1987).
1 The narrow limit of quantity to be dissolved at the hour time point need to be
included in the dissolution specification so as to consider no dose dumping is
taking place from the controlled release formulation.
2 Appropriate number of time points need to placed in a specification so as to
describe the controlled release characteristics of the dosage form for whole period
of study.
15
3 At the last time point of collection a minimum of 75 to 80% of the drug should be
released from the dosage form.
4 The pH dependence/independence of the dosage form should be checked by
carrying out the dissolution in water and appropriate buffers.
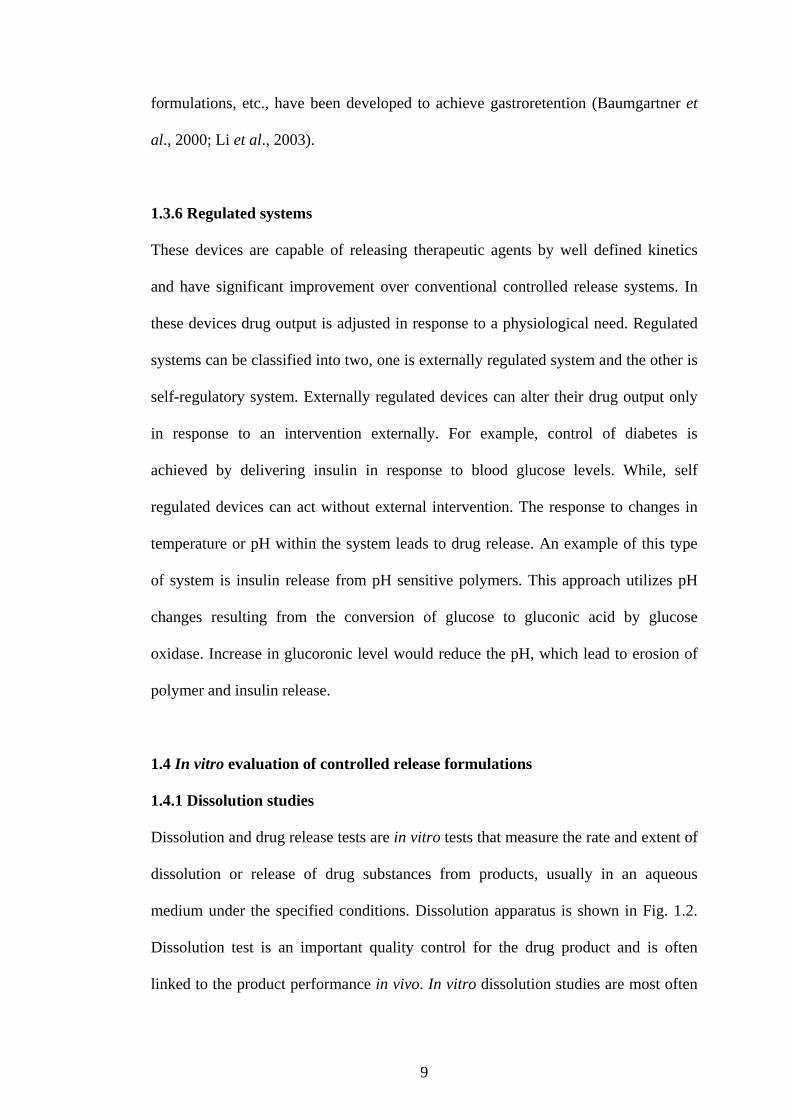
1.5 Paracetamol It is widely used non-prescription, non-narcotic analgesic antipyretic (Prescott and
Wright, 1973; Walson et al., 1989). Chemical name of paracetamol is N-Acetyl-p-
aminophenol. Molecular formula C8H9NO2 and chemical structure of paracetamol is
shown in Fig.1.4.
HN
O
CH3
OH
Fig.1.4: Structural formula of paracetamol
Molecular weight of paracetamol is 151.2 with melting point in the range of 1690C
and 170.50C. Paracetamol is a white crystalline powder, sparingly soluble in cold
water but greater solubility in hot water. It is soluble in methanol, ethanol,
dimethylformamide, ethylene dichloride, acetone and ethyl acetate. But it is slightly
soluble in ether and insoluble in petroleum ether, pentane and benzene. According to
Biopharmaceutical Classification System (BCS), it is a class I drug (high soluble and
high permeable drug) (Chi-Yuan and Leslie, 2005) and it has the log P value of 0.44
(Burya et al., 2000).

16
1.5.1 Clinical pharmacology
Paracetamol also known as acetaminophen is a non-steroidal anti-inflammatory drug
with potent antipyretic and analgesic actions but with very weak anti-inflammatory
activity. When administered to humans, it reduces levels of prostaglandin
metabolites in urine but does not reduce synthesis of prostaglandins by blood
platelets or by the stomach mucosa. Paracetamol is also a weak inhibitor in vitro of
both cyclooxygenase (COX)–1 and COX-2 (Botting, 2000).
1.5.2 Pharmacokinetics
Paracetamol is rapidly absorbed from the gastrointestinal tract and distributed
throughout most body tissues. The plasma half-life is 1 to 4 hours (Qing et al., 2005),
but may be increased by liver damage and following overdosage. Paracetamol is
eliminated principally by liver metabolism (conjugation) and subsequent renal
excretion of metabolites. Approximately 85% of an oral dose appears in the urine
within 24 hours of administration, mostly as the glucuronide conjugate, with small
amounts of other conjugates and unchanged drug.
1.6 Verapamil hydrochloride
Chemical name of verapamil HCl is [DL-2-(3, 4-dimethoxyphenyl)-2-isopropyl-5-
(N-methyl-N-ß (3, 4- dimethoxyphenyl) ethylamino) valeronitrile] (Cole et al.,
1981). The empirical formula is C27H38N2O4 and chemical structure of verapamil
HCl is shown in Fig.1.5.

17
N O
O
O
O
CN
CH3H3C
CH3
CH3
H3C
H3C CH3
.HCl
Fig.1.5: Structural formula of verapamil HCl
Molecular weight of verapamil HCl is 491.07 and melting point is in the range of
1400C and 1440C (USP 21). Verapamil HCl is a white crystalline powder with no
described odor and has a bitter taste. Verapamil HCl is weakly basic drug with pKa
9.04 and log P value 4.6 (Christel et al., 2004). According to BCS, it is a class I drug
(high soluble and high permeable drug) (Chi-Yuan and Leslie, 2005). Verapamil is
soluble in water, methanol and chloroform. But the solubility is pH dependent and
80-90 mg/ml soluble at pH 2.3 to 6.4 where the ionize species predominates.
However, the solubility decreases rapidly at high pH. The solubility of verapamil
HCl at pH 6.76 is 11 mg/ml (chang, 1988).
1.6.1 Clinical pharmacology
Verapamil is a synthetic paraverin derivate, belongs to phenylalkylamine class.
Verapamil is a calcium channel blocker and important therapeutic agent for treatment
of angina pectoris, essential hypertension and arrhythmia (Singh et al., 1978;
Hamann et al., 1983; Garcia et al., 1997).

18
1.6.1 (a) Angina
The two mechanisms of verapamil HCl as an antianginal activity are:
Relaxation and prevention of coronary artery spasm
Verapamil dilates the main coronary arteries and coronary arterioles, both in normal
and ischemic regions. It is a potent inhibitor of coronary artery spasm, whether
spontaneous or ergonovine-induced. This increases myocardial oxygen delivery in
patients with coronary artery spasm which responsible for the effectiveness of
verapamil in vasospastic (Prinzmetal’s or variant) as well as unstable angina at rest.
Reduction of oxygen utilization
Verapamil regularly reduces the total peripheral resistance (after load) against the
heart works both at rest and at a given level of exercise by dilating peripheral
arterioles. This unloading of the heart reduces myocardial energy consumption and
oxygen requirements and probably accounts for the effectiveness of verapamil in
chronic stable effort angina.
The mechanism of the antianginal effect of verapamil HCl is believed to be related to
its specific cellular action of selectively inhibiting trans-membrane influx of calcium
in cardiac muscle, coronary and systemic arteries and in cells of the intracardiac
conduction system. Verapamil blocks the trans-membrane influx of calcium through
the slow channel (calcium ion antagonism) without affecting to any significant
degree the transmembrane influx of sodium through the fast channel. This results in a
reduction of free calcium ions available within cells of the above tissues.
19
1.6.1 (b) Essential hypertension
Verapamil exerts antihypertensive effects by inducing peripheral vasodilation and
reducing peripheral vascular resistance usually without reflex tachycardia. These
effects are mediated by inhibition of calcium ion influx into smooth muscle cells of
the arteriolar wall.
1.6.1 (c) Arrhythmia
The antiarrhythmic effects of verapamil HCl are largely due to its action on the
sinoatrial (SA) and atrioventricular (AV) nodes. Verapamil HCl depresses AV nodal
conduction and prolongs functional refractory periods. Verapamil HCl does not alter
the normal atrial action potential or intraventricular conduction time, but depresses
amplitude, velocity of depolarization and conduction in depressed atrial fibers.
Through this action, it interrupts re-entrant pathways and slows the ventricular rate.
1.6.2 Pharmacokinetics
More than 90% of the orally administered dose of verapamil HCl is absorbed (Jhee et
al., 2005). Due to the rapid biotransformation of verapamil during its first pass
through the portal circulation, bioavailability ranges from 20 to 35%. Verapamil HCl
has non-linear pharmacokinetics because of its saturation kinetics (first pass
metabolism) which leads to non-linear absorption (Eichelbaum et al., 1981; Hamann
et al., 1984; Vogelgesang et al., 1984; Follath et al., 1986; Lunden, 1991). The
plasma half life of verapamil ranges from 3 to 7 hours (Baselt, 1982; Barbieri et al.,
1985; Meredith et al., 1985; Piotrovskii et al., 1986).

20
Verapamil undergoes extensive metabolism in the liver. Twelve metabolites have
been identified in plasma (Wieslaw et al., 2001), out of which only norverapamil was
found in significant amount whereas other metabolites were in trace amounts.
Norverapamil can reach steady-state plasma concentrations approximately equal to
those of verapamil itself. The cardiovascular activity of norverapamil appears to be
approximately 20% that of verapamil. Approximately 70% of an administered dose
is excreted as metabolites in the urine and 16% or more in the feces within 5 days.
About 3 to 4% is excreted in the urine as unchanged drug.
1.7 Release retarding agents for controlled drug delivery
Polymers have gained in importance in the pharmaceutical industry as both drug
encapsulants and vehicles of drug carriage either protecting an active agent during its
passage through the body or in storage by preventing moisture ingress (Udeala and
Aly, 1989) until its release, or controlling its release. Oral controlled release systems
utilize principles such as diffusion, dissolution and permeation for achieving a
constant rate of drug delivery. Polymers are research materials for the preparation of
oral delivery systems. They offer a wide range of properties such as diffusivity,
permeability and solubility that are important for achieving controlled delivery. They
can be processed relatively easy into tablets and membrane by a variety of methods.
Drugs can be dissolved in a polymer to manufacture matrix type oral dosage forms.
Some of the polymers that are commonly used to develop matrix tablets are
hydroxypropylmethyl cellulose, sodium carboxymethylcellulose, polyacrylic acid
and polyethylene oxide (hydrophilic polymers) which are water soluble and ethyl
cellulose, carbomers and waxes (hydrophobic polymers) which are water insoluble.

21
The properties of few hydrophilic and hydrophobic polymers used to develop a
matrix tablets are given below.
1.7.1 Hydroxypropylmethyl cellulose
Hydroxypropylmethyl cellulose (HPMC) is white amorphous powder, with no odor
and taste. The hydration rate of HPMC increases with an increase in the
hydroxypropyl content. HPMC dissolves in cold water to form a viscous solution,
but is not very soluble in hot water. Additionally it is soluble in mixture of water and
alcohol, mixture of ethanol and dichloromethane and mixture of methanol and
dichloromethane (Archer et al., 1992; Kumar et al., 1993; Budavari et al., 1996).
Chemical name of HPMC is propylene glycol ether of methylcellulose. Chemical
structure of HPMC is shown in Fig.1.6. HPMC is a methylcellulose modified with a
small amount of propylene glycol ether groups attached to the anhydroglucose of the
cellulose. The dry product contains 19 to 30% of methoxyl (-OCH3) groups and 3 to
12% of hydroxypropyl (-OCH2CHOHCH3) groups.
OH
CH3
O O
OR
RO
RO
OR
O
O
OR
OR
RO
RR= H or CH3 or
X
n
Fig.1.6: Structural formula of hydroxypropylmethyl cellulose
22
HPMC is an inert hydrophilic polymer with no ionic charge. HPMC is available in
several grades that vary in viscosity and extent of substitution. The viscosity grade of
the polymer depends on the number of substituents on the polymeric backbone and
the length of the cellulose chain. The molecular weight is approximately 10,000-
1,500,000 (Harwood, 2005).
HPMC is used as a rate-controlling polymer for sustained release, coating agent, film
former, stabilizing agent, suspending agent, tablet binder and viscosity increasing
agent. In oral products, HPMC is primarily used as a tablet binder (Chowhan, 1980),
film coating agent (Okhamafe and York, 1982) and as a matrix material for extended
release tablet formulation (Dahl et al., 1990).
1.7.2 Polymethacrylates
Polymethacrylates are synthetic cationic and anionic polymers of diethylamino
ethylmethacrylates, methacrylic acid and methacrylic acid esters in varying ratios.
Eudragit polymers are copolymers of acrylic and methacrylic acid or their esters.
They all have the same basic structure as shown in Fig.1.7. Their specific properties
are determined by different functional groups R1 to R3 and different ratios of acrylic
to methacrylic acid on one hand, and free acids to esters on the other hand. Eudragit
is insoluble in water but it swells, which enables the incorporated drugs to be
released from the formulation by means of diffusion through the swollen matrix.

23
R3
R1
CH3
R2
CH2CH2
nC C
C O
O
C O
O
Fig.1.7: Structural formula of Eudragit
Polymethacrylates are primarily used in oral capsule and tablet formulations as film-
coating agents (Lehmann and Dreher, 1973; Lehmann, 1973a; Lehmann, 1973b;
Gurry et al., 1977; Dew et al., 1982; Lehmann, 1986; Caneron and McGinity, 1987;
Okor and Obi, 1990; Beckert et al., 1996; Jovanovic et al., 1997). Depending on the
type of polymer used, films of different solubility characteristics can be produced.
Eudragit RL, RS and NE 30 D are used to form water insoluble film coats for
sustained release products. Polymethacrylates are also used as binders in both
aqueous and organic wet granulation process. Larger quantities (5-20%) of dry
polymer are used to control the release of an active substance from a tablet matrix.
1.7.3 Eudragit L 100-55
Eudragit L 100-55 is an anionic copolymer of methacrylic acid and ethyl acrylate.
The ratio of the free carboxyl groups to the ester groups is approximately 1:1.
Eudragit L 100-55 structural formula is shown in Fig.1.8.

24
C CH2 CH CH2
CH3
n
OO
H
C C
CH2
CH3
O O
Fig.1.8: Structural formula of Eudragit L 100-55
Eudragit L 100-55 is soluble in water at pH 5.5 and above (Zahirul et al., 1999).
Eudragit L 100-55 can be used for enteric coatings and a targeted delivery in the
duodenum or jejunum. It is also used as enteric polymer for pH independent release
of weakly basic drugs, because incorporation of acidic polymer in matrices would
lead to lowering of the microenvironmental pH of the matrices (Aditya et al., 2004).
1.7.4 Eudragit S 100 Eudragit S 100 is an anionic copolymer of methacrylic acid and methyl methacrylate
with free carboxyl groups in powder form. Eudragit S 100 structural formula is
shown in Fig.1.9. The ratio of the free carboxyl groups to the ester groups is
approximately 1:2. The polymer is soluble in water above pH 6.0 (Zahirul et al.,
1999). But due to the lower content of free carboxyl groups, it dissolves less rapidly
than Eudragit L 12.5 and Eudragit L 100-55. It can be used for a targeted delivery in
the ileum or colon. The site of drug release and the release-rate of drug from the
dosage form can be altered by a combination with different types of Eudragit L.
These polymers provide pH independent drug release that can be used for
formulating the sustained release oral dosage forms.