Embed Size (px)
Citation preview
Description of environmental issues, fish stocks and fisheries in the EEZs
around French Guyana, Martinique, Guadeloupe and La Reunion
Fabian BLANCHARD, Dr
October 2012
Report for the European Commission, Directorate-General Maritime Affairs and
Fisheries, B-1049 Brussels, Belgium

TABLE OF CONTENTS
TABLE OF CONTENTS ............................................................................................................................... 2
1. INTRODUCTION ................................................................................................................................... 4
1.1. CONTEXT ....................................................................................................................................... 4
1.2. TERMS OF REFERENCE .................................................................................................................. 4
1.3. MATERIALS AND METHODS ......................................................................................................... 4
2. FRENCH GUYANA ................................................................................................................................. 6
2.1. FLEETS ........................................................................................................................................... 6
2.1.1. Coastal small-scale fisheries .................................................................................................. 6
2.1.2. Handlines and pots for red snapper .................................................................................... 17
2.1.3. Shrimp trawling ................................................................................................................... 19
2.2. STOCKS ....................................................................................................................................... 20
2.2.1. Red snappers ....................................................................................................................... 20
2.2.2. Shrimps ................................................................................................................................ 23
2.3. ECONOMIC AND SOCIAL PERFORMANCES ................................................................................. 27
2.3.1. Coastal small-scale fisheries ................................................................................................ 27
2.3.2. Shrimp trawlers ................................................................................................................... 34
2.4. ENVIRONMENTAL ISSUES ........................................................................................................... 37
2.4.1. By-catch and discards .......................................................................................................... 37
2.4.2. Environmental issues ........................................................................................................... 39
3. MARTINIQUE and GUADELOUPE ....................................................................................................... 41
3.1. FLEETS ......................................................................................................................................... 41
3.1.1. Martinique ........................................................................................................................... 41
3.1.2. Guadeloupe ......................................................................................................................... 44
3.1.3. Martinique and Guadeloupe fishing fleets targeting Dolphinfish, Flyingfishes and Blackfin
tuna ............................................................................................................................................... 46
3.2. STOCKS ....................................................................................................................................... 47
Flyingfish (Hirundichthys affinis) ................................................................................................... 47
3.3. ECONOMIC AND SOCIAL PERFORMANCES ................................................................................. 49
3.4. ENVIRONMENTAL ISSUES ........................................................................................................... 50
4. LA REUNION ....................................................................................................................................... 51
4.1. FLEETS ......................................................................................................................................... 51
4.1.1. Boats and fishing devices .................................................................................................... 51

4.1.2. Typology .............................................................................................................................. 51
4.1.3. Fishing effort and production .............................................................................................. 54
4.2. STOCKS ....................................................................................................................................... 60
Espadon (Xiphas gladius) ............................................................................................................... 60
4.3. ECONOMIC AND SOCIAL PERFORMANCES ................................................................................. 60
4.4. ENVIRONMENTAL ISSUES ........................................................................................................... 60
5. REFERENCES ...................................................................................................................................... 62
5.1. FRENCH GUYANA ........................................................................................................................ 62
5.2. MARTINIQUE AND GUADELOUPE............................................................................................... 63
5.3. LA REUNION................................................................................................................................ 64

1. INTRODUCTION
1.1. CONTEXT
According to Article 33 of Council Regulation (EC) 2371/2002, the STECF shall be consulted
regularly on the status of EU fisheries including biological, economic and social aspects.
Information on fish stocks and fisheries around the outermost regions (OR's) is limited and
have not been assessed systematically. This prevents the Commission to fully implement the
CFP in these regions, which on the other hand deserve a differential treatment by reason of
their special geographical characteristics (insularity, remoteness, etc.).
1.2. TERMS OF REFERENCE For fishery resources in the EEZs around French Guyana, Martinique, Guadeloupe and La
Reunion, it is requested:
To describe the main stocks and fisheries (differentiating between local, resident and others)
within the EEZs. The description should cover fish stock status, fishing fleets, fishing
techniques, yields and the economic and social performances of these fisheries.
To describe the main environmental issues related to these fisheries; by-catch of sensitive
species, effects of fisheries on natural habitats and influence of the environmental quality of
the water on fisheries performance.
This report is written with this aim in view.
1.3. MATERIALS AND METHODS The French institute for the exploitation of the Sea (Ifremer) has progressively implemented
fisheries information systems (FIS, or SIH in French) in Martinique, Guadeloupe, French
Guyana and Réunion. A part from industrial fisheries such as the trawlers and the handliners
in French Guyana that were followed up since the 80s’, the implementation of the FIS began
around 2005.
Since then, the fleets are now quite well described and quantified as well as the fishing effort.
However, it is more difficult to obtain production at the fleet scale for several reasons :
declaration documents are not always implemented, especially for the small boats (most of the
fleets are constituted of very small boats), and in other cases, fishermen are tempted to under-
report, declare less catches than it is really produced. To avoid this problem, observers were
employed to carry out daily enquiries about production. But the sampling is complex because
of the heterogeneity of the fleets, the high diversity of exploited species, the low activity rate
in some cases, and the numerous fishing harbors identified.
For the same reasons, stock assessments are not always done, knowing that, moreover, the
stocks exploited by the fleets operating from Martinique, Guadeloupe, French Guyana and La
Réunion are also exploited by fleets of other countries. In French Guyana, stock assessment is
done for shrimps and Lutjanids independently from the neighboring countries. Regarding the
Martinique and Guadeloupe stocks, the flyingfish stock is internationally assessed, but with a

low participation of the Martinique and Guadeloupe fleets to the exploitation of this stock. It
is the same case for the swordfish stock exploited by some fleets from La Réunion.
A fortiori, results on economic and social performances are scarce despite that economic
enquiries have also been implemented, allowing to bring diagnostics in French Guyana or at
less, indicators in Guadeloupe.
This report bring a synthesis of analyses carried out from FIS data, published by the Ifremer
as well as of analyses carried out within international working groups for stock assessment.

2. FRENCH GUYANA The French Guyana is an overseas region of France on the North Atlantic coast of South
America. It has borders with two nations: Brazil to the east and south, and Suriname to the
west. Its 83 534 km² have a very low population density of less than 3/km², with half of its
around 236 000 people in 2011 living in the metropolitan area of Cayenne, its capital. The
extent of the surface area of the EEZ is about 134 000 km². The coastal waters are very turbid
because of the large amount of sediments coming out from the Amazon river mouth inducing
muddy bottoms and low salinity. The influence of the Amazone decrease going from coastline
to more offshore areas.
2.1. FLEETS
2.1.1. Coastal small-scale fisheries
2.1.1.1. Vessels
The coastal small-scale fishery is very diverse by the vessel's technical characteristics, but
also by fishing strategies that result. Classification of the boats was established according to
their architecture (Bellail and Dintheer, 1992). Four types of vessels have been identified:
canoe, Creole canoe, improved Creole canoe and tapouille.
The canoe (figure 1) consists of a hull lined with a monoxyle enhanced, with a bow whose
height is equal to or greater than that of the watch and whose back is closed by a vertical array
that receives the caliper of the outboard engine. The canoe is not suitable for navigation at sea
and is used in estuaries.
Figure 1. Traditional canoe (Ifremer picture)
The Creole canoe (figure 2) differs from the canoe by the presence of larger lined. These
boats are often larger than traditional canoes. They are adapted to marine sailing.
Figure 2. Canot créole (Ifremer picture)
The improved Creole canoe (figures 3 and 4) is a framed boat, equipped with outboard motors
or fixed diesel engines. At the rear, a bridge supporting a deckhouse serves cockpit and

navigation it isolates the engine compartment and fuel tank. The bridge stops at the isothermal
hold that occupies the middle of the canoe. The front-decked, covered with a simple floor,
used for the gear use.
Figure 3. Canot créole amélioré (Ifremer picture)
Figure 4. Plate (Ifremer picture)
The tapouille (Figure 5) is a boat typical of the Amazon region of Brazil, with a wood framed
hull and fully bridged. At the rear, the engine and fuel compartment is located under the
bridge. The deck is surmounted by a deckhouse which includes the gateway and the cockpit
sometimes surrounded by a corridor outside. The work deck is located on the front above a
storage compartment for fishing materials. The isothermal hold, integrated, is located below
the deck.
Figure 5. Tapouille (Ifremer picture)
En 2008, the fleet was composed by 26% of canoes, 36% of Creole canoes, 34% of improves
Creole canoes and 5% of tapouilles. A 39.5% increase of the number of canoes was observed
between 2006 and 2008.

This increase reflects the addition of new units since the average age of this type of boat
decreased of approximately 1 year between 2007 and 2008. The increase between 2006 and
2007 of the number of improved Creole canoes (17%) is also due to the contribution of new
vessels. The 18 % decrease of Creole canoes is linked to the disappearance of occasional
landings in Saint-Laurent du Maroni from vessels less active (less than 7 days in the year)
who had helped to increase the number of this category in 2006 (Vendeville et al., 2008).
Table 1 : Number of active boats (including informal ones)
Canoes Creole canoes Improved
Creole canoes
Tapouilles Total
Active in 2006 38 89 54 10 181
Active in 2007 39 66 63 10 178
Active in 2008 53 73 69 10 205
2.1.1.2. Fishing gears
Various fishing gears are used: nets, drift nets, trammel, longlines, Chinese barrier, fishing
rod, angling. Drifting nets are used in 80% of cases, all types of ships combined. The fixed
net is used at 18%. Although the use of the net is fairly common, fishing strategies are not
necessarily identical. Indeed, different mesh sizes of nets are used (30 mm to 110 mm). They
vary depending on the species and size of target species.
2.1.1.3. Species
The coupa weakfish or acoupa rouge (Cynoscion acoupa). The maximum reported observed
size is 110 cm and the maximum weight is 17 kg. It forms schools and is common on depth of
less than 20 m on muddy or sand-muddy grounds, close to river mouths. Its diet consists of
shrimp and fish.
Figure 6 : Acoupa weakfish (Cynoscion acoupa), Ifremer picture.
The smalltooth weakfish or acoupa blanc (Cynoscion steindachneri). Its maximum size
reported in the literature is 110 cm. He lives in the littoral zone at depth of less than 10 m. It
enters estuaries. Its diet consists of shrimp and fish.
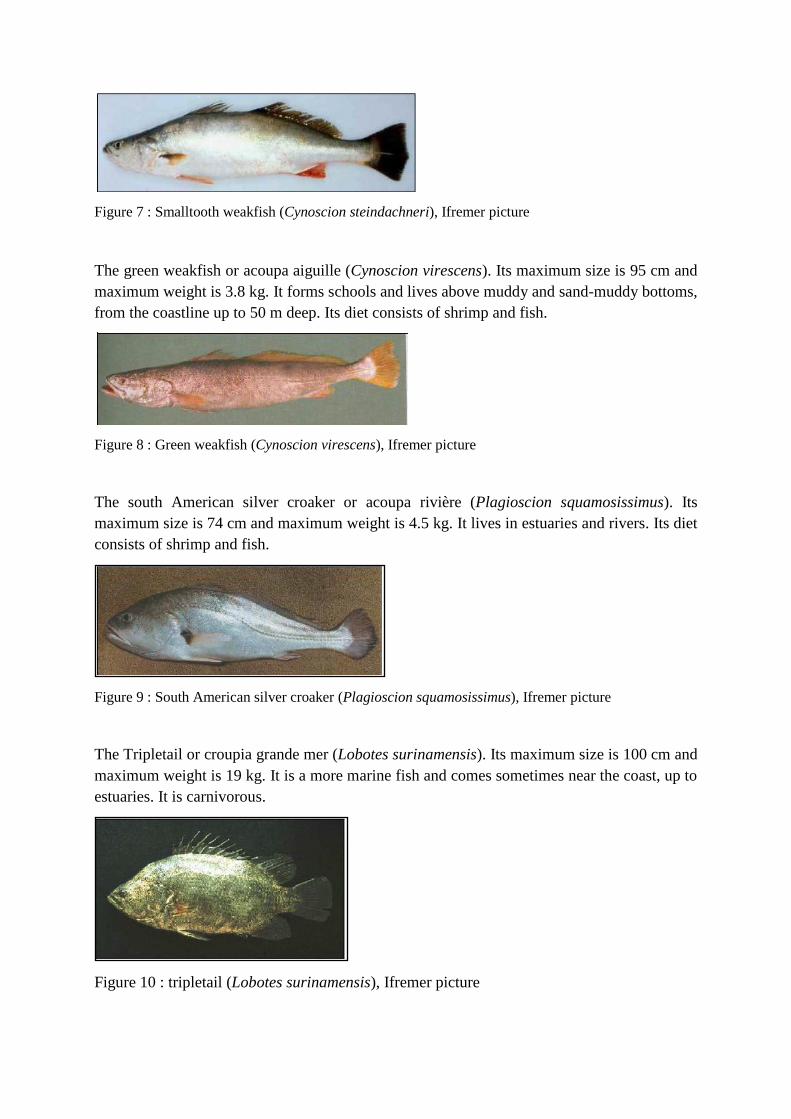
Figure 7 : Smalltooth weakfish (Cynoscion steindachneri), Ifremer picture
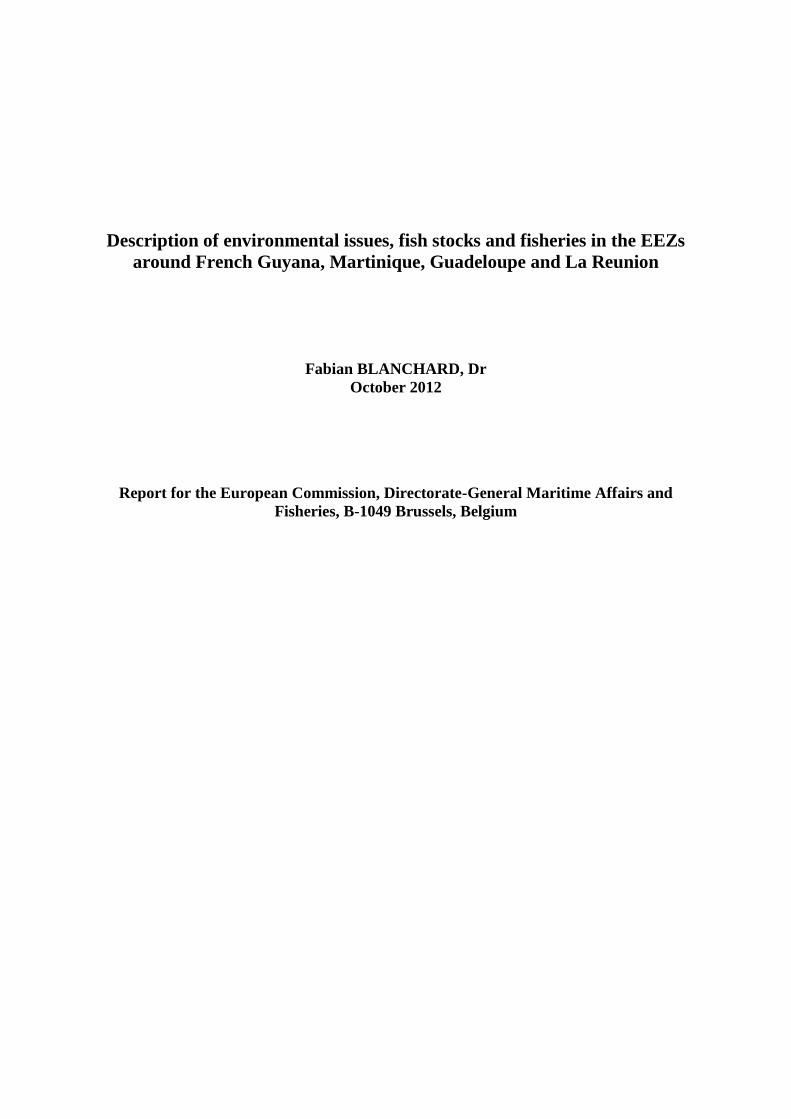
The green weakfish or acoupa aiguille (Cynoscion virescens). Its maximum size is 95 cm and
maximum weight is 3.8 kg. It forms schools and lives above muddy and sand-muddy bottoms,
from the coastline up to 50 m deep. Its diet consists of shrimp and fish.
Figure 8 : Green weakfish (Cynoscion virescens), Ifremer picture
The south American silver croaker or acoupa rivière (Plagioscion squamosissimus). Its
maximum size is 74 cm and maximum weight is 4.5 kg. It lives in estuaries and rivers. Its diet
consists of shrimp and fish.
Figure 9 : South American silver croaker (Plagioscion squamosissimus), Ifremer picture
The Tripletail or croupia grande mer (Lobotes surinamensis). Its maximum size is 100 cm and
maximum weight is 19 kg. It is a more marine fish and comes sometimes near the coast, up to
estuaries. It is carnivorous.
Figure 10 : tripletail (Lobotes surinamensis), Ifremer picture

The Torroto grunt or croupia roche (Genyatremus luteus). Its maximum size is 37 cm and
maximum weight is 0.8 kg. It lives on muddy or sand-muddy grounds of estuaries and near
the coast. Its diet consists mainly of shrimps.
Figure 11: Torroto grunt (Genyatremus luteus), Ifremer picture
The Fat snook or loubine rivière (Centropomus parallelus). Its maximum size is 64 cm and
maximum weight is 5 kg. It lives on muddy or sandy grounds in or near estuaries. Its diet
consists of shrimp and fish.
Figure 12 : Fat snook (Centropomus parallelus), Ifremer picture
The Commin snook or loubine noire (Centropomus undecimalus). Its maximum size is 125
cm and maximum weight is 24.5 kg. It lives in the littoral waters on muddy and sandy
grounds. Its diet consists of shrimp and fish.
Figure 13 : Common snook (Centropomus undecimalus), Ifremer picture

The Gillbaker sea catfish or machoiran jaune (Arius parkeri). Its maximum size is 190 cm and
maximum weight is 40 kg. It lives on grounds from 0 to 20 m deep. Its diet consists of shrimp
and fish.
Figure 14 : Gillbaker sea catfish (Arius parkeri), Ifremer picture
The Crucifix sea catfish or machoiran blanc (Hexanematichthys proops). Its maximum size is
100 cm and maximum weight is 9 kg. It lives on muddy grounds up to 20 m deep. Its diet
consists of shrimp, fish and worms.
Figure 15 : Crucifix sea catfish (Hexanematichthys proops), Ifremer picture
The Bressou sea catfish or petite gueule (Aspistor quadriscutis). Its maximum size is 45 cm
and maximum weight is 1 kg. It lives in turbid waters on muddy grounds. Its diet consists of
shrimp, fish and worms.
Figure 16 : Bressou sea catfish (Aspistor quadriscutis), Ifremer picture
The Scalloped hammerhead shark (Sphyrna lewini). Its maximum size is 420 cm. It is a
pelagic fish that can live in coastal waters but stays offshore when growing older.
Figure 17 : Scalloped hammerhead shark (Sphyrna lewini), Ifremer picture

The Blacktip shark or requin pointe noire (Carcharhinus limbatus). Its maximum size is 275
cm and maximum weight is 123 kg. It is a coastal shark that can live up to 60 m deep. It is a
predator.
Figure 18. Blacktip shark (Carcharhinus limbatus), Ifremer picture
The Smalleye smooth-hound shark or émissole ti-yeux (Mustelus higmani). Its maximum size
is 70 cm and maximum weight is 3.8 kg. It lives from 20 m deep up to à 100 m.
Figure 19. Smalleye smooth-hound shark (Mustelus higmani), Ifremer picture
The giant grouper or mérou géant (Epinephelus itajara). Its maximum size is 260 cm and
maximum weight is 455 kg. It lives on rocky grounds on the coast. It is an opportunist feeder,
but large adults eat mainly fish.
Figure 20. Giant grouper (Epinephelus itajara), Ifremer picture
The white mullet or mulet blanc (Mugil curema). Its maximum size is 45 cm. It eats fish.
Figure 21. White mullet (Mugil curema), Ifremer picture

The Flathead grey mullet or mulet cabot (Mugil cephalus). Its maximum size is 120 cm and
maximum weight is 8 kg. It lives in and near estuaries. Its diet consists of plankton and
vegetal detritus, small crustaceans and worms.
Figure 22. Flathead grey mullet (Mugil cephalus), Ifremer picture
The Parassi mullet or parassi (Mugil incilis). Its maximum size is 45 cm. It lives in estuaries
and near beaches. Its diet consists of vegetal detritus and plankton.
Figure 23. Parassi mullet (Mugil incilis), Ifreemr picture
2.1.1.4. Fishing effort and production
Effort and production data obtained are tabulated for the years 2008, 2009 and 2010.
Production shifts from 2 400 tons in 2008 up to 2800 tons in 2009 and 2010 and the estimated
effort, from approximately 14 000 days at sea up to 15 000 in 2009 and 16 000 days at sea in
2010.
The effort and production are spread over the entire coastline but with their main areas of
production, Cayenne / Remire-Montjoly and Sinnamary (figure 24).
The red weakfish (Cynoscion acoupa) which represents approximately 40% of the landings, is
the species most exploited. Other species are weakfish, sea catfish, snooks, sharks, groupers,
rays (figure 25) ... On average half of the landings (47%) is provided by improved Creole
canoes. The tapouilles, Creole canoes and canoes each perform about 23% of the landings.
Cayenne is the main center of landing with about 40% of the landings. Sinnamary and
Rémire-Montjoly, follow with 25.5% and 15.5% on average over the three years.

Table 2. Production (in tons) of the coastal small-scale fishery in 2010, Ifremer SIH.
Number of landings sampled 4070
Estimated production (in tons) 2831
Weakfishes 1802 64%
Sea Catfishes 456 16%
Tripletail, grunts 102 4%
Sharks 102 4%
Snooks 96 3%
Palikas 53 2%
Others 70 2%
Mullets 35 1%
Groupers 33 1%
Rays 26 1%
Sardines 25 1%
Scombrids 20 1%
Carangids 10 0%
It should be noted that until 2009, the entire production of Saint-Laurent-du-Maroni, of
Awala-Yalimapo and Saint-Georges is the result of an informal activity. The lack of
availability of authorization to exploit (PME) up to 2010 failed regularization of these vessels.
Additional quota of PME are now available, and these fleets are partly being regularized.
Figure 24. Spatial distribution of the landings of the small-scale fisheries in 2008. For Awala And St-Georges, the estimation was done only for
one semester, Ifremer Guyane.

16
Figure 25. Average composition of the landings between 2006 and 2008 (Gourguet, 2009).

17
2.1.2. Handlines and pots for red snapper
2.1.2.1. Vessels and fishing gears
The venezuelian handline fleet has fishing licenses granted individually by Europe (45
licenses) under the double condition that 75% of catches are landed in French Guyana and the
owner or skipper-owner has established a contract with societies of sea products transforming
identified by Europe in Guyana. Production is partly landed at Cayenne, where it will then be
exported to the West Indies in frozen form and partly in Venezuela. Units constituting the
fleet are traditional for the majority of wood, with a length of 13 to 25 m, coming from the
ports of the island of Margarita in Venezuela. The power of these boats varies mostly between
200 and 400 hp and 11 to 17 sailors are generally shipped on board. Fishing is done in small
groups of 4 to 5 boats. Once spotted rocky bottoms (45 to 100m deep), the boat is drifting in
the current. 8-12 lines are placed in the water, each carrying a nylon bottom line fitted from 4
to 7 hooks ranging in size from No. 6 to No. 8. Fishing operation are done during day hours
Figure 26. Venezuelian handline vessel (on the left) ; handline fishing (on the right), Ifremer
pictures
The fleet based in the French Antilles (mainly Martinique but also Guadeloupe) using pots
have free access to the resource of the French Guyana EEZ which is attached to the European
EEZ, this resource under European jurisdiction which are not subject to control access to
resources for countries of Europe. The vessels forming the fleet are usually of aluminum or
resin for a length ranging from 16 to 21 m, power ranging from 300 to 500 hp and shipping
between 6 and 8 fishermen. Traps used are shaped arrowhead, 1.5 m wide, 1 m deep and 0.5
m high. The opening of the spout is 30 cm by 10 cm. The iron grating or plastic, is composed
of hexagonal mesh whose size can vary from 25 to 50 mm side (campaigns conducted on two
fishing boats from Martinique in 2005 and 2007). The number of traps used may vary
depending on the available space on the ship from 60 to over 150. The bait used is the same as

18
this used for line (sardines or small snappers). Pots are put on the ground in the early morning
hours, between 6 and 8 hours, then they are picked up in the afternoon to be returned on the
water between 17h and 18h30 for the night.
Figure 27. Pot vessel for red snaper (on the left) and pots (on the right), Ifremer pictures
2.1.2.2. fishing effort and production
Fishing effort expressed as a number of days fishing in the EEZ of French Guyana is the only
data provided for both fleet segments (handline fleet and pot/trap fleet) in the logbooks. It is
around 3800 days fishing. The activity of the Martinique pot fleet fishing in the EEZ of
French Guiana is variable depending on the year with 1 to 6 vessels operating for 250 fishing
days in total.
The handline fleet for red snapper catches Lutjanus purpureus at 90%, while the pot fleet
catches about 70% of lutjanus purpureus and more than 25% of the snapper Rhomboplites
aurorubens. The production landed in French Guyana fluctuates between 800 and 1600 tons,
about 90% done by the handline fleet (figure 28).
Figure 28. Landings of red snappers by the handline fleet (red) and the Martinique pot fleet
from 1997 to 2008 in French Guyana, in tons (Caro et al., 2009).

19
2.1.3. Shrimp trawling
2.1.3.1. Vessels, fishing gears and species
The shrimp trawler fleet is composed of vessels of 23 meters on average (about 100 GRT) and
engine power of the order of 400-500 hp (294-368 kW). They are all equipped with freezer
units with a capacity of 6 to 10 tons. VMS9 system is mandatory on February 1, 2004 and
allows automatic monitoring of the position of each fishing vessels.
The only fishing technique used is bottom trawling of Florida type. An outrigger rigged on
each side of the vessel, each towing a trawl, and working simultaneously. The mesh in the
codend is 45 mm. An Turtle Excluding Device (TED) is used since 2010.
Figure 29. Shrimp trawler, Ifremer picture.
The catch consists mainly of two species, Farfantepenaeus subtilis and Farfantepenaeus
brasiliensis. The first is the main targeted species. It represents more than 85% of shrimp
landings in Cayenne. The species F. brasiliensis, is fished more offshore and at the eastern
boundary of their spatial distribution.
2.1.3.2. Fishing effort et production
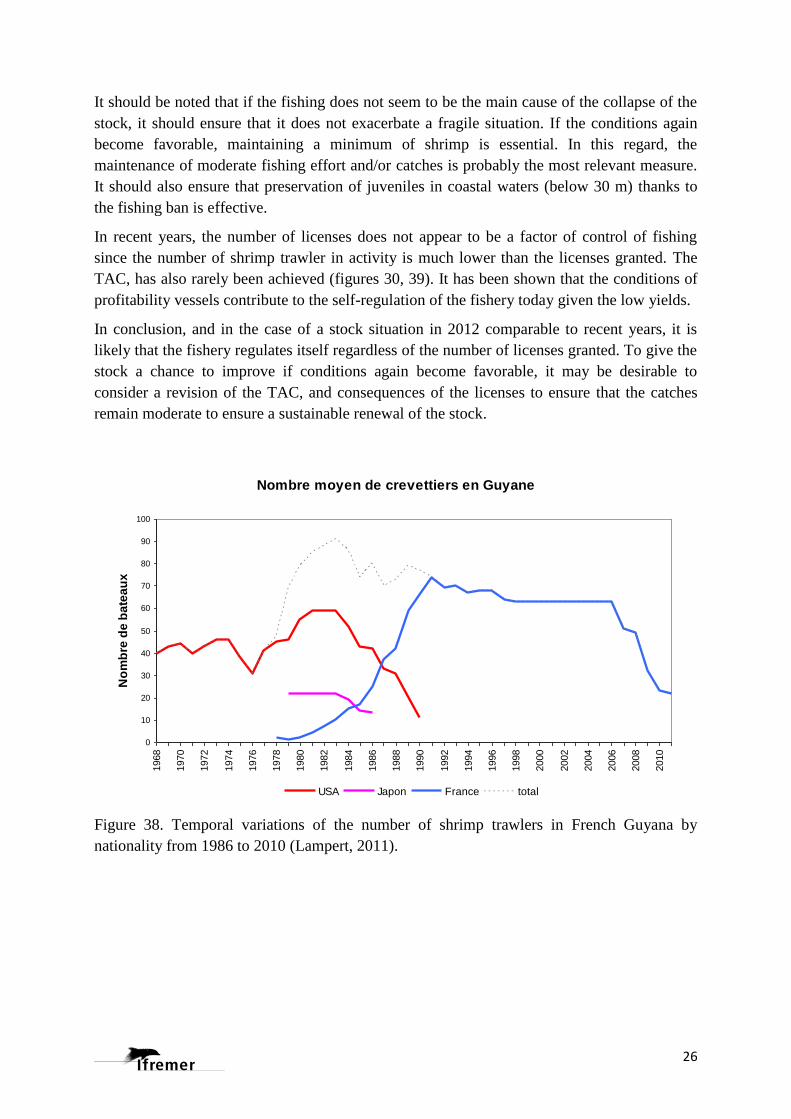
The French fleet progressively took over USA and Japan and reached 60 to 70 boats between
1990 and 2005. The low catches and economic difficulties (see 2.3.2) in the recent years
pushed the owners to stop their activity or reducing the number of fishing boats. Sharp
increases in fuel prices are also causing shift from offshore fishing to areas closer to 30m
deep, below which shrimp trawling is prohibited by the regional representative of the French
20
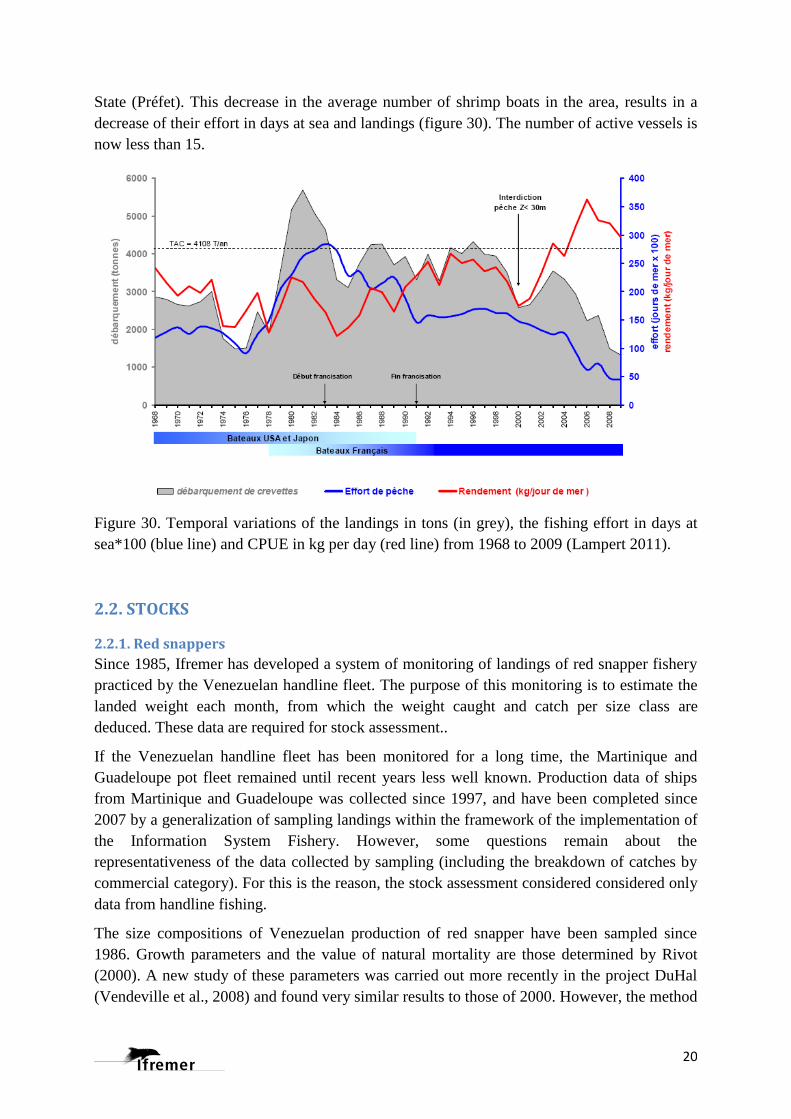
State (Préfet). This decrease in the average number of shrimp boats in the area, results in a
decrease of their effort in days at sea and landings (figure 30). The number of active vessels is
now less than 15.
Figure 30. Temporal variations of the landings in tons (in grey), the fishing effort in days at
sea*100 (blue line) and CPUE in kg per day (red line) from 1968 to 2009 (Lampert 2011).
2.2. STOCKS
2.2.1. Red snappers
Since 1985, Ifremer has developed a system of monitoring of landings of red snapper fishery
practiced by the Venezuelan handline fleet. The purpose of this monitoring is to estimate the
landed weight each month, from which the weight caught and catch per size class are
deduced. These data are required for stock assessment..
If the Venezuelan handline fleet has been monitored for a long time, the Martinique and
Guadeloupe pot fleet remained until recent years less well known. Production data of ships
from Martinique and Guadeloupe was collected since 1997, and have been completed since
2007 by a generalization of sampling landings within the framework of the implementation of
the Information System Fishery. However, some questions remain about the
representativeness of the data collected by sampling (including the breakdown of catches by
commercial category). For this is the reason, the stock assessment considered considered only
data from handline fishing.
The size compositions of Venezuelan production of red snapper have been sampled since
1986. Growth parameters and the value of natural mortality are those determined by Rivot
(2000). A new study of these parameters was carried out more recently in the project DuHal
(Vendeville et al., 2008) and found very similar results to those of 2000. However, the method
21
used by Rivot seems more robust thanks to the correction of catch data by the selectivity
factor. This is why these are the parameters that have been selected for this present evaluation.
The method used in the stock assessment of red snapper is the Virtual Population Analysis
(VPA). The software used for the calculations is the software FiSAT II (FAO - ICLARM
Stock Assessment Tool) published by FAO in 2005. The method used is that of the virtual
population analysis based on the ages described in the FAO Manual (Sparre and Venema,
1996).
Annual catch data by size class are grouped into age using growth parameters. Redistribution
of catches is made at the terminals of the age class. This transformation assumes that the
individual variability of growth is negligible. In the case of red snapper whose longevity is
more than ten years, this requirement only applies for the first three age classes but not
beyond according Pérodou (1994). He recommends using this method in the absence of other
more relevant procedures. Previously, an analysis based on cohort sizes (LCA) was launched
on an average size compositions from 1986 to 2008, to estimate fishing mortality by size class
and determine the best F terminal parameter necessary to analysis of cohort ages.
A preliminary study comparing the results of the methods based on the sizes and ages was
conducted during this evaluation. It suggests that the trends obtained are similar whatever the
method used. In addition, the method using VPA-catch data by age and the results of this has
been confirmed by Mr. André Forest and Mr. Alain Biseau, responsible for the coordination
unit of fishing expertise Ifremer, during their mission in Guyana in April 2009.
The results of the VPA based on ages show that the red snapper recruitment in recent years
seems to remain at a high level (the last 2 years subject to some reservations due to the low
number of data used in the analysis) with a value of around 6 million recruits at age 1. Total
biomass increased steadily since 2003 and reached in 2010 the value that was observed in the
90s, before the collapse of the stock. Spawning biomass also increases, but less rapidly than
the total biomass. Average fishing mortality F on ages 2-5, is maintained at a much higher
level compared to the average F on ages 6 to 11.
In the early 2000s, the stock had been declared in over-exploitation by the relevant Working
group of the Committee on Fisheries of the west-central Atlantic (FAO). After 2002,
recruitment and spawning biomass re-grow. In 2010, the total biomass is at the same level as
that observed before the fall of the stock but with a different age composition: recruitment is
higher but the spawning biomass is less. The stock appears to be restorating.

22
Figure 31. Temporal variation of the recruitment of Lutjanus purpureus in millions of
individuals (VPA outputs) from 1986 to 2010 (Lampert 2011).
Figure 32. Temporal variation of the spawning stock biomass in tons (in blue) and of the total
biomass (in red) of Lutjanus purpureus (VPA outputs) from 1986 to 2010 (Lampert 2011).
23
2.2.2. Shrimps
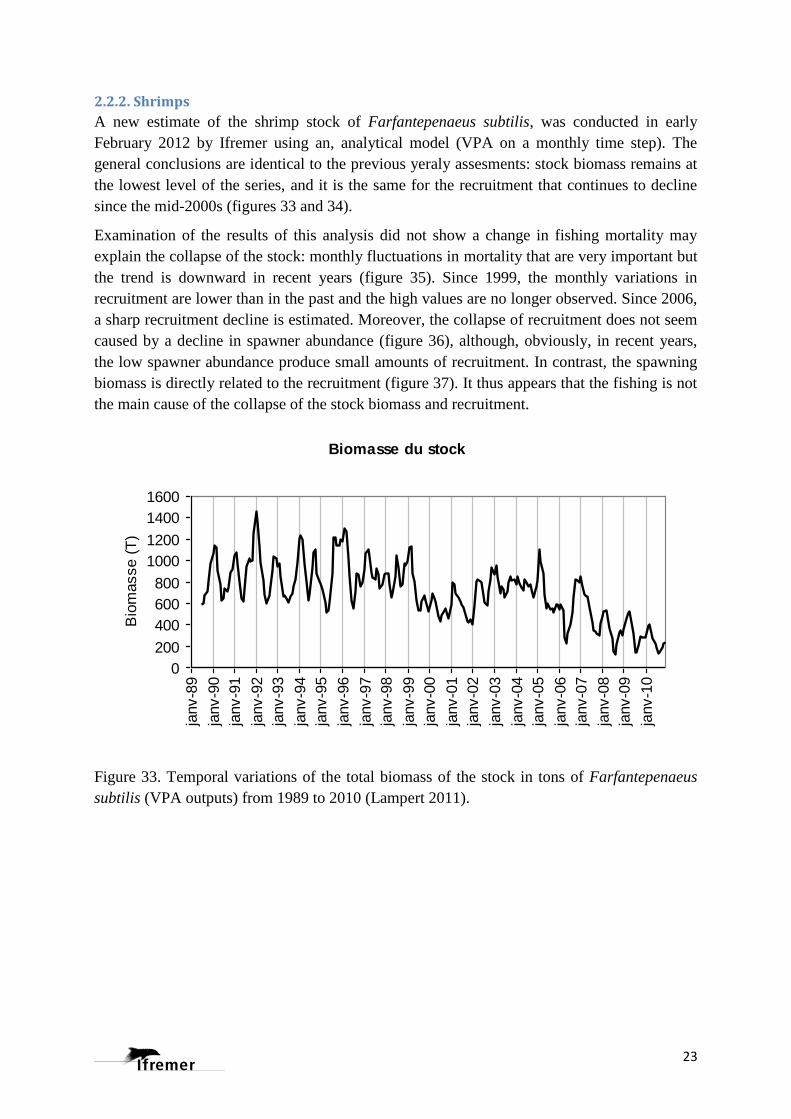
A new estimate of the shrimp stock of Farfantepenaeus subtilis, was conducted in early
February 2012 by Ifremer using an, analytical model (VPA on a monthly time step). The
general conclusions are identical to the previous yeraly assesments: stock biomass remains at
the lowest level of the series, and it is the same for the recruitment that continues to decline
since the mid-2000s (figures 33 and 34).
Examination of the results of this analysis did not show a change in fishing mortality may
explain the collapse of the stock: monthly fluctuations in mortality that are very important but
the trend is downward in recent years (figure 35). Since 1999, the monthly variations in
recruitment are lower than in the past and the high values are no longer observed. Since 2006,
a sharp recruitment decline is estimated. Moreover, the collapse of recruitment does not seem
caused by a decline in spawner abundance (figure 36), although, obviously, in recent years,
the low spawner abundance produce small amounts of recruitment. In contrast, the spawning
biomass is directly related to the recruitment (figure 37). It thus appears that the fishing is not
the main cause of the collapse of the stock biomass and recruitment.
Figure 33. Temporal variations of the total biomass of the stock in tons of Farfantepenaeus
subtilis (VPA outputs) from 1989 to 2010 (Lampert 2011).
Biomasse du stock
0
200
400
600
800
1000
1200
1400
1600
janv-8
9
janv-9
0
janv-9
1
janv-9
2
janv-9
3
janv-9
4
janv-9
5
janv-9
6
janv-9
7
janv-9
8
janv-9
9
janv-0
0
janv-0
1
janv-0
2
janv-0
3
janv-0
4
janv-0
5
janv-0
6
janv-0
7
janv-0
8
janv-0
9
janv-1
0
Bio
masse (
T)

24
Figure 34. Temporal variations of the recruitment in thousands of individuals of
Farfantepenaeus subtilis (VPA outputs) from 1990 to 2010 (Lampert, 2011).
Figure 35. Temporal variations of the fishing mortality F of Farfantepenaeus subtilis (VPA
outputs) from 1989 to 2010 (Lampert, 2011).
Recrutement (2 mois)
0
10000
20000
30000
40000
50000
60000
janv-9
0
janv-9
1
janv-9
2
janv-9
3
janv-9
4
janv-9
5
janv-9
6
janv-9
7
janv-9
8
janv-9
9
janv-0
0
janv-0
1
janv-0
2
janv-0
3
janv-0
4
janv-0
5
janv-0
6
janv-0
7
janv-0
8
janv-0
9
janv-1
0
Recru
tem
ent
(mill
ier
d'in
d.)
Mortalité par pêche (3-7)
0
0.2
0.4
0.6
0.8
1
1.2
1.4
1.6
1.8
janv-8
9
janv-9
0
janv-9
1
janv-9
2
janv-9
3
janv-9
4
janv-9
5
janv-9
6
janv-9
7
janv-9
8
janv-9
9
janv-0
0
janv-0
1
janv-0
2
janv-0
3
janv-0
4
janv-0
5
janv-0
6
janv-0
7
janv-0
8
janv-0
9
janv-1
0
Fm
oyen (
3-7
)

25
Figure 36. Recruitment (thousands of individuals) vs. spawning stock biomass in tons
(Lampert, 2011) .
Figure 37. Spawning stock biomass (in tons) vs. recruitment, in thousands of individuals
(Lampert, 2011).
Explanations of the collapse of recruitment remain uncertain. The assumption of hydro-
climatic changes, mentioned in the past, seems to be robust, but possible processes explaining
causal relationships remain to understand and demonstrate. Furthermore, a new hypothesis is
to study: mortality of young snappers related to bycatch of shrimp trawlers decrease due to
lower activity. Shrimp enter into the composition of the diet of the red snapper juveniles that
live and grow on soft bottoms before going off gradually. Thus, predation by shrimp snapper
increase significantly.
Recommendations
Stock-Recrutement 1989-2010
0
10000
20000
30000
40000
50000
60000
0
20
0
40
0
60
0
80
0
10
00
12
00
14
00
SSB (T)
Recru
t. 2
mois
(m
illie
rs d
'ind.)
Recrutement-Stock 1989-2010
0
200
400
600
800
1000
1200
1400
0
10
00
0
20
00
0
30
00
0
40
00
0
50
00
0
60
00
0
Recrutement 2 mois (milliers d'ind.)
SS
B (
T)
26
It should be noted that if the fishing does not seem to be the main cause of the collapse of the
stock, it should ensure that it does not exacerbate a fragile situation. If the conditions again
become favorable, maintaining a minimum of shrimp is essential. In this regard, the
maintenance of moderate fishing effort and/or catches is probably the most relevant measure.
It should also ensure that preservation of juveniles in coastal waters (below 30 m) thanks to
the fishing ban is effective.
In recent years, the number of licenses does not appear to be a factor of control of fishing
since the number of shrimp trawler in activity is much lower than the licenses granted. The
TAC, has also rarely been achieved (figures 30, 39). It has been shown that the conditions of
profitability vessels contribute to the self-regulation of the fishery today given the low yields.
In conclusion, and in the case of a stock situation in 2012 comparable to recent years, it is
likely that the fishery regulates itself regardless of the number of licenses granted. To give the
stock a chance to improve if conditions again become favorable, it may be desirable to
consider a revision of the TAC, and consequences of the licenses to ensure that the catches
remain moderate to ensure a sustainable renewal of the stock.
Figure 38. Temporal variations of the number of shrimp trawlers in French Guyana by
nationality from 1986 to 2010 (Lampert, 2011).
Nombre moyen de crevettiers en Guyane
0
10
20
30
40
50
60
70
80
90
100
1968
1970
1972
1974
1976
1978
1980
1982
1984
1986
1988
1990
1992
1994
1996
1998
2000
2002
2004
2006
2008
2010
No
mb
re d
e b
ate
au
x
USA Japon France total

27
Figure 39. Temporal variations of the shrimp landings in French Guyana from 1999 to 2011
(Lampert, 2011).
2.3. ECONOMIC AND SOCIAL PERFORMANCES
2.3.1. Coastal small-scale fisheries
This work is based on a survey carried out in 2009 about the economic situation of this fishery
in 2008, with vessels owners. In total, 49 of 177 active vessels were surveyed either a
sampling rate of 27.7%. Vessels surveyed are based on Cayenne and Rémire-Montjoly (27
vessels), Kourou (8), Sinnamary (5) and St. Laurent (9).
Data on Saint Laurent have not been fully used in this work. Costs incurred by vessels based
in St. Laurent are very different from those based on other municipalities. Because of the
distance from Cayenne and lack of infrastructure, some owners actually supply in ice, fuel
and fishing gear in Suriname (on the other side of the river).
2.3.1.1. Methods
2.3.1.1.1. Fishing effort and production
Database available at Ifremer can learn the technical characteristics of the most active vessels.
The fishing effort in number of days at sea is also available for most vessels. This effort is
obtained from the daily record of absences and presences of the vessels. Production data of
ships are also available (for more than 50% of the known trips). Ship production was obtained
by extrapolating known production by the number of days at sea observed. Only vessels that
have more than 50 fishing days in the year was considered here.
Debarquements 1989-2011
0
500
1000
1500
2000
2500
3000
3500
4000
4500
5000
1989
1991
1993
1995
1997
1999
2001
2003
2005
2007
2009
2011
Débarq
uem
ents
(T
)

28
2.3.1.1.2. Turnover
Information about the turnovers are crucial. However, such information is sensitive and te
French experience in economic surveys showed that in general, fishermen are refractory to
communicate about this. Only selling prices by species and marketing channels have been
completed. Turnover was calculated from these prices and total production by species
obtained by extrapolation.
2.3.1.1.3. Intermediate consumptions
Data on annual expenditures for intermediate consumption (fuel, ice, oil and food) were
calculated on the basis of expenditure per trip multiplied by the number of trips made. The
number of trips made was estimated from the average duration in days of a trip and number of
days at sea observed. The drop in fuel prices that occurred in December 2008 was taken into
consideration.
2.3.1.1.4. Payroll
The amounts of expenditure in total annual payroll, were not always provided. For those who
were able to pay the amounts, they do not necessarily linked to the activity in 2008. Payroll
amounts for 2008 have been calculated using tax rates provided by the Maritime Affairs (now
Department of the Sea) and the number of days of enrollment reported by shipowners. The
fishermen aboard vessels surveyed are foreign nationals. It was assumed that all shipowners
performs a "half-role" as often observed.
2.3.1.2. Results
2.3.1.2.1. Fishing effort and yields
For our sample (34 vessels), the annual average effort is low, 124 fishing days with a
coefficient of variation of 38% (Figure f0). This effort is on average the same for all
categories except for tapouilles at which it stood at 176 days. The average daily yield is 227
kg / fishing day but with a coefficient of variation of 52% (figure 41). Indeed, tapouilles have
a much higher yield to other categories of ships: 431 for the latter against yield values ranging
from 156 to 222 kg per fishing day.Pour notre échantillon (34 navires), l’effort moyen annuel
est faible, 124 jours de pêche, avec un coefficient de variabilité de 38 % (figure 40).

29
Figure 40. Nombre de jours de pêche des navires par catégorie de longueur (Cissé, 2009).
Figure 41. Rendements par jour de pêche (Cissé, 2009).
2.3.1.2.2. Mode of commercial distribution and selling prices
Once landed, the production may follow three channels. It can be either sold directly to
consumers (direct selling) or to wholesalers, or to processing factories. Direct sales for 60%

30
of ships surveyed, selling to wholesalers and millers for respectively 50 and 35%. A Cayenne
sales to wholesalers predominates (85%), unlike other towns where direct selling is the most
observed.
The selling price per kg varies greatly depending on the mode of distribution. Generally, the
price per kg in direct sales is logically higher, representing double the sale to wholesalers or
factories. Thus the value of production of each vessel is related to the mode of distribution
used. In direct sales, the market is quickly saturated, hence the requirement for owners to use
the wholesalers and millers to sell their production.
The highest price in direct sales is 6.86 euros per kilo for “machoiran jaune” (a sea catfish),
whose production is mainly carried out after trips in the western waters of French Guyana.
The price is low when compared to prices in France or the Caribbean. Under these conditions,
it seemed appropriate to analyze the impact of the sale price on the profitability of vessels.
Tableau 3: Mean selling price according to the mode of commercial distribution (Cissé, 2009)
Species Acoupa
Rouge
Acoupa
blanc
Acoupa
aiguille
Acoupa
rivière
Croupia
mer
Croupia
roche Loubine
Direct1 4,6 € 4,25 € 3,13 € 3,5 € 5 € 5,6 € 4,6 €
Short2 2,31 € 2,17 € 1,47 € 1,45 € 1,53 € 3,89 € 2,23 €
Species Machoiran
Jaune
Machoiran
blanc Requin Carangue Mérou Tarpon Mulet
Direct 6,86 € 2,7 € 3,25 € 3,67 € 5,71 € 2,8 € 4,86 €
Short 4 € 1,41 € 1,17 € 1,28 € 3,37 € 1,38 € 2,54 €
2.3.1.2.3. Gross operating surplus, net operating income and net daily salary
Two intermediate balances were calculated for the entire sample, the gross operating surplus
(GOS) and the net operating income (NOI). GOS represents what remains in the company
after deducting turnover intermediate consumption and personnel expenses. NOI is GOS
minus depreciation. Depreciation is calculated on the straight-line method and lifespan is
considered to 10 years for the ship's hull, 5 years for the ice blocks and 3 years for the
engines. To make comparisons between classes of ships, we reported these indicators the
number of days at sea carried out in the year. NOI average for the category "tapouilles" could
not be assessed due to lack of information on the value of invested capital.
Thus, a day at sea, the average GOS stood at 71€, NOI at 8 € and net pay by fisherman to 46
euros (figure 42). A negative daily average NOI was observed for the categories [9-10m[ and
[10-12m[. However, we note in each category of vessel, a high variability of these indicators.
1 Direct is direct sale to consumers without intermediaries.
2 Short involves an intermediary, which may be the fishmonger or processing factories.

31
Thus, 62% of our sample has a positive GOS, 46% a positive NOI and only 38% are able to
offer a daily net income above the minimum wage (SMIC in France). Results for category [8-
9m[ be explained by the fact that most of the vessels in this category sell their produce
directly to consumers and therefore with a higher selling price.
Figure 42. GOS (EBE in French), NOI (RNE in French) and net salary per daya t sea (Cissé, 2009) for
each category of vessel and for the total (Ensemble).
2.3.1.2.4. Sensitivity analyses of NOI and net daily salary according to fish selling prices
Fuel costs represent on average a quarter of the costs of intermediate inputs3. The sensitivity
analysis is made taking into account the untaxed gasoline prices that prevailed before
December 2008, 1.17 euros / liter. The prices are average prices considered all species and it
is assumed that all vessels comply with the same price.
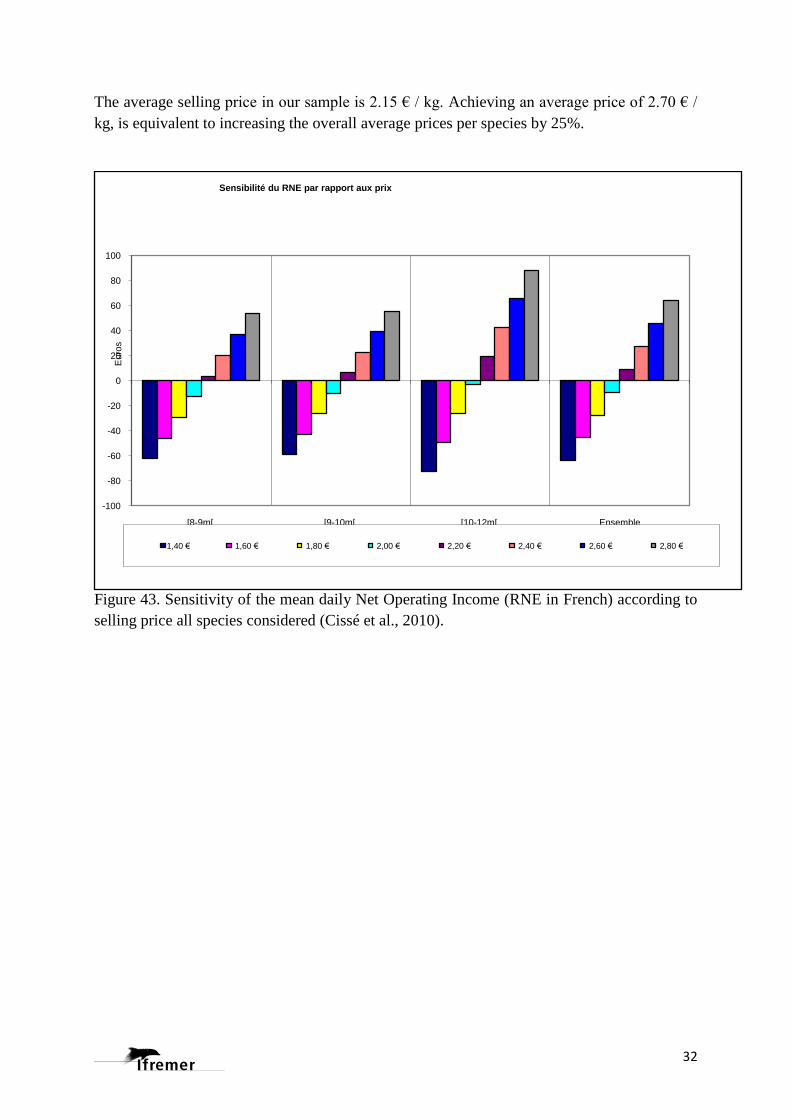
It is observed that with 2,20 € / kg, the average NOI is positive (figure 43) and the average
daily net wage is higher than the minimum french wage (figure 44), for all categories.
However, at this price, only 46% of our sample is concerned (figure 45). If we set a goal of
75% of positive NOI, an average price of € 2.70 is necessary and then 74% offers a daily net
income exceeds the minimum wage.
3 Fuel prices in 2008 was considered in this study as 2008 was in fact the reference year of the survey in 2009.
The general strikes in November and December 2008 resulted in obtaining a reduction in fuel prices effective at the beginning of 2009. However, it re-increased steadily since and it is reasonable to assume that this global trend due to declining stocks of hydrocarbons will probably not reverse. The fuel price is in 2012 at the same level than that observed before the strike.
[8-9m[ [9-10m[ [10-12m[ Tapouilles Ensemble (34)
EBE/jm 59 10 24 190 71
RNE/jm 42 -11 -9 - 8
Sal_net/jm 56 37 38 54 46
-50
-
50
100
150
200
Eu
ros
EBE/jm, RNE/jm et Salaire net journalier
32
The average selling price in our sample is 2.15 € / kg. Achieving an average price of 2.70 € /
kg, is equivalent to increasing the overall average prices per species by 25%.
Figure 43. Sensitivity of the mean daily Net Operating Income (RNE in French) according to
selling price all species considered (Cissé et al., 2010).
-100
-80
-60
-40
-20
0
20
40
60
80
100
[8-9m[ [9-10m[ [10-12m[ Ensemble
Euro
s
Sensibilité du RNE par rapport aux prix
1,40 € 1,60 € 1,80 € 2,00 € 2,20 € 2,40 € 2,60 € 2,80 €

33
Figure 44. Sensitivity of the daily net salary / selling prices in euros (Cissé et al., 2010).
Figure 45. Ratio (%) of vessels with positive NOI (RNE) according to the mean selling price
all species considered (Cissé et al., 2010).
0
10
20
30
40
50
60
70
80
90
100
[8-9m[ [9-10m[ [10-12m[ Tapouilles Ensemble
Euro
s
Sensibilité du salaire net journalier / au prix
1,40 € 1,60 € 1,80 € 2,00 € 2,20 € 2,40 € 2,60 € 2,80 €
0%
10%
20%
30%
40%
50%
60%
70%
80%
90%
1,40 € 1,60 € 1,80 € 2,00 € 2,20 € 2,40 € 2,60 € 2,80 €
Pourcentage de navires présentant un RNE positif par tranche de prix

34
2.3.1.3. Synthesis
54% of the vessels show a negative result. Three solutions are possible to improve the
situation: increase the level of production, reduce costs or increase prices.
Apart from considerations on the status of exploited stocks, increasing the level of production
through the fishing effort is only possible if new opportunities are created. Currently, a small
portion of the production is exported and the local market is quickly saturated. Increased
landings shall have the effect of decreasing the price.
Cost reduction that can only be effective through the establishment of a co-provisioning with
a cooperative, and management of fuel prices by the government. Currently, the existing
cooperative offers only ice and fuel to its members. Untaxed fuel prices reached a record in
2008 with a price of 1.17 € per liter. Following the social movement in December 2008 the
price rose to € 0.61.
The increase in selling price raises the issue of the impact of the rise at the consumer level. Is
the consumer willing to buy most expensive fish? Can intermediaries afford to reduce their
margin?
Under the assumption of a fuel price equal to that observed before December 2008, an
increase of 25% of the selling price, all other things being equal, allows more than 75% of our
sample to have a net positive operating income. However, assuming a fuel price
corresponding to that observed after December 2008, an increase of 12% of the sale price just
to get a similar result. Note that these price increases have a positive effect on the level of
remuneration of the sailors. This could reduce the turnover rate of umployed fishermen, and
thus retain the workforce that is sometimes lacking.
2.3.2. Shrimp trawlers
The project « CHALOUPE » funded by the Ifremer and the French National Agency for
Research (ANR), allowed to carry out enquiries on economics questions about shrimp
trawling and to implement a bioeconomic model.
The bioeconomic model of the shrimp fishery of French Guyana has been developed
according to three main objectives:
Represent the dynamics of the fishery earlier through the period 1994-1996. This period was
chosen because of the availability of robust data on effort and catches, collected by Ifremer
scientists in charge of scientific aspects of the fishery.
Simulate the impact of exogenous changes in the fishery. These changes may be economic
(mainly the world price of shrimp and fuel costs) and environmental. We use the assumption
that variations in recruitment of shrimp are representative of changes in the environment.
Test the impact of changes in management or public policy more generally. This concerns
policy instruments already used but the impact of some decisions, such as the adoption of
selective gear to reduce fishing capture and reduce mortality caused by the shrimp fishery on
endangered species such as sea turtles were also simulated.

35
The software Vensim ® has been chosen as a modeling tool. Several analyses of data on
catches and fishing effort have been made to supply the data and model parameters. Some
specific studies were needed to obtain the parameters of cost and price for the year 2006. The
model is composed of different modules involved. All monetary variables are expressed in
constant terms (€ 2006), using the price index for deflation. Firstly, the model provides
representions of the dynamics of fisheries for the period 1994 to 2006. Projections can be
done for a period of 10 years from the previous period, based on assumptions about the
biological and economic parameters. The time step of the model is one day.
The resource module used a model of age structure for both target species (F. subtilis and F.
brasiliensis), with monthly cohorts of males and femelles. Two types of fishing strategy were
identified: coastal fishing (30 to 50 m deep) and large (more than 50 m deep). Strategies are
characterized by different capacities to catch target species. A calculation is done for each
cohort by species and sex, and the instantaneous total catch is obtained by a sum among the
different cohorts.
Model quality is assessed by its ability to reproduce the dynamics of the fishery earlier period
of 1994-2006. Through this period, the model gives quite good results on the total catch in
shrimp and stock biomass (figures 46, 47). On the economic point of view, the two main
crises (2000-2001) and 2006 are also recreated by simulation. Scenarios can then be tested.
Figure 46. Model outputs compared to observations : total catches observed (in red) and
simulated from the model (in blue), in tons per day (From Chaboud et al., in Lampert, 2011).
20
15
10
5
0
1994 1995 1996 1997 1998 1999 2000 2001 2002 2003 2004 2005Year
Simulated catch t/dayObserved Catch t/day

36
Figure 47. Model outputs compared to observations : total biomass computed from VPA (in
blue) and simulated from the model (in red), in tons (From Chaboud et al., in Lampert, 2011).
The model shows that with the decrease in the value of shrimp (due to high intake of farmed
shrimp, mainly from South-East produced at lower cost in a internationalized market that does
not distinguish aquaculture products and livestock), the stock decrease, the increasing costs,
the number of vessels economically viable has declined. The use of the model also shows an
economic over-exploitation. Only the results of two management scenarios combining
ecological and economic changes are shown here. On the one hand, a decrease of 50% of the
grant “Poseidom” is simulated, and secondly a change in the subsidy to encourage less
catches of small shrimps. For the price of diesel, we used a growth rate of 15% per year.
These economic scenarios are complemented by a shrimp recruitment scenario based on data
from the period 2004-2007, that is to say very bad ones. The simultaneous consideration of
both types of change leads to a reduction of the fleet from 18 to 10 vessels in 2016 (figure
48). Self-regulating behavior allows a very significant renewal of the resource, despite a low
recruitment regime used in this simulation. This result underlines the risk of non economic
viability for the fishery if current trends in shrimp prices and diesel does not stabilize or not
reverse.
6,000
4,500
3,000
1,500
0
1995 1996 1997 1998 1999 2000 2001 2002 2003 2004 2005 2006 2007annéedécimale
Biomass_VPA tBiomass_Simulated t

37
Figure 48. Model outputs from economic and environmental scenario total stock biomass (1
and 2) and number of vessels (3 and 4) according to scenarios : fuel cost increase and grant
Poseidom decrease (1 et 3), fuel cost increase and increased grant only for large shrimps (2 et
4) (From Chaboud et al., in Lampert, 2011).
2.4. ENVIRONMENTAL ISSUES
2.4.1. By-catch and discards
2.4.1.1. Coastal small-scale fisheries
The coastal small-scale fishery is studied since 2006 by the establishment of a network of
observers in coastal communities. Observers of Sinnamary, Kourou and Cayenne have made
31 shipments between September 2008 and July 2009, representing 52 fishing operations at
sea observed.
For sampling on vessels of Kourou, fish biomass discarded is 1342 Kg while the catches
retained are 4775 Kg The discarding rate is then 22% of the catches. For sampling on vessels
of Sinnamary, the fish biomass discarded is 2224 Kg while the biomass retained is 4365 Kg
The discarding rate is then 33.75% of the catches. The sampling of the ships of Cayenne is too
low to make an estimate.
On a total of 12 769 Kg of fish caught, 3 374 Kg were discarded, representing a little more
than 25% of discarding rate.
Even if the biomass of fish kept is about three times higher than the biomass of fish discarded,
discarding is not negligible. Based on the information gathered from various fishermen,
several hypotheses could explain the discards. Firstly, it could be explained by the effective
fishing duration. Indeed the fishermen may leave their nets in the water more than 5 hours and
some time, for fixed nets, up to 15 hours, which is too much. If, for example, a fish is caught
in the net after the first three hours, then it may well be rotten. Otherwise, the fish trapped can
be bitten by another fish, so the fish bite is no longer marketable.
4,000 t80 Boats
3,000 t60 Boats
2,000 t40 Boats
1,000 t20 Boats
0 t0 Boats
2000 2001 2002 2003 2004 2005 2006 2007 2008 2009 2010 2011 2012 2013 2014 2015 2016Year
Biom_2004_2007a tBiom_2004_2007b tFleet_2004_2007a BoatsFleet_2004_2007b Boats

38
Importance of the mesh size: the height and width of the meshes are very important factors for
releases. Indeed, if the fisherman has a small mesh, it has a high potential to catch small fish,
too small to be consumables thus causing discarding.
2.4.1.2. Shrimp trawling
The exploitation of the shrimp with trawls induces important by-catches, evaluated between 7
and 12 kg per kg of shrimp (Harness et al., 2006), nearly 40 000 tons per year for an average
annual production of 3800 tons of shrimp. The main part of these by-catches are discarded.
By-catches are higher in coastal areas where small shrimp are more abundant as well as fish
biomass. However, a current annual production of 1000 tons (in 2011), discards are reduced
to about 10 000 tons.
Since 2010, a selectivity device, the turtle excluding device is required to obtain a fishing
license. This device also reduces by-catches, and thus discards, especially larger fish species.
This device should be associated with a by-catch reducing device (BRD), but this is not yet
the case.
2.4.1.3. Red snapper fishery
The issue of compared intra-specific selectivity for the pot fishery and the handline one is
raised. An analysis of structures of size of red snapper landings (Lutjanus purpureus) by the
handline fleet and the pot fleet showed no statistically significant differences, despite pots
seem to catch more small sizes than handlines (figure 49). Both fisheries catches small
individuals. In addition, the fishing practiced by the pot fleet can induce ghost fishing (pots
lost on the bottom). This difficulty could be resolved by implementing a pot that could
deteriorate after a time on the bottom after being lost, and with larger mesh size.

39
Figure 49. Selectivity curves for the Martinique and Guadeloupe pot fleet (in blue,
“Caseyeurs”) and for the venezuelan handline fleet (in red and yellow, “Ligneurs”), for
samples get in 2007 and 2008 (Caro et al., 2010).
2.4.2. Environmental issues
Shrimp trawlers
The renewal capacity of this stock does not depend on the spawning biomass (cf. 2.2.2.), up to
a certain limit (no reproduction if no spawner). Environmental, climatic and trophic factors
may then be the cause of the fall of shrimp recruitment in French Guyana.
The drift of eggs and larvae from the AMAPA. The littoral drift of ocean waters to the NW is
the main cause of the arrival of Amazonian sediments shaping the French Guyanese coast. We
can imagine that this also brings the eggs and larvae of shrimp from northern Brazil to the
coasts of Guyana:
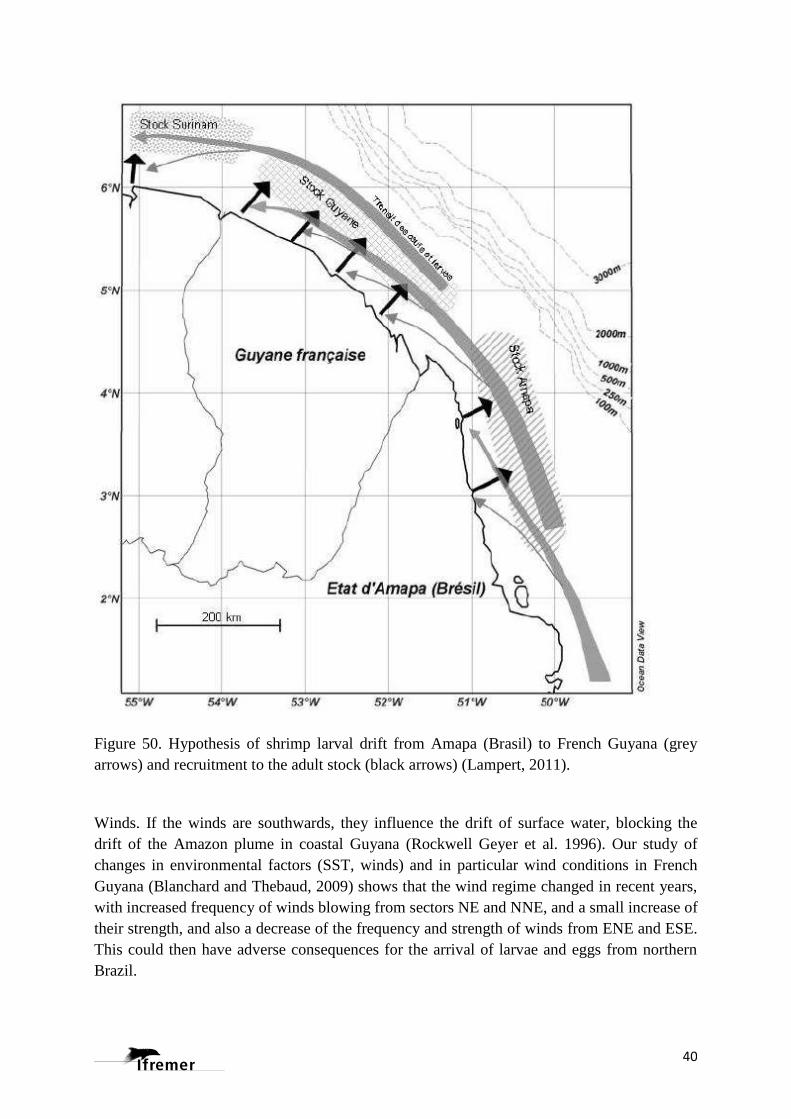
Currents. If we consider the area that stretches from Suriname to the mouth of the Amazon as
a biological continuum for F. subtilis, we could imagine the drift of larvae and eggs from
Brazil to Guyana following the ocean currents. Then, the larvae may feed the local stock
(figure 50). The journey undertaken by eggs and larvae then varies between 100 and 500 km.
That way, if it must be done in 21 days (larval development time), it implies an average speed
of 5-25 km / day (respectively 6 and 30 cm / s), which is perfectly compatible with the
velocity measures in the area, which are of the order of 30 to 200 cm / s (Baklouti et al. 2007;
Rockwell Geyer et al. 1996).
40
Figure 50. Hypothesis of shrimp larval drift from Amapa (Brasil) to French Guyana (grey
arrows) and recruitment to the adult stock (black arrows) (Lampert, 2011).
Winds. If the winds are southwards, they influence the drift of surface water, blocking the
drift of the Amazon plume in coastal Guyana (Rockwell Geyer et al. 1996). Our study of
changes in environmental factors (SST, winds) and in particular wind conditions in French
Guyana (Blanchard and Thebaud, 2009) shows that the wind regime changed in recent years,
with increased frequency of winds blowing from sectors NE and NNE, and a small increase of
their strength, and also a decrease of the frequency and strength of winds from ENE and ESE.
This could then have adverse consequences for the arrival of larvae and eggs from northern
Brazil.

41
3. MARTINIQUE and GUADELOUPE Martinique is an island in the Lesser Antilles in the eastern Caribbean Sea, with a land area of
1 128 km². Like Guadeloupe, it is an overseas region of France, consisting of a single
overseas department. To the northwest lies Dominica, to the south St Lucia, and to the
southeast Barbados. With around 404 000 people living in Martinique, Fort-de-France is its
capital. The surface area of the EEZ is about 47 600 km².
Guadeloupe, is also an island in the Lesser Antilles in the eastern Caribbean sea, with a land
area of 1 628 km² and a population of 400 000. It is an overseas region of France, consisting
of a single overseas department. Besides Guadeloupe island, the smaller islands of Marie-
Galante, La Désirade, and the Îles des Saintes are included in Guadeloupe. Pointe-à-Pitre is
the capital of Guadeloupe. The surface area of the continental shelf is about 96 000 km².
The continental shelf of these two regions is short and the ocean waters are oligotrophic, with
clear waters and coral reef ecosystems.
3.1. FLEETS
3.1.1. Martinique
In 2010, the number of vessels listed is 1111. Nearly 80% of the vessels are small, between 6
and 8 meters in length, with an outboard engine for an average power between 39 and 90 kW.
The number of men on board varies on average between 1.7 for smaller vessels and 5.8 for the
largest, which represents all 1743 sailors. These numbers have remained relatively stable
since 2007. 75% of the vessels fish on the coastal area (within 12 miles) and 46% fish more
offshore. These vessels are distributed all along the coast of Martinique with 23 main
operating ports.
Table 4. Number of boats and mean engine power in 2010, Ifremer-SIH
Boat length (in m) Number of boats Engine power (kW)
< 5 14 16
5-6 87 24
6-7 278 39
7-8 609 90
8-9 73 172
9-10 24 205
10-11 5 227
11-12 13 187
>12 8 330

42
Figure 51. Fishing boats in Martinique, Ifremer pictures.
14 fishing gears used have been identified. Pots or traps, are the more used (62%), then,
trolling line (37%), fishing on fish aggregating devices FAD (35%), fixed net (26%) and
beach seine (11%).
71 commercial species or groups of species have been identified among which 56 are landed.
The total production, by species and fishing gear should be provided in the next coming
months.
Tablea 5. Fishing devices used in Martinique in 2010, Ifremer-SIH
Fishing device Number of boats
Pot/Trap 555
Trolling line 331
FAD 311
Fixed gillnet 229
Beach seine 96
Drifting gillnet 83
Trammel 82
Bottom set longline 77
Encircling gillnet 61
Handline 55
Free diving 42
Drifting longline 3
Pelagic purse-seine 2
Other nets 1

43
Figure 52. Fishing areas around Martinique and Guadeloupe (left) and use of fishing areas for
the fleets operating from Martinique and Guadeloupe (right), Ifremer-SIH.
44
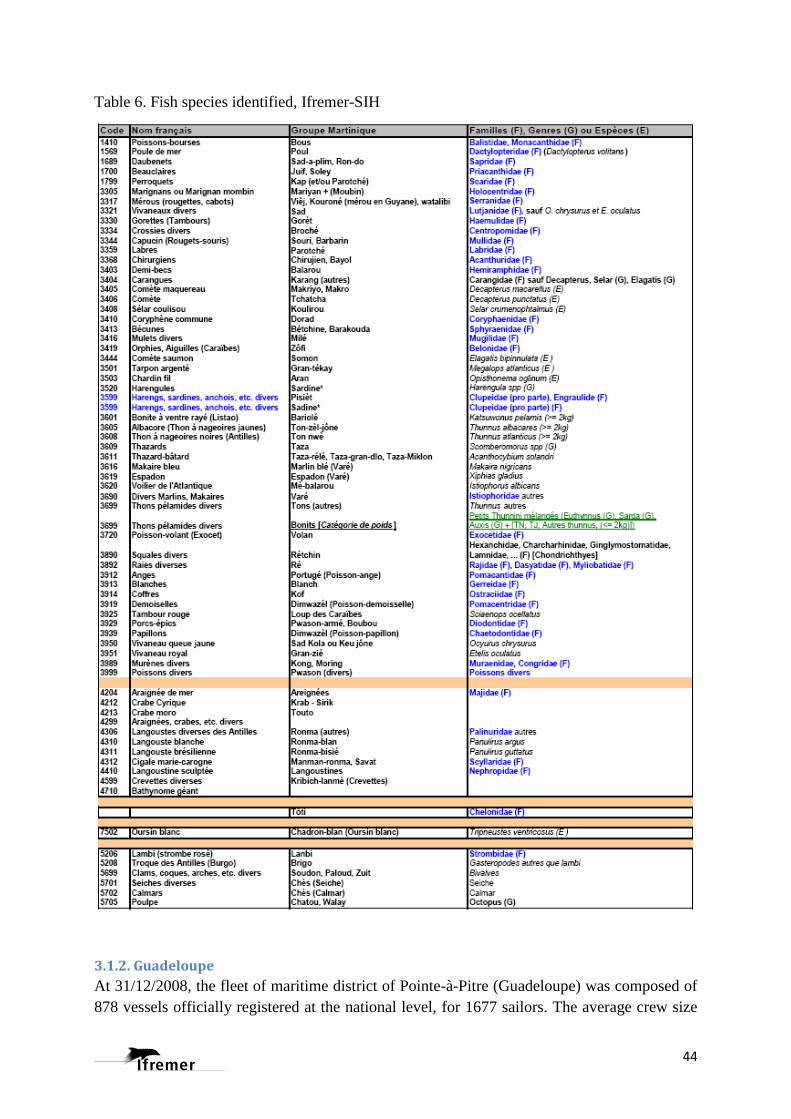
Table 6. Fish species identified, Ifremer-SIH
3.1.2. Guadeloupe
At 31/12/2008, the fleet of maritime district of Pointe-à-Pitre (Guadeloupe) was composed of
878 vessels officially registered at the national level, for 1677 sailors. The average crew size
45
is 2.1 men per ship. With an average length of 7.4 meters, the fleet of Guadeloupe is
characterized by a predominance of small units. With the exception of a ship, all the vessels
have a length less than 12 meters. Power and average tonnage of fishing vessels amounted
respectively to 136 kW (185 hp).
The evolution of the number of vessels per length categories, both in numbers and percentage
reflects significant changes in the structure of the fleet during the recent years. The fleet of
less than 5 meters and 5 to 7 meters has been a significant decline in these numbers (54% and
26%), while the number of vessels in 7 to 9 meters and 9 to 12 meters respectively increased
13% and 87%. There are no more ships over 12 meters in 2008.
.
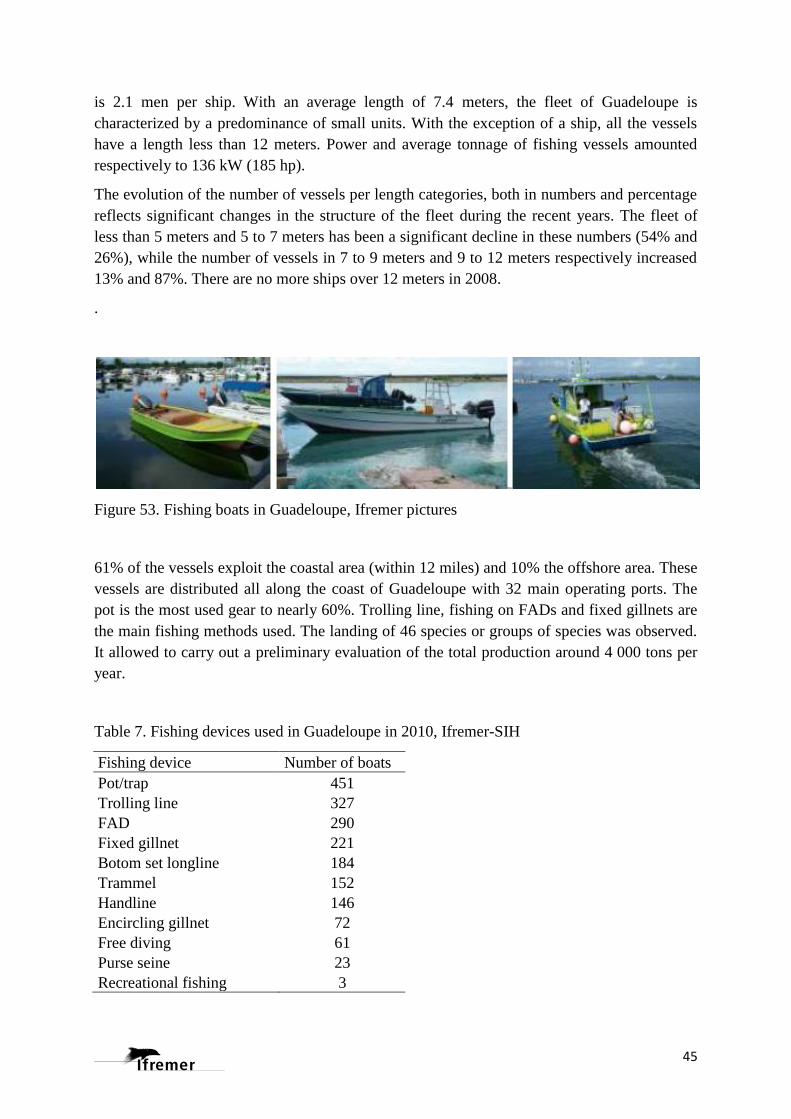
Figure 53. Fishing boats in Guadeloupe, Ifremer pictures
61% of the vessels exploit the coastal area (within 12 miles) and 10% the offshore area. These
vessels are distributed all along the coast of Guadeloupe with 32 main operating ports. The
pot is the most used gear to nearly 60%. Trolling line, fishing on FADs and fixed gillnets are
the main fishing methods used. The landing of 46 species or groups of species was observed.
It allowed to carry out a preliminary evaluation of the total production around 4 000 tons per
year.
Table 7. Fishing devices used in Guadeloupe in 2010, Ifremer-SIH
Fishing device Number of boats
Pot/trap 451
Trolling line 327
FAD 290
Fixed gillnet 221
Botom set longline 184
Trammel 152
Handline 146
Encircling gillnet 72
Free diving 61
Purse seine 23
Recreational fishing 3
46
3.1.3. Martinique and Guadeloupe fishing fleets targeting Dolphinfish, Flyingfishes and
Blackfin tuna
During the year 2008 and 2009 in Martinique, 1084 and 1098 boats were registered as
commercial fishing boats and in Guadeloupe 878 and 903 respectively. Within the same
years, 85% and 82 % (916 & 896) of the vessel fleet were active in Martinique and in
Guadeloupe 90% and 86 % (794 & 778) were active. Most of the boats are between 5 to 9 m
total length. The 7 to 9 m boats are more frequent in Martinique. During the last decade, the
number of 7 to 9m boats increased in Guadeloupe while the number of 5 to 7 m boats
decreased. The average length of the boats is similar between the two French Antilles, but the
engine average power is higher in Guadeloupe (139 kW vs 80). The total power of the fleets
had increased steadily from 56,788 to 87,420 kW in Martinique between 1993 and 2009 and
at the same time, from 84,240 to 125,874 kW in Guadeloupe. The average age of the boats are
16 years in Martinique and 11 years in Guadeloupe.
Dolphinfish, flyingfish and blackfin tuna are mainly targeted using the following:
- High sea hand lines and trolling lines for large pelagic fishes,
- Trolling lines and drifting vertical lines around FADs for large pelagic fishes,
- High sea drifting nets for flyingfish (Martinique only),
- Nets for flyingfish during High sea lines for large pelagic fishes (Martinique only).
Flyingfish are not targeted by the commercial fishing boats of Guadeloupe. This is practiced
mainly by high sea fleets. Related to the typology made by IFREMER, 10 different fleets are
distinguished (table 1) totaling 464 boats in Guadeloupe and 435 in Martinique (2008).
The boats of these high sea fleets share their activities between high sea and the insular
shelves. The seasonal activity of the high sea hand and trolling lines which are targeting
mostly dolphinfish between December to June, impacts others activities which are higher
from July to November. The total number of trips per year on the insular shelves is higher
than at high sea (figure 4). The drifting nets for flyingfish are used on the west coast of
Martinique inside the 24 NM limit. FADs are mainly exploited inside the 24 NM while high
sea hand and trolling lines are fishing outside the 24 NM.
Fishing around Moored Fish Aggregating Devices (FADs) took place in Martinique and
Guadeloupe during the 90’s and seems to have changed the activity and the seasonality of the
high sea fishing. The data from enquiries made in 1979 and 1989 show a high proportion of
boats practising high sea lines during the first half of the year and a sharp decline in the
second half of the year. In 2006, this seasonality is less definite. The high sea boats share their
activities between high sea lines and FADs. Fishing is practised all year long; as a result some
of the high sea boats stay offshore between June to December.
Annual catch estimates for 2008, the period for which there is more reliable data, range from
393 to 561 t (metric tons) per year, which represents an estimate of 474 t (metric tons) for
dolphinfish in Guadeloupe and 12 to 17 t for blackfin tuna (estimate 14 t).
In Martinique, for 2009 estimates range from 23 to 64 t (estimate 40 t) for dolphinfish and
from 9 to 29 t (estimate 18 t) for blackfin tuna.
47
The final estimates of historical harvest for both islands therefore start from a small catch rate
around FADs of 3 tons of dolphinfish and 1 ton of blackfin tuna in 1985. made in Martinique
to 377 t of dolphinfish and 20 t of blackfin tuna for both islands in 1997, to the present
estimate of between 416 to 625 t of dolphinfish and 21 to 46 for blackfin tuna in 2008.
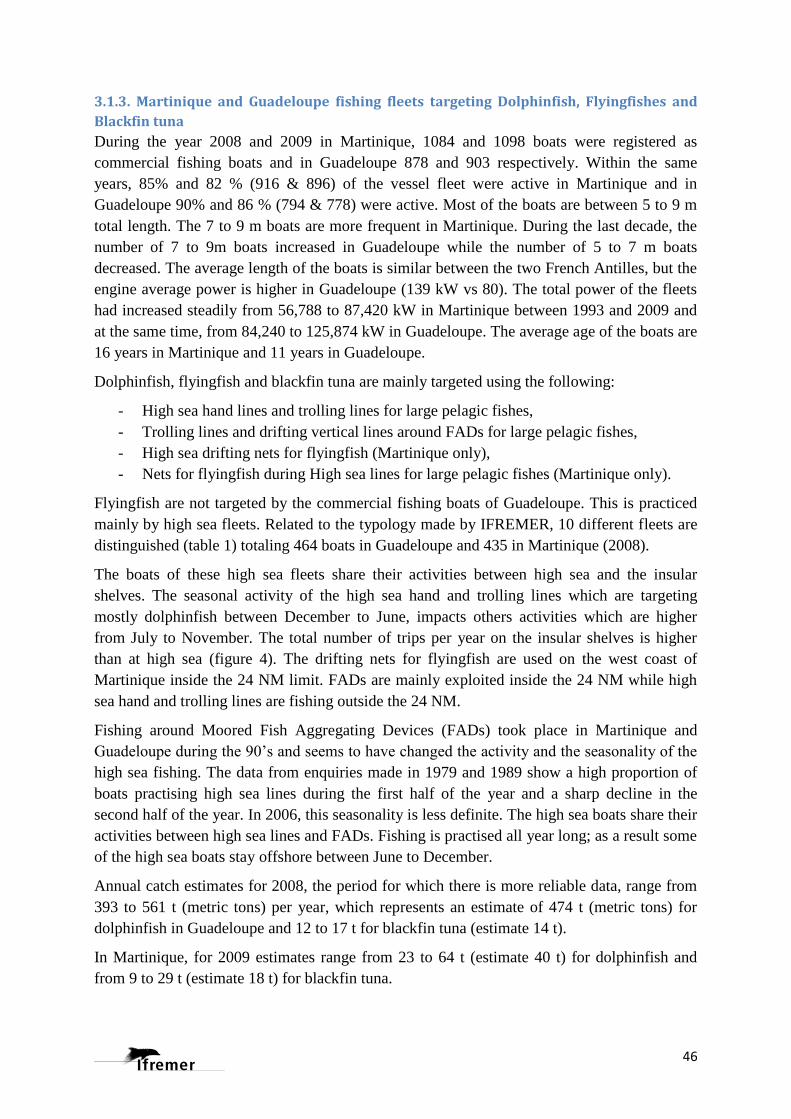
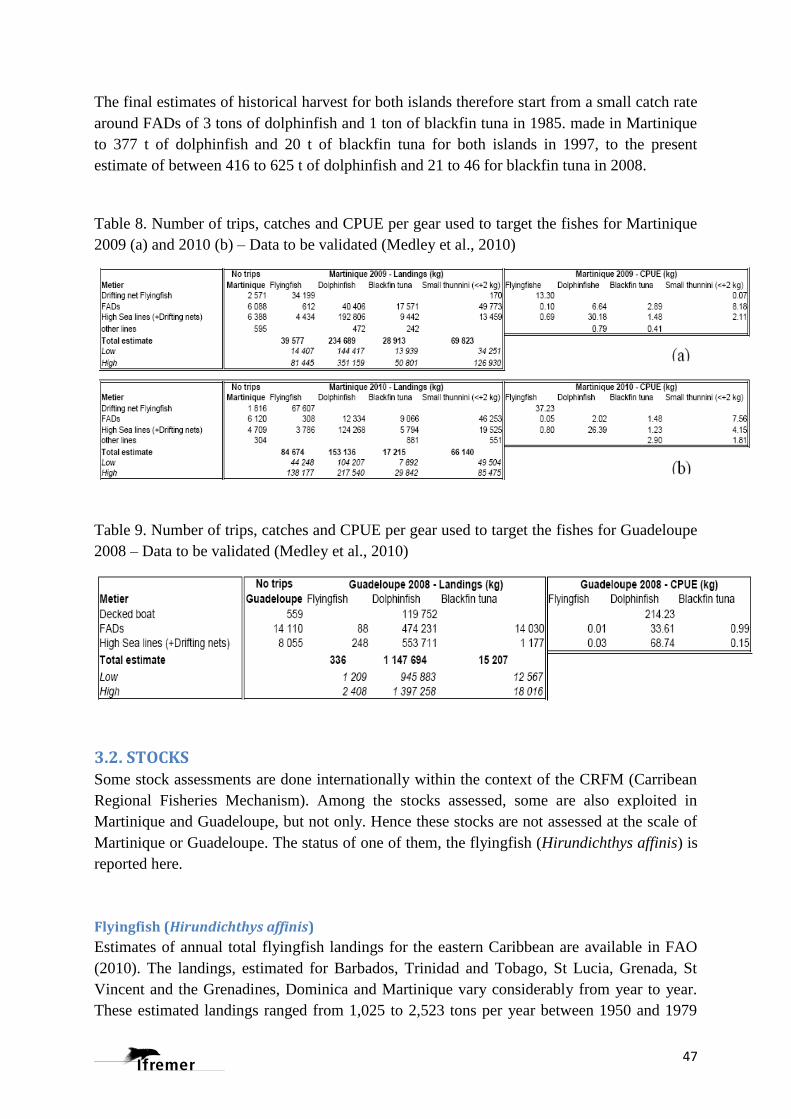
Table 8. Number of trips, catches and CPUE per gear used to target the fishes for Martinique
2009 (a) and 2010 (b) – Data to be validated (Medley et al., 2010)
Table 9. Number of trips, catches and CPUE per gear used to target the fishes for Guadeloupe
2008 – Data to be validated (Medley et al., 2010)
3.2. STOCKS Some stock assessments are done internationally within the context of the CRFM (Carribean
Regional Fisheries Mechanism). Among the stocks assessed, some are also exploited in
Martinique and Guadeloupe, but not only. Hence these stocks are not assessed at the scale of
Martinique or Guadeloupe. The status of one of them, the flyingfish (Hirundichthys affinis) is
reported here.
Flyingfish (Hirundichthys affinis)
Estimates of annual total flyingfish landings for the eastern Caribbean are available in FAO
(2010). The landings, estimated for Barbados, Trinidad and Tobago, St Lucia, Grenada, St
Vincent and the Grenadines, Dominica and Martinique vary considerably from year to year.
These estimated landings ranged from 1,025 to 2,523 tons per year between 1950 and 1979

48
and appeared to increase thereafter, ranging from 2,121 to 4,725 tons per year between 1980
and 2007. The estimated average annual landing between 2002 and 2007 was 2,512 tons.
These data are, however, to be treated cautiously as they are likely underestimates of the true
catches in the region. Grenada has developed a significant bait fishery for the species, the
catches of which are not well documented. In addition, landings from Martinique and other
countries in the Eastern Caribbean likely to be harvesting the species are not available. There
are also gaps in available data which required interpolation to estimate landings for years
without data. Generally several countries lack a clear methodology for estimating total catches
from recorded data. Consequently, there is tremendous uncertainty in the level of historical
catches of flyingfish for the Eastern Caribbean. Estimates of fishing effort are also uncertain.
Three stock assessments of the flyingfish fishery within the Eastern Caribbean have been
conducted (Mahon 1989; Oxenford et al., 2007; Medley et al., 2008) and extensive research
undertaken on the fishery by the Eastern Caribbean Flyingfish Project (Oxenford et al., 2007).
In addition, a preliminary trophic model constructed for the Lesser Antilles Pelagic
Ecosystem (LAPE) project examined impacts of predator-prey and technological interactions
in the fishery (Mohammed et al., 2008) and a preliminary bio-economic model for the eastern
Caribbean flyingfish fishery was developed (Headley, 2009).
The most recent stock assessment (Medley et al., 2008) considered a wider spatial range of
landings data than the previous assessments (Barbados, Trinidad and Tobago, St Lucia,
Grenada, St Vincent and the Grenadines, Dominica and Martinique) for 1955 to 2007 and
catch and effort data from Barbados, Trinidad and Tobago and Saint Lucia from 1994 to
2007. A Beverton and Holt Stock Recruitment model was used with the possible
oceanographic effects on the population accounted for by inclusion of process error in the
analyses and uncertainties in biological parameters accounted for using a Bayesian approach.
The stock assessment suggested that the stock of flyingfish in the eastern Caribbean is not
overfished and that overfishing is not occurring.
The assessment, however, could not be used to determine whether or not “local depletion”
may be occurring as the data are not available in the level of detail required to do so. Catch
rates have remained fairly stable even with increased overall catches. Given the potential
stock area, and estimates of a relatively large stock size from tagging and survey data, it is
unlikely that the catches have ever exceeded the maximum sustainable yield from the stock.
Consequently, there is no evidence that the stock has ever been overfished.
The model estimated, for 2007, MSY at between 3,312 and 36,291 tons; B/Bmsy at between
1.97 and 4.17; and F/Fmsy at between 0.03 and 0.5 (0.05 and 0.95 confidence intervals
respectively). The model projections show that keeping the fishing effort and capacity or
catch at about 2,500 tons (the maximum recorded catch to date has been 4,700 tons) should be
safe with overfishing very unlikely even with stock fluctuations due to environmental
influences. Given the uncertainty in the MSY value, attempts to fix the fishing mortality in
relation to MSY or set catches at or above 5,000 tons led to prediction of significant risks in
overfishing. Consequently, it was suggested that a trigger point should be established at 5,000
tons, such that when catches consistently exceed this figure management should take action to
safeguard the stock from overfishing.

49
3.3. ECONOMIC AND SOCIAL PERFORMANCES There is an ongoing work based on economic enquiries carried out by Ifremer. Only some
economic indicators are yet available for Guadeloupe. The indicators are given according to
the class size of boat length, coastal or off-shore fishing zone for the year 2008.
Table 10. Economic performances of coastal boats (turnover in euro) in 2008 (Guyader et al.,
2010).
Coastal vessels < 7 m Moyenne Ecart-type C.V.
Length (m) 5,8 0,7 11%
Engine power (kW) 61 34 56%
Crew number 1,8 1 56%
Number of days at sea 128 60 46%
Turnover per employed people (€) 20442 10618 52%
Turnover per people per day (€) 173 87 50%
Coastal vessels [7-9[ Moyenne Ecart-type C.V.
Length (m) 7,6 0,5 6%
Engine power (kW) 136 62 46%
Crew number 2,2 1,2 54%
Number of days at sea 151 62 41%
Turnover per employed people (€) 27381 20256 74%
Turnover per people per day (€) 177 105 59%
Coastal vessels [9-12[ m Moyenne Ecart-type C.V.
Length (m) 9,5 0,3 3%
Engine power (kW) 249 97 33%
Crew number 2,3 0,6 25%
Number of days at sea 157 42 27%
Turnover per employed people (€) 27757 13635 50%
Turnover per people per day (€) 175 94 54%
Table 11. Economic performances of boats fishing off shore (turnover in euro) in 2008.
Offshore vessels < 7 m Moyenne Ecart-type C.V.
Length (m) 6,4 0,4 6%
Engine power (kW) 93 37 40%
Crew number 1,9 0,5 28%
Number of days at sea 119 57 48%
Turnover per employed people
(€) 31767 21380 67%
Turnover per people per day (€) 288 131 46%

50
Offshore vessels [7-9[ m Moyenne Ecart-type C.V.
Length (m) 7,8 0,6 7%
Engine power (kW) 163 50 31%
Crew number 2 0,7 35%
Number of days at sea 143 44 30%
Turnover per employed people (€) 40186 17134 43%
Turnover per people per day (€) 293 137 47%
Vessel with deck Moyenne Ecart-type C.V.
Length (m) 11 1 6%
Engine power (kW) 227 70 31%
Crew number 3,5 0,8 24%
Number of days at sea 204 35 17%
Turnover per employed people (€) 27589 8599 31%
Turnover per people per day (€) 134 26 20%
3.4. ENVIRONMENTAL ISSUES Chlordecone is an organochlorine insecticide that has been used in the West Indies from 1972
to 1993 to fight a weevil attacking banana roots. Very persistent in the environment, the
molecule is transported from the contaminated lands to aquatic systems through fine
particulate matter, thus contaminating the coastal marine environment. A preliminary study
was conducted in 2010 to characterize the fate of chlordecone in food webs of coastal
macrofauna. The objective was in particular to identify pathways from terrigenous maters and
spread within these networks. The case study is a bay of Martinique, with seagrass areas as
primary production system.
The results showed that the terrigenous incomes influence the levels of contamination of the
marine fauna, individuals of the same species and with similar characteristics appearing most
contaminated when they are near outfalls of rivers than when they are further away. This
contamination has biomagnification along food webs, from primary producers to higher
trophic position species such as carnivorous of second order (biomagnifications trophic factor
estimated between 1.4 and 1.9). Place of life and mode of food supply have been identified as
playing an important role on the levels of contamination.
Bioaccumulation phenomena have been found in two species for which the level of
contamination by chlordecone is high, Callinectes danae (a crab species) and
Chloroscombrus chrysurus (a fish species). But this does not apply to all species studied.
Decreased levels of contamination were observed even during the life of the spiny lobster
Panulirus argus. It is mainly attributed to the migration of the species seaward between the
juvenile and adult phases. The results are still very fragmentary.

51
4. LA REUNION La Réunion is a French island of 2 512 km², with a population of about 800 000 located in the
Indian Ocean, east of Madagascar, about 200 kilometers south west of Mauritius, the nearest
island. Its capital is Saint-Denis. The surface area of the EEZ is around 323 000 km².
The continental shelf of La Réunion is short and the ocean waters are oligotrophic, with clear
waters and coral reef ecosystems.
4.1. FLEETS
4.1.1. Boats and fishing devices
In 2010, the number of vessels listed is 279. Nearly 67% of the vessels are small, between 5
and 7 meters long, with an outboard motor for an average power between 29 and 71 kW. The
number of men on board varies on average between 1 to smaller vessels and 7 for the largest,
representing a total of 415 sailors. 60% of the vessels exploit the coastal area (within 12
miles) and 12% the offshore area. These vessels are distributed along the entire coastline of
the island with 11 major operating ports. The main fishing method is the use of hand lines
(82% of vessels).
Table 12. Number of boats and mean engine power in 2010, Ifremer-SIH
Boat length (in m) number of boats Engine power (kW)
5-6 144 29
6-7 42 71
7-8 22 100
8-9 15 132
9-10 21 219
10-11 2 228
11-12 4 300
>12 29 397
Table 13. Fishing devices used in La Reunion in 2010, Ifremer-SIH
Fishing device Number of boats
Handline 173
Longline 63
Fishing from shore 43
Swordfish drifting longline 39
Gillnet 87
Pot/trap 12
4.1.2. Typology
This section provides a typology of the fleet of La Réunion, taking into account the main
combinations of “métiers” (métier is a combination of a gear and a species or a group of

52
species), carried out during the year 2006. Active fleet can be divided into major fleets, using
same fishing strategies
This classification of vessels by type allows to structure the fleet, which at first sight seems
very heterogeneous with diversity of metiers performed, and the polyvalent characters of the
coastal units. It should be noted that a ship may performs several metiers during the year, but
is assigned to a single fleet.

53
Table 14. Fleets (typology Ifremer) in La Réunion in 2006, according to the metiers performed (combination of gear and group of
species) (Miossec et al., 2007)
Fleets groups Vessel
number
Mean
length
(cm)
Tonnage
(1/10è GT)
Mean
engine
power(kW)
Mean crew
number
Total
employed
people
number
Hooks targeting demersal species Hooks targeting demersal species 11 554 55 20 1.3 14
Handlines targeting demersal and large
pelagic sp.
Handlines targeting demersal and large pelagic
sp. 14 574 103 30 1.3 18
Handlines targeting demersal and large pelagic
(and also small pelagic sp.) 54 575 98 32 1.2 67
Handlines-Longlines targeting demersal and
large pelagic sp. 32 635 206 62 1.3 42
Handlines-Longlines targeting demersal and
large pelagic (+ small pelagic sp.) 59 630 172 55 1.3 77
Hooks targeting large pelagic sp. Handlines targeting large pelagic sp. 17 810 487 162 1.5 26
Handlines-Longlines targeting large pelagic sp. 15 799 409 164 1.4 22
Shore activity Shore activity 2 575 51 15 2.0 4
Swordfish longlines Coastal swordfish longlines 12 887 432 168 1.8 22
Offshore swordfish longlines 28 1550 5591 260 4.2 117
Austral pots-longlines Austral poit-longlines 1 7660 234300 2610 30.0 30
Inactive Inactive 43 621 163 41 0.0 0

54
4.1.3. Fishing effort and production
The production and the fishing efforts for the year 2006 available for some fleets. They are
presented in the following figures and tables.
Figure 54. On the left, composition of the catches of the coastal small-scale fisheries in 2006,
targeting small pelagics in blue, large pelagics in yellow and groundfishes in red. On the right,
fishing effort (in thousands of hook) of the offshore fleet using longline in 2006 for each
trimester (Miossec et al., 2007).

55
Table 15: Production by species obtained from extrapolation for the handlines targeting demersal and large pelagic species in 2006 (Miossec et
al., 2007)
Species
Estimated
number of
fishing trips
(N)
Number of sampled
trips (n)
Quantity of
landings
sampled (in
Kg)
Mean Kg
sampled
Variance Kg
sampled
Estimated
variance
mean Kg
Est –
mean Kg Est +
Est – total
number of
trips
Est + Est - total
quantity
Est total
quantity
species
Precision Est +
Bigeye scad 2016 37 501 13.5 6756.4 179.3 0.0 39.8 1940 2092 501 27270 99% 83196
Sphyraena sp. 2016 37 160 4.3 608.6 16.1 0.0 12.2 1940 2092 160 8718 93% 25522
Coryphaena 2016 37 74 2.0 38.7 1.0 0.0 4.0 1940 2092 74 4032 51% 8337
Wahoo 2016 37 68 1.8 24.6 0.7 0.3 3.4 1940 2092 495 3705 44% 7156
Lutjanids) 2016 37 39 1.0 13.2 0.3 0.0 2.2 1940 2092 39 2098 57% 4602
Albacore 2016 37 35 0.9 14.4 0.4 0.0 2.1 1940 2092 35 1880 66% 4484
Groupers 2016 37 27 0.7 10.9 0.3 0.0 1.8 1940 2092 27 1466 74% 3727
Other demersals 2016 37 23 0.6 3.3 0.1 0.0 1.2 1940 2092 71 1248 48% 2513
Skipjack tuna 2016 37 21 0.6 2.3 0.1 0.1 1.0 1940 2092 172 1144 43% 2190
Capucins 2016 37 20 0.5 3.1 0.1 0.0 1.1 1940 2092 20 1090 53% 2315
Groupers (red) 2016 37 19 0.5 1.5 0.0 0.1 0.9 1940 2092 223 1019 39% 1874
Herrings, sardines, etc. 2016 37 15 0.4 6.1 0.2 0.0 1.2 1940 2092 15 817 99% 2495
Crabs 2016 37 11 0.3 1.7 0.0 0.0 0.7 1940 2092 11 599 72% 1497
Sky emperor 2016 37 11 0.3 1.0 0.0 0.0 0.6 1940 2092 11 572 56% 1245
Poulp 2016 37 8 0.2 1.3 0.0 0.0 0.6 1940 2092 8 436 87% 1226
Cardinal fish 2016 37 7 0.2 1.3 0.0 0.0 0.6 1940 2092 7 398 95% 1181
Lobsters 2016 37 5 0.1 0.7 0.0 0.0 0.4 1940 2092 5 289 93% 849
Thonine orientale (Bonite la côte) 2016 37 4 0.1 0.4 0.0 0.0 0.3 1940 2092 4 218 99% 665

56
Table 16: Production by species obtained from extrapolation for the handlines targeting demersal and large pelagic species and also small pelagic
sp. in 2006 (Miossec et al., 2007)
Species
Estimated
number of
fishing trips
(N)
Number of sampled
trips (n)
Quantity of
landings
sampled (in
Kg)
Mean Kg
sampled
Variance Kg
sampled
Estimated
variance
mean Kg
Est – mean
Kg Est +
Est – total
number of
trips
Est + Est - total
quantity
Est total
quantity
species
Precision Est +
Albacore 8527 114 306 2.7 56.6 0.5 1.3 4.1 8369 8684 10966 22866 26% 35195
Lutjanids 8527 114 174 1.5 10.6 0.1 0.9 2.1 8369 8684 7807 13019 20% 18415
Other demersal 8527 114 89 0.8 3.2 0.0 0.5 1.1 8369 8684 3801 6650 21% 9600
Bigeye scad 8527 114 77 0.7 4.8 0.0 0.3 1.1 8369 8684 2308 5759 30% 9337
Groupers (red) 8527 114 66 0.6 1.3 0.0 0.4 0.8 8369 8684 3086 4929 18% 6838
Coryphaena 8527 114 54 0.5 13.0 0.1 0.0 1.1 8369 8684 54 4039 71% 9814
Thon Germon 8527 114 45 0.4 17.8 0.2 0.0 1.2 8369 8684 45 3366 99% 10102
Skipjack tuna 8527 114 44 0.4 4.0 0.0 0.0 0.7 8369 8684 153 3261 49% 6484
Groupers 8527 114 34 0.3 0.9 0.0 0.1 0.5 8369 8684 1063 2539 29% 4069
Carangids 8527 114 32 0.3 2.3 0.0 0.0 0.6 8369 8684 56 2409 50% 4848
Wahoo 8527 114 32 0.3 3.7 0.0 0.0 0.6 8369 8684 32 2356 65% 5440
Capucins 8527 114 28 0.2 0.9 0.0 0.1 0.4 8369 8684 624 2079 35% 3588
Sky emperor 8527 114 28 0.2 0.5 0.0 0.1 0.4 8369 8684 937 2057 27% 3217
Bancloche Mackerel scad 8527 114 25 0.2 1.8 0.0 0.0 0.5 8369 8684 25 1833 58% 3983
Sharks, rays, skates 8527 114 12 0.1 1.3 0.0 0.0 0.3 8369 8684 12 898 99% 2694
Green jobfish 8527 114 11 0.1 0.5 0.0 0.0 0.2 8369 8684 11 823 71% 1996
Crab 8527 114 11 0.1 0.5 0.0 0.0 0.2 8369 8684 11 823 70% 1991
Cardinal fishes 8527 114 8 0.1 0.0 0.0 0.0 0.1 8369 8684 271 576 27% 892
Bonite gros yeux (T. dents de chien) 8527 114 7 0.1 0.4 0.0 0.0 0.2 8369 8684 7 524 99% 1571
Phyraena spp. 8527 114 5 0.0 0.2 0.0 0.0 0.1 8369 8684 5 374 99% 1122
Thonine orientale (Bonite la côte) 8527 114 4 0.0 0.1 0.0 0.0 0.1 8369 8684 4 299 78% 772
Poulp 8527 114 4 0.0 0.1 0.0 0.0 0.1 8369 8684 4 262 71% 636
Moontail bullseye 8527 114 1 0.0 0.0 0.0 0.0 0.0 8369 8684 1 37 99% 112
Brème noire (Mochong ou Zambas) 8527 114 0 0.0 0.0 0.0 0.0 0.0 8369 8684 0 22 99% 67
Comètes 8527 114 0 0.0 0.0 0.0 0.0 0.0 8369 8684 0 22 99% 67

57
Table 17 : Production by species obtained from extrapolation for the handlines-longlines targeting demersal and large pelagic species in 2006
(Miossec et al., 2007)
Species
Estimated
number of
fishing trips
(N)
Number of sampled
trips (n)
Quantity of
landings
sampled (in
Kg)
Mean Kg
sampled
Variance Kg
sampled
Estimated
variance
mean Kg
Est – mean
Kg Est +
Est – total
number of
trips
Est + Est - total
quantity
Est total
quantity
species
Precision Est +
Thon Albacore 4976 84 669 8.0 276.4 3.2 4.4 11.5 4899 5052 21746 39630 23% 58046
Thon Germon 4976 84 444 5.3 369.3 4.3 1.2 9.4 4899 5052 5933 26302 39% 47289
Brème noire (Mochong ou Zambas) 4976 84 226 2.7 67.0 0.8 0.9 4.4 4899 5052 4649 13358 33% 22330
Skipjack tuna 4976 84 195 2.3 27.5 0.3 1.2 3.4 4899 5052 5928 11551 24% 17343
Coryphaena 4976 84 119 1.4 45.4 0.5 0.0 2.8 4899 5052 119 7049 51% 14371
Lutjanids 4976 84 88 1.0 10.8 0.1 0.3 1.7 4899 5052 1712 5213 34% 8820
Sharks, rays, skates 4976 84 78 0.9 28.4 0.3 0.0 2.1 4899 5052 78 4591 62% 10368
Sky empror 4976 84 64 0.8 14.2 0.2 0.0 1.6 4899 5052 64 3791 54% 7886
Carangids 4976 84 51 0.6 10.7 0.1 0.0 1.3 4899 5052 51 3021 58% 6579
Swordfish 4976 84 48 0.6 27.4 0.3 0.0 1.7 4899 5052 48 2843 99% 8497
Groupers (red) 4976 84 45 0.5 3.5 0.0 0.1 0.9 4899 5052 684 2666 38% 4707
Other demersal sp. 4976 84 44 0.5 3.6 0.0 0.1 0.9 4899 5052 596 2618 39% 4702
Bonite gros yeux (T. dents de chien) 4976 84 29 0.3 3.8 0.0 0.0 0.8 4899 5052 29 1718 61% 3824
Bancloche Mackerel scad 4976 84 27 0.3 2.3 0.0 0.0 0.6 4899 5052 27 1599 51% 3246
Wahoo 4976 84 26 0.3 2.9 0.0 0.0 0.7 4899 5052 26 1540 60% 3393
Groupers (rougettes, cabots) 4976 84 23 0.3 1.6 0.0 0.0 0.5 4899 5052 23 1333 51% 2695
Crab 4976 84 15 0.2 2.7 0.0 0.0 0.5 4899 5052 15 889 99% 2655
Bigeye scad 4976 84 15 0.2 0.6 0.0 0.0 0.3 4899 5052 66 889 47% 1736
Capucins 4976 84 13 0.2 1.2 0.0 0.0 0.4 4899 5052 13 770 77% 1961
Thonine orientale (Bonite la côte) 4976 84 6 0.1 0.2 0.0 0.0 0.2 4899 5052 6 355 70% 854
Green jobfish 4976 84 3 0.0 0.1 0.0 0.0 0.1 4899 5052 3 178 74% 441
Herrings, sardines, etc. 4976 84 2 0.0 0.0 0.0 0.0 0.1 4899 5052 2 118 99% 354
Cardinal fishes 4976 84 1 0.0 0.0 0.0 0.0 0.0 4899 5052 1 30 99% 89

58
Table 18 : Production by species obtained from extrapolation for the handlines-longlines targeting demersal and large pelagic species and also
small pelagic sp. in 2006 (Miossec et al., 2007)
Species
Estimated
number of
fishing trips
(N)
Number of sampled
trips (n)
Quantity of
landings
sampled (in
Kg)
Mean Kg
sampled
Variance
Kg sampled
Estimated
variance
mean Kg
Est – mean
Kg Est +
Est – total
number of
trips
Est + Est - total
quantity
Est total
quantity
species
Precision Est +
Thon Albacore 8470 156 849 5.4 236.9 1.5 3.0 7.8 8356 8584 25452 46069 22% 67232
Coryphaena 8470 156 580 3.7 197.8 1.2 1.5 5.9 8356 8584 12819 31513 30% 50705
Skipjack tuna 8470 156 249 1.6 133.7 0.8 0.0 3.4 8356 8584 249 13492 58% 29103
Wahoo 8470 156 185 1.2 15.1 0.1 0.6 1.8 8356 8584 4842 10017 26% 15330
Lutjanids 8470 156 182 1.2 11.4 0.1 0.6 1.7 8356 8584 5376 9898 23% 14540
Thon Germon 8470 156 165 1.1 46.0 0.3 0.0 2.1 8356 8584 165 8959 51% 18126
Bigeye scad 8470 156 145 0.9 5.4 0.0 0.6 1.3 8356 8584 4730 7846 20% 11043
Groupers (red) 8470 156 123 0.8 3.8 0.0 0.5 1.1 8356 8584 4042 6678 20% 9384
Carangids 8470 156 90 0.6 13.6 0.1 0.0 1.1 8356 8584 90 4870 51% 9852
Brème noire (Mochong ou Zambas) 8470 156 65 0.4 9.7 0.1 0.0 0.9 8356 8584 65 3529 59% 7725
Other demersal sp. 8470 156 39 0.3 1.2 0.0 0.1 0.4 8356 8584 685 2118 34% 3589
Groupers (rougettes, cabots) 8470 156 30 0.2 0.6 0.0 0.1 0.3 8356 8584 647 1634 31% 2648
Bancloche 8470 156 29 0.2 1.0 0.0 0.0 0.3 8356 8584 269 1575 42% 2916
Sky emperor 8470 156 21 0.1 0.2 0.0 0.1 0.2 8356 8584 487 1146 29% 1821
Green jobfish 8470 156 16 0.1 0.9 0.0 0.0 0.3 8356 8584 16 869 74% 2157
Bonite gros yeux (T. dents de chien) 8470 156 15 0.1 1.4 0.0 0.0 0.3 8356 8584 15 814 99% 2428
Capucins 8470 156 14 0.1 0.2 0.0 0.0 0.1 8356 8584 208 738 36% 1283
Comète saumon 8470 156 7 0.0 0.1 0.0 0.0 0.1 8356 8584 7 353 61% 786
Sphyraena 8470 156 5 0.0 0.2 0.0 0.0 0.1 8356 8584 5 271 99% 809
Crab 8470 156 4 0.0 0.1 0.0 0.0 0.1 8356 8584 4 190 99% 567
Cardinal fish 8470 156 3 0.0 0.0 0.0 0.0 0.0 8356 8584 22 174 45% 330
Moontail bullseye 8470 156 3 0.0 0.0 0.0 0.0 0.0 8356 8584 3 163 70% 391
Sharks, rays and skates. 8470 156 2 0.0 0.0 0.0 0.0 0.0 8356 8584 2 81 99% 243
Thonine orientale (Bonite la côte) 8470 156 1 0.0 0.0 0.0 0.0 0.0 8356 8584 1 54 99% 162

59
A strong decreasing temporal trend of the annual production is observed for the small scale
fisheries between 2005 and 2010. It is assumed that this decline of the production can’t be
explained by changes in the fishing effort as the CPUEs decline also.
Figure 55. temporal variations of the annual catches of the coastal small-scale fisheries :
longlines (squares), targeting large pelagic (lozenges), small pelagic (triangles) and demersal
species (rounds) from 2005 to 2010 (Fleury et al., 2012).
Figure 56. Temporal variations of the whole fleet (lozenges) in number of boats and according
to size, of less than 7 m (squares) and greater than 7 m (rounds) (Fleury et al., 2012)

60
4.2. STOCKS
Swordfish (Xiphas gladius)
From Le Couls and Bourja, 2010.
Until the early 1990s, swordfish was mainly a bycatch of the industrial longline fisheries
targeting tunas. Swordfish catches significantly increased after 1990, reaching a first peak of
35 000 t in 1998 and 36 000 t in 2003 and 2004. The current catch levels are around 30 000 t.
This sharp increase is due to the change of target species of tuna to swordfish, the Taiwanese
fleet and the arrival of new fleets targeting swordfish in the Indian Ocean (Reunion, Spain ...).
In 2007, 29 892 tons of swordfish were caught in the Indian Ocean. Longline is the main
fishing gear used (95%) followed by gillnet (5%). Taiwan, Spain, Indonesia and Japan are the
major fishing countries in the Indian Ocean in 2007 respectively, 26.5%, 16.5%, 6% and 4.5%
of the total catch of swordfish. The fleets operating from La Reunion represent only 4% of the
total swordfish caught in the ocean. Fishing effort and catches are mainly focused on the
north-west and south-west Indian Ocean.
The last stock assessment for swordfish in the Indian Ocean was carried out in 2009 (IOTC,
2009). Two types of models were used for the evaluation: age-structured models (ASIA, SS3)
and a production model with aggregated age (ASPM, ASPIC). Given the heterogeneity of the
available data by region, date, fleet, the working group recommended to continue to use these
different models for stock assessment of swordfish in the years to come.
The conclusion of the work carried out in 2009 is that the current catch level (the last year
considered is 2007) is probably close to the maximum sustainable yield (MSY), suggesting a
stock fully exploited. However, considerable uncertainty persists on the stock structure of
swordfish in the Indian Ocean, particularly because of contrasted evolutions of catch per unit
of effort (CPUE) and catch levels based on different zones. These indicators suggest a
heterogeneous stock (or even the existence of several stocks) and finally a possible over-
exploitation of swordfish stocks in the north-west and south-west Indian Ocean.
4.3. ECONOMIC AND SOCIAL PERFORMANCES No elements were found for the fisheries operating from La Réunion.
4.4. ENVIRONMENTAL ISSUES
The monitoring of marine biocenoses made since the 80 on reef areas on the west coast of the
island of Reunion show that coral structures are affected by chronic enrichment in nutrient
salts. This degradation of reef ecosystems seems partly due to contributions from watersheds
adjacent to the reef platforms. Phenomena generated by chronic pollution of the reef
ecosystem were described and quantified in part from the early 1980s in La Réunion
(Guillaume et al., 1983; Cuet 1989; Cuet and Naim, 1992; Naim, 1993 a and b). These
enhancements are mainly related to groundwater infiltration that provide significant amounts
of nitrogen and to a lesser extent phosphate (Cuet et al., 1988; Naim et al., 2000). This
61
enrichment of water reef in La Réunion linked to human activities, induce an increase in the
abundance of algal stands (Cuet et al., 1988; Naim, 1993b; Semple, 1997).
In Reunion, the algal facies pollution mainly occur during the warm season and disappear
with the return of the cool season. In recent years, an extension in time and space of algal
blooms is noticed (Chabanet, 1994). Actually, the analysis for 10 years showed an increase of
algal cover that seems significant in the majority of the sites sampled between 1998 and 2009.
Algal cover have doubled or tripled in some sites, and most sites present today an algal cover
of more than 50%, which is characteristic of a bad ecological status (Bruno et al., 2009).
This habitat modification is probably not without consequences for fish populations wich
dynamics depends on this habitat quality, especially for demersal species which yields seem
to decrease (Fleury et al., 2012)
.

62
5. REFERENCES
5.1. FRENCH GUYANA Baklouti, M. et al., 2007. New insights in the French Guiana continental shelf circulation and
its relation to the North Brazil Current retroflection. 112(C020023), 1-18.
Baudrier J., Vendeville P., Rosé J., Achoun J., 2006. La pêcherie crevettière guyanaise :
Evaluation du volume des captures accessoires et des rejets de crevettes par observateurs
embarqués. Rapport final Ifremer, 51 pp.
Bellail R., Dintheer C., 1992. La Pêche maritime en Guyane française, flottilles et engins de
pêche. Rapp. Ifremer 120 pp.
Blanchard F., Thébaud O., 2009. Changement global, dynamique de la biodiversité marine
exploitée et viabilité des pêcheries (Rapport final du projet CHALOUPE).
http://archimer.ifremer.fr/doc/00076/18686/
Blanchard F., Cissé A., Guyader O., Gourguet S., Doyen L., Rosele-Chim P., 2011. GECO :
Gestion durable des pêcheries côtières en Guyane, Appel d’offre « R&D » 2008 du
Secrétariat d’Etat à l’Outre Mer, Contrat Ifremer n° 08/1217328/F, Rapport final, 47
pp.
Bourgeois A., 2009. Les rejets de la pêche côtière en Guyane. Rapport Ifremer, 14 pp.
Caro A., 2010. Description de la pêcherie vénézuélienne de Vivaneaux rouges (Lutjanus
purpureus) dans la ZEE de Guyane française de 1986 à 2008. Rapport Interne Ifremer,
HMT/RHGUYANE/2010-02, 21 pp.
Caro A., Lampert L., Blanchard F., Fidel L., Rosé J., 2009. HMT/RHGUYANE/2009-01
Analyse des données de pêche et de débarquement des deux segments exploitant le
vivaneau rouge et le vivaneau ti-yeux dans la ZEE de Guyane Estimation de la sélectivité
des engins pêchant le vivaneau entre 2007 et 2008 , 58 pp.
Caro A., Lampert L., Juin 2011 – RBE/BIODIVHAL/2011-02, Description de la pêcherie
vénézuélienne de vivaneaux dans la ZEE de Guyane et évaluation du stock de vivaneau
rouge (Lutjanus purpureus) en 2010, 79 pp.
Cissé A., 2009. Premiers éléments de diagnostic économique de la pêcherie côtière en
Guyane. Rapport de stage de Master 2 I.E.D.E., Université des Antilles et de la Guyane,
79 pp.
Cissé A., 2009. Etude sur la viabilité économique de la flottille de pêche côtière en Guyane
française. Mémoire de Master II I.E.D.E., Université des Antilles et de la Guyane, 66 pp.
Cissé A., Blanchard F., 2010. Dynamisme de la pêche artisanale en 2009, AntianÉco n° 73.
Cissé A., Blanchard F., Cassius L., 2009. La pêche côtière artisanale en Guyane. AntianÉco,
n° 71.
Cissé A., Blanchard F., Guyader O., 2010. Etude sur la rentabilité de la flottille de pêche
côtière en Guyane française : impact du prix lors de la première vente. Rapport Ifremer
HMT-RHGUY 2010-01, 15 pp.

63
Gourguet S., 2009. Modélisation écosystémique pour la gestion viable des pêcheries côtières
de Guyane. Univ. Paris 6, ENS, Agroparistech, Univ. Paris 11 et MNHN, Master 2
Ecologie Biodiversité et Evolution [Encadrant : Luc Doyen, CNRS-MNHN], 46 pp.
Lampert L., 2011. Etude de la crise de la pêche de la crevette en Guyane. Volume 1 : Effets
de la pêcherie, hypothèses des causes. Rapport Ifremer, 79 pp.
Leopold M., 2004. Guide des poissons de mer de Guyane, Ed. Ifremer, 216 pp.
Pérodou JB., 1994. Dynamique de la population exploitée de Vivaneau rouge (Lutjanus
purpureus) de Guyane. Complémentarités des analyses globales et structurales. Thèse de
l’Université des Sciences et Technologies de Lille. Non publié.
Rivot E., 2000. Le vivaneau rouge (Lutjanus purpureus dans la ZEE de Guyane française.
Bilan des connaissances sur la biologie de l’espèce. Analyse de quelques aspects de la
pêcherie vénézuélienne. Document interne IFREMER. Laboratoire des Ressources
Halieutiques de Cayenne DRV-RH IFREMER Cayenne.
Rockwell Geyer, W. et al., 1996. Physical oceanography of the Amazon shelf. Continental
Shelf Research, 16(5-6), 575-616.
Spaare P., Venema, S.C., 1996. Introduction à l’évaluation des stocks de poissons tropicaux.
Première partie : Manuel. FAO Document technique sur les pêches. N° 306.1, Rev.1.
Vendeville Ph., Rosé J., Viera A., Blanchard, F., 2008. Durabilité des activités halieutiques et
maintien de la biodiversité marine en Guyane, Rapport DuHal -[CPER DocUp 2000-2006]
Rapp. Ifremer DCM/HMT/RHGUY 2008-1, 316 p.
5.2. MARTINIQUE AND GUADELOUPE Bodiguel X., Bertrand J., Fremery J., 2011. Devenir de la chlordécone dans les réseaux
trophiques des espèces marines consommées aux Antilles (CHLORETRO). Rapport final,
Rapport Ifremer, 54 pp.
CRFM Fishery Report, 2011. Volume 1. Report of Seventh Annual Scientific Meeting –
Kingstown, St. Vincent and the Grenadines, 16 - 24 June 2011, 181 pp.
Headley M. 2009. Harvesting of Flyingfish in the Eastern Caribbean: A Bioeconomic
Perspective. United Nations University-Final Project.
Guyader O., Berthou P., Reynal L., Demanèche S., Bruneau M., Bellanger M., Angin B.,
Merrien C., Guegan F., Lespagnol P., Pitel M., Jézéquel M., Leblond E., Daurès F., 2011.
Situation de la pêche en Guadeloupe en 2008: Rapport du projet pilote Système
d’Informations Halieutiques Guadeloupe 2007-2009, Ifremer-SIH-2011/02/28, 83 p.
Mahon R., 1989. Developing a management strategy for the flyingfish fishery of the eastern
Caribbean. Proceeedings of the Gulf and Caribbean Fisheries Institute. 39:389-403.
Medley P., Caesar K., Hubert-Medar P., Isaacs K., Leslie J., Mohammed E., Oxenford H.A.,
Phillip P., Potts A.C., Ryan R., Walters R., 2008. PART II: Management Strategy and
Stock Assessment Report for Flyingfish in the Eastern Caribbean. pp. 11 – 29 In: FAO,

64
2010. Report of the Third Meeting of the WECAFC Ad Hoc Flyingfish Working Group of
the Eastern Caribbean. Mount Irvine, Tobago, 21–25 July 2008. FAO Fisheries and
Aquaculture Report. No. 929. Rome, FAO. 2010. 88p.
Mohammed E., Vasconcellos M., Mackinson S., Fanning P., Heileman S., Carocci F., 2008.
A trophic model of the Lesser Antilles Pelagic Ecosystem. Technical Document No. 2 of
Scientific Basis for Ecosystem-Based Management in the Lesser Antilles Including
Interactions with Marine Mammals and Other Top Predators FAO. FI: GCP/RLA/140/JPN
Barbados.168p.
Oxenford H.A., Mahon R., Hunte W., 2007. [eds] The Biology and Management of Eastern
Caribbean Flyingfish. Centre for Resource Management and Environmental Studies,
University of the West Indies, Barbados, 267 pp.
Reynal L., Demanèche S., Guyader O., Bertrand J., Berthou P., Dromer C., Bruneau M.,
Bellanger M., Merrien C., Guegan F., Lespagnol P., Pitel M., Jézéquel M., Leblond E.,
Daurès F., 2011. Premières données sur la pêche en Martinique 2009-10 : Rapport du
projet pilote du Système d’Informations Halieutiques, en préparation, SIH Martinique
2007-2010, Ifremer-SIH-2011/04/30, XX pp.
5.3. LA REUNION
Bruno JF, Sweatman H, Precht WF, Selig ER, Schutte VGW, 2009. Assessing evidence of
phase shifts from coral to macroalgal dominance on coral reefs. Ecology 90:1478-1484.
Chabanet P, 1994 : Etude des relations entre les peuplements benthiques et les peuplements
ichtyologiques sur le complexe récifal de Saint-Gilles / La Saline. Île de la Réunion. Thèse
de Doctorat, Université de la Réunion. 235 pp + Annexes.
Cuet P, Naïm O, Faure G, Conan JY, 1988. Nutrient-rich groundwater impact on benthic
communities of a Saline fringing reef (Reunion Island, Indian Ocean) : preliminary results.
Proc. 6th Int. Coral Reef Symp., Townsville, August 8-12: 207-212.
Cuet P, 1989 : Influence des résurgences d'eau douce sur les caractéristiques physico-
chimiques et métaboliques de l'écosystème récifal à La Réunion. Doctorat en Chimie de
l'Environnement, Université d’Aix- Marseille III, Marseille. 295 pp.
Cuet P, Naim O, 1992. Analysis of a blatant reef flat degradation in la Reunion Island
(l’Etang-Salé fringing reef). Proc. 7th Int. Coral Reef Symp., Guam, June 22-26: 313-322.
Fleury PG, Evano H., Le Ru L., 2012. Campagne de prospection de poissons démersaux
profonds réalisée autour de La Réunion en 2011. Analyse de la Petite Pêche Côtière
Réunionnaise. 2e rapport intermédiaire du volet Démersaux profonds, Ifremer, 91 pp.
Guillaume M, Payri C, Faure G, 1983. Blatant degradation of coral reefs at la Reunion Island
(West Indian Ocean). Int. Soc. Reef Stud. Ann. Meet. Nice, 8-9/12/1983 : 28.
Le Couls S., Bourjea J., 2010. Bilan de l’état des stocks et mesures de gestion de l’espadon
Xiphas gladius dans les Océans Atlantique, Pacifique, Indien et en Mer Méditerranée.
Revue bibliographique. Rapport Ifremer, 41 pp.

65
Miossec D., Bochard R., Evano H., Grizel H., Merrien C., Berthou P., Le Ru L., Bermell S.,
Leblond E., Morandeau G., Demaneche S., 2007. Mise en place du Système
d’Informations Halieutiques à La Réunion, SIHR, Rapport final, Activité des flottilles
réunionnaises en 2005 et 2006. Rapport Ifremer, 125 pp.
Naim O, 1993a. Critical period for an eutrophication-trending fringing reef (Reunion Island,
Western Indian Ocean). Mar. Ecol. Prog. Ser. 99: 137-151.
Naim O, 1993b. Seasonal responses of a fringing reef community to eutrophication (Reunion
island, Western Indian ocean). Mar. Ecol. Progr. Ser. 99: 307-315.
Naïm O, Cuet P, Mangar V, 2000. The Mascarene Islands. In: Coral reefs of the Indian
Ocean: their ecology and conservation.T. McClanahan, Sheppard & Obura (eds), Oxford
University Press, pp 353-381.
Semple R, 1997. Algal growth on two sections of a fringing coral reef subject to different
levels of eutrophication in Reunion Island. Oceanologica Acta 20: 851-861.