Embed Size (px)
Citation preview

Vol. 14, No. 1-4 57
Deriving Structures from 2D NMR. A Method for Defining theConformation of a Protein Adsorbed to Surfaces
David A. Keire and David G. Gorenstein*Department of Chemistry
Purdue UniversityWest Lafayette, Indiana 47907
With the development of multi-dimensionalNMR methods for the specific assignment of many ofthe *H NMR signals of small proteins, it is now pos-sible to determine three-dimensional solution struc-tures and dynamics for these proteins. Unfortu-nately these methods fail to provide detailed struc-tural information on proteins bound to macroscopicsurfaces because of the very slow overall rotationalcorrelation time of the particle-bound protein. In-deed other spectroscopic and structural methodshave provided few details of the structure of pro-teins when adsorbed to surfaces (1). Commercially,surface-bound, immobilized enzymes provide an im-portant method for efficient utilization of these cat-alysts in bioreactors. The development of biosensorsand novel biomaterials such as self-assembled mono-layers (2) requires a better understanding of thestructure of proteins bound to surfaces (1). Iden-tification of specific residues of proteins involved ininteractions with stationary phase surfaces is criti-cal in understanding their chromatographic behav-ior (3). Finally, the association of proteins withhydrophobic or glass surfaces has been shown tocause denaturation or partial unfolding of the pro-
. tein at the surface, with often irreversible loss ofthe strongly adsorbed protein. It is believed that
;.these irreversibly bound proteins undergo a confor-|mational change to expose a portion of the interior
sidues to the surface for effective adsorption.J this report we describe an NMR methodology[it for the first time allows us to probe the detailed^formation of a protein bound to a macroscopic
This was accomplished by 2D amide hy-«i exchange NMR spectroscopy (4, 5, 6). In a?i , the NH exchange rates for different residues
over a factor of greater than 108 (4, 5).fate of amide hydrogen/deuterium exchange"I on the pH (being both acid and base cat-
! the accessibility of the hydrogen to solvent,Mlization by hydrogen-bonded secondary astertiary structure and finally, local fluctu-
•jf the protein (7). Importantly amide hy-
drogen exchange can be studied under conditionswhere high resolution resolvable proton NMR sig-nals would otherwise not be observed - this wouldbe true for a protein immobilized at a polymeric orglass surface. However, analysis of the degree of NHexchange is feasible if the protein can be desorbedfrom the surface and the 2D NMR study of the freeprotein carried out in solution.
As demonstration of the feasibility of themethod, we have used amide hydrogen exchangeNMR spectroscopy of lysozyme bound to a hy-drophobic chromatographic stationary phase sup-port. Hen egg white lysozyme (E.C.3.2.1.17) waschosen for this initial study because the ^-NMRassignments have been made (8), the crystal struc-ture was known to 2 A resolution (9) and much wasknown about its adsorption onto hydrophobic sub-strates (10). Lysozyme is one of the major con-stituents of protein deposits on contact lenses (11)and is commonly used as a standard in the chro-matographic separation of proteins on reverse-phasecolumns.
In our protocol we first adsorb lysozyme to thehydrophobic surface (solid 5 \i diameter polystyrenedivinylbenzene chromatographic stationary phasesupport; Polymer Labs Inc., Amherst, Mass.). Thisforms a tightly bound single monolayer on thesurface (10). We then expose the surface boundlysozyme to D2O under fast amide hydrogen ex-change conditions (high pH), desorb the protein un-der slow NH exchange conditions (low pH) usinga detergent, and after removal of the detergent, runthe high resolution 2D spectra in D2O solution. Theintensities of the 2D NHCHa TOCSY crosspeaksthen reflect the degree of exchange of the specificresidue amide hydrogens when adsorbed to the hy-drophobic surface.
The stock solution of lysozyme (Sigma) was pu-rified using a home built hollow fiber bundle dialysisdevice versus 10 mM NaH2PC>4 pH = 7.4 buffer. Analiquot of the stock solution containing 125 mg of

58 Bulletin of Magnetic Resonance
lysozyme was diluted to 10 mL in buffer and mixedwith 10 g of hydrated stationary phase support for30 min. with stirring. The solution was then re-moved by the use of a filter funnel with a mediumgrain glass frit.
Eighty milliliters of buffer were used to wash thestationary phase support in 10 to 20 mL aliquots.For each aliquot a sample of the filtrate was takenfor UV determination of protein concentration (e280= 2.313 O.D. mL/mg) to ensure that only an "ir-reversibly" bound monolayer coverage remained.Typically, out of 125 mg of lysozyme initially added~25 mg would remain on the support after exten-sive washing. The stationary phase support has asurface area of ~3 A/gm and a rough calculationusing the molecular dimensions of lysozyme (4.5 x 3x 3 nra3) shows that ~50 mg of protein could adsorbto 10 gm of support with monolayer coverage. The25 mg of lysozyme adsorbed represents 50% cover-age which is in good agreement with the 65% cov-erage by the irreversibly bound layer determined bySchmidt et al. (10) to a similar hydrophobic surface.
At this point a 10 mM NaH^PCU D2O solutionpH* = 7.0 (uncorrected pH meter reading) was pre-pared and mixed with the lysozyme covered sup-port. The adsorbed protein was then stirred for 45min. during which time the amide hydrogens thatare exposed to solvent can exchange with deuterons.After 45 min. the solution was aspirated awayand another 10 mL of the buffered D2O solution atpH*=2.5 was added to quench the amide exchange.
Two aliquots of 0.1% Triton X-114-RS (Sigma)detergent in 10 mL D2O, pH* = 2.5 were used toremove the tightly adsorbed protein. The reducedform of Triton was used to allow determination ofdesorbed protein concentration by UV. The ~30mL of desorbed lysozyme/Triton solution was thenconcentrated by pressure dialysis (Amicon, Beverly,Mass.) to ~4 mL using a 5000 molecular weight cut-off membrane. The 4 mL was then passed throughan Extracti-Gel column (Pierce) equilibrated withpH* = 2.5 D2O buffer to remove the Triton. Thecolumn eluent was further concentrated to ~750 fiband placed in an NMR tube. Approximately 5 mg(0.5 mM) of desorbed lysozyme was obtained by thisprocedure for the NMR study. Much of the proteinloss occurred during the repurification scheme sincethe adsorbed protein was nearly quantitatively re-moved from the surface by the detergent treatment.
In the control experiment the identical proce-dure was used except that only 5 mg of lysozyme wasused and no stationary phase support was present.An additional control was run without stationaryphase support and without Triton to ensure thatany residual Triton not detectable in the ID NMRspectrum did not interfer with the amide exchangeresults. This control gave essentially the same inte-grated area for the TOCSY cross peaks of the NH-CaH region as the control involving Triton.
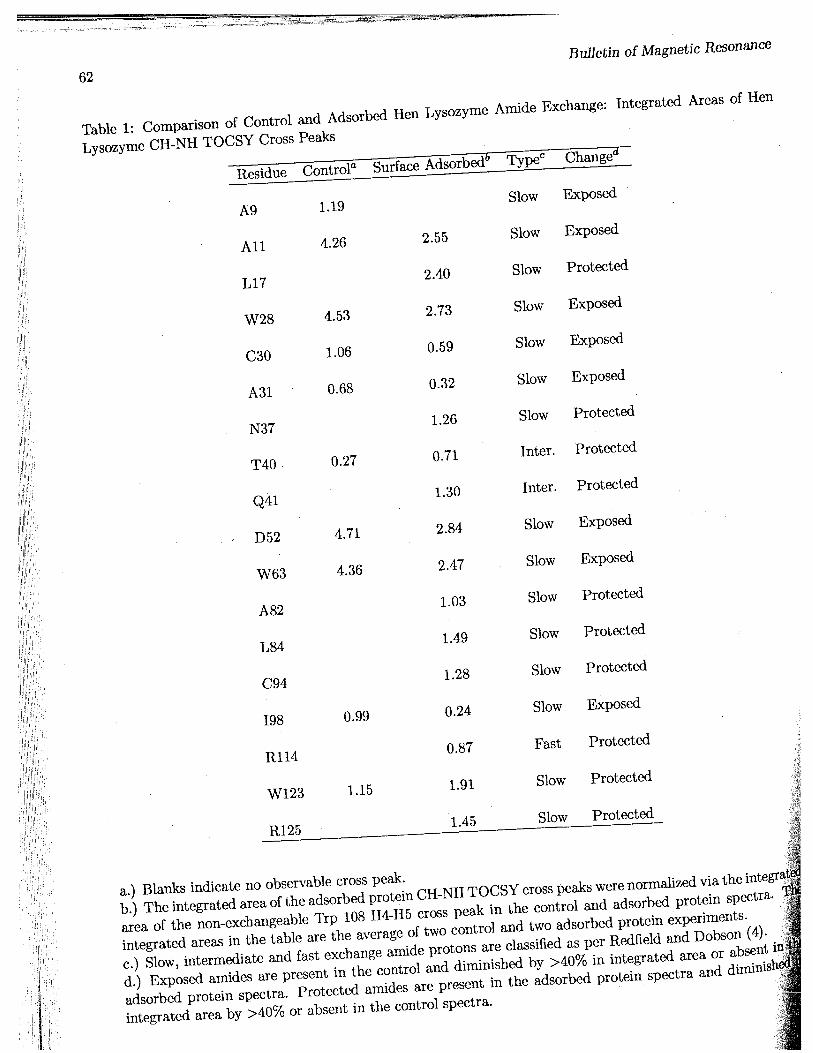
The 600 MHz XH-NMR NH-CaH region of the30 ms TOCSY spectra of the control and surfaceadsorbed/desorbed lysozyme is shown in Figure 1.Assignment of the signals was based upon completeanalysis of the TOCSY spectra, taking advantageof the reported 1H assignments of lysozyme at 500MHz (8). Normally, a series of TOCSY spectra atvarious time points are taken to measure the rateof NH exchange. Since this has been shown to befirst order, comparing the spectra at a fixed timeof exchange under conditions where the protein iseither surface-bound or not will also provide a mea-sure of the relative degree of NH protection. Wedefine protons as being "exposed" when their cross-peaks present in the control spectrum are decreasedin intensity by >40% relative to the surface exposedprotein spectrum. Protons are "protected" if thecrosspeaks are either absent in the control spectra orincrease in intensity by >40% in the surface exposedsample spectra. Three control experiments (withoutthe support present) were used to calculate the per-cent deviation from the mean of the integrated areasof 39 of the slow exchanging amide proton NH-CaHTOCSY cross peaks. The mean of the 39 deviationsfrom the means of the integrated areas was 20±13%.Thus, only those changes in integrated area >40%;were considered exposed or protected after averag|ing the cross peak areas from two separate adsorbajprotein and control experiments. These results ar|tabulated for the slow exchanging amides [as definwby Redfield & Dobson (8) at pH = 3.8, 35°C, n/2.the half life for exchange > 1-5 h] in Table I. Alsoincluded in Table I are the integrated intensities oj2 intermediate exchange (1 h < r1/2 < 5 h) and on«fast exchange amide hydrogens (T1/2 < 1-5 h) whicgare protected relative to the control.
All of the amides which are protected (Table.*with the exception of the 2 arginines are neutror hydrophobic residues. A CPK model {Figuiej

Vol. 14, No. 1-4 59
BF l (ppm)
5 . 5 3.5 3.0 2.5
F l (ppm)
1: Identical 600 MHz ^-NMR TOCSY experiments at 35°C and pH*=2.5 were run on both the>1 and adsorbed lysozyme samples. The data was collected in phase sensitive mode with a mixing time
using a MLEV17 spin lock and 2 ms trim pulses. 2K points were collected in F2 and 312 in Fl^sweep width of 7500 Hz and a repetition time of 3 s. 32 transients were coadded at each ti increment.£JD signal was suppressed through low power decoupling at the HOD frequency. The spectra were
with zero filling to 2K points in the Fl dimension and a 45° phase shifted sine bell apodization intensions.

60 Bulletin of Magnetic Resonance
based upon the crystal structure of lysozyme (9)]shows that all of the protected amide residues (la-beled by shading) are found on the surface. Fourof the protected amide residues (T40, Q41, A82and L84) are located close in space at the hinge re-gion between the a-helical and /3-sheet domains oflysozyme opposite the active site cleft.
All of the exposed amides - those that show en-hanced amide exchange upon binding to the sur-face - with the exception of W63 are involved in a-helices or /3-sheet structures and are mostly buriedin the interior of lysozyme (Table I). Of the exposedamides only D52 and W63 show significantly ex-posed side chains as shown in the CPK model (Fig-ure 2; exposed residues shown by stripes).
The protein amide hydrogens that are observableby 2D amide exchange spectroscopy are mostly theslow exchanging amides (58/129) which are eitherinvolved in secondary or tertiary structure hydro-gen bonding or buried in the interior of the proteinand inaccessible to solvent (12). Surprisingly, onefast exchanging amide hydrogen (III 14), and two in-termediately exchanging hydrogens (T40 and Q41)CaH-NH cross peaks were observable in the spec-trum of lysozyme exposed to the hydrophobic sur-face which were not present in the control spectrum(Figure 1).
Figure 2A shows that the protected (stippled)amide hydrogen side chains lie on one face of theglobular protein in a narrow ridge from R125 toL17. In contrast, in the back-side view (Figure 2B),only a few of the largely buried side chains of theexposed residues (striped) are visible. None of theprotected residues are visible in this view. These re-sults suggest that lysozyme is not randomly orientedwith respect to the surface, but that it is orientedwith a relatively hydrophobic ridge facing towardsthe hydrophobic surface. This is consistent with theobserved retardation of amide hydrogen exchange inbinding an amphiphilic helix to a micelle (13), be-lieved to result from burial of the hydrophobic faceof an amphiphilic helix into the hydrophobic interiorof a detergent micelle.
In addition a number of residues exchange morerapidly when the protein is surface bound than whenit is in solution. All of these are not exposed tothe solvent in the native structure but are locatedon elements of structure that are likely involved insegmental motion of the two domains that form the
active site cleft (14). Binding of the hydrophobicridge of the protein to the surface thus appears toinduce a conformational change, exposing the activesite residues and residues adjacent to the active siteto solvent.
These perturbations in the amide exchange ratesdo not simply reflect proximity of the protein tothe surface because enhancement and protection to-wards exchange are observed. In addition mostof the amide hydrogen exchange rates which arenot exposed or protected are the same for surfacebound or free lysozyme. In contrast only decreasesin amide exchange rates are observed in binding anamphiphilic helix to a micelle (13) and in crystallinelysozyme (15).
Taken together these data indicate thatlysozyme adsorbs to the surface on the side oppositethe active site cleft. This protects this narrow ridgeof amides from exchange by either blocking solventaccess to these residues at the hydrophobic surfaceor by reducing the rate of local fluctuations in thesurface oriented residues. In addition upon bindingto the hydrophobic surface a significant disruptionof several of the buried a-helices and the active sitecleft occurs as the protein partially unfolds at thesurface presumably by opening of the "hinge" atthe active site (16), exposing a number of buriedresidues that now show enhanced rate of hydrogenamide exchange. This conformational change altersthe amide solvent exposure and/or local fluctuationsthat allow access of solvent to these interior residues.
This partial unfolding exposes the catalyticallyimportant D52 residue and other important residuesin the active site cleft. This model is supported bythe fact that the enzyme is inactive on adsorptionto the hydrophobic surface of alkylated silica (10).These conclusions are also in agreement with theresults of Fausnaugh and Regnier (3) based uponanalysis of chromatographic behavior of various birdlysozymes that also suggests the protein adsorbs ona side opposite the active site with a contact surface jthat extends from residues 41 to 102 and 75 to 89.1Computer modeling has also revealed a relatively^hydrophobic patch identified as a possible bindingsite in this region and total internal reflection i jsic fluorescence (TIRIF) shows a decreased quantun^yield (and hence altered conformation) of thesorbed hen lysozyme (17).
Importantly, the surface desorbed lysozj

Vol. 14, No. 1-4 61
A
B
wire2: Three dimensional structure of hen lysozyme. A) Front-side view of a CPK model [MIDAS modeling", UCSF (21)] showing amide NH's which are relatively protected (shaded and stippled) or exposed
and striped) when the protein is bound to the polystyrene surface. The active site cleft is orientedne upper left. B) No residues that are protected from exchange (shaded and stippled) can be seen
^.ackside view of the protein. Several of the side chains of residues that are more exposed (shaded and,<?an be observed in this view.
Bulletin of Magnetic Resonance
62
Lysozyme CH-NH TOCSY Cross Peaks
A9
All
L17
W28
C30
A31
N37
T40
Q41
D52
W63
A82
L84
C94
198
R114
W123
R125
1.19
4.26
4.53
1.06
0.68
0.27
4.71
4.36
0.99
1.15
2.55
2.40
2.73
0.59
0.32
1.26
0.71
1.30
2.84
2.47
1.03
1.49
1.28
0.24
0.87
1.91
1.45
Slow Exposed
Slow Exposed
Slow Protected
Slow Exposed
Slow Exposed
Slow Exposed
Slow Protected
Inter. Protected
Inter. Protected
Slow Exposed
Slow Exposed
Slow Protected
Slow Protected
Slow Protected
Slow Exposed
Fast Protected
Slow Protected
Slow Protected
a.) Blanks indicate no observable cross peak.b.) The integrated area of the adsorbed protein CH-NH TOCSY cross peaks were normalized via the integraMarea of the non-exchangeable Trp 108 H4-H5 cross peak in the control and adsorbed protein spectra. Wtintegrated areas in the table are the average of two control and two adsorbed protein experiments. Jjjc.) Slow, intermediate and fast exchange amide protons are classified as per Redfield and Dobson (4). | ipd.) Exposed amides are present in the control and diminished by >40% in integrated area or absent inj|adsorbed protein spectra. Protected amides are present in the adsorbed protein spectra and diminish^integrated area by >40% or absent in the control spectra. | i

Vol. 14, No. 1-4 63
spectra have identical chemical shifts as the nativeform spectra. This suggests that while the pro-tein partially unfolds at the surface, it refolds bythe same kinetically or thermodynamically favor-able pathway upon desorption. Thus, the surfaceunfolded state may represent a protein folding in-termediate of native hen lysozyme. Only a transientfolding intermediate has been previously identifiedin lysozyme (12). By binding the protein to a sur-face it may be possible to trap a partially unfoldedstate of lysozyme that bears some resemblance tothe transient folding intermediate observed by Mi-ranker et al. (12). This would be complementary tothe rapid quench NMR amide hydrogen exchangespectroscopy methods (12, 18, 19, 20) which pro-vides structural details on the initial refolding ki-netic intermediates. Our method would presumablyprovide information on the initial unfolding interme-diate.
Surface 2D amide exchange spectroscopy offersa new method by which protein adsorption can bemonitored at the level of individual residues. Thiswork demonstrates for the first time the feasibilityof the method which should be applicable to a num-ber of other enzymes. The method offers a more de-tailed picture of protein adsorption than provided bycurrently used techniques (e.g. TIRF, ATR-FTIRand Raman spectroscopy (1)). Future work willinclude the extension of the methodology to othersurfaces and proteins. Indeed at the XVth Inter-national Conference on Magnetic Resonance in Bi-
. ological Systems (Jerusalem, Israel, August 16-21,,., 1992, abstracts) K. Kawano et al., described simi-i -lar application of the NH exchange experiment to\j the binding of lysozyme to hydroxyapatite. They'also find that certain residues are protected from
nange when the protein is adsorbed to the sur-However unlike our results no enhancement of
•exchange is observed.!' Acknowledgments
rSupported by the Office of Naval Researchjp00l4-91-J-1686) and the Purdue University Bio-
4cal Magnetic Resonance Laboratory which isported by the NSF Biological Facilities Center on
Secular NMR, Structure and Design at Pur-[grants BBS 8614177 and DIR-9000360 fromjjyision of Biological Instrumentation) and NIH
•ferences
1. J. D. Andrade and V. Hlady, Adv. Polym.Sci. 79, 1-63 (1986).
2. K. L. Prime and G. M. Whitesides, Science252, 1164-1166 (1991).
3. J. L. Fausnaugh and F. E. Regnier, J. Chro-matogr. 359, 131- 146 (1986).
4. H. Roder, "Methods in Enzymology" (N. J.Oppenheimer and T. L. James, eds. ), 446-473, Aca-demic Press, Inc., 1989.
5. S. W. Englander and N. R. Kallenbach, Q.Rev. Biophys. 19, 521-655 (1984).
6. H. Roder, G. Wagner, and Wuthrich, Bio-chemistry 24, 7396-7407 (1985).
7. Y. Paterson, S. W. Englander, and H. Roder,Science 249, 755-759 (1990).
8. C. Redfield and C. M. Dobson, Biochemistry21, 122-136 (1988).
9. C. C. F. Blake, G. A. Koenig, A. C. Mair, C.T. North, D. C. Philips, and V. R. Sarma, Nature206, 757-761 (1965).
10. C. F. Schmidt, R. M. Zimmermann, and H.E. Gaub, Biophys. J. 57, 577-588 (1990).
11. E. J. Castillo, J. L. Koenig, and J. M. An-derson, Biomaterials 6, 338-344 (1985).
12. A. Miranker, S. E. Radford, M. Karplus, andC. M. Dobson, Nature 349, 633-636 (1991).
13. C. Karslake, M. E. Piotto, Y. M. Pak, H.Weiner, and D. G. Gorenstein, Biochemistry 29,9872-9878 (1990).
14. C. C. F. Blake, G. A. Mair, A. C. T. North,D. C. Phillips, and V. R. Sarma, Proc. R. Soc.Lond. Ser. B 167, 365-377 (1967).
15. T. G. Pedersen, B. W. Sigurskjold, K. V.Andersen, M. Kjaer, F. M. Poulsen, C. M. Dobson,and C. Redfield, J. Mol. Biol. 218, -413-426(1991).
16. J. A. McCammon, B. R. Gelin, M. Karplus,and P. G. Wolynes, Nature 262, 325-326 (1976).
17. D. Horsley, J. Herron, V. Hlady, and J. D.Andrade, "Proteins at Interfaces", 290-305, 1987.
18. H. Roder, G. A. Elove, and S. W. Englander,Nature 335, 700 (1988).
19. J. B. Udgaonkar and R. L. Baldwin, Nature335, 694-699 (1988).
20. C. M. Dobson and P. A. Evans, Nature 335,666 (1988).
21. T. E. Ferrin, C. C. Huang, L. C. Jarvis, andR. Langridge, J. Mol. Graphics 6, 13-27 (1988).


![Micro-Mechanical Viscoelastic Properties of Crosslinked ......for most soft tissues and biomaterials [27–29]. We suggested that an ideal testing method for deriving We suggested](https://img.dokumen.tips/doc/110x75/60ec7b12d34f663e315d3470/micro-mechanical-viscoelastic-properties-of-crosslinked-for-most-soft-tissues.jpg)