Embed Size (px)
Citation preview

DERIVATIVES MARKET TRANSACTION SURVEY 2014/15
December 2015
CONTENTS
Page
Executive summary ................................................................................................................. 1
1. Introduction .................................................................................................................... 4
2. Transaction purposes ...................................................................................................... 7
3. Trading by investor type .............................................................................................. 11
3.1 Overall pattern ..................................................................................................... 11
3.2 Trading by product ............................................................................................... 15
4. Overseas investor trading by origin ............................................................................. 20
4.1 Overall pattern ..................................................................................................... 20
4.2 Trading by market segment ................................................................................. 23
5. Retail online trading ..................................................................................................... 27
Glossary ................................................................................................................................. 29
Appendix 1. Response rate ................................................................................................. 30
Appendix 2. Representativeness of the responded sample relative to target respondents . 31
Appendix 3. Contract size and notional value of products under study ............................ 32
Appendix 4. Survey methodology ...................................................................................... 33
DERIVATIVES MARKET TRANSACTION SURVEY 2014/15 1
EXECUTIVE SUMMARY
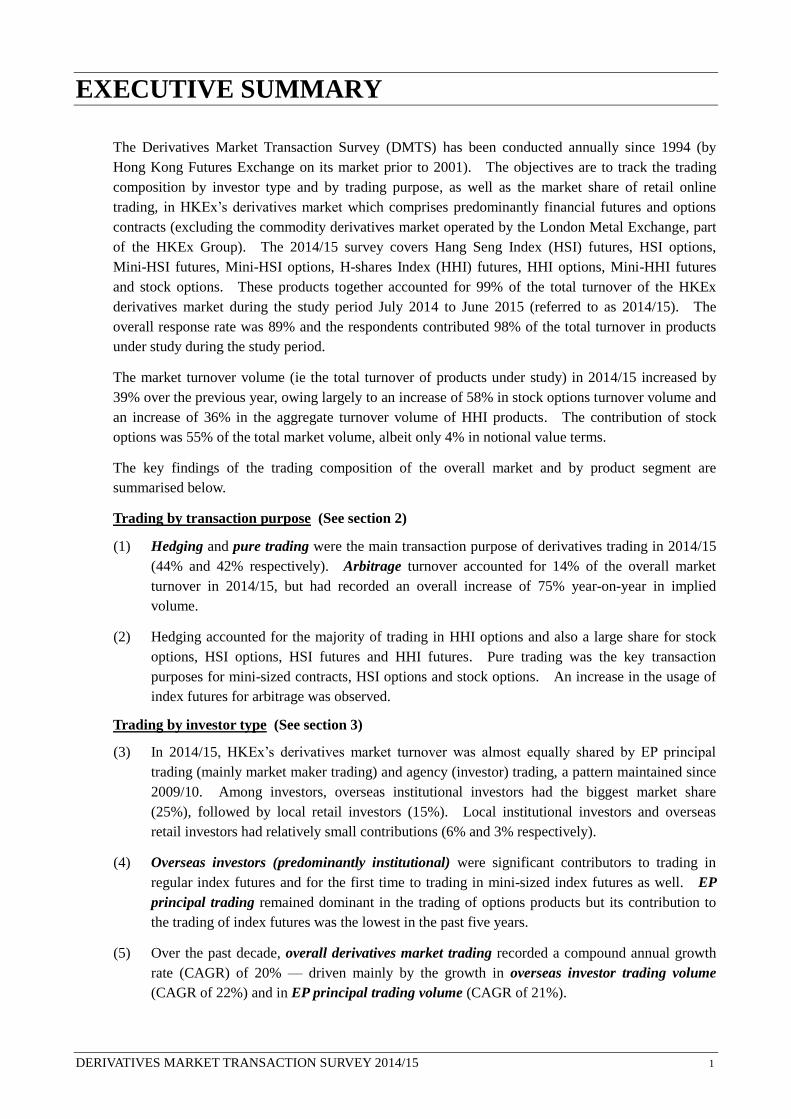
The Derivatives Market Transaction Survey (DMTS) has been conducted annually since 1994 (by
Hong Kong Futures Exchange on its market prior to 2001). The objectives are to track the trading
composition by investor type and by trading purpose, as well as the market share of retail online
trading, in HKEx’s derivatives market which comprises predominantly financial futures and options
contracts (excluding the commodity derivatives market operated by the London Metal Exchange, part
of the HKEx Group). The 2014/15 survey covers Hang Seng Index (HSI) futures, HSI options,
Mini-HSI futures, Mini-HSI options, H-shares Index (HHI) futures, HHI options, Mini-HHI futures
and stock options. These products together accounted for 99% of the total turnover of the HKEx
derivatives market during the study period July 2014 to June 2015 (referred to as 2014/15). The
overall response rate was 89% and the respondents contributed 98% of the total turnover in products
under study during the study period.
The market turnover volume (ie the total turnover of products under study) in 2014/15 increased by
39% over the previous year, owing largely to an increase of 58% in stock options turnover volume and
an increase of 36% in the aggregate turnover volume of HHI products. The contribution of stock
options was 55% of the total market volume, albeit only 4% in notional value terms.
The key findings of the trading composition of the overall market and by product segment are
summarised below.
Trading by transaction purpose (See section 2)
(1) Hedging and pure trading were the main transaction purpose of derivatives trading in 2014/15
(44% and 42% respectively). Arbitrage turnover accounted for 14% of the overall market
turnover in 2014/15, but had recorded an overall increase of 75% year-on-year in implied
volume.
(2) Hedging accounted for the majority of trading in HHI options and also a large share for stock
options, HSI options, HSI futures and HHI futures. Pure trading was the key transaction
purposes for mini-sized contracts, HSI options and stock options. An increase in the usage of
index futures for arbitrage was observed.
Trading by investor type (See section 3)
(3) In 2014/15, HKEx’s derivatives market turnover was almost equally shared by EP principal
trading (mainly market maker trading) and agency (investor) trading, a pattern maintained since
2009/10. Among investors, overseas institutional investors had the biggest market share
(25%), followed by local retail investors (15%). Local institutional investors and overseas
retail investors had relatively small contributions (6% and 3% respectively).
(4) Overseas investors (predominantly institutional) were significant contributors to trading in
regular index futures and for the first time to trading in mini-sized index futures as well. EP
principal trading remained dominant in the trading of options products but its contribution to
the trading of index futures was the lowest in the past five years.
(5) Over the past decade, overall derivatives market trading recorded a compound annual growth
rate (CAGR) of 20% — driven mainly by the growth in overseas investor trading volume
(CAGR of 22%) and in EP principal trading volume (CAGR of 21%).
DERIVATIVES MARKET TRANSACTION SURVEY 2014/15 2
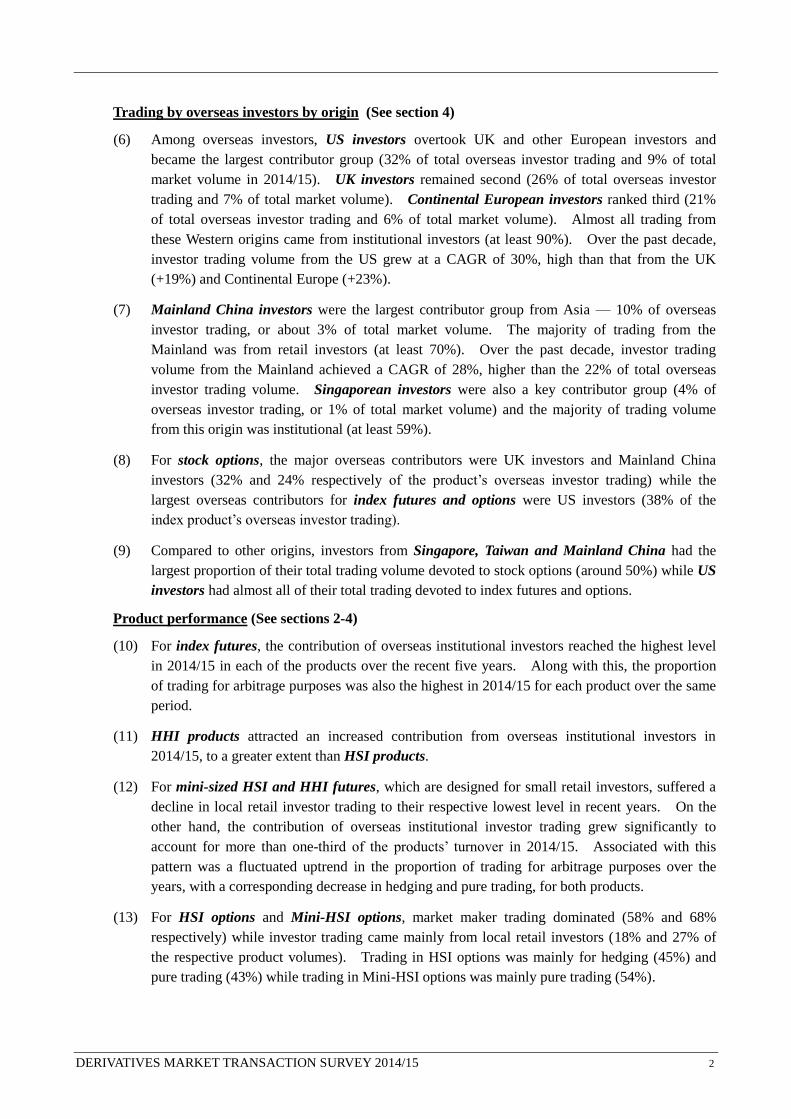
Trading by overseas investors by origin (See section 4)
(6) Among overseas investors, US investors overtook UK and other European investors and
became the largest contributor group (32% of total overseas investor trading and 9% of total
market volume in 2014/15). UK investors remained second (26% of total overseas investor
trading and 7% of total market volume). Continental European investors ranked third (21%
of total overseas investor trading and 6% of total market volume). Almost all trading from
these Western origins came from institutional investors (at least 90%). Over the past decade,
investor trading volume from the US grew at a CAGR of 30%, high than that from the UK
(+19%) and Continental Europe (+23%).
(7) Mainland China investors were the largest contributor group from Asia — 10% of overseas
investor trading, or about 3% of total market volume. The majority of trading from the
Mainland was from retail investors (at least 70%). Over the past decade, investor trading
volume from the Mainland achieved a CAGR of 28%, higher than the 22% of total overseas
investor trading volume. Singaporean investors were also a key contributor group (4% of
overseas investor trading, or 1% of total market volume) and the majority of trading volume
from this origin was institutional (at least 59%).
(8) For stock options, the major overseas contributors were UK investors and Mainland China
investors (32% and 24% respectively of the product’s overseas investor trading) while the
largest overseas contributors for index futures and options were US investors (38% of the
index product’s overseas investor trading).
(9) Compared to other origins, investors from Singapore, Taiwan and Mainland China had the
largest proportion of their total trading volume devoted to stock options (around 50%) while US
investors had almost all of their total trading devoted to index futures and options.
Product performance (See sections 2-4)
(10) For index futures, the contribution of overseas institutional investors reached the highest level
in 2014/15 in each of the products over the recent five years. Along with this, the proportion
of trading for arbitrage purposes was also the highest in 2014/15 for each product over the same
period.
(11) HHI products attracted an increased contribution from overseas institutional investors in
2014/15, to a greater extent than HSI products.
(12) For mini-sized HSI and HHI futures, which are designed for small retail investors, suffered a
decline in local retail investor trading to their respective lowest level in recent years. On the
other hand, the contribution of overseas institutional investor trading grew significantly to
account for more than one-third of the products’ turnover in 2014/15. Associated with this
pattern was a fluctuated uptrend in the proportion of trading for arbitrage purposes over the
years, with a corresponding decrease in hedging and pure trading, for both products.
(13) For HSI options and Mini-HSI options, market maker trading dominated (58% and 68%
respectively) while investor trading came mainly from local retail investors (18% and 27% of
the respective product volumes). Trading in HSI options was mainly for hedging (45%) and
pure trading (43%) while trading in Mini-HSI options was mainly pure trading (54%).

DERIVATIVES MARKET TRANSACTION SURVEY 2014/15 3
(14) For HHI options, EP principal trading remained the major contributor (31% from market
making; 20% from proprietary trading). The proportion of trading in HHI options for hedging
purpose stood at about 60% or more over the years, the highest among the products under study.
(15) For stock options, market maker trading remained at around two-thirds of the product’s volume
in the past five years while local retail investor trading remained the major investor contributor
group. The proportions of trading for hedging purposes and pure trading were similarly
significant (46% for each).
Retail online trading (See section 5)
(16) Retail online trading as a proportion of total retail investor trading was 68% in 2014/15,
compared to 67% in 2013/14. Its contribution to total market turnover was 12% in 2014/15
(compared to 13% in 2013/14).

DERIVATIVES MARKET TRANSACTION SURVEY 2014/15 4
1. INTRODUCTION
The Derivatives Market Transaction Survey (DMTS) has been conducted annually since 1994 (by
Hong Kong Futures Exchange on its market prior to 2001). The main objective of the survey is to
track trading composition by investor type and by trading purpose in HKEx’s derivatives market
which predominantly comprises financial futures and options contracts (excluding the commodity
derivatives market operated by the London Metal Exchange, part of the HKEx Group).
The survey provides key information on the relative contribution to the overall market turnover and to
each major product by the main investor types local and overseas, retail and institutional, and
Exchange Participants’ (EPs’) own trading (see classification chart below). Retail online trading
statistics in the overall derivatives market have been obtained since the 2001/02 survey. The findings
are compared with those of the past surveys to reveal any changes in trading pattern.
Classification of Exchange Participants’ derivatives trading on HKEx
The survey questionnaires were mailed to all Futures EPs (FEPs) and Stock Options EPs (SOEPs) in
the target population1. Out of the 241 questionnaires sent out, 215 completed questionnaires were
returned, representing an overall response rate of 89%. The responded sample represented 98% by
total contract volume of the target population in the products under study. (See Appendix 1.)
The survey covers transactions during July 2014 to June 20152 in the major HKEx futures and options
products, namely Hang Seng Index (HSI) futures, HSI options, Mini-HSI futures, Mini-HSI options,
H-shares Index (HHI) futures, HHI options, Mini-HHI futures and stock options. These together
contributed 99% of the total turnover volume of the HKEx derivatives market during the study period.
“Market turnover” (or “market volume”) in this report refers to the total contract volume of the
products under study.
1 The target population consists of all the EPs which conducted trading business during the study period excluding
those that ceased their operations before the start of the fieldwork. (See Appendix 4 for survey methodology.)
2 Referred to as the year 2014/15 throughout the report; the same convention is used for the past surveys.
Participants ’ derivatives trading on HKEx
Agency Principal
Individual Institutional Market maker Proprietary trading
Local Local Overseas Overseas
US UK Taiwan Mainland China Japan Rest of Europe Singapore Australia Others Rest of Asia
DERIVATIVES MARKET TRANSACTION SURVEY 2014/15 5
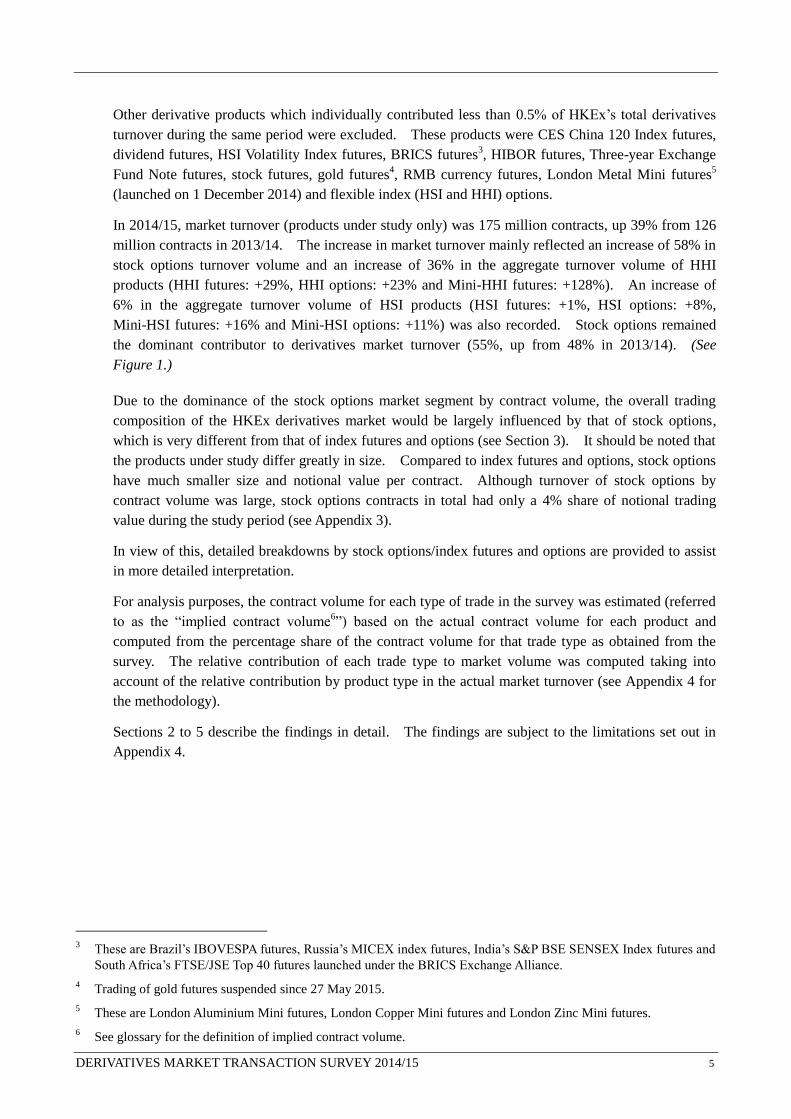
Other derivative products which individually contributed less than 0.5% of HKEx’s total derivatives
turnover during the same period were excluded. These products were CES China 120 Index futures,
dividend futures, HSI Volatility Index futures, BRICS futures3, HIBOR futures, Three-year Exchange
Fund Note futures, stock futures, gold futures4, RMB currency futures, London Metal Mini futures
5
(launched on 1 December 2014) and flexible index (HSI and HHI) options.
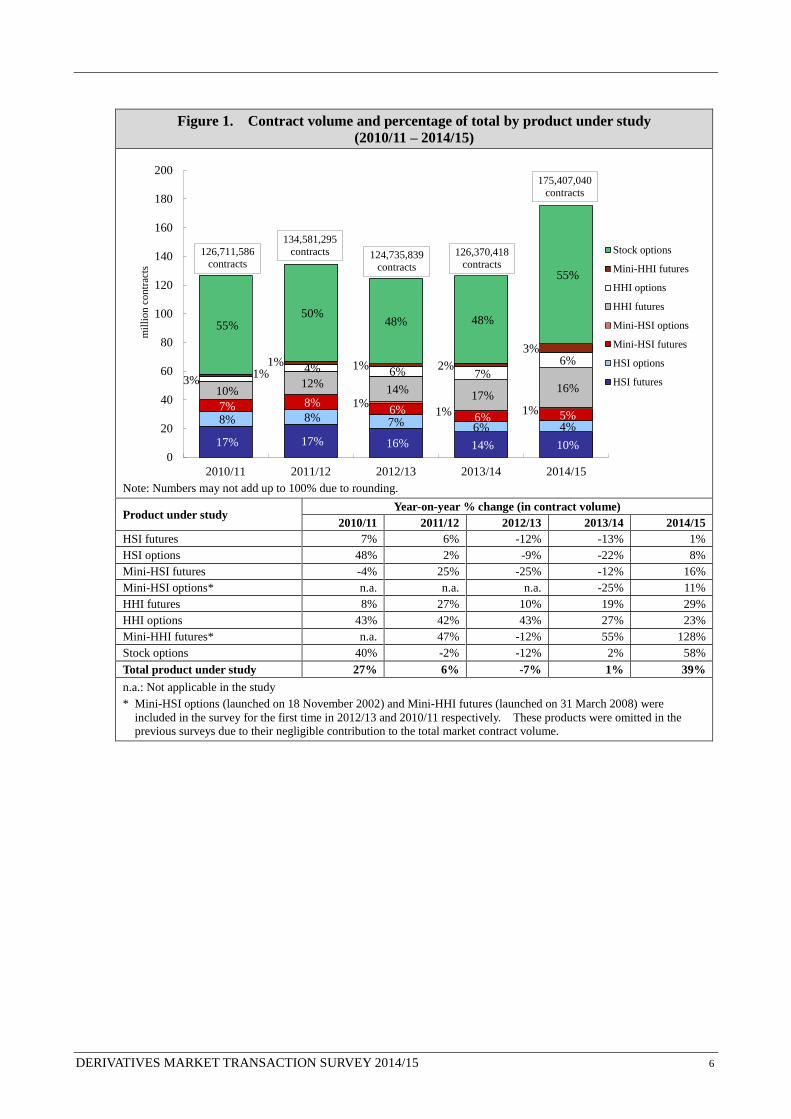
In 2014/15, market turnover (products under study only) was 175 million contracts, up 39% from 126
million contracts in 2013/14. The increase in market turnover mainly reflected an increase of 58% in
stock options turnover volume and an increase of 36% in the aggregate turnover volume of HHI
products (HHI futures: +29%, HHI options: +23% and Mini-HHI futures: +128%). An increase of
6% in the aggregate turnover volume of HSI products (HSI futures: +1%, HSI options: +8%,
Mini-HSI futures: +16% and Mini-HSI options: +11%) was also recorded. Stock options remained
the dominant contributor to derivatives market turnover (55%, up from 48% in 2013/14). (See
Figure 1.)
Due to the dominance of the stock options market segment by contract volume, the overall trading
composition of the HKEx derivatives market would be largely influenced by that of stock options,
which is very different from that of index futures and options (see Section 3). It should be noted that
the products under study differ greatly in size. Compared to index futures and options, stock options
have much smaller size and notional value per contract. Although turnover of stock options by
contract volume was large, stock options contracts in total had only a 4% share of notional trading
value during the study period (see Appendix 3).
In view of this, detailed breakdowns by stock options/index futures and options are provided to assist
in more detailed interpretation.
For analysis purposes, the contract volume for each type of trade in the survey was estimated (referred
to as the “implied contract volume6”) based on the actual contract volume for each product and
computed from the percentage share of the contract volume for that trade type as obtained from the
survey. The relative contribution of each trade type to market volume was computed taking into
account of the relative contribution by product type in the actual market turnover (see Appendix 4 for
the methodology).
Sections 2 to 5 describe the findings in detail. The findings are subject to the limitations set out in
Appendix 4.
3 These are Brazil’s IBOVESPA futures, Russia’s MICEX index futures, India’s S&P BSE SENSEX Index futures and
South Africa’s FTSE/JSE Top 40 futures launched under the BRICS Exchange Alliance.
4 Trading of gold futures suspended since 27 May 2015.
5 These are London Aluminium Mini futures, London Copper Mini futures and London Zinc Mini futures.
6 See glossary for the definition of implied contract volume.
DERIVATIVES MARKET TRANSACTION SURVEY 2014/15 6
Figure 1. Contract volume and percentage of total by product under study
(2010/11 – 2014/15)
Note: Numbers may not add up to 100% due to rounding.
Product under study Year-on-year % change (in contract volume)
2010/11 2011/12 2012/13 2013/14 2014/15
HSI futures 7% 6% -12% -13% 1%
HSI options 48% 2% -9% -22% 8%
Mini-HSI futures -4% 25% -25% -12% 16%
Mini-HSI options* n.a. n.a. n.a. -25% 11%
HHI futures 8% 27% 10% 19% 29%
HHI options 43% 42% 43% 27% 23%
Mini-HHI futures* n.a. 47% -12% 55% 128%
Stock options 40% -2% -12% 2% 58%
Total product under study 27% 6% -7% 1% 39%
n.a.: Not applicable in the study
* Mini-HSI options (launched on 18 November 2002) and Mini-HHI futures (launched on 31 March 2008) were
included in the survey for the first time in 2012/13 and 2010/11 respectively. These products were omitted in the previous surveys due to their negligible contribution to the total market contract volume.
17% 17% 16% 14% 10%
8% 8% 7% 6% 4%
7% 8%6%
6% 5%1%
1% 1%
10%12%
14%17%
16%3%
4% 6% 7%6%
1% 1% 1% 2%
3%
55%50%
48% 48%
55%
0
20
40
60
80
100
120
140
160
180
200
2010/11 2011/12 2012/13 2013/14 2014/15
mil
lio
n c
on
trac
tsContract volume and percentage of total by product under current study (2010/11 - 2014/15)
Stock options
Mini-HHI futures
HHI options
HHI futures
Mini-HSI options
Mini-HSI futures
HSI options
HSI futures
126,370,418
contracts
126,711,586
contracts
134,581,295
contracts 124,735,839
contracts
175,407,040
contracts

DERIVATIVES MARKET TRANSACTION SURVEY 2014/15 7
2. TRANSACTION PURPOSES
The survey assessed the composition of derivatives trading by three purposes — pure trading, hedging
and arbitrage. However, EPs may not know their clients’ transaction purposes and would incline to
consider their client transactions as pure trading. As a result, the percentage share of pure trading as
a transaction purpose may be over-estimated. Nevertheless, the survey results would show a
reasonable indication of the market activities and the changes over time.
Trading distribution by transaction purpose
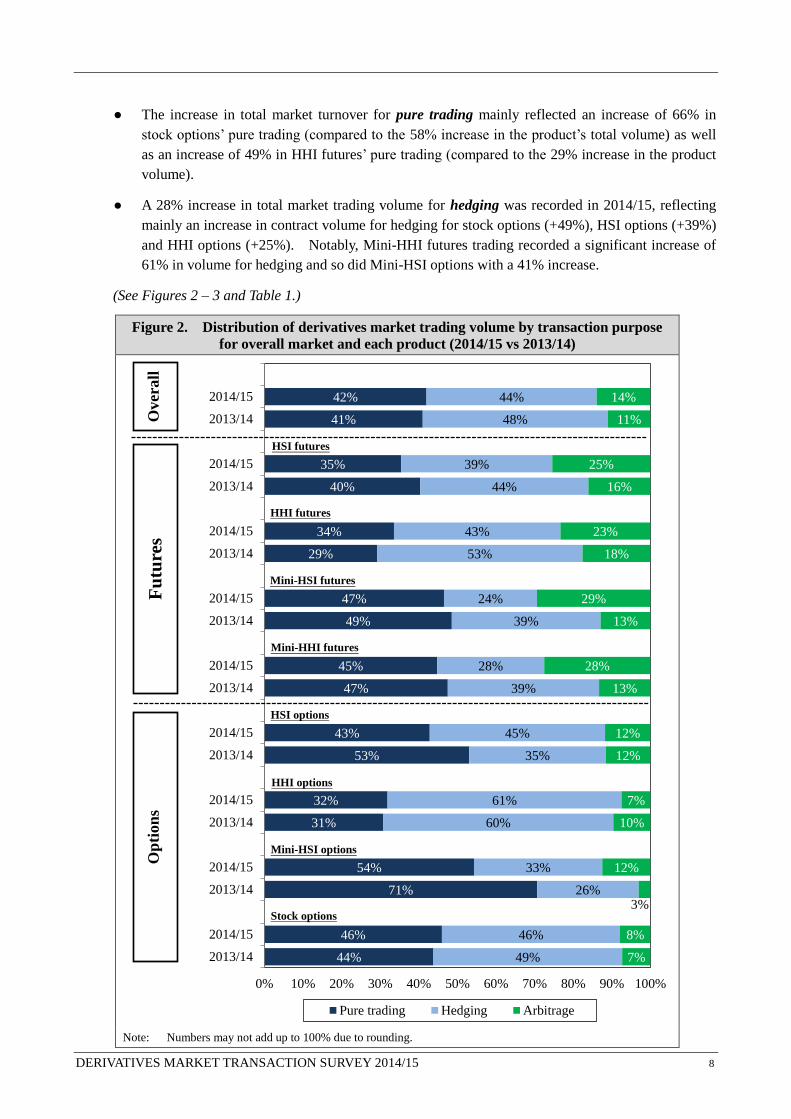
● Overall, hedging and pure trading were the two main transaction purposes of derivatives trading
in 2014/15. The proportion of turnover for hedging was 44% of the total derivatives market
turnover (down from 48% in 2013/14) and that of pure trading was 42% (similar to the 41% in
2013/14). Arbitrage turnover accounted for 14% of the overall market turnover in 2014/15, up
from 11% in 2013/14.
● In 2014/15, hedging accounted for the majority of trading in HHI options (61%, similar to the
60% in 2013/14) and a major proportion of trading in other regular options products — stock
options (46%) and HSI options (45%) — and also in HHI futures (43%) and HSI futures (39%).
In 2014/15, a decrease in the proportion of hedging across all index futures, in particular for
mini-sized contracts, was observed. On the contrary, a notable increase in the proportion of
hedging for HSI options (from 35% to 45%) was found.
● Pure trading was the main transaction purpose of trading in mini-sized contracts — Mini-HSI
options (54%), Mini-HSI futures (47%) and Mini-HHI futures (45%) — and also in stock options
(46%, in par with trading for hedging purpose) and HSI options (43%). In 2014/15, a notable
decrease in the proportion of pure trading was observed for HSI options products — Mini-HSI
options (from 71% to 54%) and HSI options (from 53% to 43%) — along with an increase in the
proportion of trading for hedging purpose.
● In 2014/15, the proportion of trading for arbitrage in each of the index futures products rose to
their respective highest level in the recent five years with a significant increase from 2013/14 —
Mini-HSI futures (from 13% to 29%), Mini-HHI futures (from 13% to 28%), HSI futures (from
16% to 25%) and HHI futures (from 18% to 23%)7. For index futures as a whole, the proportion
of trading for arbitrage rose to the highest level in the past decade (25%) while that of pure
trading remained at the lowest level in the past decade (37%). For options products, the
proportion of arbitrage remained relatively low in 2014/15, ranging from 7% to 12% for each
product and 8% for all options products.
Implied contract volume by transaction purpose
● Overall market turnover in volume terms for each transaction purpose had positive year-on-year
growth in 2014/15, in particular for arbitrage (up 75%, compared to the increase of 39% in
overall derivatives trading). In fact, an increase in the contract volume for arbitrage was
observed for each of the products under study except HHI options (-4%) — Mini-HHI futures
(+373% from a small base), Mini-HSI options (+355% from a small base), Mini-HSI futures
(+165% from a small base), HHI futures (+71%), stock options (+70%), HSI futures (+59%) and
HSI options (+10%).
7 This owed largely to the trading of the top two FEPs by total contract volume (with an aggregate contribution of
19% in the total index derivatives market turnover) who reported a large percentage of transactions being done for
arbitrage.
DERIVATIVES MARKET TRANSACTION SURVEY 2014/15 8
● The increase in total market turnover for pure trading mainly reflected an increase of 66% in
stock options’ pure trading (compared to the 58% increase in the product’s total volume) as well
as an increase of 49% in HHI futures’ pure trading (compared to the 29% increase in the product
volume).
● A 28% increase in total market trading volume for hedging was recorded in 2014/15, reflecting
mainly an increase in contract volume for hedging for stock options (+49%), HSI options (+39%)
and HHI options (+25%). Notably, Mini-HHI futures trading recorded a significant increase of
61% in volume for hedging and so did Mini-HSI options with a 41% increase.
(See Figures 2 – 3 and Table 1.)
Figure 2. Distribution of derivatives market trading volume by transaction purpose
for overall market and each product (2014/15 vs 2013/14)
Note: Numbers may not add up to 100% due to rounding.
44%
46%
71%
54%
31%
32%
53%
43%
47%
45%
49%
47%
29%
34%
40%
35%
41%
42%
49%
46%
26%
33%
60%
61%
35%
45%
39%
28%
39%
24%
53%
43%
44%
39%
48%
44%
7%
8%
3%
12%
10%
7%
12%
12%
13%
28%
13%
29%
18%
23%
16%
25%
11%
14%
0% 10% 20% 30% 40% 50% 60% 70% 80% 90% 100%
2013/14
2014/15
2013/14
2014/15
2013/14
2014/15
2013/14
2014/15
2013/14
2014/15
2013/14
2014/15
2013/14
2014/15
2013/14
2014/15
2013/14
2014/15
Distribution of trading by transaction purpose (2014/15 vs 2013/14)
Pure trading Hedging Arbitrage
HSI futures
HHI futures
Mini-HSI options
HSI options
HHI options
Stock options
Mini-HHI futures
Mini-HSI futures
Over
all
F
utu
res
Op
tion
s

DERIVATIVES MARKET TRANSACTION SURVEY 2014/15 9
Figure 3. Distribution of derivatives market trading volume by transaction purpose
(2005/06 – 2014/15)
(a) Overall market
(b) All futures products
(c) All options products
Note: Numbers may not add up to 100% due to rounding.
49% 49%
40% 42%
39%
44%
42%
45%
41% 42%32%31% 39%
41%
45%
42%
46%
45%
48%44%
19%21% 21%
17% 16% 14%12%
10% 11%14%
0%
10%
20%
30%
40%
50%
60%
70%
2005/06 2006/07 2007/08 2008/09 2009/10 2010/11 2011/12 2012/13 2013/14 2014/15
Distribution of derivatives market trading by trading purpose (2005/06 - 2014/15)
Pure trading Hedging Arbitrage
Note: Numbers may not add up to 100% due to rounding.
56%52%
57% 56%52%
60%
43%
42%
37% 37%29% 30% 30%32%
34%
29%39%
44%47%
38%
15%18%
13% 13% 13%11%
17%14%
16%
25%
0%
10%
20%
30%
40%
50%
60%
70%
2005/06 2006/07 2007/08 2008/09 2009/10 2010/11 2011/12 2012/13 2013/14 2014/15
Distribution of futures trading by trading purpose (2005/06 - 2014/15)
Pure trading Hedging Arbitrage
Note: Numbers may not add up to 100% due to rounding.
43%46%
31% 31% 30%
35%
41%
47%
44%45%
35%31%
44%
49%53%
49% 50%
45%
49% 47%
22% 23% 26%20%
17% 16%
9% 8% 8% 8%
0%
10%
20%
30%
40%
50%
60%
70%
2005/06 2006/07 2007/08 2008/09 2009/10 2010/11 2011/12 2012/13 2013/14 2014/15
Distribution of options trading by trading purpose (2005/06 - 2014/15)
Pure trading Hedging Arbitrage
Note: Numbers may not add up to 100% due to rounding.
49% 49%
40% 42%
39%
44%
42%
45%
41% 42%32% 31%39%
41%
45%
42%
46%
45%
48%44%
19%21% 21%
17% 16% 14%12% 10% 11%
14%
0%
10%
20%
30%
40%
50%
60%
70%
2005/06 2006/07 2007/08 2008/09 2009/10 2010/11 2011/12 2012/13 2013/14 2014/15
Distribution of derivatives market trading by trading purpose (2005/06 - 2014/15)
Pure trading Hedging Arbitrage
Note: Numbers may not add up to 100% due to rounding.

DERIVATIVES MARKET TRANSACTION SURVEY 2014/15 10
Table 1. Distribution of derivatives market trading volume by transaction purpose
for overall market and each product (2010/11 – 2014/15)
n.a.: Not available
Notes:
(1) Numbers may not add up to 100% due to rounding.
(2) See glossary for the definition of implied contract volume. The total figure of each product used is the actual
contract volume for that product, based on which the implied contract volume by trading purpose is computed.
(3) Mini-HHI futures (launched on 31 March 2008) and Mini-HSI options (launched on 18 November 2002) were
included in the survey for the first time in 2010/11 and 2012/13 respectively. These products were omitted in the previous surveys due to their negligible contribution to the total market contract volume.
(4) Actual total contract volume of all products under study during the study period.
Percentage contribution (1)
2010/11 2011/12 2012/13 2013/14 2014/15 No. of contracts Y-o-Y change
Pure trading 60.4 44.2 45.6 40.4 35.4 6,245,190 -11.6%
Hedging 26.8 38.4 40.5 43.6 39.1 6,895,623 -9.6%
Arbitrage 12.8 17.5 13.9 16.1 25.4 4,482,474 59.5%
Total 100.0 100.0 100.0 100.0 100.0 17,623,288 0.7%
Pure trading 50.8 32.3 30.6 29.2 33.6 9,262,435 48.6%
Hedging 37.1 48.5 53.3 53.2 43.1 11,894,718 4.5%
Arbitrage 12.2 19.2 16.0 17.6 23.3 6,431,574 71.3%
Total 100.0 100.0 100.0 100.0 100.0 27,588,727 29.1%
Pure trading 71.6 57.8 55.7 48.5 46.5 3,789,445 11.6%
Hedging 20.5 27.5 34.5 38.5 24.1 1,962,252 -27.2%
Arbitrage 7.8 14.7 9.8 12.9 29.4 2,393,977 164.9%
Total 100.0 100.0 100.0 100.0 100.0 8,145,674 16.4%
Pure trading 63.6 46.9 55.3 47.5 44.7 2,686,177 115.0%
Hedging 31.2 38.5 40.6 39.2 27.7 1,664,821 61.4%
Arbitrage 5.2 14.6 4.0 13.3 27.5 1,651,856 372.9%
Total 100.0 100.0 100.0 100.0 100.0 6,002,854 128.2%
Pure trading 39.6 41.1 53.6 53.1 42.8 3,353,499 -12.5%
Hedging 38.6 46.9 35.6 35.4 45.4 3,555,672 39.2%
Arbitrage 21.8 12.0 10.8 11.6 11.8 920,711 10.2%
Total 100.0 100.0 100.0 100.0 100.0 7,829,881 8.4%
Pure trading 23.6 23.7 30.5 30.7 31.9 3,459,109 27.9%
Hedging 60.1 68.4 60.9 59.7 60.6 6,576,532 25.3%
Arbitrage 16.3 7.9 8.5 9.6 7.5 811,779 -3.8%
Total 100.0 100.0 100.0 100.0 100.0 10,847,420 23.3%
Pure trading n.a. n.a. 73.2 70.7 54.3 583,041 -14.3%
Hedging n.a. n.a. 24.7 26.3 33.2 356,959 41.0%
Arbitrage n.a. n.a. 2.1 3.1 12.5 133,771 355.4%
Total n.a. n.a. 100.0 100.0 100.0 1,073,771 11.5%
Pure trading 54.2 41.6 43.1 38.4 37.1 29,378,895 16.8%
Hedging 32.3 42.6 44.5 47.0 41.6 32,906,578 6.9%
Arbitrage 13.5 15.8 12.5 14.6 21.3 16,826,142 76.6%
Total 100.0 100.0 100.0 100.0 100.0 79,111,615 20.8%
Pure trading 35.0 42.4 46.9 43.8 46.0 44,288,969 66.1%
Hedging 50.0 49.1 44.9 48.9 46.1 44,424,933 49.2%
Arbitrage 15.0 8.6 8.2 7.3 7.9 7,581,523 70.2%
Total 100.0 100.0 100.0 100.0 100.0 96,295,425 58.1%
Pure trading 59.9 43.3 42.0 37.0 37.0 21,983,246 22.5%
Hedging 28.7 39.3 44.3 46.9 37.8 22,417,415 -1.4%
Arbitrage 11.4 17.3 13.7 16.1 25.2 14,959,881 91.3%
Total 100.0 100.0 100.0 100.0 100.0 59,360,543 22.4%
Pure trading 35.1 41.1 46.7 43.5 44.5 51,684,618 52.5%
Hedging 49.1 49.9 44.9 48.6 47.3 54,914,096 45.2%
Arbitrage 15.9 8.9 8.4 7.9 8.1 9,447,784 53.3%
Total 100.0 100.0 100.0 100.0 100.0 116,046,497 49.0%
Pure trading 43.7 42.0 44.9 41.0 42.0 73,667,864 42.1%
Hedging 42.0 45.9 44.7 47.9 44.1 77,331,511 27.7%
Arbitrage 14.3 12.2 10.4 11.1 13.9 24,407,665 74.5%
Total 100.0 100.0 100.0 100.0 100.0 175,407,040 38.8%
126,711,586 134,581,295 124,735,839 126,370,418 175,407,040
All options
Product Purpose
Implied contract volume(2)
2014/15
HSI futures
HSI options
Stock options
Overall market
Total contract volume (4)
HHI futures
HHI options
Index futures &
options
Mini-HHI futures (3)
Mini-HSI futures
Mini-HSI options (3)
All futures
DERIVATIVES MARKET TRANSACTION SURVEY 2014/15 11
3. TRADING BY INVESTOR TYPE
3.1 Overall pattern
(See Figures 4 – 8.)
Trading distribution by investor type
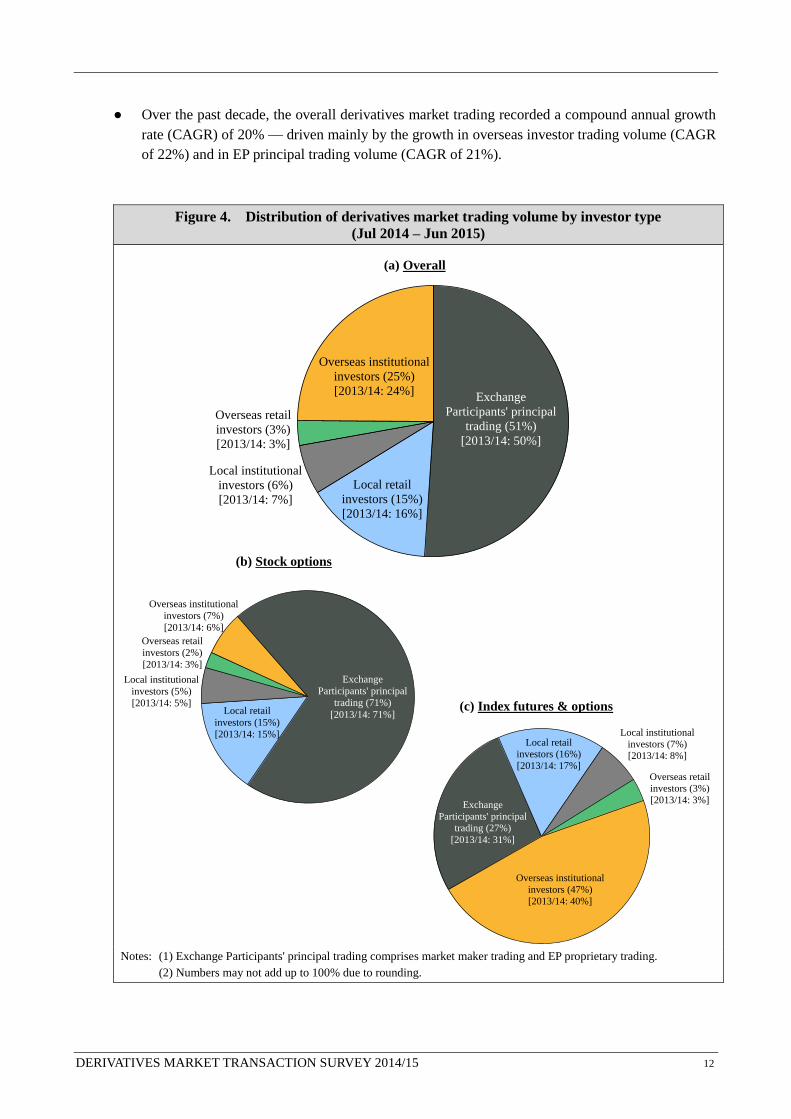
● In 2014/15, turnover in HKEx’s derivatives market was shared almost equally by EP principal
trading and agency (investor) trading, more or less similar to the pattern since 2009/10. The
contribution of overseas investor trading outstripped again that of local investors, reaching its
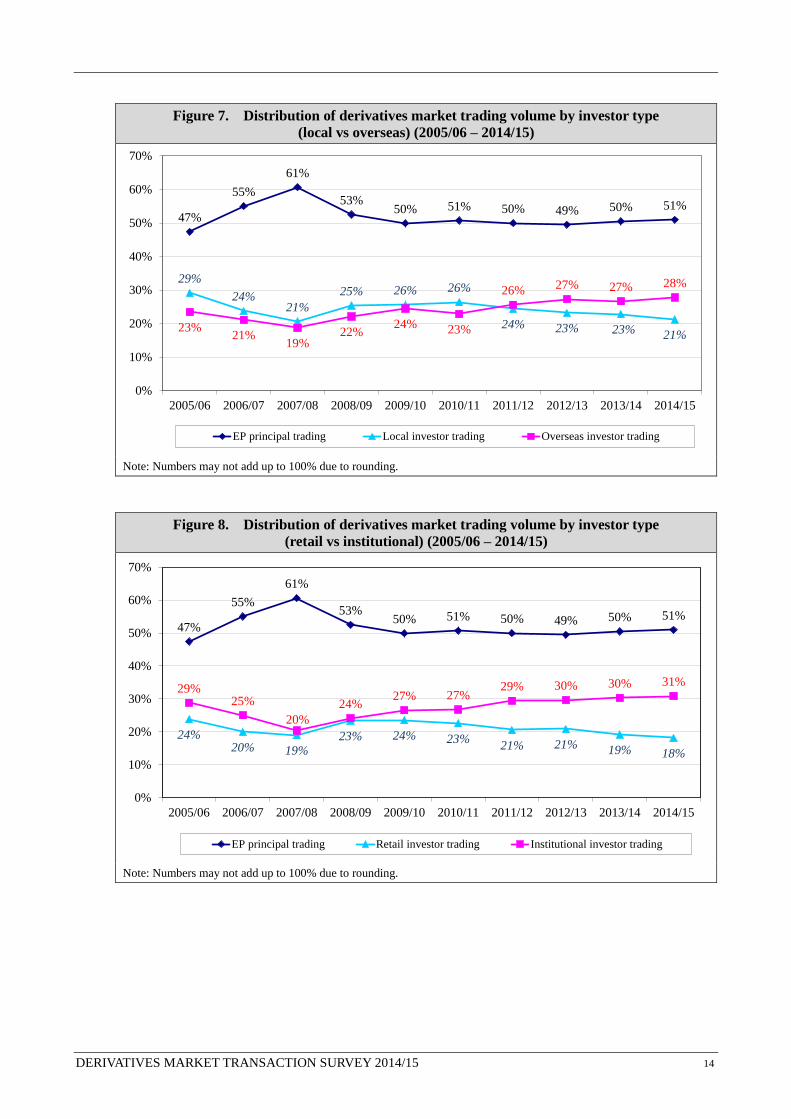
highest level in 2014/15 (28%, similar to the 27% in 2013/14). The contribution from local
investors was 21%, compared to 23% in 2013/14.
● EP principal trading accounted for 51% of total derivatives market contract volume (compared
to 50% in 2013/14) — 41% from market maker trading (up from 36% in 2013/14) and 10% from
EP proprietary trading (down from 14% in 2013/14). Over the past decade, EP principal trading
contributed 52% of cumulative market turnover.
● EP principal trading remained dominant in stock options trading (71%, the same as in 2013/14)
but contributed only 27% (down from 31% in 2013/14) in index futures and options. As in the
past few years, the majority of EP principal trading came from stock options — stock options
contributed 55% of the total market turnover but its EP principal trading contributed 76% of total
EP principal trading (68% in 2013/14) and 88% of total market making (86% in 2013/14).
● The contribution from overseas investors was 28% (25% from institutions) in 2014/15. Their
cumulative market share in the past decade was 25% (22% from institutions).
● The contribution from local investors was 21% — 15% from retail and 6% from institutions
(compared to 16% and 7% respectively in 2013/14). Over the past decade, local investors
contributed 24% of cumulative market turnover.
● The contribution from institutional investors (local and overseas) to total market turnover was
31% in 2014/15 (the highest level in the past decade), compared to 30% in 2013/14. Their
cumulative market share in the past decade was 28%.
● The contribution from retail investors (local and overseas) was 18% in 2014/15 (the lowest level
in the past decade), compared to 19% in 2013/14. Their cumulative market share in the past
decade was 21%.
Implied contract volume by investor type
● EP principal trading increased by 40% from 2013/14, reflecting largely a 57% increase in market
maker trading.
● All types of investor trading recorded a year-on-year volume growth in 2014/15, a pattern not
obtained since 2008/09.
● Overseas investor trading volume (predominantly from institutions) increased by 45% from
2013/14.
● Local investor trading volume increased by 29% from 2013/14 — 30% for retail and 26% for
institutions.
DERIVATIVES MARKET TRANSACTION SURVEY 2014/15 12
● Over the past decade, the overall derivatives market trading recorded a compound annual growth
rate (CAGR) of 20% — driven mainly by the growth in overseas investor trading volume (CAGR
of 22%) and in EP principal trading volume (CAGR of 21%).
Figure 4. Distribution of derivatives market trading volume by investor type
(Jul 2014 – Jun 2015)
Notes: (1) Exchange Participants' principal trading comprises market maker trading and EP proprietary trading.
(2) Numbers may not add up to 100% due to rounding.
Exchange
Participants' principal
trading (51%)
[2013/14: 50%]
Local retail
investors (15%)
[2013/14: 16%]
Local institutional
investors (6%)
[2013/14: 7%]
Overseas retail
investors (3%)
[2013/14: 3%]
Overseas institutional
investors (25%)
[2013/14: 24%]
Distribution of derivatives market trading by investor type (Jul 2014 - Jun 2015)
Notes: (1) Numbers may not add up to 100% due to rounding.
(2) Exchange Participants' principal trading comprised market maker trading and EP proprietary trading.
Exchange
Participants' principal
trading (71%)
[2013/14: 71%]Local retail
investors (15%)
[2013/14: 15%]
Local institutional
investors (5%)
[2013/14: 5%]
Overseas retail
investors (2%)
[2013/14: 3%]
Overseas institutional
investors (7%)
[2013/14: 6%]
Distribution of stock options trading by investor type (Jul 2014 - Jun 2015)
Notes: (1) Numbers may not add up to 100% due to rounding.
(2) Exchange Participants' principal trading comprised market maker trading and EP proprietary trading.
Exchange
Participants' principal
trading (27%)
[2013/14: 31%]
Local retail
investors (16%)
[2013/14: 17%]
Local institutional
investors (7%)
[2013/14: 8%]
Overseas retail
investors (3%)
[2013/14: 3%]
Overseas institutional
investors (47%)
[2013/14: 40%]
Distribution of index futures & options market trading by investor type (Jul 2014 - Jun 2015)
Notes: (1) Numbers may not add up to 100% due to rounding.
(2) Exchange Participants' principal trading comprised market maker trading and EP proprietary trading.
(a) Overall
(b) Stock options
(c) Index futures & options

DERIVATIVES MARKET TRANSACTION SURVEY 2014/15 13
Figure 5. Distribution of derivatives market trading volume by investor type
(2005/06 – 2014/15)
Notes: (1) Exchange Participants' principal trading comprises market maker trading and EP proprietary trading.
(2) Numbers may not add up to 100% due to rounding.
Figure 6. Implied contract volume of derivatives by investor type (2005/06 – 2014/15)
Type of trade Year-on-year % change 2005/15
CAGR 2005/06 2006/07 2007/08 2008/09 2009/10 2010/11 2011/12 2012/13 2013/14 2014/15
EP principal trading 128.14% 91.57% 105.85% -15.57% -8.30% 29.52% 4.66% -8.22% 3.40% 40.07% 20.86%
Market maker 141.11% 95.95% 128.95% -20.73% -12.30% 36.80% 4.96% -10.98% -0.002% 56.71% 22.58%
Proprietary trading 101.51% 80.79% 44.34% 6.24% 4.31% 10.22% 3.68% 0.99% 13.39% -3.00% 15.55%
Local investor trading 39.07% 34.75% 61.63% 20.05% -2.47% 31.36% -1.96% -11.81% -0.36% 29.09% 15.73%
Retail 42.66% 38.21% 76.70% 15.52% -4.12% 27.35% -7.63% -4.37% -8.22% 30.27% 15.43%
Institutional 29.95% 25.07% 15.11% 41.53% 3.91% 45.67% 15.73% -30.33% 26.50% 26.18% 16.55%
Overseas investor trading 38.84% 48.65% 65.84% 14.77% 6.96% 18.98% 19.09% -1.28% -1.06% 44.72% 22.17%
Retail 52.10% 39.87% 88.65% 56.14% 6.22% -8.93% 32.26% -14.67% 1.32% 38.41% 22.71%
Institutional 37.51% 49.63% 63.47% 9.81% 7.08% 23.70% 17.45% 0.60% -1.34% 45.49% 22.11%
Retail investor trading 43.54% 38.38% 77.89% 19.82% -2.69% 21.89% -3.14% -5.95% -6.89% 31.50% 16.33%
Institutional investor trading 35.41% 43.08% 52.19% 15.40% 6.40% 28.35% 17.04% -6.74% 3.59% 41.31% 20.81%
Total 70.56% 64.93% 86.86% -2.54% -3.45% 27.41% 6.21% -7.32% 1.31% 38.80% 19.88%
Note: Exchange Participants' principal trading comprises market maker trading and EP proprietary trading.
47%55%
61%53% 50% 51% 50% 49% 50% 51% 52%
21%18%
17%
20%20% 20% 17% 18% 16% 15% 18%
8%6%
4%5%
6% 6%7% 5% 7% 6%
6%2% 2%
2%3%
4% 3%3% 3% 3% 3%
3%
21% 19% 17% 19% 21% 20% 22% 24% 24% 25% 22%
0%
20%
40%
60%
80%
100%
2005/06 2006/07 2007/08 2008/09 2009/10 2010/11 2011/12 2012/13 2013/14 2014/15
Distribution of derivatives trading by investor type for overall market (2005/06 - 2014/15)
EP principal trading Local retail investors Local institutional investors
Overseas retail investors Overseas institutional investors
Notes: (1) Numbers may not add up to 100% due to rounding.
(2) Exchange Participants' principal trading comprised market maker trading and EP proprietary trading.
2005/15
(Cumulative)
0
20
40
60
80
100
120
140
160
180
200
2005/06 2006/07 2007/08 2008/09 2009/10 2010/11 2011/12 2012/13 2013/14 2014/15
mil
lio
n c
on
trac
ts
Implied contract volume of derivatives by investor type (2005/06 - 2014/15)
EP principal trading Local retail investors Local institutional investors
Overseas retail investors Overseas institutional investors
DERIVATIVES MARKET TRANSACTION SURVEY 2014/15 14
Figure 7. Distribution of derivatives market trading volume by investor type
(local vs overseas) (2005/06 – 2014/15)
Note: Numbers may not add up to 100% due to rounding.
Figure 8. Distribution of derivatives market trading volume by investor type
(retail vs institutional) (2005/06 – 2014/15)
Note: Numbers may not add up to 100% due to rounding.
47%
55%
61%
53%50% 51% 50% 49% 50% 51%
29%
24%21%
25% 26% 26%
24% 23% 23% 21%23%
21%19%
22%24% 23%
26% 27% 27% 28%
0%
10%
20%
30%
40%
50%
60%
70%
2005/06 2006/07 2007/08 2008/09 2009/10 2010/11 2011/12 2012/13 2013/14 2014/15
Distribution of derivatives market trading by investor type (local vs overseas) (2005/06 - 2014/15)
EP principal trading Local investor trading Overseas investor trading
Note: Numbers may not add up to 100% due to rounding.
47%
55%
61%
53%50% 51% 50% 49% 50% 51%
24%20% 19%
23% 24% 23%21% 21% 19% 18%
29%25%
20%
24%27% 27%
29% 30% 30% 31%
0%
10%
20%
30%
40%
50%
60%
70%
2005/06 2006/07 2007/08 2008/09 2009/10 2010/11 2011/12 2012/13 2013/14 2014/15
Distribution of derivatives market trading by investor type (retail vs institutional) (2005/06 - 2014/15)
EP principal trading Retail investor trading Institutional investor trading
Note: Numbers may not add up to 100% due to rounding.

DERIVATIVES MARKET TRANSACTION SURVEY 2014/15 15
3.2 Trading by product
(See Figure 9 and Tables 2 and 3.)
Trading distribution by investor type
● For HSI futures, the contribution from overseas institutional investors was the most significant
and achieved a record high for the third year in a row, 58% in 2014/15, up from the previous
records of around 50% in 2012/13 and 2013/14. The contribution from local retail investors
continued its downtrend over the past few years to 17% (compared to 19% in 2013/14). The
contribution from EP proprietary trading was 15% of the product’s turnover (down from 20% in
2013/14), the lowest level in the past five years.
● For HHI futures, overseas investors remained the major participant type. Their contribution
reached a new record of 67% in 2014/15 (up from the previous record of 61% in 2013/14),
mainly from overseas institutional investors (63%). The contribution from EP proprietary
trading was 17% (down from 25% in 2013/14) and was the lowest in the past five years. Local
investors’ contribution was 16% (9% from retail; 7% from institutions), compared to 15% in
2013/14.
● For Mini-HSI futures, overseas institutional investors for the first time became equally important
as local retail investors — 37% of the product’s turnover for each in 2014/15. Notably, the
contribution from overseas institutional investors rose from 21% in 2013/14 while that from local
retail investors further decreased from 41% in 2013/14. The contribution from EP proprietary
trading was 18% in 2014/15 (down from 29% in 2013/14), the lowest level in the past five years.
● For Mini-HHI futures, the contribution of overseas investors surpassed that from local investors
in 2014/15, similar to the pattern of Mini-HSI futures. For the first time, overseas institutional
investors became the major participant type, contributing 39% of the product’s turnover (up from
15% in 2013/14). The contribution from local retail investors was also significant (33%, down
from 41% in 2013/14). The contribution from EP proprietary trading was 19% in 2014/15
(down from 35% in 2013/14), the lowest level in the past five years.
● For HSI options, EP principal trading remained the major participant type, contributing 61% of
the product’s turnover in 2014/15 (up from 56% in 2013/14) — 58% from market maker trading
(up from 51% in 2013/14) and 3% from proprietary trading (down from 6% in 2013/14). Local
investors’ contribution was 24%, down from 32% in 2013/14 (driven totally by the decline in
local retail investors’ contribution from 26% to 18%).
● For HHI options, EP principal trading was the major contributor with 51% of the product’s
turnover in 2014/15 (compared to 49% in 2013/14) — 31% from market maker trading (up from
23% in 2013/14) and 20% from proprietary trading (down from 25% in 2013/14). The
contribution from overseas institutional investors was also significant (29%, compared to 28% in
2013/14).
● For Mini-HSI options, EP principal trading remained the dominant contributor with 68% of the
product’s turnover in 2014/15 (compared to 56% in 2013/14) — almost all came from market
maker trading (68%, up from 55% in 2013/14) and less than 1% from proprietary trading (1% in
2013/14). The contribution from local retail investors was also large — 27% in 2014/15 (down
from 38% in 2013/14).

DERIVATIVES MARKET TRANSACTION SURVEY 2014/15 16
● For stock options, EP principal trading remained the major contributor with 71% of the product’s
turnover in 2014/15 (the same as in 2013/14) — 66% from market maker trading (compared to
65% in 2013/14) and 5% from proprietary trading (6% in 2013/14). Local investors’
contribution was 20% — 15% from retail and 5% from institutions (the same as in 2013/14).
Overseas investors contributed 9% of the product’s turnover, mainly from institutions (7%).
● While overseas institutional investors were dominant contributors to trading in index futures, EP
principal trading (mainly market making) dominated in options trading, whether index or stock
options. Continuous growth in overseas institutional investor contribution to index futures
trading was observed in the past few years (from 41% in 2011/12 to 56% in 2014/15) and
accounted for more than half of the trading for the first time in 2014/15 while local retail investor
contribution to index futures had a declining trend from 26% in 2010/11 to 18% in 2014/15.
Implied contract volume by investor type
● For HSI futures, overseas institutional investor trading volume experienced a year-on-year
increase of 16%, and was the only contributor to the 0.7% increase in the product’s volume. All
other trade types experienced a decrease — in particular -21% for EP proprietary trading and
-10% for local retail investor volume.
● For HHI futures, all types of investor trading experienced year-on-year increases while EP
proprietary trading decreased by 9%. Notably, overseas and local investor trading volumes
increased by 42% and 39% respectively, compared to a 29% increase in the product’s volume.
● For Mini-HSI futures, overseas institutional investor trading volume recorded a remarkable,
year-on-year increase of 104% while EP proprietary trading decreased by 27%, compared to a
16% increase in product’s volume. During the period, local investor trading volume increased
by 6%.
● For Mini-HHI futures, all types of trading experienced year-on-year increases. A notable
increase was observed for overseas institutional investor trading volume (+499%), compared to
an increase of 128% in the product’s volume.
● For HSI options, EP principal trading experienced a year-on-year increase of 19% — +25% for
market maker trading but -37% for EP proprietary trading. This compared to an increase of 8%
in the product’s volume. Local investor trading volume decreased by 19% but overseas investor
trading increased by 37% (+45% for overseas institutional investor trading).
● For HHI options, EP principal trading increased by 29% (driven by market making) and overseas
institutional investor trading increased by 33%, compared to an increase of 23% in the product’s
volume.
● For Mini-HSI options, EP principal trading recorded a year-on-year increase of 34% while local
retail investor trading volume decreased by 21%. This compared to an increase of 11% in the
product’s volume.
● For stock options, all types of trading experienced year-on-year increases. The increase in EP
principal trading and local investor trading volume, the two key contributors, was 58% and 57%
respectively, compared to an increase of 58% in the product’s volume.

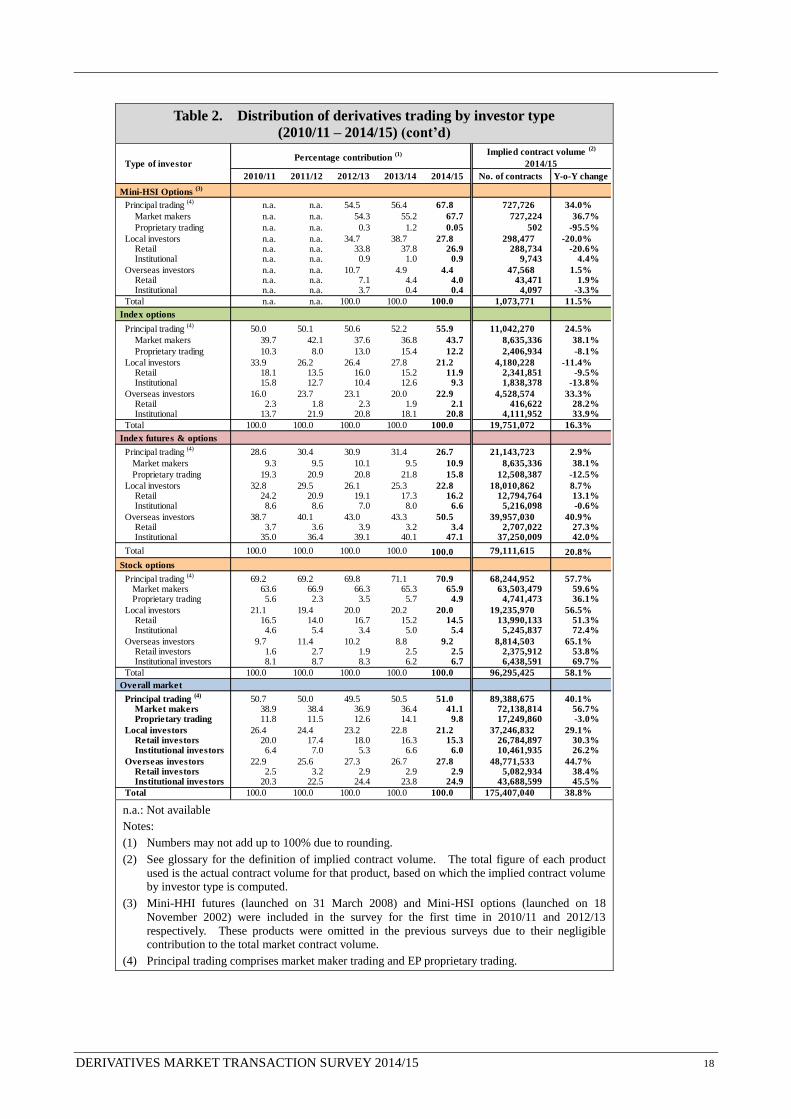
DERIVATIVES MARKET TRANSACTION SURVEY 2014/15 17
Table 2. Distribution of derivatives trading by investor type
(2010/11 – 2011/15)
Percentage contribution (1)
2010/11 2011/12 2012/13 2013/14 2014/15
HSI Futures
EP Proprietary trading 21.0 22.3 19.7 19.6 15.4 2,710,877 -21.1%
Local investors 32.0 29.8 26.9 26.0 23.2 4,093,029 -10.1% Retail 25.0 21.8 20.5 19.2 17.1 3,012,752 -10.4% Institutional 7.0 8.0 6.4 6.8 6.1 1,080,277 -9.3%
Overseas investors 47.1 47.9 53.4 54.3 61.4 10,819,382 13.8% Retail 3.7 3.8 4.8 3.7 3.0 527,051 -18.7% Institutional 43.4 44.1 48.5 50.6 58.4 10,292,330 16.1%
Total 100.0 100.0 100.0 100.0 100.0 17,623,288 0.7%
HHI Futures
EP Proprietary trading 23.2 25.9 26.3 24.7 17.4 4,796,613 -9.1%
Local investors 17.2 15.7 14.1 14.6 15.7 4,333,375 38.6% Retail 9.9 7.3 6.9 6.8 8.8 2,421,437 66.2% Institutional 7.3 8.3 7.2 7.8 6.9 1,911,938 14.5%
Overseas investors 59.6 58.5 59.5 60.7 66.9 18,458,738 42.4% Retail 2.2 2.1 1.7 2.5 3.5 971,289 81.7% Institutional 57.4 56.4 57.8 58.2 63.4 17,487,449 40.7%
Total 100.0 100.0 100.0 100.0 100.0 27,588,727 29.1%
Mini-HSI Futures
EP Proprietary trading 21.6 24.8 25.0 29.1 18.2 1,482,898 -27.2%
Local investors 53.3 52.3 45.5 43.4 39.9 3,252,798 7.1% Retail 49.0 46.8 43.7 40.6 37.0 3,011,544 6.1% Institutional 4.2 5.5 1.8 2.8 3.0 241,254 21.5%
Overseas investors 25.1 22.9 29.5 27.5 41.9 3,409,978 77.5% Retail 7.5 7.5 8.7 6.2 4.6 376,935 -13.1% Institutional 17.6 15.4 20.8 21.3 37.2 3,033,043 103.9%
Total 100.0 100.0 100.0 100.0 100.0 8,145,674 16.4%
Mini-HHI Futures (3)
EP Proprietary trading 31.4 41.8 37.2 35.3 18.5 1,111,064 19.6%
Local investors 54.5 43.8 49.7 42.9 35.8 2,151,432 90.8% Retail 53.1 40.2 48.8 40.6 33.4 2,007,180 87.8% Institutional 1.4 3.6 0.9 2.2 2.4 144,252 145.8%
Overseas investors 14.2 14.5 13.1 21.8 45.7 2,740,358 377.7% Retail 8.1 7.7 8.3 7.1 6.9 415,124 123.8% Institutional 6.1 6.8 4.7 14.8 38.7 2,325,234 499.0%
Total 100.0 100.0 100.0 100.0 100.0 6,002,854 128.2%
Index futures
EP Proprietary trading 22.0 24.6 23.7 24.1 17.0 10,101,453 -13.5%
Local investors 32.4 30.5 26.0 24.4 23.3 13,830,634 16.8% Retail 26.0 23.0 20.3 18.0 17.6 10,452,913 19.8% Institutional 6.4 7.4 5.7 6.4 5.7 3,377,721 8.4%
Overseas investors 45.5 44.9 50.3 51.5 59.7 35,428,456 41.9% Retail 4.1 4.2 4.4 3.7 3.9 2,290,400 27.1% Institutional 41.4 40.7 45.8 47.8 55.8 33,138,057 43.1%
Total 100.0 100.0 100.0 100.0 100.0 59,360,543 22.4%
HSI Options
Principal trading (4)
51.8 51.4 49.5 56.1 61.4 4,809,009 18.7%
Market makers 43.6 46.1 41.6 50.6 58.2 4,555,302 24.8%
Proprietary trading 8.3 5.3 7.9 5.6 3.2 253,707 -36.7%
Local investors 35.0 28.3 30.1 32.5 24.2 1,893,722 -19.2% Retail 22.7 18.7 22.7 26.3 18.0 1,407,644 -25.9% Institutional 12.3 9.7 7.4 6.2 6.2 486,078 9.4%
Overseas investors 13.2 20.3 20.4 11.4 14.4 1,127,150 36.6% Retail 2.7 2.4 2.7 2.7 2.8 216,803 10.2% Institutional 10.5 17.8 17.7 8.7 11.6 910,347 44.9%
Total 100.0 100.0 100.0 100.0 100.0 7,829,881 8.4%
HHI Options
Principal trading (4)
44.8 47.2 51.2 48.6 50.8 5,505,535 28.8%
Market makers 28.5 33.4 29.0 23.5 30.9 3,352,810 62.2%
Proprietary trading 16.3 13.8 22.2 25.1 19.8 2,152,725 -2.4%
Local investors 30.9 21.9 19.8 22.7 18.3 1,988,029 -0.7% Retail 4.7 2.7 3.7 3.7 6.0 645,473 99.4% Institutional 26.2 19.2 16.1 19.1 12.4 1,342,556 -20.0%
Overseas investors 24.3 30.9 28.9 28.7 30.9 3,353,856 32.8% Retail 1.0 0.4 0.7 1.0 1.4 156,348 82.5% Institutional 23.3 30.5 28.2 27.7 29.5 3,197,508 31.1%
Total 100.0 100.0 100.0 100.0 100.0 10,847,420 23.3%
Type of investor
Implied contract volume (2)
2014/15
No. of contracts Y-o-Y change
(to be continued on next page)
DERIVATIVES MARKET TRANSACTION SURVEY 2014/15 18
Table 2. Distribution of derivatives trading by investor type
(2010/11 – 2014/15) (cont’d)
n.a.: Not available
Notes:
(1) Numbers may not add up to 100% due to rounding.
(2) See glossary for the definition of implied contract volume. The total figure of each product
used is the actual contract volume for that product, based on which the implied contract volume by investor type is computed.
(3) Mini-HHI futures (launched on 31 March 2008) and Mini-HSI options (launched on 18
November 2002) were included in the survey for the first time in 2010/11 and 2012/13
respectively. These products were omitted in the previous surveys due to their negligible contribution to the total market contract volume.
(4) Principal trading comprises market maker trading and EP proprietary trading.
Percentage contribution (1)
2010/11 2011/12 2012/13 2013/14 2014/15
Mini-HSI Options (3)
Principal trading (4)
n.a. n.a. 54.5 56.4 67.8 727,726 34.0%
Market makers n.a. n.a. 54.3 55.2 67.7 727,224 36.7%
Proprietary trading n.a. n.a. 0.3 1.2 0.05 502 -95.5%
Local investors n.a. n.a. 34.7 38.7 27.8 298,477 -20.0% Retail n.a. n.a. 33.8 37.8 26.9 288,734 -20.6% Institutional n.a. n.a. 0.9 1.0 0.9 9,743 4.4%
Overseas investors n.a. n.a. 10.7 4.9 4.4 47,568 1.5% Retail n.a. n.a. 7.1 4.4 4.0 43,471 1.9% Institutional n.a. n.a. 3.7 0.4 0.4 4,097 -3.3%
Total n.a. n.a. 100.0 100.0 100.0 1,073,771 11.5%
Index options
Principal trading (4)
50.0 50.1 50.6 52.2 55.9 11,042,270 24.5%
Market makers 39.7 42.1 37.6 36.8 43.7 8,635,336 38.1%
Proprietary trading 10.3 8.0 13.0 15.4 12.2 2,406,934 -8.1%
Local investors 33.9 26.2 26.4 27.8 21.2 4,180,228 -11.4% Retail 18.1 13.5 16.0 15.2 11.9 2,341,851 -9.5% Institutional 15.8 12.7 10.4 12.6 9.3 1,838,378 -13.8%
Overseas investors 16.0 23.7 23.1 20.0 22.9 4,528,574 33.3% Retail 2.3 1.8 2.3 1.9 2.1 416,622 28.2% Institutional 13.7 21.9 20.8 18.1 20.8 4,111,952 33.9%
Total 100.0 100.0 100.0 100.0 100.0 19,751,072 16.3%
Index futures & options
Principal trading (4)
28.6 30.4 30.9 31.4 26.7 21,143,723 2.9%
Market makers 9.3 9.5 10.1 9.5 10.9 8,635,336 38.1%
Proprietary trading 19.3 20.9 20.8 21.8 15.8 12,508,387 -12.5%
Local investors 32.8 29.5 26.1 25.3 22.8 18,010,862 8.7% Retail 24.2 20.9 19.1 17.3 16.2 12,794,764 13.1% Institutional 8.6 8.6 7.0 8.0 6.6 5,216,098 -0.6%
Overseas investors 38.7 40.1 43.0 43.3 50.5 39,957,030 40.9% Retail 3.7 3.6 3.9 3.2 3.4 2,707,022 27.3% Institutional 35.0 36.4 39.1 40.1 47.1 37,250,009 42.0%
Total 100.0 100.0 100.0 100.0 100.0 79,111,615 20.8%
Stock options
Principal trading (4)
69.2 69.2 69.8 71.1 70.9 68,244,952 57.7% Market makers 63.6 66.9 66.3 65.3 65.9 63,503,479 59.6% Proprietary trading 5.6 2.3 3.5 5.7 4.9 4,741,473 36.1%
Local investors 21.1 19.4 20.0 20.2 20.0 19,235,970 56.5% Retail 16.5 14.0 16.7 15.2 14.5 13,990,133 51.3% Institutional 4.6 5.4 3.4 5.0 5.4 5,245,837 72.4%
Overseas investors 9.7 11.4 10.2 8.8 9.2 8,814,503 65.1% Retail investors 1.6 2.7 1.9 2.5 2.5 2,375,912 53.8% Institutional investors 8.1 8.7 8.3 6.2 6.7 6,438,591 69.7%
Total 100.0 100.0 100.0 100.0 100.0 96,295,425 58.1%
Overall market
Principal trading (4)
50.7 50.0 49.5 50.5 51.0 89,388,675 40.1% Market makers 38.9 38.4 36.9 36.4 41.1 72,138,814 56.7% Proprietary trading 11.8 11.5 12.6 14.1 9.8 17,249,860 -3.0%
Local investors 26.4 24.4 23.2 22.8 21.2 37,246,832 29.1% Retail investors 20.0 17.4 18.0 16.3 15.3 26,784,897 30.3% Institutional investors 6.4 7.0 5.3 6.6 6.0 10,461,935 26.2%
Overseas investors 22.9 25.6 27.3 26.7 27.8 48,771,533 44.7% Retail investors 2.5 3.2 2.9 2.9 2.9 5,082,934 38.4% Institutional investors 20.3 22.5 24.4 23.8 24.9 43,688,599 45.5%
Total 100.0 100.0 100.0 100.0 100.0 175,407,040 38.8%
Type of investor
Implied contract volume (2)
2014/15
No. of contracts Y-o-Y change
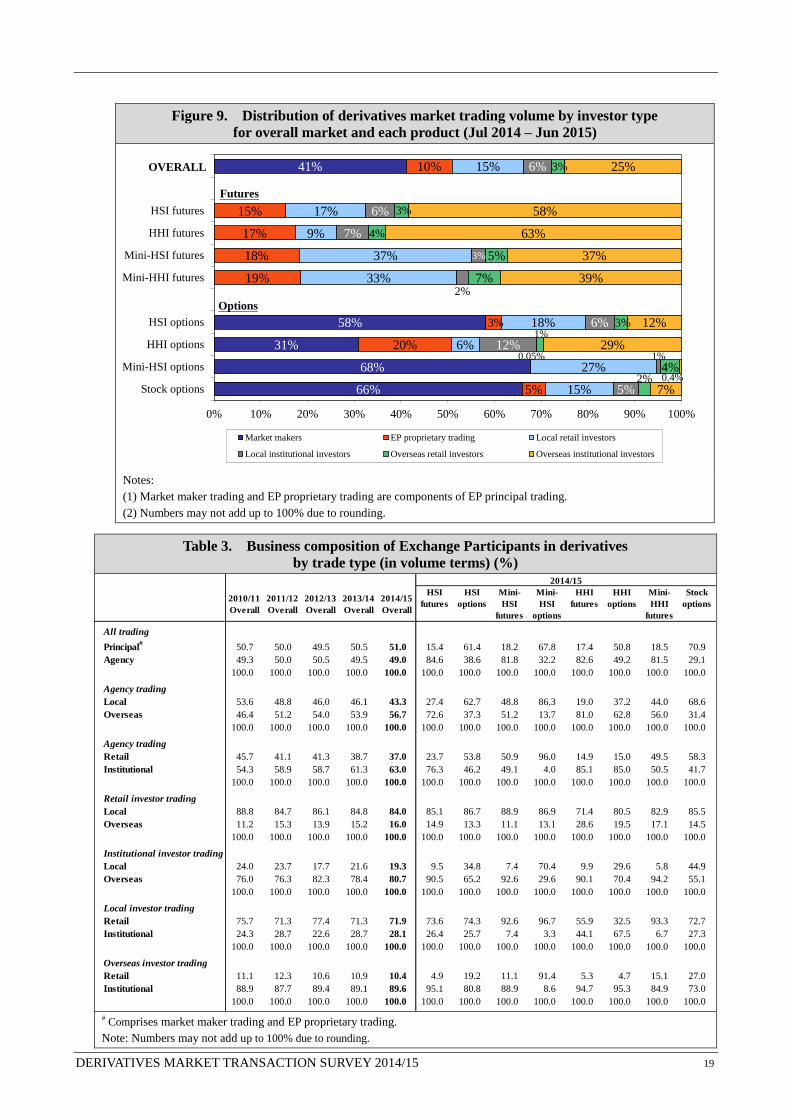
DERIVATIVES MARKET TRANSACTION SURVEY 2014/15 19
Figure 9. Distribution of derivatives market trading volume by investor type
for overall market and each product (Jul 2014 – Jun 2015)
Notes:
(1) Market maker trading and EP proprietary trading are components of EP principal trading.
(2) Numbers may not add up to 100% due to rounding.
Table 3. Business composition of Exchange Participants in derivatives
by trade type (in volume terms) (%)
# Comprises market maker trading and EP proprietary trading.
Note: Numbers may not add up to 100% due to rounding.
66%
68%
31%
58%
41%
5%
0.05%20%
3%
19%
18%
17%
15%
10%
15%
27%
6%
18%
33%
37%
9%
17%
15%
5%
1%12%
6%
2%
3%
7%
6%
6%
2%4%
1%3%
7%
5%
4%
3%
3%
7%0.4%
29%
12%
39%
37%
63%
58%
25%
0% 10% 20% 30% 40% 50% 60% 70% 80% 90% 100%
Stock options
Mini-HSI options
HHI options
HSI options
Mini-HHI futures
Mini-HSI futures
HHI futures
HSI futures
Overall
Distribution of derivatives trading by investor type for overall market and each product (Jul 2014 - Jun 2015)
Market makers EP proprietary trading Local retail investors
Local institutional investors Overseas retail investors Overseas institutional investors
OVERALL
Notes:
(1) Trading as market makers and EP proprietary trading are components of EP principal trading.
(2) Numbers may not add up to 100% due to rounding.
Futures
Options
2014/15
2010/11
Overall
2011/12
Overall
2012/13
Overall
2013/14
Overall
2014/15
Overall
HSI
futures
HSI
options
Mini-
HSI
futures
Mini-
HSI
options
HHI
futures
HHI
options
Mini-
HHI
futures
Stock
options
All trading
Principal#
50.7 50.0 49.5 50.5 51.0 15.4 61.4 18.2 67.8 17.4 50.8 18.5 70.9
Agency 49.3 50.0 50.5 49.5 49.0 84.6 38.6 81.8 32.2 82.6 49.2 81.5 29.1
100.0 100.0 100.0 100.0 100.0 100.0 100.0 100.0 100.0 100.0 100.0 100.0 100.0
Agency trading
Local 53.6 48.8 46.0 46.1 43.3 27.4 62.7 48.8 86.3 19.0 37.2 44.0 68.6
Overseas 46.4 51.2 54.0 53.9 56.7 72.6 37.3 51.2 13.7 81.0 62.8 56.0 31.4
100.0 100.0 100.0 100.0 100.0 100.0 100.0 100.0 100.0 100.0 100.0 100.0 100.0
Agency trading
Retail 45.7 41.1 41.3 38.7 37.0 23.7 53.8 50.9 96.0 14.9 15.0 49.5 58.3
Institutional 54.3 58.9 58.7 61.3 63.0 76.3 46.2 49.1 4.0 85.1 85.0 50.5 41.7
100.0 100.0 100.0 100.0 100.0 100.0 100.0 100.0 100.0 100.0 100.0 100.0 100.0
Retail investor trading
Local 88.8 84.7 86.1 84.8 84.0 85.1 86.7 88.9 86.9 71.4 80.5 82.9 85.5
Overseas 11.2 15.3 13.9 15.2 16.0 14.9 13.3 11.1 13.1 28.6 19.5 17.1 14.5
100.0 100.0 100.0 100.0 100.0 100.0 100.0 100.0 100.0 100.0 100.0 100.0 100.0
Institutional investor trading
Local 24.0 23.7 17.7 21.6 19.3 9.5 34.8 7.4 70.4 9.9 29.6 5.8 44.9
Overseas 76.0 76.3 82.3 78.4 80.7 90.5 65.2 92.6 29.6 90.1 70.4 94.2 55.1
100.0 100.0 100.0 100.0 100.0 100.0 100.0 100.0 100.0 100.0 100.0 100.0 100.0
Local investor trading
Retail 75.7 71.3 77.4 71.3 71.9 73.6 74.3 92.6 96.7 55.9 32.5 93.3 72.7
Institutional 24.3 28.7 22.6 28.7 28.1 26.4 25.7 7.4 3.3 44.1 67.5 6.7 27.3
100.0 100.0 100.0 100.0 100.0 100.0 100.0 100.0 100.0 100.0 100.0 100.0 100.0
Overseas investor trading
Retail 11.1 12.3 10.6 10.9 10.4 4.9 19.2 11.1 91.4 5.3 4.7 15.1 27.0
Institutional 88.9 87.7 89.4 89.1 89.6 95.1 80.8 88.9 8.6 94.7 95.3 84.9 73.0
100.0 100.0 100.0 100.0 100.0 100.0 100.0 100.0 100.0 100.0 100.0 100.0 100.0

DERIVATIVES MARKET TRANSACTION SURVEY 2014/15 20
4. OVERSEAS INVESTOR TRADING BY ORIGIN
4.1 Overall pattern
(See Figures 10 – 13.)
Trading distribution by origin
Overseas investors in aggregate contributed 28% of total market turnover in 2014/15 (compared to
27% in 2013/14) and experienced a year-on-year increase of 45% in contract volume and a CAGR of
22% over the past decade.
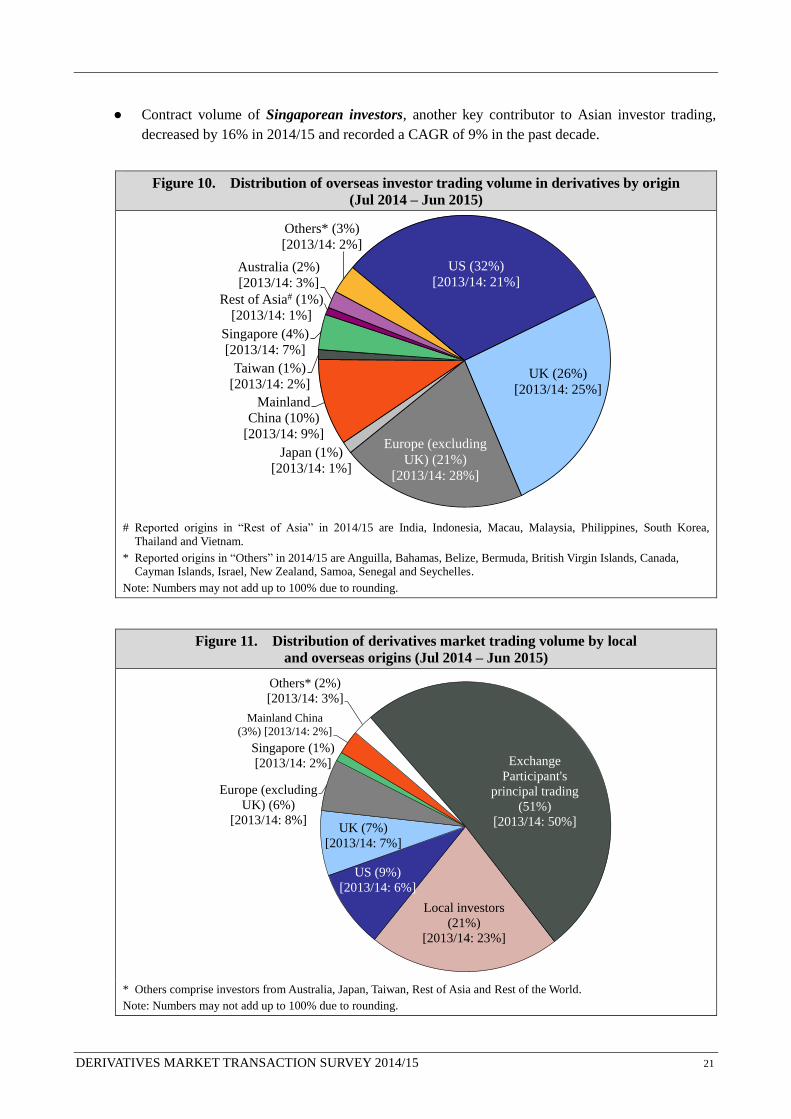
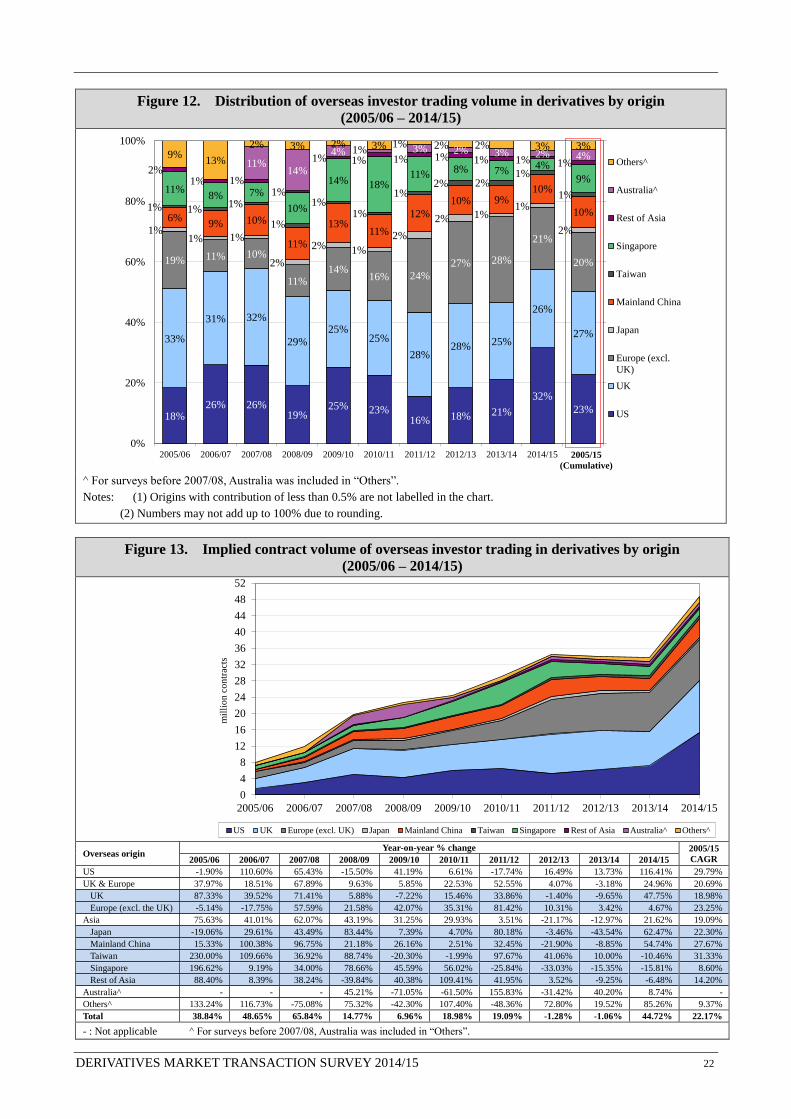
● US investors surpassed Continental European investors and UK investors and became the largest
contributor group in 2014/15 — 32% of overseas investor trading (up from 21% in 2013/14) or
9% of total market turnover (up from 6% in 2013/14)8.
● UK investors remained the second major overseas contributor group — 26% of overseas investor
trading in 2014/15 (compared to 25% in 2013/14) or 7% of total market turnover (the same as in
2013/14).
● Continental European investors ranked third — 21% of overseas investor trading in 2014/15
(down from 28% in 2013/14) or 6% of total market turnover (8% in 2013/14).
● The aggregate contribution in 2014/15 from Asian investors (Mainland China, Singapore, Japan,
Taiwan and the Rest of Asia) was 17% of overseas investor trading (the lowest level in the past
five years) or 5% of total market volume (the same as in 2013/14).
○ The majority of the Asian contribution came from Mainland China investors — 10% of
overseas investor trading (9% in 2013/14), or about 3% of total market volume (2% in
2013/14).
○ The second major Asian contributor was Singaporean investors — 4% of overseas investor
trading (7% in 2013/14), or 1% of total market volume (2% in 2013/14).
Implied contract volume by origin
● US investor trading volume recorded a remarkable year-on-year growth of 116% in 2014/15.
UK investor trading also recorded a significant volume growth of 48% while Continental
European investors grew by only 5%. Boosted by the growth in 2014/15, overseas investor
trading from the US recorded a CAGR of 30% over the past decade, higher than the CAGRs of
investor trading from the UK (+19%) and Continental Europe (+23%).
● Although Asian investors had a decline in their aggregate contribution to overseas investor
trading (from 20% in 2013/14 to 17% in 2014/15), their aggregate contract volume increased by
22%.
● Mainland investor trading volume increased by 55% in 2014/15 and attained a CAGR of 28%
over the past decade (compared to 19% for Asian investors as a whole and 22% for total overseas
trading).
8 This owed largely to the contribution of the top two FEPs by total contract volume (with an aggregate contribution
of 19% in the total index derivatives market turnover) who reported a large percentage of transactions being done
for their US clients.
DERIVATIVES MARKET TRANSACTION SURVEY 2014/15 21
● Contract volume of Singaporean investors, another key contributor to Asian investor trading,
decreased by 16% in 2014/15 and recorded a CAGR of 9% in the past decade.
Figure 10. Distribution of overseas investor trading volume in derivatives by origin
(Jul 2014 – Jun 2015)
# Reported origins in “Rest of Asia” in 2014/15 are India, Indonesia, Macau, Malaysia, Philippines, South Korea,
Thailand and Vietnam.
* Reported origins in “Others” in 2014/15 are Anguilla, Bahamas, Belize, Bermuda, British Virgin Islands, Canada, Cayman Islands, Israel, New Zealand, Samoa, Senegal and Seychelles.
Note: Numbers may not add up to 100% due to rounding.
Figure 11. Distribution of derivatives market trading volume by local
and overseas origins (Jul 2014 – Jun 2015)
* Others comprise investors from Australia, Japan, Taiwan, Rest of Asia and Rest of the World.
Note: Numbers may not add up to 100% due to rounding.
US (32%)
[2013/14: 21%]
UK (26%)
[2013/14: 25%]
Europe (excluding
UK) (21%)
[2013/14: 28%]
Japan (1%)
[2013/14: 1%]
Mainland
China (10%)
[2013/14: 9%]
Taiwan (1%)
[2013/14: 2%]
Singapore (4%)
[2013/14: 7%]
Rest of Asia# (1%)
[2013/14: 1%]
Australia (2%)
[2013/14: 3%]
Others* (3%)
[2013/14: 2%]
Distribution of overseas investor trading in derivatives by origin (Jul 2014 - Jun 2015)
# Reported origins in “Rest of Asia” in 2014/15 are India, Indonesia, Macau, Malaysia, Philippines, South Korea,Thailand and Vietnam.
* Reported origins in “Others” in 2014/15 are Anguilla, Bahamas, Belize, Bermuda, British Virgin Islands, Canada, Cayman Islands, Israel,
New Zealand, Samoa, Senegal and Seychelles.
Note: Numbers may not add up to 100% due to rounding.
Exchange
Participant's
principal trading
(51%)
[2013/14: 50%]
Local investors
(21%)
[2013/14: 23%]
US (9%)
[2013/14: 6%]
UK (7%)
[2013/14: 7%]
Europe (excluding
UK) (6%)
[2013/14: 8%]
Singapore (1%)
[2013/14: 2%]
Mainland China
(3%) [2013/14: 2%]
Others* (2%)
[2013/14: 3%]
Distribution of derivatives market trading volume by investor type (2014/15)
DERIVATIVES MARKET TRANSACTION SURVEY 2014/15 22
Figure 12. Distribution of overseas investor trading volume in derivatives by origin
(2005/06 – 2014/15)
^ For surveys before 2007/08, Australia was included in “Others”.
Notes: (1) Origins with contribution of less than 0.5% are not labelled in the chart.
(2) Numbers may not add up to 100% due to rounding.
Figure 13. Implied contract volume of overseas investor trading in derivatives by origin
(2005/06 – 2014/15)
Overseas origin
Year-on-year % change 2005/15
CAGR 2005/06 2006/07 2007/08 2008/09 2009/10 2010/11 2011/12 2012/13 2013/14 2014/15
US -1.90% 110.60% 65.43% -15.50% 41.19% 6.61% -17.74% 16.49% 13.73% 116.41% 29.79%
UK & Europe 37.97% 18.51% 67.89% 9.63% 5.85% 22.53% 52.55% 4.07% -3.18% 24.96% 20.69%
UK 87.33% 39.52% 71.41% 5.88% -7.22% 15.46% 33.86% -1.40% -9.65% 47.75% 18.98%
Europe (excl. the UK) -5.14% -17.75% 57.59% 21.58% 42.07% 35.31% 81.42% 10.31% 3.42% 4.67% 23.25%
Asia 75.63% 41.01% 62.07% 43.19% 31.25% 29.93% 3.51% -21.17% -12.97% 21.62% 19.09%
Japan -19.06% 29.61% 43.49% 83.44% 7.39% 4.70% 80.18% -3.46% -43.54% 62.47% 22.30%
Mainland China 15.33% 100.38% 96.75% 21.18% 26.16% 2.51% 32.45% -21.90% -8.85% 54.74% 27.67%
Taiwan 230.00% 109.66% 36.92% 88.74% -20.30% -1.99% 97.67% 41.06% 10.00% -10.46% 31.33%
Singapore 196.62% 9.19% 34.00% 78.66% 45.59% 56.02% -25.84% -33.03% -15.35% -15.81% 8.60%
Rest of Asia 88.40% 8.39% 38.24% -39.84% 40.38% 109.41% 41.95% 3.52% -9.25% -6.48% 14.20%
Australia^ - - - 45.21% -71.05% -61.50% 155.83% -31.42% 40.20% 8.74% -
Others^ 133.24% 116.73% -75.08% 75.32% -42.30% 107.40% -48.36% 72.80% 19.52% 85.26% 9.37%
Total 38.84% 48.65% 65.84% 14.77% 6.96% 18.98% 19.09% -1.28% -1.06% 44.72% 22.17%
- : Not applicable ^ For surveys before 2007/08, Australia was included in “Others”.
23%
32%
21%18%16%23%25%
19%26%26%
18%
27%
26%
25%28%28%
25%25%
29%
32%31%
33%
20%
21%
28%27%
24%16%14%
11%
10%11%19%
2%
1%1%2%
2%
1%2%
2%
1%1%1%
10%
10%9%10%
12%
11%13%
11%
10%9%6%
1%
1%2%2%
1%
1%1%
1%
1%1%1%
9%
4%7%8%
11%18%14%
10%
7%8%11%
1%1%1%1%1%1%1%
1%1% 1%
2%
4%2%3%2%3%1%4%
14%11%
3%3%2%2%1%3%2%3%2%
13%9%
0%
20%
40%
60%
80%
100%
2014/152013/142012/132011/122010/112009/102008/092007/082006/072005/06
Distribution of overseas investor trading in derivatives by origin (2005/06 - 2014/15)
Others^
Australia^
Rest of Asia
Singapore
Taiwan
Mainland China
Japan
Europe (excl.
UK)
UK
US
^ For surveys before 2007/08, Australia was included in " Others".
Notes: (1) Origins with contribution of less than 0.5% are not labelled in the chart.
(2) Numbers may not add up to 100% due to rounding.
2005/15
(Cumulative)
0
4
8
12
16
20
24
28
32
36
40
44
48
52
2005/06 2006/07 2007/08 2008/09 2009/10 2010/11 2011/12 2012/13 2013/14 2014/15
mil
lio
n c
on
trac
ts
Implied contract volume of overseas investor trading in derivatives by origin (2005/06 - 2014/15)
US UK Europe (excl. UK) Japan Mainland China Taiwan Singapore Rest of Asia Australia^ Others^
^ Australia was included in others for surveys before 2007/08.

DERIVATIVES MARKET TRANSACTION SURVEY 2014/15 23
Minimum proportion of retail/institutional investor trading by origin
Although the survey did not ask for a breakdown by retail/institutional investors for each overseas
origin, a minimum proportion of retail/institutional investor trading from each origin could be deduced
from EPs’ responses.
● Almost all trading from the US (over 99%) came from institutional investors and for the UK
(over 96%) and Continental Europe (over 90%) as well.
● Investor trading from Japan and Australia was also predominantly from institutional investors
(over 79% for Japan and over 72% for Australia). The majority (over 59%) of Singaporean
investor trading also came from institutional investors.
● At least 70% of Mainland investor trading came from retail investors.
(See Table 4.)
Table 4. Minimum proportion of retail/institutional investor trading
from each overseas origin (2014/15)
Origin Minimum proportion of the trading coming from
Retail investors Institutional investors
US ~0.0% 99.6%
UK ~0.0% 96.2%
Continental Europe 1.4% 90.6%
Japan 0.6% 79.7%
Mainland China 70.5% 11.5%
Taiwan 9.6% 36.2%
Singapore 1.3% 59.7%
Australia 0.2% 72.1%
Note: The minimum proportions are deduced figures from the responses. The difference between 100% and the
summation of the two figures for an origin represents the proportion of trading from that origin which could
come from either retail or institutional investors.
4.2 Trading by market segment
The stock options market segment is served by SOEPs while the market segment in index futures and
options is served by FEPs. Overseas investor trading constituted only 9% of stock options trading
but 51% of index futures and options trading. The distribution of overseas investor trading by origin
for stock options also differed from that of index futures and options.
● For stock options, the major overseas contributors were investors from the UK (32% of the
segment’s overseas investor trading, up from 28% in 2013/14) and Mainland China (24%, the
same as in 2013/14). They were followed by investors from Continental Europe (15%,
compared to 16% in 2013/14) and Singapore (12%, compared to 13% in 2013/14). The overall
pattern is similar to that in 2013/14.
● For index futures and options, the major overseas contributor was investors from the US (38%,
up from 25% in 2013/14). They were followed by investors from the UK (25%, the same in
2013/14) and Continental Europe (22%, down from 31% in 2013/14). Mainland investors
contributed 6% of the segment’s overseas investor trading (the same as in 2013/14).

DERIVATIVES MARKET TRANSACTION SURVEY 2014/15 24
Implied contract volume by origin
● For stock options, investor trading volume from the two key contributor origins — the UK and
Mainland China — experienced year-on-year increases of 87% and 71% respectively, higher than
the 65% increase in stock options’ total overseas investor trading volume. Trading volume from
the investors in other origins except the rest of Asia also had year-on-year growths.
● For index futures and options, investor trading volume from the major origin — the US —
achieved a remarkable year-on-year increase of 116%, compared to the 41% increase in the
products’ total overseas investor trading volume. Investor trading volume from the UK
increased by 39% while Continental European investor trading volume was almost unchanged.
Notably, Mainland investor trading volume grew by 43%.
● As shown in Figure 15, overseas investor trading volume concentrated in index products (82%,
compared to 84% in 2013/14) and much less in stock options (18%, compared to 16% in
2013/14). US investors had little trading in stock options (1%) only. Compared to the western
origins, investors from Singapore, Mainland China and Taiwan had the largest proportion of
their total trading in the HKEx derivatives market devoted to stock options — 54% for
Singaporean investors (up from 31% in 2013/14), 47% for Taiwan (up from 25% in 2013/14) and
46% for Mainland (up from 42% in 2013/14).
(See Figures 14 – 15, Table 5.)
Figure 14. Distribution of overseas investor trading volume in derivatives by origin
by market segment (Jul 2014 – Jun 2015)
( ): Implied contract volume of overseas investor trading in the market segment. * Reported origins in "Rest of Asia" are India, Macau, Malaysia and South Korea for both segments; plus Philippines,
Thailand and Vietnam for index derivatives; plus Indonesia for stock options. # Reported origins in "Others" are Anguilla, Bahamas, Bermuda, British Virgin Islands, Canada, Cayman Islands and
Senegal for both segments; plus Israel and New Zealand for index derivatives; plus Belize, Samoa and Seychelles for
stock options
Notes:
(1) Numbers may not add up to 100% due to rounding.
(2) Origins with contribution of less than 0.5% are not labelled in the chart.
38%
2%
25%
32%
22%
15%
1%
2%
6%
24%
1%
3%
2%
12%
3%2%3%
3%4%
0%
20%
40%
60%
80%
100%
Index futures & optionsStock options
Distribution of overseas investor trading in derivatives by origin by market segment (Jul 2014 - Jun 2015)
Others
Australia
Rest of Asia
Singapore
Taiwan
Mainland China
Japan
Europe (excl.
UK)
UK
US
(9 million contracts) (40 million contracts)
Others#
Singapore
US
UK
Europe
(excl. UK)
Japan
Mainland
China
( ) : Implied contract volume of overseas investor trading in the market segment.
* Reported origins in "Rest of Asia" are India, Macau, Malaysia and South Korea for both segments;
plus Philippines, Thailand and Vietnam for index derivatives; plus Indonesia for stock options. # Reported origins in "Others" are Anguilla, Bahamas, Bermuda, British Virgin Islands, Canada, Cayman Islands and Senegal for both segments;
plus Israel and New Zealand for index derivatives; plus Belize, Samoa and Seychelles for stock options.
Note: (1) Origins with contribution of less than 0.5% are not labelled in the chart.
(2) Numbers may not add up to 100% due to rounding.
TaiwanAustralia
Rest of Asia*

DERIVATIVES MARKET TRANSACTION SURVEY 2014/15 25
Table 5. Distribution of overseas investor trading in derivatives by origin
(2010/11 – 2014/15)
Notes:
(1) See glossary for the definition of implied contract volume. The total figure is the actual total contract volume, multiplied by the percentage contribution of overseas investor trading by origin.
(2) Numbers may not add up to 100% due to rounding.
Overall market (All futures and options)
Percentage contribution (2)
2010/11 2011/12 2012/13 2013/14 2014/15 No. of contracts Y-o-Y change
22.6 15.6 18.4 21.1 31.6 15,414,432 116.4%
40.7 52.2 55.0 53.8 46.5 22,669,661 25.0%
24.7 27.8 27.8 25.3 25.9 12,622,008 47.8%
16.0 24.4 27.3 28.5 20.6 10,047,653 4.7%
32.8 28.5 22.8 20.0 16.8 8,204,042 21.6%
1.4 2.2 2.1 1.2 1.4 663,559 62.5%
11.0 12.3 9.7 9.0 9.6 4,670,323 54.7%
0.7 1.2 1.7 1.8 1.1 554,645 -10.5%
18.4 11.5 7.8 6.7 3.9 1,889,479 -15.8%
1.2 1.4 1.5 1.4 0.9 426,035 -6.5%
1.2 2.6 1.8 2.5 1.9 922,502 8.7%
2.7 1.2 2.1 2.5 3.2 1,560,896 85.3%
100.0 100.0 100.0 100.0 100.0 48,771,533 44.7%
Index futures and options
Percentage contribution (2)
2010/11 2011/12 2012/13 2013/14 2014/15 No. of contracts Y-o-Y change
28.7 18.8 21.9 24.8 38.0 15,195,690 116.2%
38.2 52.9 54.2 55.6 46.3 18,517,003 17.5%
19.1 23.9 24.1 24.8 24.5 9,789,506 39.3%
19.1 29.1 30.0 30.8 21.8 8,727,497 -0.07%
29.8 25.5 21.4 15.0 11.0 4,390,884 3.5%
1.6 2.4 2.4 1.1 1.3 524,629 62.0%
9.2 7.9 8.3 6.2 6.3 2,518,177 43.0%
0.7 1.1 1.9 1.6 0.7 295,118 -36.9%
18.0 13.1 7.7 5.5 2.2 861,962 -44.4%
0.4 1.0 1.1 0.5 0.5 190,998 37.2%
1.1 2.2 1.6 2.4 1.7 661,292 -2.8%
2.2 0.6 1.0 2.3 3.0 1,192,161 83.3%
100.0 100.0 100.0 100.0 100.0 39,957,030 40.9%
Stock options
Percentage contribution (2)
2010/11 2011/12 2012/13 2013/14 2014/15 No. of contracts Y-o-Y change
2.0 4.4 2.2 1.8 2.5 218,742 130.0%
49.3 49.7 59.0 44.6 47.1 4,152,658 74.5%
43.4 41.4 44.5 28.3 32.1 2,832,502 87.1%
5.9 8.3 14.5 16.2 15.0 1,320,156 52.5%
42.6 39.0 29.0 46.9 43.3 3,813,158 52.2%
1.0 1.4 0.8 1.6 1.6 138,930 64.1%
17.3 27.5 16.3 23.6 24.4 2,152,146 71.1%
0.8 1.4 0.7 2.8 2.9 259,527 71.0%
19.8 5.9 8.0 13.0 11.7 1,027,517 47.9%
3.7 2.7 3.2 5.9 2.7 235,037 -25.7%
1.5 3.6 2.7 3.1 3.0 261,210 55.4%
4.6 3.3 7.1 3.6 4.2 368,736 92.1%
100.0 100.0 100.0 100.0 100.0 8,814,503 65.1%
Australia
Europe (excl. UK)
Others
Total
Asia
Japan
Mainland China
Taiwan
Singapore
Rest of Asia
Others
Implied contract volume(1)
(2014/15)
US
Europe
UK
Total
Origin
Australia
Others
Total(1)
Origin
Europe
Taiwan
Singapore
Rest of Asia
Australia
Implied contract volume(1)
(2014/15)
US
Mainland China
UK
Europe (excl. UK)
Asia
Japan
Rest of Asia
Europe (excl. UK)
OriginImplied contract volume
(1) (2014/15)
US
Europe
UK
Asia
Japan
Mainland China
Taiwan
Singapore

DERIVATIVES MARKET TRANSACTION SURVEY 2014/15 26
15m (99%)
[7m, 99%]
0.2m (1%)
[0.1m, 1%]
Composition of overseas investor volume by segment from each origin (Jul 2013 - Jun 2014) - US
Total: 15m contracts
Figure 15. Composition of overseas investor trading volume from each origin
by market segment (Jul 2014 – Jun 2015)
All origins
US
UK
Europe (excl UK)
Mainland China
Singapore
Australia
Japan
Taiwan
[ ]: Implied contract volume and market share by market segment for each origin in 2013/14.
Note: Numbers may not add up to total due to rounding.
40m (82%)
[28m, 84%]
9m (18%)
[5m, 16%]
Composition of overseas investor volume by segment from each origin (Jul 2014 - Jun 2015) - Overall market
Total: 49m contracts
15m (99%)
[7m, 99%]
Composition of overseas investor volume by segment from each origin (Jul 2013 - Jun 2014) - US
Total: 15m contracts
10m (78%)
[7m, 82%]
3m (22%)
[2m, 18%]
Composition of overseas investor volume by segment from each origin (Jul 2014 - Jun 2015) - UK
Total: 13m contracts
9m (87%)
[9m, 91%]1m (13%)
[0.9m, 9%]
Composition of overseas investor volume by segment from each origin (Jul 2014 - Jun 2015) - EU (excl UK)
Total: 10m contracts
3m, (54%)
[2m, 58%]
2m (46%)
[1m, 42%]
Composition of overseas investor volume by segment from each origin (Jul 2014 - Jun 2015) - China
Total: 5m contracts
0.9m (46%)
[1.5m, 69%]1m (54%)
[0.7m, 31%]
Composition of overseas investor volume by segment from each origin (Jul 2014 - Jun 2015) - Singapore
Total: 1.9m contracts
0.7m (72%)
[0.7m, 80%]0.3m (28%)
[0.2m, 20%]
Composition of overseas investor volume by segment from each origin (Jul 2014 - Jun 2015) - Australia
Total: 0.9m contracts
0.5m (79%)
[0.3m, 79%]0.1m (21%)
[0.1m, 21%]
Composition of overseas investor volume by segment from each origin (Jul 2014 - Jun 2015) - Japan
Total: 0.7m contracts
0.3m (53%)
[0.5m, 75%]0.3m (47%)
[0.2m, 25%]
Composition of overseas investor volume by segment from each origin (Jul 2014 - Jun 2015) - Taiwan
Total: 0.6m contracts
28m (82%)6m (18%)
Composition of overseas investor volume by segment from each origin (Jul 2012 - Jun 2013) - Overall market
Index futures & options Stock options
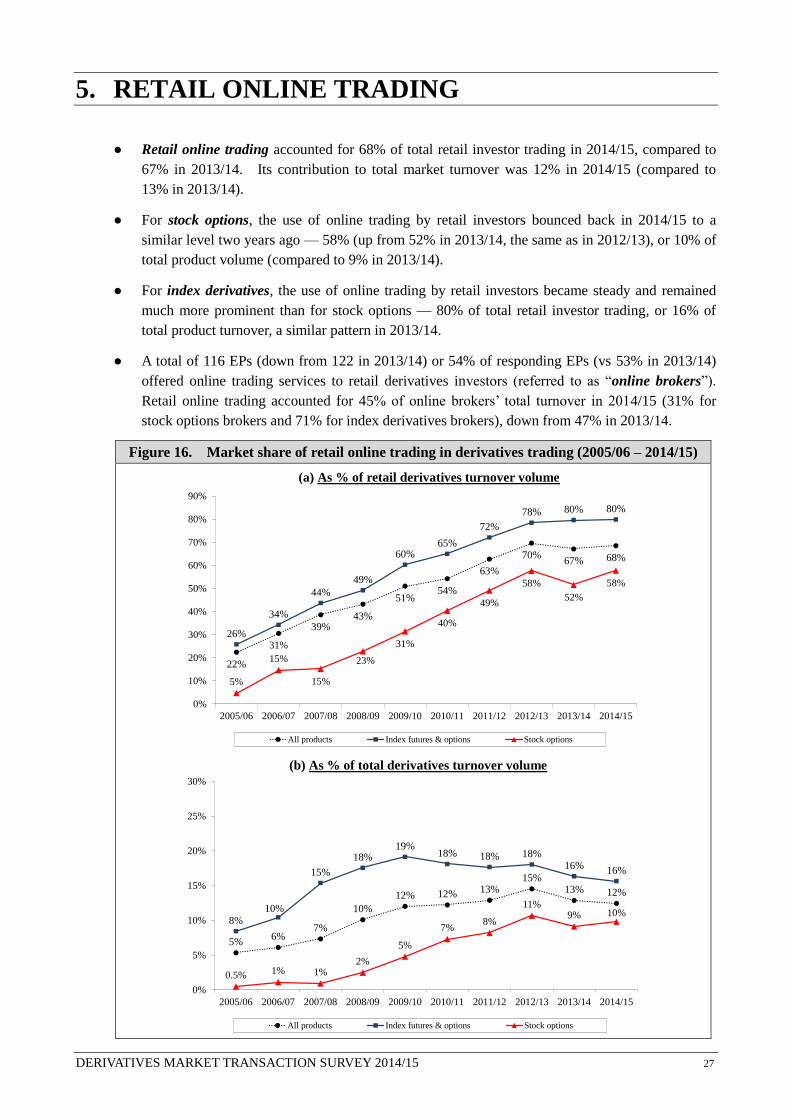
DERIVATIVES MARKET TRANSACTION SURVEY 2014/15 27
5. RETAIL ONLINE TRADING
● Retail online trading accounted for 68% of total retail investor trading in 2014/15, compared to
67% in 2013/14. Its contribution to total market turnover was 12% in 2014/15 (compared to
13% in 2013/14).
● For stock options, the use of online trading by retail investors bounced back in 2014/15 to a
similar level two years ago — 58% (up from 52% in 2013/14, the same as in 2012/13), or 10% of
total product volume (compared to 9% in 2013/14).
● For index derivatives, the use of online trading by retail investors became steady and remained
much more prominent than for stock options — 80% of total retail investor trading, or 16% of
total product turnover, a similar pattern in 2013/14.
● A total of 116 EPs (down from 122 in 2013/14) or 54% of responding EPs (vs 53% in 2013/14)
offered online trading services to retail derivatives investors (referred to as “online brokers”).
Retail online trading accounted for 45% of online brokers’ total turnover in 2014/15 (31% for
stock options brokers and 71% for index derivatives brokers), down from 47% in 2013/14.
Figure 16. Market share of retail online trading in derivatives trading (2005/06 – 2014/15)
22%
31%
39%43%
51%54%
63%
70%67% 68%
26%
34%
44%
49%
60%65%
72%
78% 80% 80%
5%
15%
15%
23%
31%
40%
49%
58%
52%
58%
0%
10%
20%
30%
40%
50%
60%
70%
80%
90%
2005/06 2006/07 2007/08 2008/09 2009/10 2010/11 2011/12 2012/13 2013/14 2014/15
Retail online trading as percentage of total retail derivatives trading volume (2005/06 - 2014/15)
All products Index futures & options Stock options
5%6%
7%
10%
12% 12% 13%15%
13% 12%
8%
10%
15%
18%19%
18% 18% 18%16%
16%
0.5% 1% 1%2%
5%
7%8%
11%9% 10%
0%
5%
10%
15%
20%
25%
30%
2005/06 2006/07 2007/08 2008/09 2009/10 2010/11 2011/12 2012/13 2013/14 2014/15
Retail online trading as percentage of total market derivatives volume (2005/06 - 2014/15)
All products Index futures & options Stock options
(a) As % of retail derivatives turnover volume
(b) As % of total derivatives turnover volume
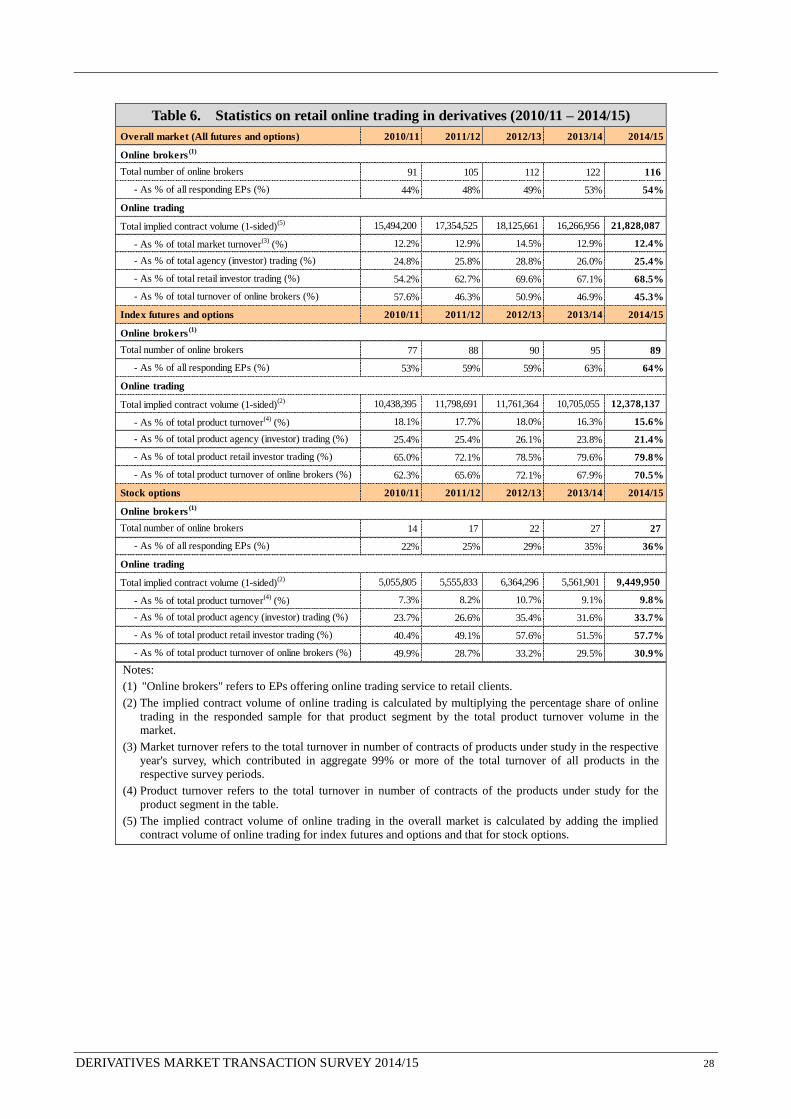
DERIVATIVES MARKET TRANSACTION SURVEY 2014/15 28
Table 6. Statistics on retail online trading in derivatives (2010/11 – 2014/15)
Notes:
(1) "Online brokers" refers to EPs offering online trading service to retail clients.
(2) The implied contract volume of online trading is calculated by multiplying the percentage share of online
trading in the responded sample for that product segment by the total product turnover volume in the market.
(3) Market turnover refers to the total turnover in number of contracts of products under study in the respective
year's survey, which contributed in aggregate 99% or more of the total turnover of all products in the respective survey periods.
(4) Product turnover refers to the total turnover in number of contracts of the products under study for the
product segment in the table.
(5) The implied contract volume of online trading in the overall market is calculated by adding the implied contract volume of online trading for index futures and options and that for stock options.
Overall market (All futures and options) 2010/11 2011/12 2012/13 2013/14 2014/15
91 105 112 122 116
44% 48% 49% 53% 54%
15,494,200 17,354,525 18,125,661 16,266,956 21,828,087
12.2% 12.9% 14.5% 12.9% 12.4%
24.8% 25.8% 28.8% 26.0% 25.4%
54.2% 62.7% 69.6% 67.1% 68.5%
57.6% 46.3% 50.9% 46.9% 45.3%
Index futures and options 2010/11 2011/12 2012/13 2013/14 2014/15
77 88 90 95 89
53% 59% 59% 63% 64%
10,438,395 11,798,691 11,761,364 10,705,055 12,378,137
18.1% 17.7% 18.0% 16.3% 15.6%
25.4% 25.4% 26.1% 23.8% 21.4%
65.0% 72.1% 78.5% 79.6% 79.8%
62.3% 65.6% 72.1% 67.9% 70.5%
Stock options 2010/11 2011/12 2012/13 2013/14 2014/15
14 17 22 27 27
22% 25% 29% 35% 36%
5,055,805 5,555,833 6,364,296 5,561,901 9,449,950
7.3% 8.2% 10.7% 9.1% 9.8%
23.7% 26.6% 35.4% 31.6% 33.7%
40.4% 49.1% 57.6% 51.5% 57.7%
49.9% 28.7% 33.2% 29.5% 30.9%
- As % of total product agency (investor) trading (%)
- As % of total product retail investor trading (%)
- As % of total product turnover of online brokers (%)
- As % of total product turnover(4)
(%)
Online trading
Total implied contract volume (1-sided)(2)
- As % of total product turnover(4)
(%)
- As % of total product agency (investor) trading (%)
- As % of total product retail investor trading (%)
- As % of total product turnover of online brokers (%)
Online brokers(1)
Total number of online brokers
- As % of all responding EPs (%)
Online trading
Total implied contract volume (1-sided)(2)
- As % of all responding EPs (%)
Online brokers(1)
Total number of online brokers
- As % of all responding EPs (%)
Online trading
Total implied contract volume (1-sided)(5)
- As % of total market turnover(3)
(%)
- As % of total agency (investor) trading (%)
- As % of total retail investor trading (%)
- As % of total turnover of online brokers (%)
Online brokers(1)
Total number of online brokers
DERIVATIVES MARKET TRANSACTION SURVEY 2014/15 29
GLOSSARY
Hedging Utilisation of futures/options to reduce or eliminate the market risk of a
portfolio by compensating for the effect of price fluctuations of an underlying
asset.
Pure trading Trading for potential profit in anticipation of a price movement in either the
short or long term, but not for hedging or arbitrage purpose.
Arbitrage Trading to take riskless or near riskless profit from price differentials in
related markets.
Principal trading Trading on the participant firm’s own account, whether as a market maker or
not, i.e. comprising EP market maker trading and proprietary trading.
Agency trading Trading on behalf of the participant firm’s clients, including client trading
channelled from the firm’s parent or sister companies.
Market maker trading Trading as a market maker serving for that product only, including trading by
client Registered Traders (RTs) (before 1 February 2007) or corporate entities
which have market making arrangement with the EP that has been granted
market maker permit in the product (on and after 1 February 2007). Trading
in that product using the EP’s RT accounts or market making accounts for
other products is excluded.
EP proprietary trading Trading on the participant firm’s own account but not as a market maker.
Individual/Retail investors Investors who trade on their personal account.
Institutional investors Investors who are not individual/retail investors.
Local investors Individual/Retail investors residing in Hong Kong or institutional investors
operating in Hong Kong ─ Hong Kong as the source of funds.
Online brokers EPs who offer online trading service to individual/retail investors.
Overseas investors Individual/Retail investors residing outside Hong Kong or institutional
investors operating outside Hong Kong ─ overseas as the source of funds.
Retail online trading Trading originating from orders entered directly by individual/retail investors
and channelled to the brokers via electronic media (e.g. the Internet).
Implied contract volume The number of contracts traded by a particular investor type in a particular
product type (or the overall market) is calculated by multiplying the
percentage contribution of that type of trade to the product turnover (or the
market turnover) as obtained from the survey by the actual turnover (number
of contracts traded) of that product (or the aggregate turnover of all products
under study) during the study period.
Notional value The notional value of a derivatives contract is calculated by multiplying the
market price of the underlying asset with the contract multiplier (i.e. the dollar
amount per index point for index futures and options) or contract size (the
number of underlying shares per contract for stock options). The notional
value of the turnover in derivatives is the aggregated notional value of the
contracts traded.

DERIVATIVES MARKET TRANSACTION SURVEY 2014/15 30
APPENDIX 1. RESPONSE RATE
% share of
Exchange Target Responded Response turnover in
Participants population participants rate target population
Futures EPs 159 139 87% 98%
Stock Options EPs 82 76 93% 98%
All Participants 241 215 89% 98%

DERIVATIVES MARKET TRANSACTION SURVEY 2014/15 31
APPENDIX 2. REPRESENTATIVENESS OF THE
RESPONDED SAMPLE RELATIVE
TO TARGET RESPONDENTS
(a) Futures Exchange Participants (Jul 2014 – Jun 2015)
(b) Stock Options Exchange Participants (Jul 2014 – Jun 2015)
0%
20%
40%
60%
80%
100%
0% 10% 20% 30% 40% 50% 60% 70% 80% 90% 100%
Cum
ula
tive
per
centa
ge
contr
ibuti
on
to t
ota
l co
ntr
act
volu
me
Cumulative percentage of number of participants
Appendix 2a. Representativeness of responded sample relative
to target HKFE Participants
(Jul 2014 - Jun 2015)
Target participants
Responded sample
0%
20%
40%
60%
80%
100%
0% 10% 20% 30% 40% 50% 60% 70% 80% 90% 100%
Cu
mu
lati
ve
per
cen
tag
e co
ntr
ibu
tio
n
to t
ota
l co
ntr
act
volu
me
Cumulative percentage of number of participants
Appendix 2b. Representativeness of responded sample relative
to target Stock Options Exchange Participants
(Jul 2014 - Jun 2015)
Target participants
Responded sample
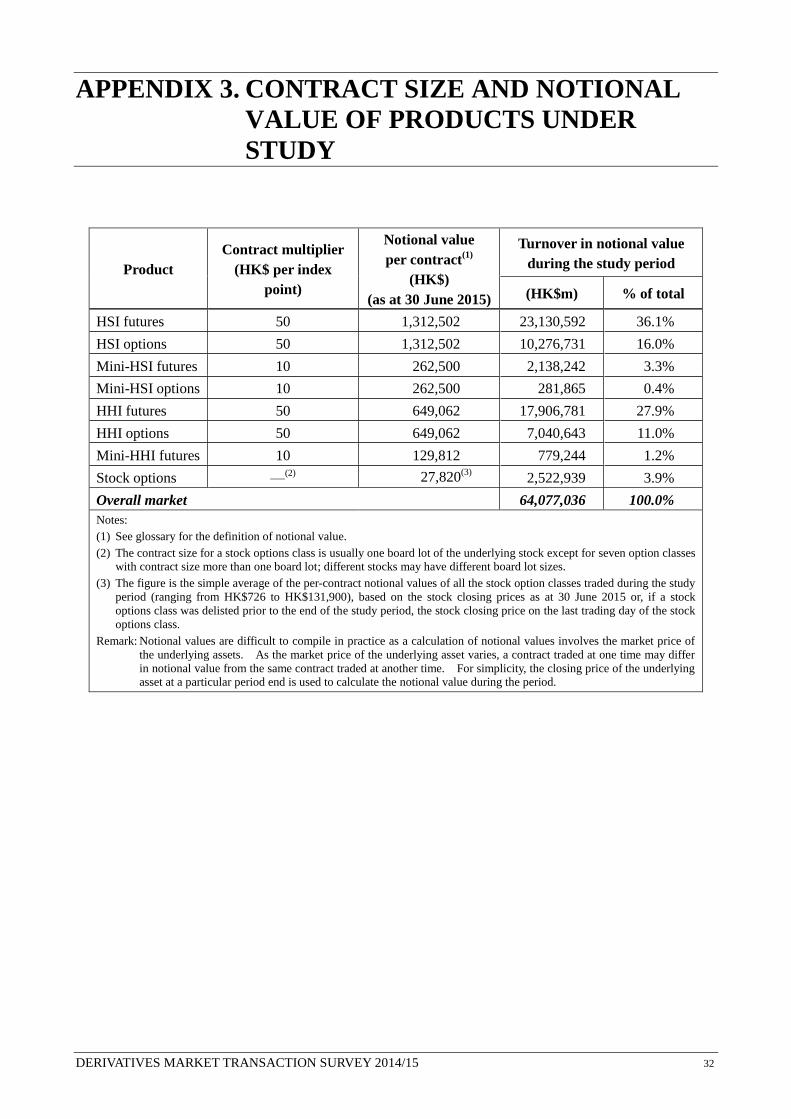
DERIVATIVES MARKET TRANSACTION SURVEY 2014/15 32
APPENDIX 3. CONTRACT SIZE AND NOTIONAL
VALUE OF PRODUCTS UNDER
STUDY
Product
Contract multiplier
(HK$ per index
point)
Notional value
per contract(1)
(HK$)
(as at 30 June 2015)
Turnover in notional value
during the study period
(HK$m) % of total
HSI futures 50 1,312,502 23,130,592 36.1%
HSI options 50 1,312,502 10,276,731 16.0%
Mini-HSI futures 10 262,500 2,138,242 3.3%
Mini-HSI options 10 262,500 281,865 0.4%
HHI futures 50 649,062 17,906,781 27.9%
HHI options 50 649,062 7,040,643 11.0%
Mini-HHI futures 10 129,812 779,244 1.2%
Stock options —(2)
27,820(3)
2,522,939 3.9%
Overall market 64,077,036 100.0%
Notes:
(1) See glossary for the definition of notional value.
(2) The contract size for a stock options class is usually one board lot of the underlying stock except for seven option classes with contract size more than one board lot; different stocks may have different board lot sizes.
(3) The figure is the simple average of the per-contract notional values of all the stock option classes traded during the study
period (ranging from HK$726 to HK$131,900), based on the stock closing prices as at 30 June 2015 or, if a stock
options class was delisted prior to the end of the study period, the stock closing price on the last trading day of the stock
options class.
Remark: Notional values are difficult to compile in practice as a calculation of notional values involves the market price of
the underlying assets. As the market price of the underlying asset varies, a contract traded at one time may differ
in notional value from the same contract traded at another time. For simplicity, the closing price of the underlying asset at a particular period end is used to calculate the notional value during the period.

DERIVATIVES MARKET TRANSACTION SURVEY 2014/15 33
APPENDIX 4. SURVEY METHODOLOGY
(1) Target population
Exchange participantship in the HKEx derivatives market consists of Futures Exchange Participants
(FEPs) and Stock Options Exchange Participants (SOEPs). The target population of the survey
included all FEPs and SOEPs who had trading during the study period, excluding those who had
ceased to be trading participants before the start of fieldwork in July 2015. The target respondents
were all corporations.
(2) Methodology
The survey consisted of two sub-surveys with two separate questionnaires, targeting the FEPs and
the SOEPs respectively. The questionnaire addressed to SOEPs covered stock options only and
that to FEPs covered major derivative products other than stock options (ie key index futures and
options).
The study period or survey period is from July 2014 to June 2015.
Products under study were Hang Seng Index (HSI) futures, HSI options, Mini-HSI futures,
Mini-HSI options, H-shares Index (HHI) futures, HHI options, Mini-HHI futures and stock options.
These products together contributed 99.3% of the total volume of the HKEx derivatives market
during the study period.
The survey was conducted by mailed questionnaire. The target respondents were requested to
provide an estimated percentage breakdown of their contract volume for each of the product under
study during the study period in accordance with the prescribed classification. Respondents were
reminded that their answers should be based on their execution turnover.
Close telephone follow-up was done to ensure a high response rate, especially for Participants
which were top-ranked in the target population by contract volume.
The methodology to arrive at the relative contribution of each type of trade to the total market
volume has been improved since 2008/09 by applying a weighting factor by product under study to
align the responded sample with the actual market turnover composition by product. Each
Participant’s answers in percentage terms were first multiplied by its actual contract volume by
product during the study period obtained internally to arrive at its volume in each respective trade
type for each product, based on which the relative contribution of each trade type (aggregate of all
responding Participants) for each product was calculated. The weighting factors by product were
then applied to the aggregate trading volume of all responding Participants by trade type in the
respective product under study before calculating the relative contribution of each trade type to the
total market.

DERIVATIVES MARKET TRANSACTION SURVEY 2014/15 34
For statistics on online trading, the total reported online trading volume of each product segment
─ index futures & options and stock options ─ was first calculated. This was done by
aggregating all responding Participants’ figures ─ each was calculated by multiplying the
reported online trading percentage with that Participant’s actual contract volume in the product
segment. The proportion of the total reported online trading volume in the product segment to the
responded sample’s total trading volume in the product segment was computed (this approach was
adopted since the 2008/09 survey rather than using the proportion to the target population’s total as
in prior surveys). The implied online trading volume was then calculated by multiplying this
proportion by the actual market turnover in each of the product segments during the study period.
The total implied online trading volume for the market was calculated by summing up the
respective figures for the two product segments (which had different response rates from FEPs and
SOEPs respectively; in surveys prior to 2009/10, no such weighting was adopted). The
corresponding figures for the overall market in previous surveys were revised accordingly. The
proportion of online trading volume to a specific trade type (agency or retail agency) was
calculated as the ratio of the implied online trading volume to the implied contract volume of that
trade type.
(3) Limitations
In providing the breakdown of total contract volume by the type of trade, EPs might only provide
their best estimates instead of hard data. Reliability of results is subject to the closeness of their
estimates to the actual figures.
For agency trading, EPs usually would not know the purpose of trading and would tend to regard
such transactions as “pure trading”. Three FEPs and two SOEPs among the responded EPs in the
2014/15 survey could not answer the question on trading purposes. They were excluded in the
analysis of turnover by trading purpose.
EPs might not know the true origins of all their client orders. For instance, an EP might classify
transactions for a local institution as such when in fact the orders originated from overseas and
were placed through that local institution, or vice versa. As a result, the findings may deviate
from the true picture.
The number of derivatives EPs was relatively small, especially SOEPs. Their degree of
participation in the various derivative products varied greatly. The trading pattern of the various
derivative products was also very diverse. Therefore, the non-response of particular EPs would
reduce the reliability of the survey findings, especially for a particular trade type or a particular
product type or Participant type with a small base. Nevertheless, the error due to non-response
should be small because of the high response rate by turnover volume and the responded sample’s
high representativeness of the target population (see Appendix 1 and 2).
The estimate of online trading volume in the market is subject to limitations. Firstly, online
trading through banks may or may not be reflected in the responses depending on the system
connection between the responding EP and the bank through which client orders are routed and the
EP’s own judgement. Secondly, the offer of online trading by EPs may not have an even
distribution within the two target groups of FEPs and SOEPs so that non-responses would generate
sampling error even though weighting by target group has been applied. Nevertheless, the second
limitation is considered minimal given the high response rate in volume terms.
DERIVATIVES MARKET TRANSACTION SURVEY 2014/15 35
There are two sets of statistics on FEPs’ contract volume — execution statistics, which record
volume when the trades are executed, and registration statistics, which are adjusted for post-trades9.
The total contract volume for a FEP and the proportion as market making under execution statistics
may differ from that under registration statistics. Execution statistics were used for the survey.
— END —
9 Post-trades are trades being transferred from one broker account to another broker account or from market maker’s
account to non-market maker’s account before clearing, no matter whether the accounts are under the same FEP firm.