Embed Size (px)
Citation preview
Depositional History anD paleogeograpHy of tHe Jurassic plover formation in calliance anD Brecknock fielDs, Browse Basin, nortH
west sHelf, australia
Federico Tovaglieri
This thesis is presentedfor the degree of
Doctor of Philosophy
to The University of Western AustraliaSchool of Earth and Environment
Submitted January 2013
Supervisors:
Prof. Annette GeorgeW/Prof. Mike Dentith
Dr Jennifer Wadsworth


i
Statement of candidate contribution
This thesis is my own original composition except where referenced. It contains no mate-
rial which was been accepted for the award of any degree or diploma in any university
and it is based on openfile data only. Part of Chapters 2, 4, 5 and 6 (with minor modifica-
tions to their present form) were included in the following paper submitted to Sedimentol-
ogy in May 2012 (currently under revision):
Tovaglieri F. and George A.D. (submitted) Stratigraphic architecture of an Early–Middle
Jurassic tidally influenced deltaic system: Browse Basin, Australian North West Shelf.
(I collected and analysed all the data and undertook the bulk of the interpretation, synthe-
sis and manuscript preparation (85%))
Part of Chapter 6, 7 and 8 (with minor modifications to their present form) will be in-
cluded in the following paper:
Tovaglieri F., Jones T., George A.D., Zwingmann H. (in preparation) Depositional His-
tory of the Early to Middle Jurassic deltaic reservoirs in Calliance and Brecknock fields
(Plover Formation), Browse Basin, North West Shelf, Australia.
(Data collection, analysis, interpretation and synthesis and manuscript preparation by me
(70%), Toby Jones (15), Annette D. George (10%) and Horst Zwingmann (5%))
Material presented in Appendix 4 represents an extract from the Honour Thesis of Mr.
Toby Jones (Jones, 2012) and it has been reproduced with the permission of the author.
Federico Tovaglieri
Candidate
Professor Annette D. George
Supervisor
University of Western Australia
January 2013

ii
iii
abStract
The Early to Middle Jurassic Plover Formation in the Browse Basin (Australian North
West Shelf) hosts reservoirs currently targeted for gas exploration and development. The
depositional history and paleogeographic evolution of the Plover Formation in the Cal-
liance and Brecknock fields has been established within a sequence-stratigraphic frame-
work through integrated sedimentological analysis of core and borehole image and wire-
line log analysis incorporating biostratigraphic and seismic data.
Seven siliciclastic and one volcano-sedimentary facies associations have been identified
through facies analysis of core and interpreted as fluvial channel-fill (FA0), tidally in-
fluenced channel- and tidal channel-fill complex (FA1-FA2), crevasse-splay and inter-
channel marsh (FA3), heterolithic mouthbar (FA4), sandy mouthbar (FA5) and offshore-
transition to offshore (FA6) depositional settings. These are associated with igneous and
volcaniclastic rocks (FA7) that are distributed at different stratigraphic levels. Evaluation
of borehole image fabric and interpretation of lithology from wireline log responses have
been used to distinguish fourteen image facies grouped into six image facies associations
(IFA0-IFA5). Paleocurrents obtained through image log interpretation show complex
distribution of unimodal, bimodal (and bipolar) and polymodal patterns. Core-based and
image log analysis have been used to interpret the depositional setting of the Plover For-
mation in the Calliance and Brecknock areas as a tidally influenced delta plain to delta
front. Sandstone composition indicates that sediments were derived from a mixed prov-
enance of recycled sedimentary and plutonic-metamorphic (cratonic) parent rocks. Igne-
ous units are concentrated in the lower part of the formation and have been interpreted
as extrusive flows, thus providing evidence for active volcanism during deposition. One
shallow subvolcanic intrusion has been interpreted in Calliance-3.
Facies association stacking patterns and integration with biostratigraphic data has been
used to identify key stratal surfaces and correlate stratal packages across the study area.
The surfaces bound five third-order sequences (S1 to S5). The three lower sequences S1,

iv
S2 and S3, are separated by a major unconformity (SB4) from overlying S4 and S5, cor-
responding to lower and upper Plover Formation respectively.
Analysis of seismic reflection data highlights the Triassic paleotopography and fault-con-
trolled depocentres. A large structural high in the central and northern parts of the study
area separated the Calliance and Brecknock deltaic settings during S1, S2 and S3. Major
transgressive phases during S2 and S3 were followed by progradational phases towards
the south and southwest in Calliance field and towards east and southeast in Brecknock
field. Volcanic vents active during this period have been interpreted to be located south-
west of Calliance-3 and northeast of Brecknock-4.
A major uplift event, interpreted at the base of S4, is associated with significant time gap
and flooding of the Brecknock structural high. Progradation of delta lobes during S4 and
S5 was dominantly south- and west-directed and occurred during a period of higher sub-
sidence rates that resulted in the accumulation of anomalously thick sandstone packages
that constitute the main gas reservoirs in the area. Retrogradational stacking of facies dur-
ing S5 records a phase of delta lobe abandonment over the entire study area.

v

vi
vii
Contents
statement of candidate contribution i
abstract iii
acknowledgments xvii
chapter 1 - introduction 1
1.1 Introduction .......................................................................................................... 1
1.2 Location of study area .......................................................................................... 2
1.3 Objective and aims ............................................................................................... 5
1.4 Materials and Methods ......................................................................................... 7
1.4.1 Core description and facies analysis .......................................................... 7
1.4.2 Image log analysis ...................................................................................... 8
1.4.3 Petrographic analysis ............................................................................... 10
1.4.4 Seismic analysis ....................................................................................... 10
1.4.5 Biostratigraphy ......................................................................................... 10
1.5 Thesis organization ............................................................................................. 11
chapter 2 - regional setting 13
2.1 Introduction ........................................................................................................ 13
2.2 Paleozoic extension ............................................................................................ 15
2.3 Triassic inversion ................................................................................................ 15
2.4 Jurassic extension ............................................................................................... 17
2.5 Cretaceous to Cenozoic thermal subsidence and inversion ................................ 19
2.6 Jurassic paleoclimate of the Browse Basin ........................................................ 20
2.7 Jurassic stratigraphy and paleogeography ......................................................... 21
chapter 3 - sedimentology 29
3.1 Introduction ........................................................................................................ 29
3.2 Core overview ..................................................................................................... 29
3.3 Ichnology ............................................................................................................ 33
viii
3.4 Sandstone composition ....................................................................................... 33
3.4.1 Detrital composition ................................................................................. 33
3.4.2 Diagenesis ................................................................................................ 39
3.4.3 Provenance ............................................................................................... 40
chapter 4 - facies analysis 43
4.1 Introduction ........................................................................................................ 43
4.2 Facies associations .............................................................................................. 43
4.2.1 FA0 ........................................................................................................... 43
4.2.2 FA1 ........................................................................................................... 44
4.2.3 FA2 ........................................................................................................... 50
4.2.4 FA3 ........................................................................................................... 50
4.2.5 FA4 ........................................................................................................... 54
4.2.6 FA5 ........................................................................................................... 55
4.2.7 FA6 ........................................................................................................... 57
4.2.8 FA7 ........................................................................................................... 58
4.3 Summary of siliciclastic facies associations ....................................................... 61
chapter 5 - image log analysis 65
5.1 Introduction ........................................................................................................ 65
5.2 Image facies and Image facies associations ....................................................... 65
5.2.1 IFA0 ......................................................................................................... 66
5.2.2 IFA1 ......................................................................................................... 66
5.2.3 IFA2 ......................................................................................................... 72
5.2.4 IFA3 ......................................................................................................... 78
5.2.5 IFA4 ......................................................................................................... 80
5.2.6 IFA5 ......................................................................................................... 83
5.5 Analysis and interpretation of Brecknock-1 ....................................................... 84
5.6 Structural dip correction and paleocurrent analysis ........................................... 86
5.7 Effectiveness of image logs for identifying facies and fabric variations ............ 87
ix
chapter 6 - stratal architecture 93
6.1 Introduction ........................................................................................................ 93
6.2 Depositional system ............................................................................................ 93
6.3 Surfaces and well correlation ............................................................................. 97
6.4 Sequence interpretation ...................................................................................... 98
6.4.1 Sequence 1 (S1) ....................................................................................... 98
6.4.2 Sequence 2 (S2) ..................................................................................... 102
6.4.3 Sequence 3 (S3) ..................................................................................... 105
6.4.4 Sequence 4 (S4) ..................................................................................... 107
6.4.5 Sequence 5 (S5) ..................................................................................... 108
6.5 Discussion ......................................................................................................... 109
6.5.1 Progradational and retrogradational trends ............................................ 109
6.5.2 Lowstand deltaic system of Sequence 3 ................................................ 109
6.5.3 Thickness of Sequence 4 ........................................................................ 112
6.5.4 Analogs .................................................................................................. 113
6.5.3 Igneous activity ...................................................................................... 115
chapter 7 - seismic analysis 117
7.1 Introduction ...................................................................................................... 117
7.2 Tectonic structures ............................................................................................ 117
7.3 Significant surfaces ........................................................................................... 118
7.3.1 Surface 1 ................................................................................................ 119
7.3.2 Surfaces 2 to 4 ........................................................................................ 120
7.4 Seismic Units .................................................................................................... 120
7.4.1 Seismic Unit A ....................................................................................... 121
7.4.2 Seismic Unit B ....................................................................................... 122
7.4.3 Seismic Unit C ....................................................................................... 124
7.5 Synthesis and conclusion .................................................................................. 125

x
chapter 8 - Depositional history and paleogeography 137
8.1 Introduction ...................................................................................................... 137
8.2 Depositional history and paleogeographic maps .............................................. 137
8.2.1 Sequence 1 ............................................................................................. 141
8.2.2 Sequence 2 ............................................................................................. 141
8.2.3 Sequence 3 ............................................................................................. 142
8.2.4 Sequence 4 ............................................................................................. 143
8.2.5 Sequence 5 ............................................................................................. 144
8.3 Discussion ......................................................................................................... 144
8.3.1 Paleogeography of the Brecknock-Scott Reef Trend ............................. 144
8.3.2 Early to Middle Jurassic rifting in the Browse Basin ............................ 145
chapter 9 - summary and conclusion 149
9.1 Introduction ...................................................................................................... 149
9.2 Depositional setting .......................................................................................... 149
9.3 Delta evolution and paleogeography ................................................................ 151
9.4 Recommendation for future work ..................................................................... 152
references 155
appendix 1 - well data 175
appendix 2 - petrographic descriptions 177
Brecknock-1 ............................................................................................................ 180
Brecknock-2 ............................................................................................................ 195
Brecknock-3 and Brecknock-4 ............................................................................... 221
Calliance-1 .............................................................................................................. 239
Calliance-2 .............................................................................................................. 259
Calliance-3 .............................................................................................................. 285
Brecknock South ..................................................................................................... 317

xi
Summary tables ...................................................................................................... 337
Appendix 3 - Enlarged summary figures 345
appendix 4 - composition of igneous units 359
enclosure 1 - core description and interpretation
enclosure 2 - image log interpretation

xii
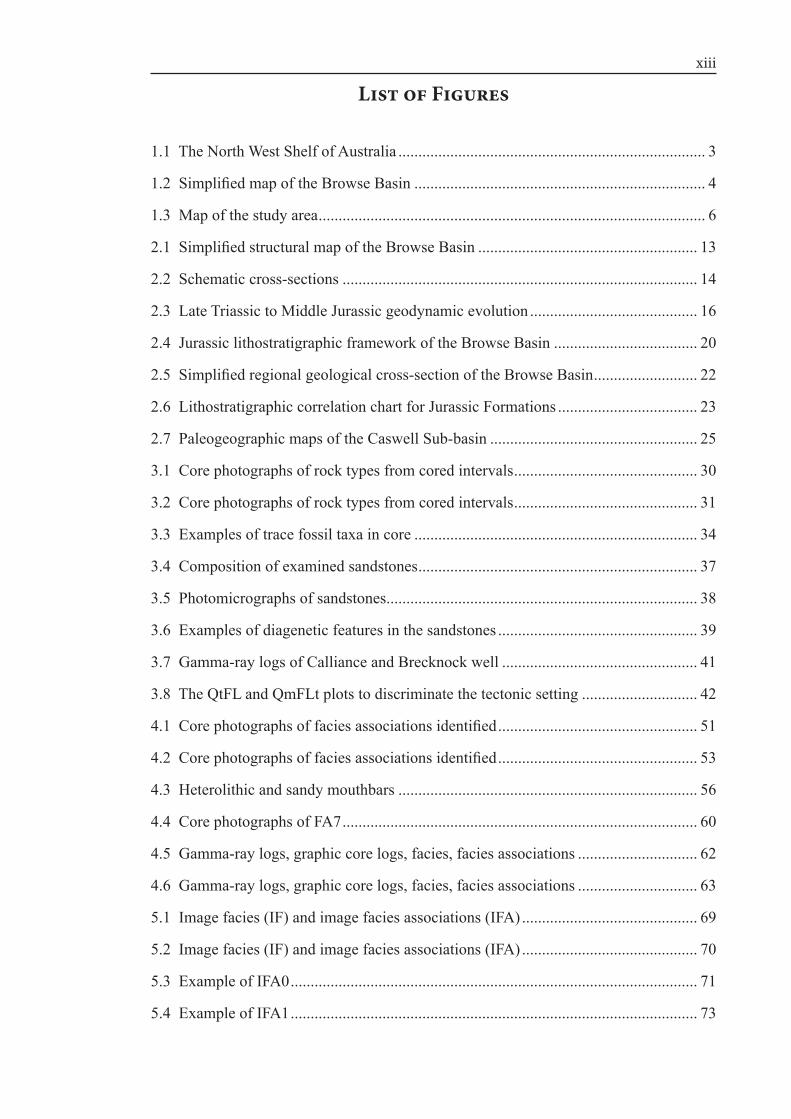
xiii
List of Figures
1.1 The North West Shelf of Australia ............................................................................. 3
1.2 Simplified map of the Browse Basin ......................................................................... 4
1.3 Map of the study area ................................................................................................. 6
2.1 Simplified structural map of the Browse Basin ....................................................... 13
2.2 Schematic cross-sections ......................................................................................... 14
2.3 Late Triassic to Middle Jurassic geodynamic evolution .......................................... 16
2.4 Jurassic lithostratigraphic framework of the Browse Basin .................................... 20
2.5 Simplified regional geological cross-section of the Browse Basin .......................... 22
2.6 Lithostratigraphic correlation chart for Jurassic Formations ................................... 23
2.7 Paleogeographic maps of the Caswell Sub-basin .................................................... 25
3.1 Core photographs of rock types from cored intervals .............................................. 30
3.2 Core photographs of rock types from cored intervals .............................................. 31
3.3 Examples of trace fossil taxa in core ....................................................................... 34
3.4 Composition of examined sandstones ...................................................................... 37
3.5 Photomicrographs of sandstones .............................................................................. 38
3.6 Examples of diagenetic features in the sandstones .................................................. 39
3.7 Gamma-ray logs of Calliance and Brecknock well ................................................. 41
3.8 The QtFL and QmFLt plots to discriminate the tectonic setting ............................. 42
4.1 Core photographs of facies associations identified .................................................. 51
4.2 Core photographs of facies associations identified .................................................. 53
4.3 Heterolithic and sandy mouthbars ........................................................................... 56
4.4 Core photographs of FA7 ......................................................................................... 60
4.5 Gamma-ray logs, graphic core logs, facies, facies associations .............................. 62
4.6 Gamma-ray logs, graphic core logs, facies, facies associations .............................. 63
5.1 Image facies (IF) and image facies associations (IFA) ............................................ 69
5.2 Image facies (IF) and image facies associations (IFA) ............................................ 70
5.3 Example of IFA0 ...................................................................................................... 71
5.4 Example of IFA1 ...................................................................................................... 73
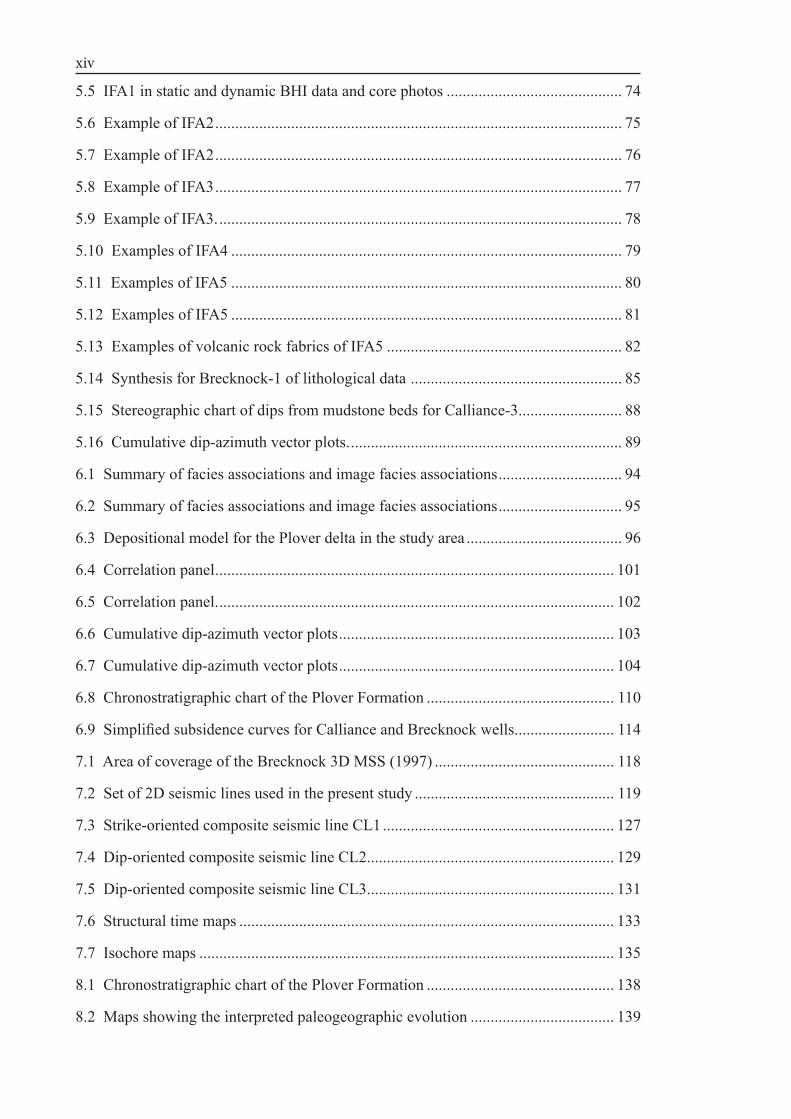
xiv
5.5 IFA1 in static and dynamic BHI data and core photos ............................................ 74
5.6 Example of IFA2 ...................................................................................................... 75
5.7 Example of IFA2 ...................................................................................................... 76
5.8 Example of IFA3 ...................................................................................................... 77
5.9 Example of IFA3. ..................................................................................................... 78
5.10 Examples of IFA4 .................................................................................................. 79
5.11 Examples of IFA5 .................................................................................................. 80
5.12 Examples of IFA5 .................................................................................................. 81
5.13 Examples of volcanic rock fabrics of IFA5 ........................................................... 82
5.14 Synthesis for Brecknock-1 of lithological data ..................................................... 85
5.15 Stereographic chart of dips from mudstone beds for Calliance-3 .......................... 88
5.16 Cumulative dip-azimuth vector plots. .................................................................... 89
6.1 Summary of facies associations and image facies associations ............................... 94
6.2 Summary of facies associations and image facies associations ............................... 95
6.3 Depositional model for the Plover delta in the study area ....................................... 96
6.4 Correlation panel .................................................................................................... 101
6.5 Correlation panel. ................................................................................................... 102
6.6 Cumulative dip-azimuth vector plots ..................................................................... 103
6.7 Cumulative dip-azimuth vector plots ..................................................................... 104
6.8 Chronostratigraphic chart of the Plover Formation ............................................... 110
6.9 Simplified subsidence curves for Calliance and Brecknock wells. ........................ 114
7.1 Area of coverage of the Brecknock 3D MSS (1997) ............................................. 118
7.2 Set of 2D seismic lines used in the present study .................................................. 119
7.3 Strike-oriented composite seismic line CL1 .......................................................... 127
7.4 Dip-oriented composite seismic line CL2. ............................................................. 129
7.5 Dip-oriented composite seismic line CL3. ............................................................. 131
7.6 Structural time maps .............................................................................................. 133
7.7 Isochore maps ........................................................................................................ 135
8.1 Chronostratigraphic chart of the Plover Formation ............................................... 138
8.2 Maps showing the interpreted paleogeographic evolution .................................... 139
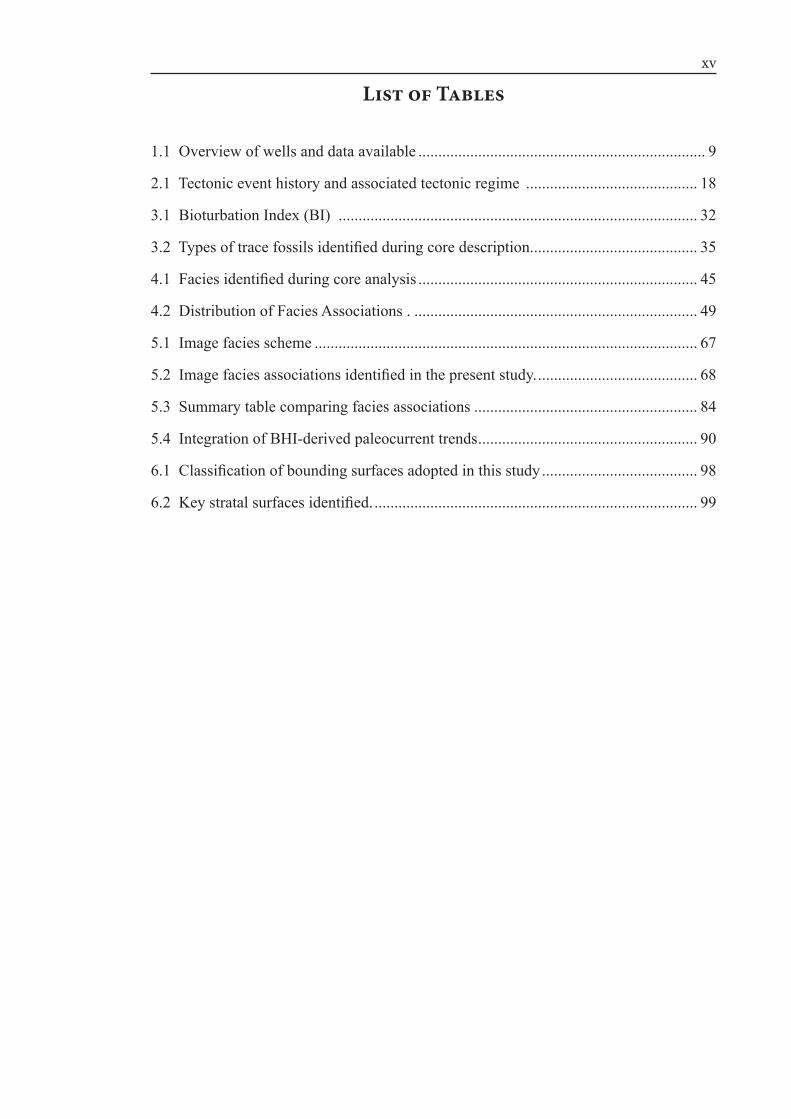
xv
List of Tables
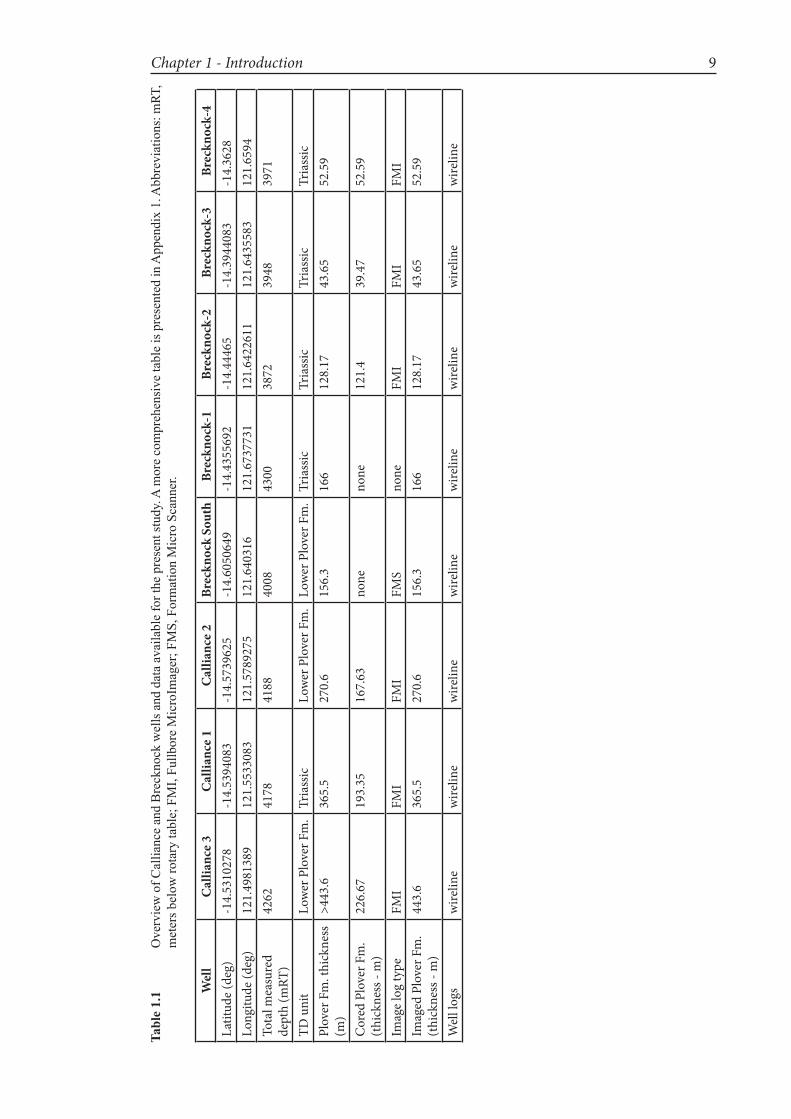
1.1 Overview of wells and data available ........................................................................ 9
2.1 Tectonic event history and associated tectonic regime ........................................... 18
3.1 Bioturbation Index (BI) .......................................................................................... 32
3.2 Types of trace fossils identified during core description. ......................................... 35
4.1 Facies identified during core analysis ...................................................................... 45
4.2 Distribution of Facies Associations . ....................................................................... 49
5.1 Image facies scheme ................................................................................................ 67
5.2 Image facies associations identified in the present study. ........................................ 68
5.3 Summary table comparing facies associations ........................................................ 84
5.4 Integration of BHI-derived paleocurrent trends ....................................................... 90
6.1 Classification of bounding surfaces adopted in this study ....................................... 98
6.2 Key stratal surfaces identified. ................................................................................. 99

xvi
xvii
acknowledgmentS
I would like to gratefully thank my main supervisor, Prof. Annette George, for having
given me the opportunity to come to UWA and do a PhD under her supervision. I also
thank her for the trust and support she had been giving me throughout all the phases of
my project. Without her constructive criticism and her professional editorial advice, this
thesis could have never been as it is now.
Thank you to Dr Jennifer Wadsworth, my external superivisor, for introducing me
to the fascinating world of the image log analysis and for advice on thesis chapters. Thanks
also to W/Prof. Mike Dentith, my co-supervisor, for advice on seismic interpretation
in Chapter 7. A special thanks to Woodside Energy Limited for sponsoring this project
and supplying the seismic and borehole image datas. Among Woodside people, special
thanks to Dr Keith Adamson, Dr Simon Lang, Mr Ben Peterson and Dr Neil Marshall for
vaulable discussions.
I am grateful for additional discussions on topics related to my PhD with
Muhammad Mudasar Saqab, Dr Julien Bourget, Dr Nick Timms, Prof. Bruce Ainsworth,
Prof. Joseph Lambiase and Dr John Backhouse. Thank you also to the technical staff
of the School of Earth and Environment, particularly to Lorraine Wilson and Christine
Riordan. A special thank you to Michael Djohan, for IT support.
Many thanks to my parents, Giannina and Gianfranco, and to my siblings, Tiziano
and Iris, who have been always supportive and emotionally close, in spite of the huge
physical distance which separates us. I would also like to thank Zhenlin Zhang, Shahar
Lazar, Zahra Seyedmehdi, Kirsten Dahl, Yinghui (Cathy) Cao, Carol Butland and Lucy
Layland for the friendship and scientific discussions during my PhD.
Finally, this work was supported by Advanced Logic Technology through provision
of the software WellCAD® which was a valuable tool during many phases of this project.
I also acknowledge the financial support of a UWA Scholarship for International Research
Fees (SIRF) and a University International Stipend (UIS) from the School of Earth and
Environment. Thanks also to Geoconferences and UWA Graduate Research School for
travel awards which allowed me to attend the 2012 AAPG ICE at Long Beach (CA).

xviii
1
Chapter 1 - IntroduCtIon
1.1 Introduction
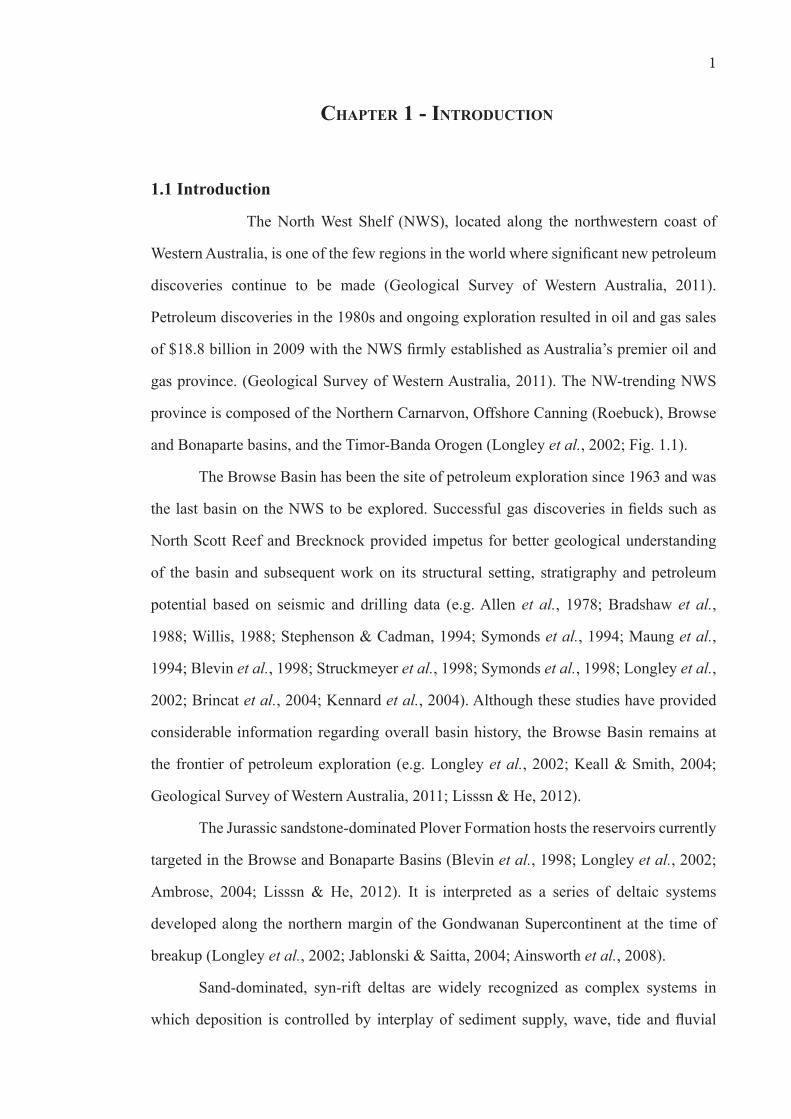
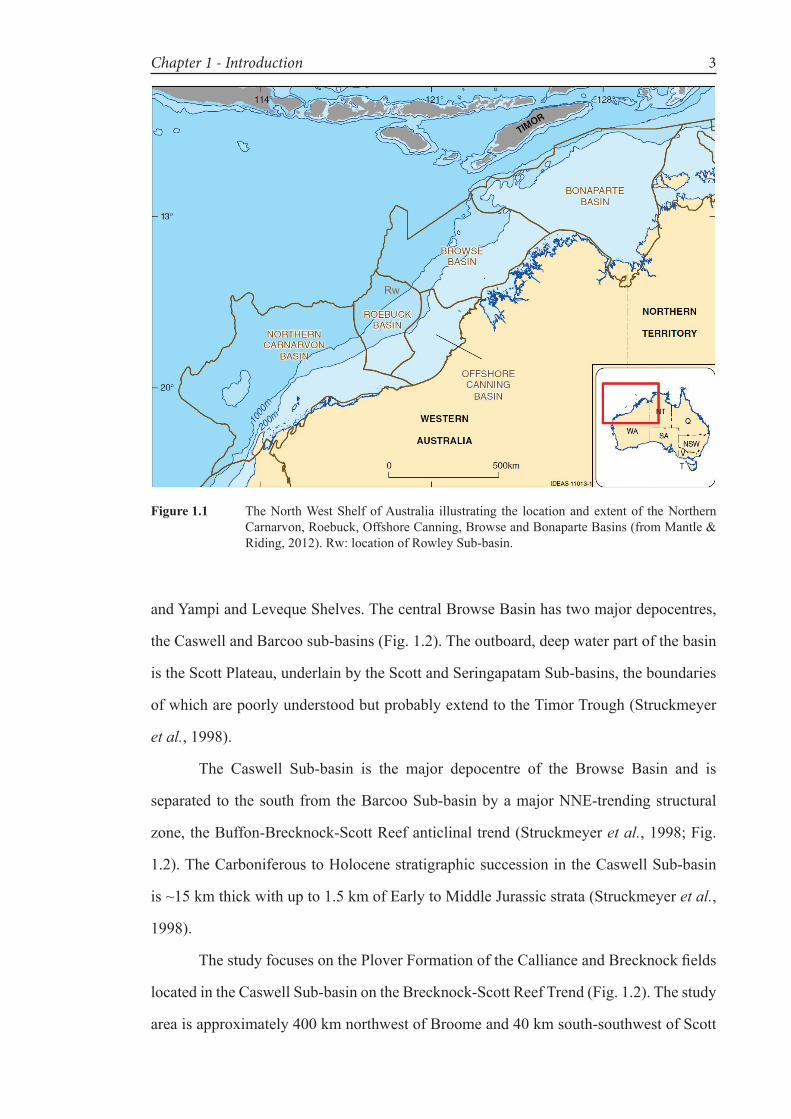
The North West Shelf (NWS), located along the northwestern coast of
Western Australia, is one of the few regions in the world where significant new petroleum
discoveries continue to be made (Geological Survey of Western Australia, 2011).
Petroleum discoveries in the 1980s and ongoing exploration resulted in oil and gas sales
of $18.8 billion in 2009 with the NWS firmly established as Australia’s premier oil and
gas province. (Geological Survey of Western Australia, 2011). The NW-trending NWS
province is composed of the Northern Carnarvon, Offshore Canning (Roebuck), Browse
and Bonaparte basins, and the Timor-Banda Orogen (Longley et al., 2002; Fig. 1.1).
The Browse Basin has been the site of petroleum exploration since 1963 and was
the last basin on the NWS to be explored. Successful gas discoveries in fields such as
North Scott Reef and Brecknock provided impetus for better geological understanding
of the basin and subsequent work on its structural setting, stratigraphy and petroleum
potential based on seismic and drilling data (e.g. Allen et al., 1978; Bradshaw et al.,
1988; Willis, 1988; Stephenson & Cadman, 1994; Symonds et al., 1994; Maung et al.,
1994; Blevin et al., 1998; Struckmeyer et al., 1998; Symonds et al., 1998; Longley et al.,
2002; Brincat et al., 2004; Kennard et al., 2004). Although these studies have provided
considerable information regarding overall basin history, the Browse Basin remains at
the frontier of petroleum exploration (e.g. Longley et al., 2002; Keall & Smith, 2004;
Geological Survey of Western Australia, 2011; Lisssn & He, 2012).
The Jurassic sandstone-dominated Plover Formation hosts the reservoirs currently
targeted in the Browse and Bonaparte Basins (Blevin et al., 1998; Longley et al., 2002;
Ambrose, 2004; Lisssn & He, 2012). It is interpreted as a series of deltaic systems
developed along the northern margin of the Gondwanan Supercontinent at the time of
breakup (Longley et al., 2002; Jablonski & Saitta, 2004; Ainsworth et al., 2008).
Sand-dominated, syn-rift deltas are widely recognized as complex systems in
which deposition is controlled by interplay of sediment supply, wave, tide and fluvial
Introduction - Chapter 12
processes and active tectonics (e.g. Ravnås & Steel, 1998; Bhattacharya, 2006; Gani &
Bhattacharya, 2007; Dalrymple & Choi, 2007; Ainsworth et al., 2011). Understanding
the internal stratigraphic architecture of these systems is critical to a proper assessment
of reservoir architecture and potential development of reservoir models. In the case of
the Plover Formation in the Browse Basin, relatively little has been published on its
stratigraphic architecture and evolution (e.g. Stephenson & Cadman, 1994; Blevin et
al.,1998; Keall & Smith, 2004; Ainsworth et al., 2008). Moreover, the relative scarcity
and uneven distribution of wells in the Browse Basin, with respect to its large size, means
that confident spatial correlation of the various sand bodies (i.e. potential reservoirs) has
been limited to date. A much better understanding of paleogeographic evolution during
deposition of the Plover Formation is, therefore, needed (Blevin et al., 1998; Longley et
al., 2002 ).
Finally, many studies highlighted similarities in the stratigraphic evolution of
large deltaic systems developed during rifting (e.g. Ravnås & Steel, 1998; Lambiase &
Morley, 1999; Young et al., 2002). This means that the knowledge gained from a thorough
study of a large system like that of the Plover Formation has the potential to be useful to
better understand the evolution of other synrift deltaic systems of interest in petroleum
exploration.
1.2 Location of study area
The Browse Basin lies entirely offshore in the southern Timor Sea region, over an
area of approximately 140,000 km2 (Hocking et al., 1994; Baillie et al., 1994 Struckmeyer
et al., 1998; Fig. 1.1). Major regions surrounding the Browse Basin are the Kimberley
Craton to the east and the Argo Abyssal Plain to the west (Fig. 1.2). The basin is contiguous
with the Rowley Sub-basin to the southwest (Fig. 1.1) and with the Ashmore Platform,
Vulcan Sub-basin and Londonderry High of the Bonaparte Basin to the northeast (Fig.
1.2).
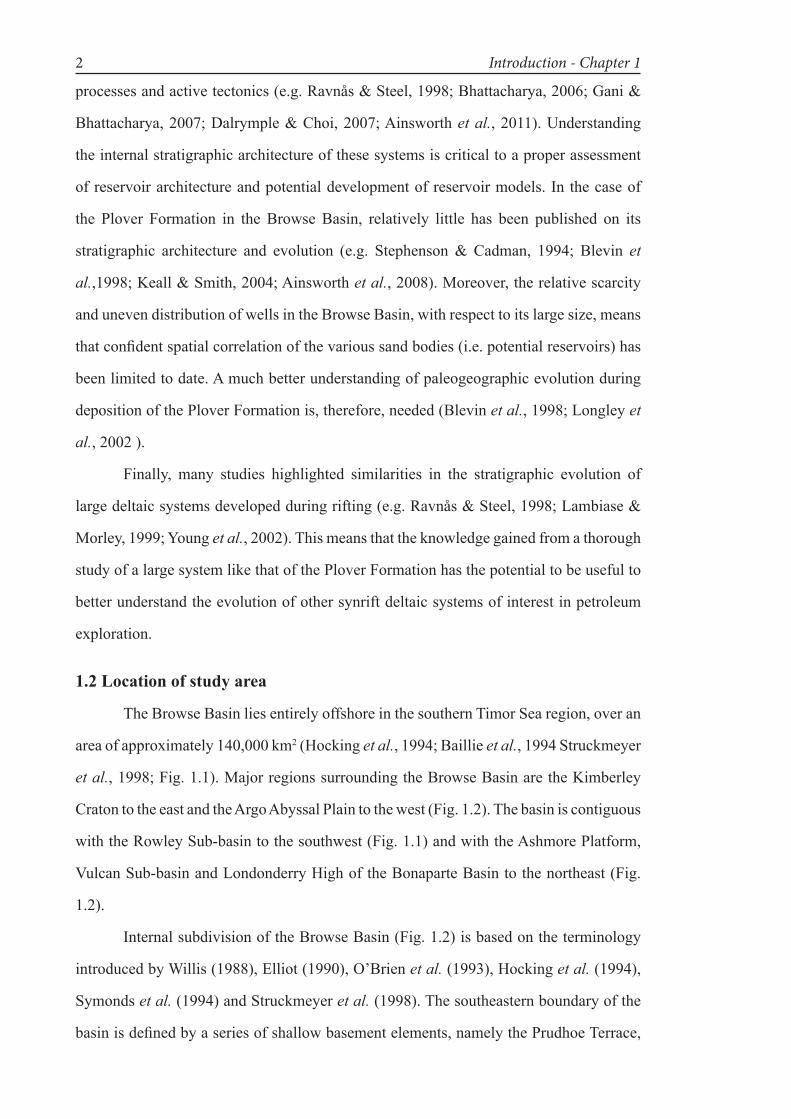
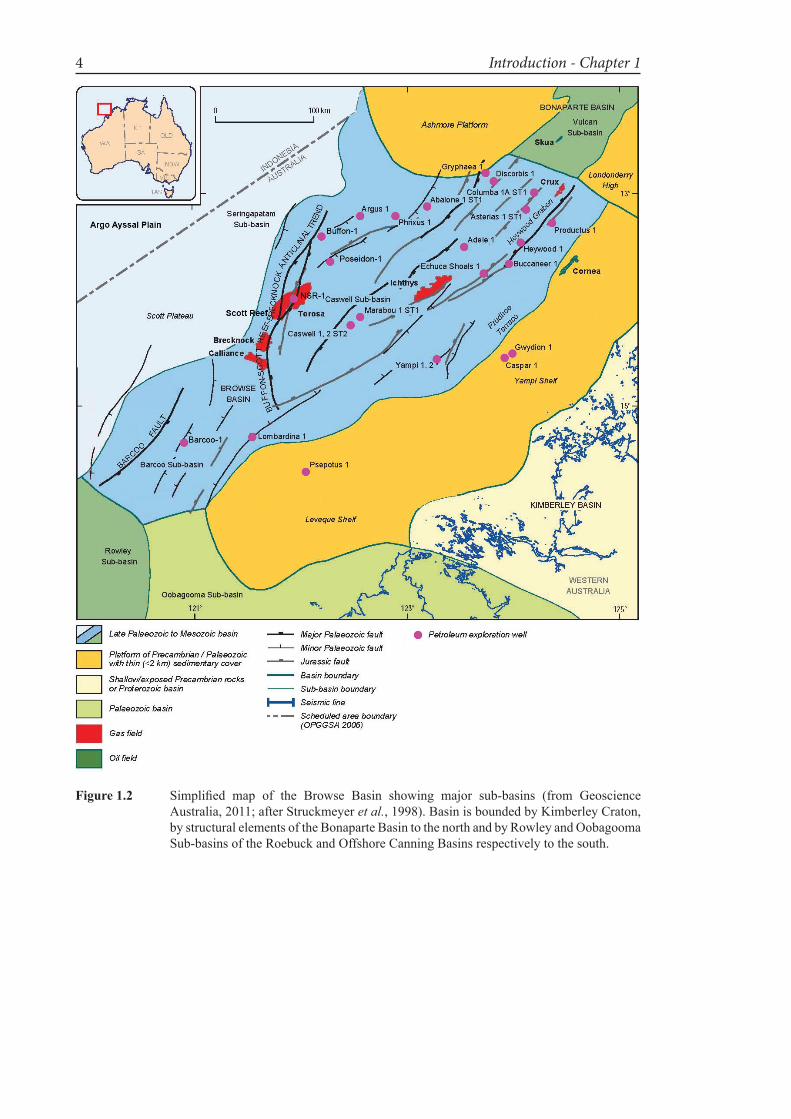
Internal subdivision of the Browse Basin (Fig. 1.2) is based on the terminology
introduced by Willis (1988), Elliot (1990), O’Brien et al. (1993), Hocking et al. (1994),
Symonds et al. (1994) and Struckmeyer et al. (1998). The southeastern boundary of the
basin is defined by a series of shallow basement elements, namely the Prudhoe Terrace,
Chapter 1 - Introduction 3
Figure 1.1 The North West Shelf of Australia illustrating the location and extent of the Northern Carnarvon, Roebuck, Offshore Canning, Browse and Bonaparte Basins (from Mantle & Riding, 2012). Rw: location of Rowley Sub-basin.
and Yampi and Leveque Shelves. The central Browse Basin has two major depocentres,
the Caswell and Barcoo sub-basins (Fig. 1.2). The outboard, deep water part of the basin
is the Scott Plateau, underlain by the Scott and Seringapatam Sub-basins, the boundaries
of which are poorly understood but probably extend to the Timor Trough (Struckmeyer
et al., 1998).
The Caswell Sub-basin is the major depocentre of the Browse Basin and is
separated to the south from the Barcoo Sub-basin by a major NNE-trending structural
zone, the Buffon-Brecknock-Scott Reef anticlinal trend (Struckmeyer et al., 1998; Fig.
1.2). The Carboniferous to Holocene stratigraphic succession in the Caswell Sub-basin
is ~15 km thick with up to 1.5 km of Early to Middle Jurassic strata (Struckmeyer et al.,
1998).
The study focuses on the Plover Formation of the Calliance and Brecknock fields
located in the Caswell Sub-basin on the Brecknock-Scott Reef Trend (Fig. 1.2). The study
area is approximately 400 km northwest of Broome and 40 km south-southwest of Scott
Rw
Introduction - Chapter 14
Figure 1.2 Simplified map of the Browse Basin showing major sub-basins (from Geoscience Australia, 2011; after Struckmeyer et al., 1998). Basin is bounded by Kimberley Craton, by structural elements of the Bonaparte Basin to the north and by Rowley and Oobagooma Sub-basins of the Roebuck and Offshore Canning Basins respectively to the south.
Chapter 1 - Introduction 5
Reef, on the edge of the Australian continental shelf (Fig. 1.2).
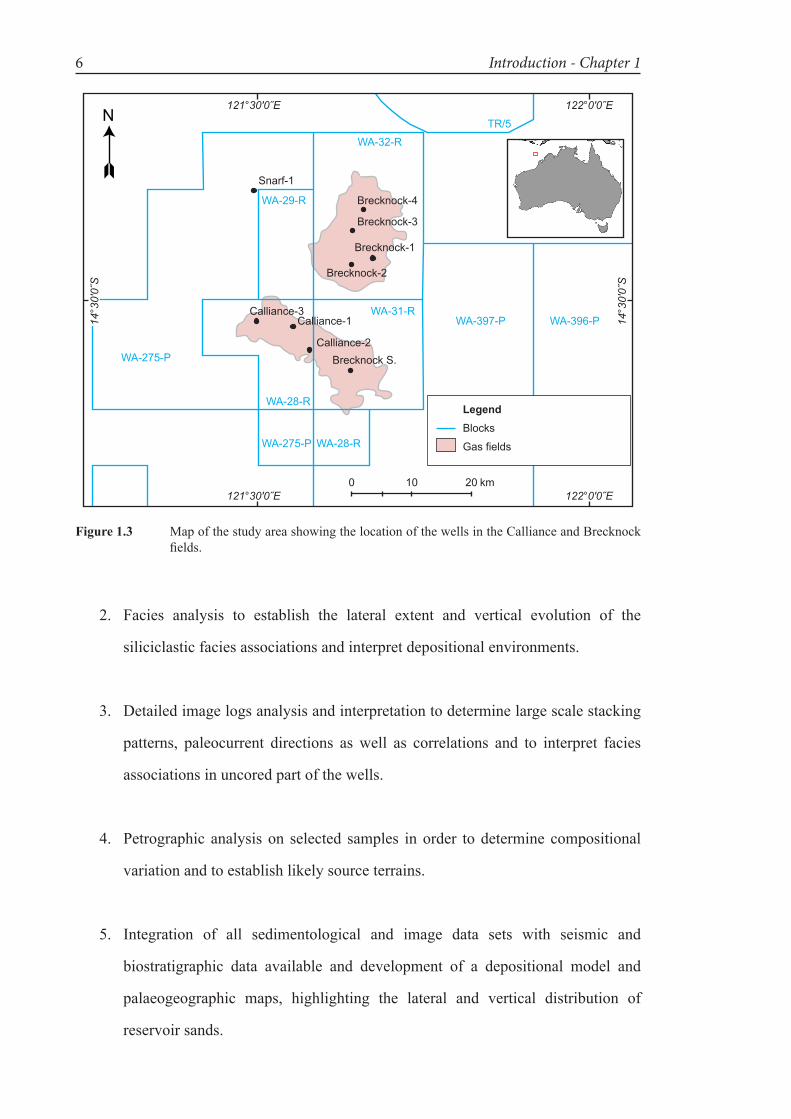
Brecknock and Calliance fields consist of four wells each and are operated by
Woodside Energy Limited and their joint venture partners (Fig. 1.3). Brecknock field was
discovered in 1979, with the well Brecknock-1, whereas Calliance field was discovered
in 2000 after drilling of Brecknock South-1. The Plover Formation was the main target
and was intersected in both fields at a depth varying from 3830 to 3900 m below Rotary
Table (mRT) (Tab1e 1.1).
Seismic data show that the target structures for both fields are faulted anticlines.
The Plover Formation in Calliance field is approximately 200-450 m thick, whereas in
Brecknock field it is approximately 50-130 m thick. In Calliance field, Calliance-1 is the
only well that intersects the entire thickness of the Plover Formation. The other wells
(Calliance-2, Calliance-3 and Brecknock South) reach different depths within the lower
part of the formation. In contrast, in Brecknock field all the wells reach and penetrate
the Triassic strata (>20 m). No core was taken in Brecknock-1 and Brecknock South,
whereas in Brecknock-2 and -3 core stops before reaching the top of the Formation. Core
from Brecknock -4 encompasses the whole Formation thickness, although in this well
the uppermost part of the Formation is truncated by a fault. Cores from Calliance wells
encompass only the upper 167-226 m of the Formation, leaving the lower part uncored.
1.3 Objective and aims
A detailed study of the stratigraphy and sedimentology of the Plover Formation
in two Browse Basin fields is the focus of this thesis. The objective is to establish the
depositional history and paleogeographic evolution of the Jurassic deltaic system on the
Brecknock-Scott Reef Trend, on the western margin of the Caswell Sub-basin. Integration
of datasets such as core, image and wireline log data and seismic data represents a
key factor in this project. To fulfil the project objective, the following aims have been
identified.
1. Detailed logging of drill cores to identify stacking patterns and key stratal
surfaces, and to characterize the igneous and volcaniclastic intervals.
Introduction - Chapter 16
WA-275-P
WA-28-R
WA-275-P WA-28-R
WA-397-PWA-31-R
WA-396-P
WA-29-R
WA-32-R
TR/5
Calliance-3Calliance-1
Calliance-2Brecknock S.
Brecknock-2
Brecknock-1
Brecknock-3
Brecknock-4
Snarf-1
0 10 20 km121°30'0˝E 122°0'0˝E
121°30'0˝E 122°0'0˝E
14°30'0˝S
14°30'0˝S
N
LegendBlocks
Gas fields
Figure 1.3 Map of the study area showing the location of the wells in the Calliance and Brecknock fields.
2. Facies analysis to establish the lateral extent and vertical evolution of the
siliciclastic facies associations and interpret depositional environments.
3. Detailed image logs analysis and interpretation to determine large scale stacking
patterns, paleocurrent directions as well as correlations and to interpret facies
associations in uncored part of the wells.
4. Petrographic analysis on selected samples in order to determine compositional
variation and to establish likely source terrains.
5. Integration of all sedimentological and image data sets with seismic and
biostratigraphic data available and development of a depositional model and
palaeogeographic maps, highlighting the lateral and vertical distribution of
reservoir sands.
Chapter 1 - Introduction 7
1.4 Materials and Methods
This study integrates sedimentological analysis of drillcore (providing direct
physical information) and interpretation of borehole image log (BHI) which enables
broader interpretation of uncored intervals in wells (e.g. Bourke, 1992; Bal et al., 2002;
Xu et al., 2009; Prosser et al., 1999; Donselaar & Schmidt, 2005). Similar studies that
integrate image logs with other geological and geophysical datasets have been undertaken
and the importance of image logs as a powerful interpretation tool has been highlighted
(e.g. Russel et al., 2002; Khan et al., 2004; Prioul & Jocker, 2009; Lacazette, 2009).
However, the complexity of image signal can easily lead to over- or mis-interpretation
(e.g. Xu, 2007; Slatt & Davis, 2010) and effective interpretation of image facies in
uncored wells remains problematic. Seven wells in the Calliance and Brecknock fields
of the Browse Basin have good quality BHI through a significant thickness of Plover
Formation (Table 1.1). These data provide an excellent opportunity to investigate the
value of image log analysis and its application to uncored intervals through definition of
image facies and image associations directly comparable to those defined from core.
Integration of well data with biostratigraphic and seismic data is also used in
this study to strengthen the interpretation and to extend the correlation between fields.
This approach has been proven valuable in other studies aimed to establish a sequence-
stratigraphic framework as a basis for paleogeographic reconstruction (e.g. Krassay &
Totterdel, 2003; Snedden & Sarg, 2008).
An important aspect considered was the quality of the data available, with
particular reference to image logs and cored intervals. Open file data from Department
of Mines and Petroleum (DMP) were used in this project. These include core photos and
well completions reports.
1.4.1 Core description and facies analysis
Descriptions of cored intervals in Calliance-1, Calliance-2 and Calliance-3 and
Brecknock-2, Brecknock -3 and Brecknock -4 (732 m total length) were undertaken at
Department of Mines and Petroleum Core Library, in Carlisle, Perth, using a logging
scale of 1:50 and WellCAD® software to record observations. Side-wall core were
Introduction - Chapter 18
examined where core was not available (Brecknock-1). Core was logged to document
sedimentological and ichnological features and then, facies analysis and identification
of important stratal surfaces was carried out. Facies analysis has been used to interpret
depositional environments for reconstruction of the deltaic system. Particular attention
has been paid to identification of unconformities and other important stratal surfaces for
intra- and inter-field correlations between wells in a field and between fields.
1.4.2 Image log analysis
Good to excellent quality borehole image (BHI) logs from Calliance and
Brecknock wells, provided by Woodside Energy Limited (WEL), were analysed in order
to extend facies analysis to uncored part of the wells via identification of image facies
and to extract paleocurrent information. Image analysis was performed on Fullbore
Formation MicroImager (FMI) logs from Brecknock-2, -3, -4, Calliance-1, -2, and -3, and
on a Formation MicroScanner (FMS) log from Brecknock South. Following conventional
analytical procedure for image logs (e.g. Bourke, 1992; Rider, 2002; Donselaar & Schmidt,
2005), both statically and dynamically normalized images were analysed and interpreted
using Recall® software at WEL, in conjunction with interpretation of a standard suite of
open-hole wireline logs (e.g. gamma-ray, neutron-porosity, density, photoelectric factor).
Core and wireline log data were used to calibrate the statically normalised image
logs. Identification of image lithology was undertaken on the basis of direct observation
on core and defined by the signatures of a number of wireline logs. Where cored material
was not available, log responses were used to discriminate lithology. Identification of
image fabric, i.e. the spatial arrangement and orientation of the elements or ‘features’
of a borehole image (Bal at al., 2002), may be locally subjective (e.g. Slatt and Davis,
2010) so broad classes of features have been used in this study to minimise potential
over-interpretation. The magnetometer data from the FMI orientation sonde was useful
for identifying magnetic anomalies associated with igneous rock types.
Bedding surfaces, cross-bedding and other planar features visible in borehole
images were manually picked, classified and interpreted using Recall® software. Structural
tilt has been determined by analysing dips from imaged mudstone intervals as the best
Chapter 1 - Introduction 9
Tabl
e 1.
1 O
verv
iew
of C
allia
nce
and
Bre
ckno
ck w
ells
and
dat
a av
aila
ble
for t
he p
rese
nt st
udy.
A m
ore
com
preh
ensi
ve ta
ble
is p
rese
nted
in A
ppen
dix
1. A
bbre
viat
ions
: mRT
, m
eter
s bel
ow ro
tary
tabl
e; F
MI,
Fullb
ore
Mic
roIm
ager
; FM
S, F
orm
atio
n M
icro
Sca
nner
.
Wel
lC
allia
nce
3C
allia
nce
1C
allia
nce
2Br
eckn
ock
Sout
hBr
eckn
ock-
1Br
eckn
ock-
2Br
eckn
ock-
3Br
eckn
ock-
4La
titud
e (d
eg)
-14.
5310
278
-14.
5394
083
-14.
5739
625
-14.
6050
649
-14.
4355
692
-14.
4446
5-1
4.39
4408
3-1
4.36
28Lo
ngitu
de (d
eg)
121.
4981
389
121.
5533
083
121.
5789
275
121.
6403
1612
1.67
3773
112
1.64
2261
112
1.64
3558
312
1.65
94To
tal m
easu
red
dept
h (m
RT)
4262
4178
4188
4008
4300
3872
3948
3971
TD u
nit
Low
er P
love
r Fm
.Tr
iass
icLo
wer
Plo
ver F
m.
Low
er P
love
r Fm
.Tr
iass
icTr
iass
icTr
iass
icTr
iass
icPl
over
Fm
. thi
ckne
ss
(m)
>443
.636
5.5
270.
615
6.3
166
128.
1743
.65
52.5
9
Cor
ed P
love
r Fm
. (t
hick
ness
- m
)22
6.67
193.
3516
7.63
none
none
121.
439
.47
52.5
9
Imag
e lo
g ty
peFM
IFM
IFM
IFM
Sno
neFM
IFM
IFM
IIm
aged
Plo
ver F
m.
(thi
ckne
ss -
m)
443.
636
5.5
270.
615
6.3
166
128.
1743
.65
52.5
9
Wel
l log
sw
irelin
ew
irelin
ew
irelin
ew
irelin
ew
irelin
ew
irelin
ew
irelin
ew
irelin
e
Introduction - Chapter 110
indicators of deposition on an approximately horizontal surface. Abnormally steep dip
values were subtracted where required to correct post-depostional deformation. Structural
tilt correction was needed only for the lower part of Calliance-3, where 2.7° (dip) and
250° (azimuth) were subtracted to the interval from 4036 m to 4259 m. Dips of cross-beds
>5º from imaged sandstone intervals from each well have been used to generate statistical
plots, e.g. rose plots and azimuth vector plots (walkout plots), to determine mean azimuths
and, subsequently, unimodal, bimodal/bipolar or polymodal data distributions.
1.4.3 Petrographic analysis
Petrographic analysis of selected sandstones was undertaken to describe detrital
composition and to determine sediment provenance. Existing sandstone thin sections
from wells (held by WA Department of Mines and Petroleum) were examined using
conventional petrological microscopy (Nikon 50i polarising microscope with Nikon
camera attachment and image capture software).
1.4.4 Seismic analysis
Forty-four 2D seismic reflection lines from Brecknock 3D MSS (1997) and
Brecknock South 3D MSS (1999) surveys, covering an area of 1800 Km2, were collected
from Woodside Energy Limited and analysed using Kingdom Suite®. Seismic interpretation
was used to identify larger scale stratal geometry and highlight the paleotopography at the
time of Plover deposition. Depth structure maps and isochore maps were constructed and
used as a base for the paleogeographic maps.
1.4.5 Biostratigraphy
Biostratigraphic data from the wells is provided in well completion reports on
WAPIMS. Data were incorporated in this study to build correlations based on coeval
ages of strata. The biostratigraphic zonations adopted is based on Helby et al. (2004),
Partridge (2006) and Riding et al. (2010).
Chapter 1 - Introduction 11
1.5 Thesis organization
Following this introductory chapter, Chapter 2 presents a summary of the regional
geological framework. Chapter 3 presents a sedimentological overview of the core material
and petrographic results on selected thin sections. It also represents an introduction to
Chapter 4, which presents the results of the facies analysis of the cored intervals. The
results of image log analysis are presented in Chapter 5. Interpretations derived from
integration of results in previous chapters with biostratigraphic data are used to construct
the sequence-stratigraphic framework for the Plover Formation in the study area. Chapter
7 contains the results of the analysis of seismic data and is followed, in Chapter 8, by the
proposed depositional model and related paleogeographic maps for key time intervals.
Finally, Chapter 9 presents the conclusions of this study and recommendations for future
work.

13
Chapter 2 - regional Setting
2.1 Introduction
The Browse Basin formed as an intracratonic basin during the Late Carboniferous
to Early Permian in response to rifting and formation of the Westralian Superbasin (Yeates
et al., 1987; Longley et al., 2002). It remained a discrete basin until the end of the Early
Cretaceous when its western margin subsided (Willis, 1988; Symonds et al., 1994). The
whole basin was then overlain by widespread deposition of transgressive sediments during
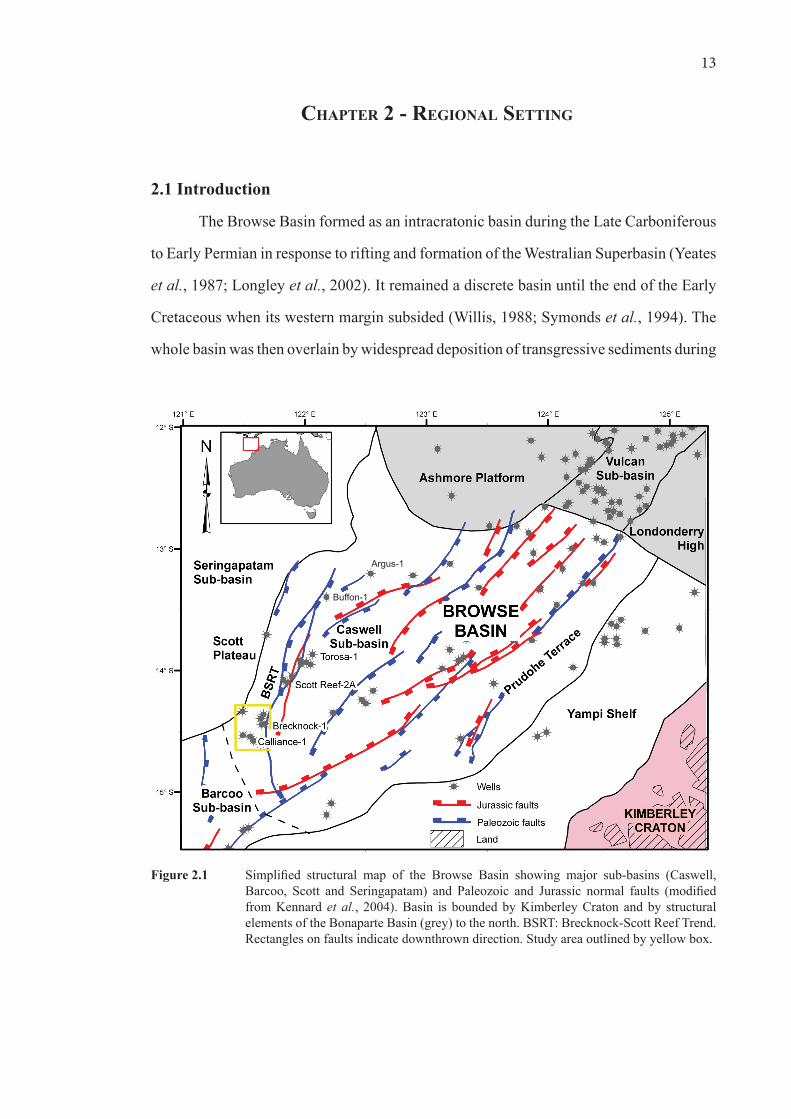
Figure 2.1 Simplified structural map of the Browse Basin showing major sub-basins (Caswell,Barcoo, Scott and Seringapatam) and Paleozoic and Jurassic normal faults (modifiedfrom Kennard et al., 2004). Basin is bounded by Kimberley Craton and by structural elementsoftheBonaparteBasin(grey)tothenorth.BSRT:Brecknock-ScottReefTrend.Rectangles on faults indicate downthrown direction. Study area outlined by yellow box.
Argus-1
Buffon-1
Regional setting - Chapter 214
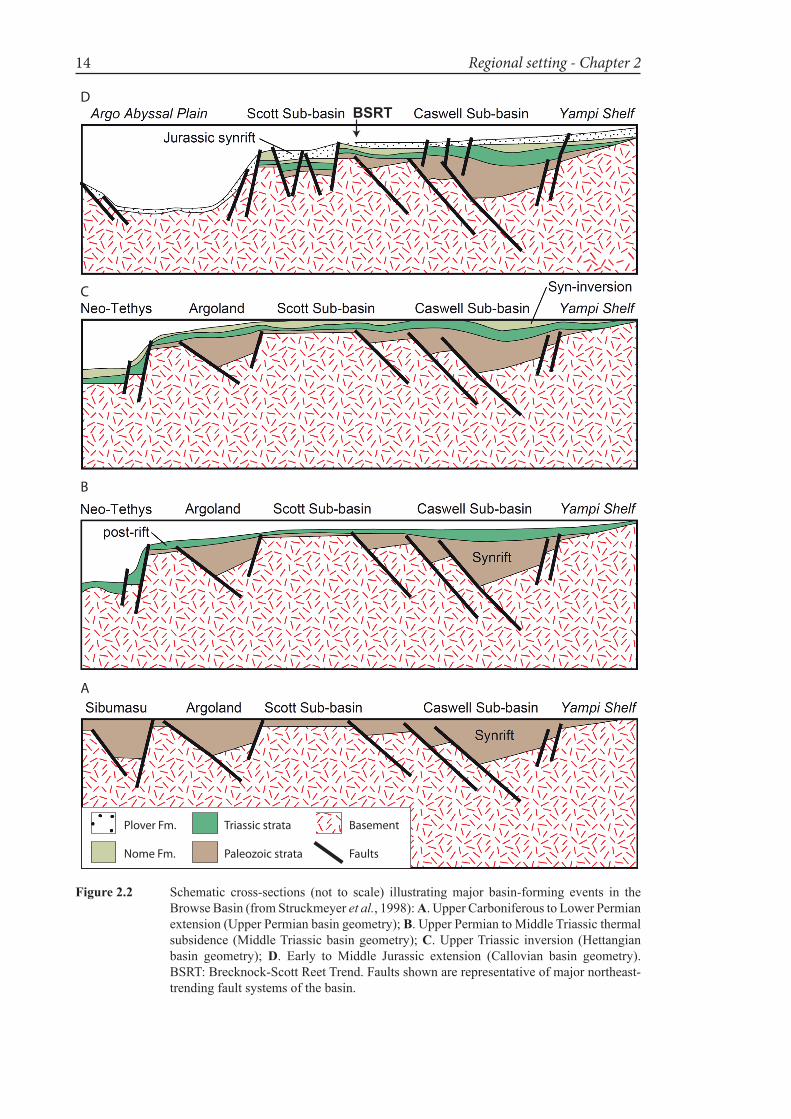
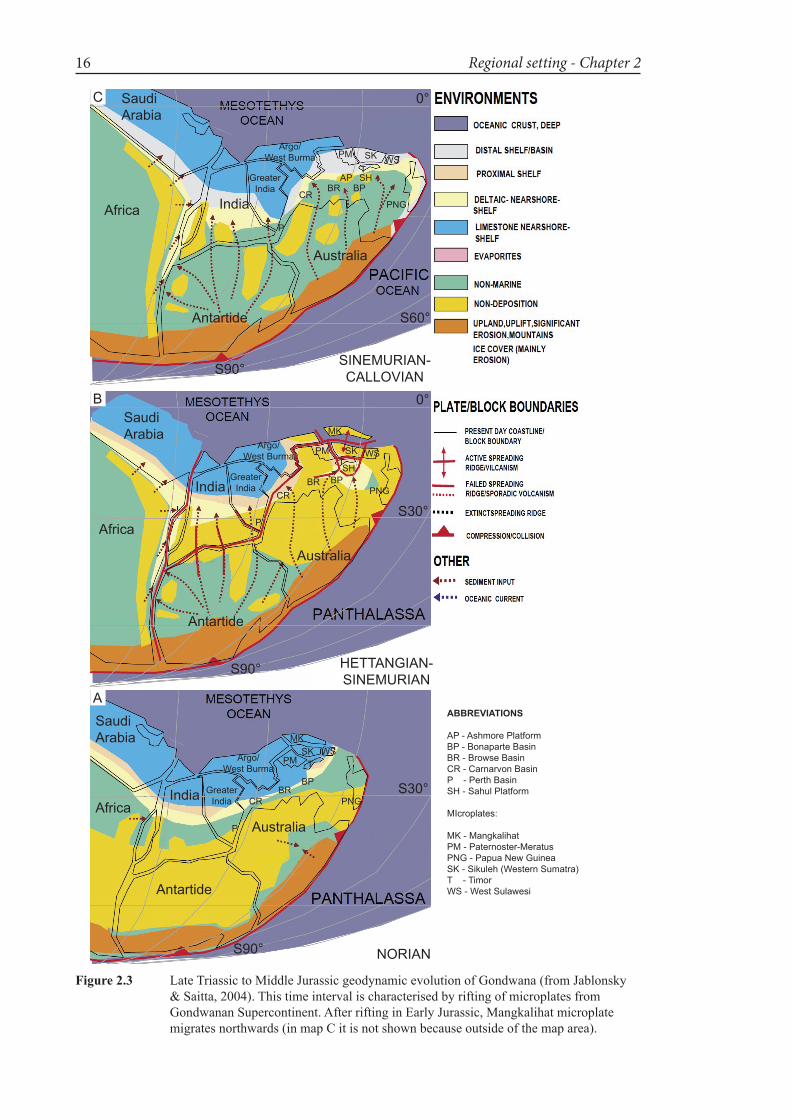
Figure 2.2 Schematic cross-sections (not to scale) illustratingmajor basin-forming events in theBrowse Basin (from Struckmeyer et al., 1998): A. Upper Carboniferous to Lower Permian extension (Upper Permian basin geometry); B. Upper Permian to Middle Triassic thermal subsidence (Middle Triassic basin geometry); C. Upper Triassic inversion (Hettangian basin geometry); D. Early to Middle Jurassic extension (Callovian basin geometry). BSRT:Brecknock-ScottReetTrend.Faultsshownarerepresentativeofmajornortheast-trending fault systems of the basin.
C
B
A
Plover Fm.
Faults
Basement
Nome Fm.
Triassic strata
Paleozoic strata
DBSRT
Chapter 2 - Regional setting 15
the Cretaceous. Since the Cenozoic carbonate strata have prograded over the entire region
to form the present continental shelf (Willis, 1988).
Thischapterprovidesanoverviewof thetectono-stratigraphicevolutionof the
Browse Basin and the Early to Middle Jurassic paleoclimate. The Jurassic depositional
historyfocusesontheCaswellSub-basinwithemphasisonthePloverFormation.
2.2 Paleozoic extension
The Paleozoic history of the basin is characterized by an overall extensional regime
related to a series of breakups and rifting of various microplates from the Gondwanan
Supercontinent (Li & Powell, 2001; Jablonski & Saitta, 2004; Metcalfe, 2011 and earlier
references therein).Paleozoic extensional events formed anoverall northeast-trending
structuralgraincharacterisedbyeast-andsoutheast-dippingnormalfaultsandledtothe
generationofthemainsub-basins(Struckmeyeret al., 1998; Jablonski & Saitta, 2004;
Figs2.1and2.2).IntheouterScottPlateauthisextensionalregimeresultedinWNW-to
northwest-trendingfaults(Exon&Stagg,1981).
TheCarboniferoustoPermiansedimentaryfillofthebasinhasbeenestimatedto
be at least 8 to 10 km thick (Struckmeyer et al., 1998). However, due to of the paucity of
available data, the Paleozoic stratigraphy remains poorly constrained. Interpretation of
wellandseismicdatasuggeststhatafluvio-deltaictomarinesuccessionwasdepositedin
the central part of the basin during this time interval (Blevin et al., 1998).
2.3 Triassic inversion
The Late Permian to Early Triassic period was characterized by relative tectonic
quiescence and open marine sedimentation in the central part of the basin. Inversion
tookplaceintheearlyNorian,relatedtotheFitzroyMovementandBowenOrogenyand
causedtranspressionalmovementsandreactivationandinversionofpre-existingfaults
(Fig. 2.2). This event generated northeast-trending folds that dominate theMesozoic
structural setting of the basin. Coincident uplift led to the development of a regional
unconformity (Trmid/ TRC1; Struckmeyer et al., 1998; Jablonski & Saitta, 2004; Table
2.1).Northeast-trendingnormalfaultsdevelopedinthecentralBrowseBasinandalong
Regional setting - Chapter 216
Australia
SaudiArabia
IndiaAfrica
Antartide
Argo/West Burma
MKSK
PM TWS
BPBR
CR PNGGreater
India
P
NORIAN
SINEMURIAN-CALLOVIAN
S30°
S90°
S60°
S90°
0°
Australia
SaudiArabia
India
Africa
Antartide
Argo/West Burma
MK
SKPMT
WS
BPBRCR PNG
GreaterIndia
P
HETTANGIAN-SINEMURIAN
SH
S30°
S90°
0°
Australia
SaudiArabia
IndiaAfrica
Antartide
Argo/West Burma
AP
SKPMT
WS
BPBRCR
PNG
GreaterIndia
P
SH
ABBREVIATIONS
AP - Ashmore PlatformBP - Bonaparte BasinBR - Browse BasinCR - Carnarvon BasinP - Perth BasinSH - Sahul Platform
MIcroplates:
MK - MangkalihatPM - Paternoster-MeratusPNG - Papua New GuineaSK - Sikuleh (Western Sumatra)T - TimorWS - West Sulawesi
C
B
A
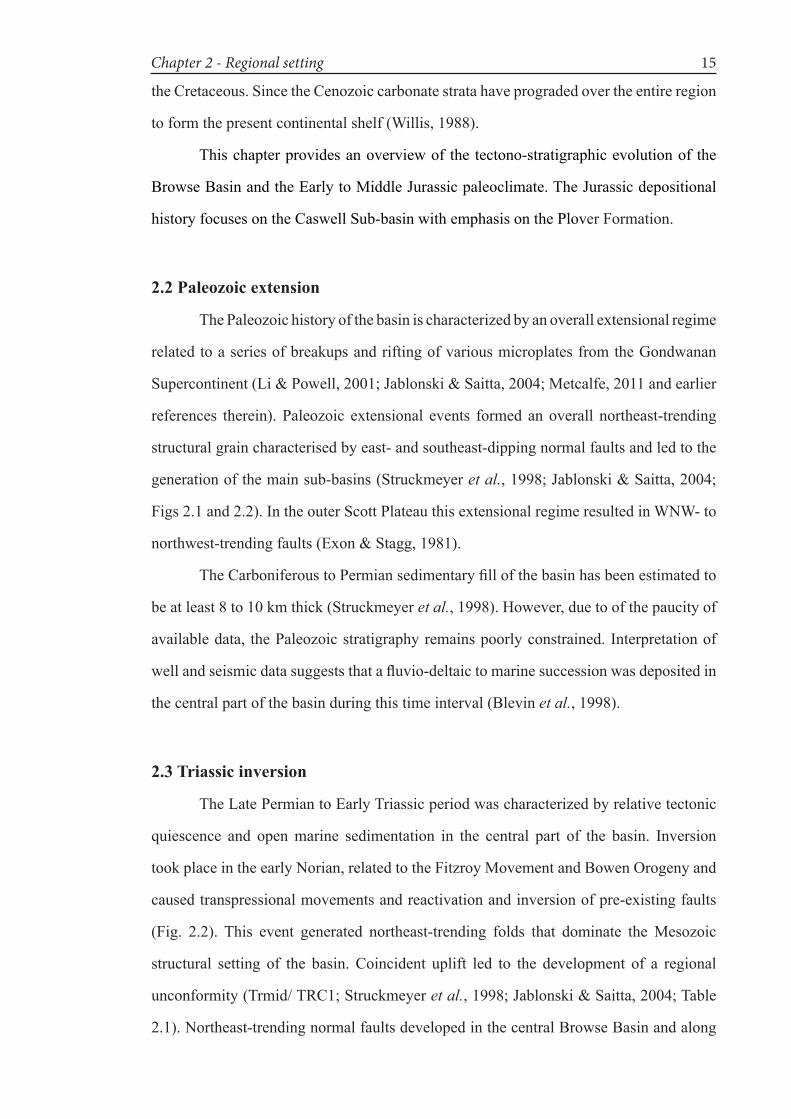
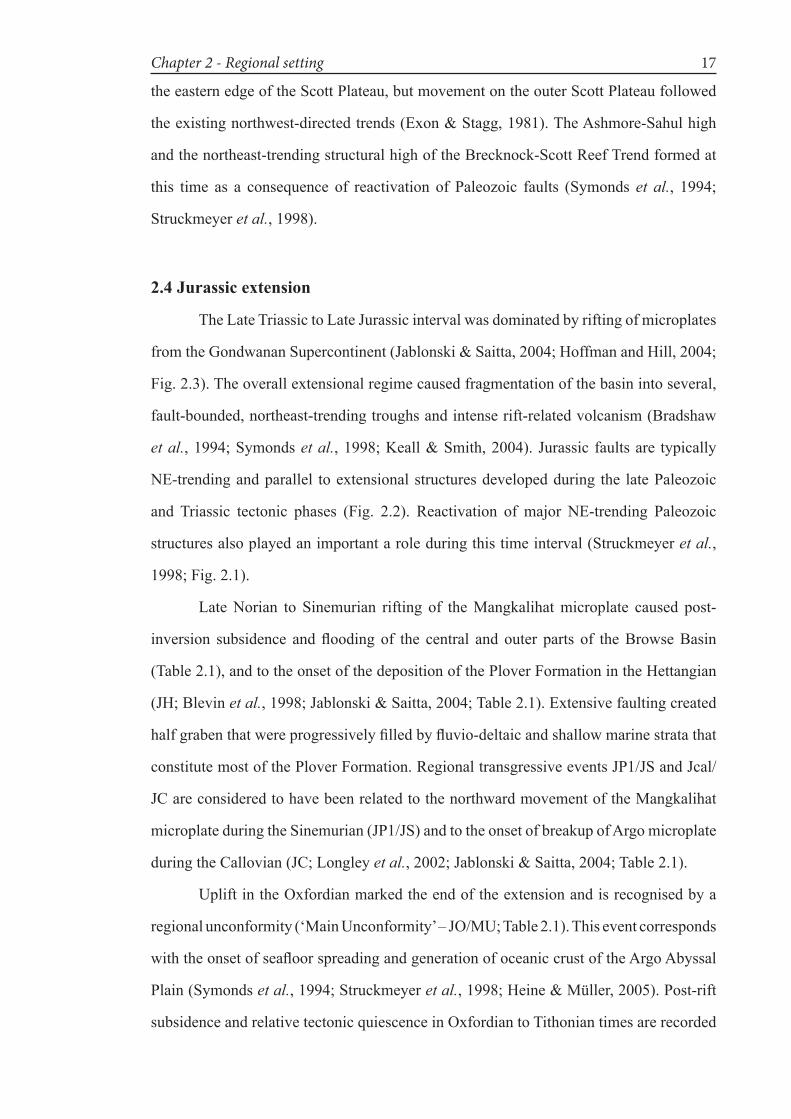
Figure 2.3 Late Triassic to Middle Jurassic geodynamic evolution of Gondwana (from Jablonsky & Saitta, 2004). This time interval is characterised by rifting of microplates from Gondwanan Supercontinent. After rifting in Early Jurassic, Mangkalihat microplate migrates northwards (in map C it is not shown because outside of the map area).
Chapter 2 - Regional setting 17
the eastern edge of the Scott Plateau, but movement on the outer Scott Plateau followed
theexistingnorthwest-directedtrends(Exon&Stagg,1981).TheAshmore-Sahulhigh
andthenortheast-trendingstructuralhighoftheBrecknock-ScottReefTrendformedat
this time as a consequence of reactivation of Paleozoic faults (Symonds et al., 1994;
Struckmeyer et al., 1998).
2.4 Jurassic extension
The Late Triassic to Late Jurassic interval was dominated by rifting of microplates
from the Gondwanan Supercontinent (Jablonski & Saitta, 2004; Hoffman and Hill, 2004;
Fig.2.3).Theoverallextensionalregimecausedfragmentationofthebasinintoseveral,
fault-bounded,northeast-trendingtroughsandintenserift-relatedvolcanism(Bradshaw
et al., 1994; Symonds et al., 1998; Keall & Smith, 2004). Jurassic faults are typically
NE-trendingandparallel toextensionalstructuresdevelopedduring the latePaleozoic
and Triassic tectonic phases (Fig. 2.2). Reactivation of major NE-trending Paleozoic
structures also played an important a role during this time interval (Struckmeyer et al.,
1998;Fig.2.1).
LateNorian to Sinemurian rifting of theMangkalihatmicroplate caused post-
inversion subsidence andflooding of the central and outer parts of theBrowseBasin
(Table2.1),andtotheonsetofthedepositionofthePloverFormationintheHettangian
(JH; Blevin et al., 1998; Jablonski & Saitta, 2004; Table 2.1). Extensive faulting created
halfgrabenthatwereprogressivelyfilledbyfluvio-deltaicandshallowmarinestratathat
constitutemostofthePloverFormation.RegionaltransgressiveeventsJP1/JSandJcal/
JC are considered to have been related to the northward movement of the Mangkalihat
microplate during the Sinemurian (JP1/JS) and to the onset of breakup of Argo microplate
during the Callovian (JC; Longley et al., 2002; Jablonski & Saitta, 2004; Table 2.1).
UpliftintheOxfordianmarkedtheendoftheextensionandisrecognisedbya
regionalunconformity(‘MainUnconformity’–JO/MU;Table2.1).Thiseventcorresponds
withtheonsetofseafloorspreadingandgenerationofoceaniccrustoftheArgoAbyssal
Plain (Symonds et al., 1994; Struckmeyer et al.,1998;Heine&Müller,2005).Post-rift
subsidenceandrelativetectonicquiescenceinOxfordiantoTithoniantimesarerecorded
Regional setting - Chapter 218
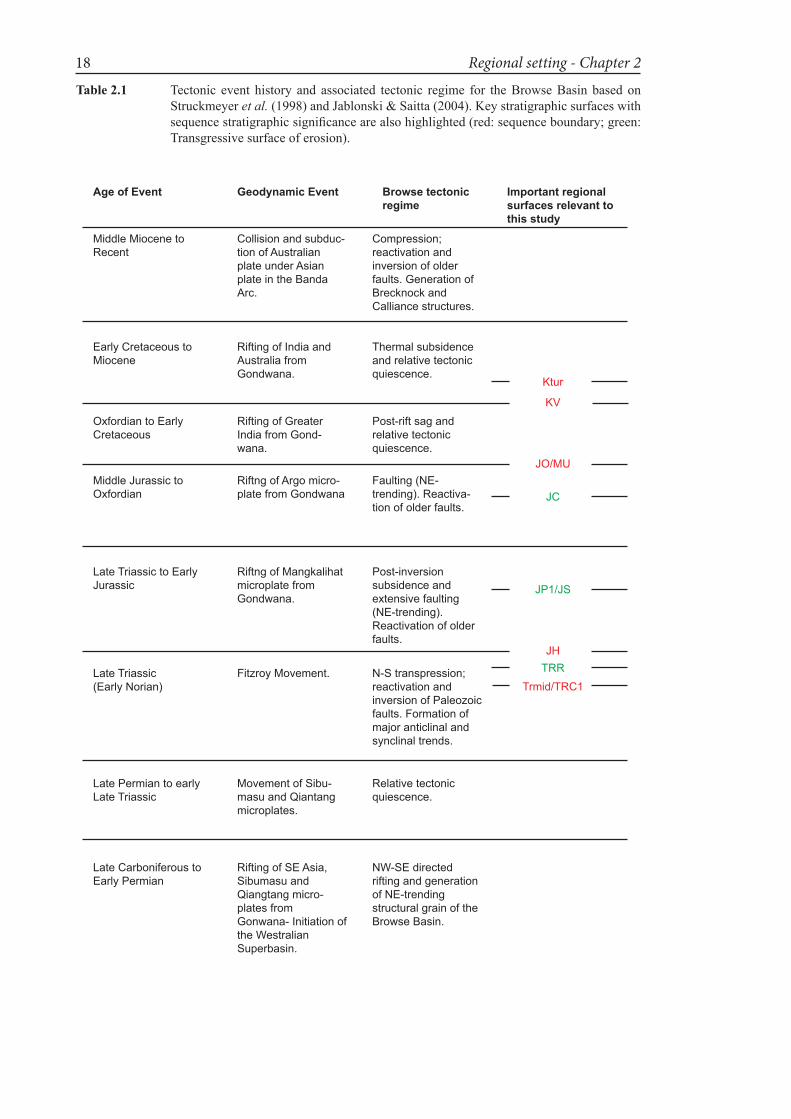
Late Carboniferous to Early Permian
Late Triassic(Early Norian)
Late Permian to early Late Triassic
Late Triassic to Early Jurassic
Middle Jurassic to Oxfordian
Oxfordian to Early Cretaceous
Age of Event Geodynamic Event Browse tectonic regime
Important regional surfaces relevant to this study
Rifting of SE Asia, Sibumasu and Qiangtang micro-plates from Gonwana- Initiation of the Westralian Superbasin.
Fitzroy Movement.
Movement of Sibu-masu and Qiantang microplates.
Riftng of Mangkalihat microplate from Gondwana.
Riftng of Argo micro-plate from Gondwana
Rifting of Greater India from Gond-wana.
NW-SE directed rifting and generation of NE-trending structural grain of the Browse Basin.
N-S transpression; reactivation and inversion of Paleozoic faults. Formation of major anticlinal and synclinal trends.
Relative tectonic quiescence.
Post-inversion subsidence and extensive faulting (NE-trending). Reactivation of older faults.
Faulting (NE-trending). Reactiva-tion of older faults.
Post-rift sag and relative tectonic quiescence.
Middle Miocene to Recent
Collision and subduc-tion of Australian plate under Asian plate in the Banda Arc.
Compression; reactivation and inversion of older faults. Generation of Brecknock and Calliance structures.
Early Cretaceous to Miocene
Rifting of India and Australia from Gondwana.
Thermal subsidence and relative tectonic quiescence.
Trmid/TRC1
JH
JP1/JS
JC
JO/MU
KV
Ktur
TRR
Table 2.1 Tectonic event history and associated tectonic regime for the Browse Basin based on Struckmeyer et al. (1998) and Jablonski & Saitta (2004). Key stratigraphic surfaces with sequencestratigraphicsignificancearealsohighlighted(red:sequenceboundary;green:Transgressive surface of erosion).
Chapter 2 - Regional setting 19
byinitialdeepeningfollowedbydepositionofprogradationalfluvio-deltaicsandstones
and mudstones (Blevin et al., 1998).
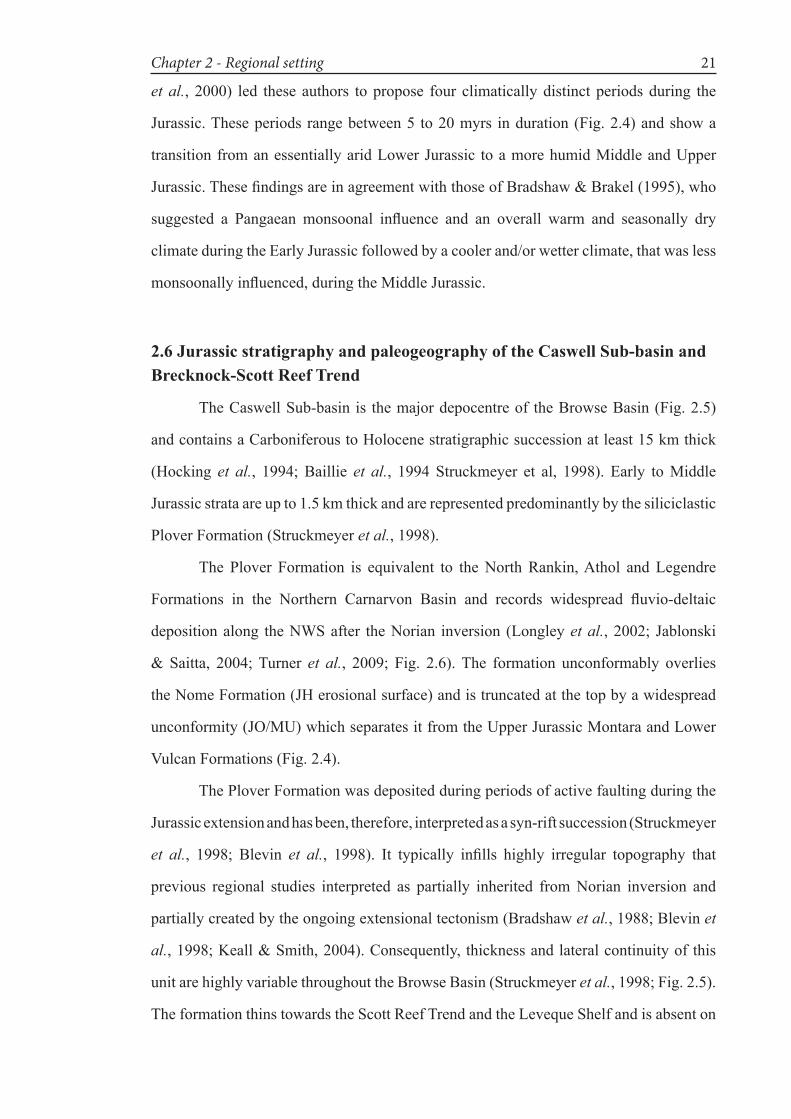
2.5 Cretaceous to Cenozoic thermal subsidence and inversion
Rifting of Greater India from Gondwana in the Berriasian caused uplift of the
hinterland inboard of the Browse Basin and progradation of deltaic depositional systems
in the Browse area (Longley et al., 2002). Rifting of the Greater India in the Valanginian,
causedpost-riftsagoftheentireBrowseBasinandregionalmarineflooding(KVseismic
event; Blevin et al., 1998, Longley et al., 2002). During this time interval, deposition in
thebasinwasnotsignificantlyaffectedbytectonism(HoffmanandHill,2004).
The Valanginian to Cenomanian succession consists of transgressive marine
claystones and siltstones deposited on an extensive marine shelf (Lavering & Pain,
1991).Thesestratarepresentthefinalphaseofpost-breakupsubsidencethataffectedthe
NWS(Symondet al. 1994). A Turonian unconformity (Ktur; Table 2.1) separates this
successionfromtheoverlyingLateCretaceous-Eocenedominantlycarbonatesuccession
(ASGO,1994;Blevinet al., 1998).
Mid Oligocene uplift and erosion of the eastern part of the basin restricted
carbonate deposition to the outer part of the shelf area (Baillie et al., 1994). However,
accelerated subsidenceduring theLateOligocene renewedbasinwardprogradationof
thick carbonate wedges (Willis, 1988; Hoffman & Hill, 2004). These wedges buried the
underlying sedimentary units and shaped the present day morphology of the continental
shelf and slope.
A compressional episode, related to the collision and subduction of the Australian
Plate under the Banda Arc, has been affecting the Browse Basin since the Late Miocene
and is responsible for minor deformation and overprinting of the whole stratigraphic
succession (Keep et al. 1998; Müller et al., 1998). This tectonic event created the Timor
Trough and, in the Browse Basin, reactivated Paleozoic faults and generated the structural
trapconfigurationoftheBrecknock-Calliancearea(Keep&Moss,2000;Keall&Smith,
2004).
Regional setting - Chapter 220
157.3
163.5
166.1
170.3
168.3
174.1
182.7
190.8
199.3201.3
209.5
222.0
Age(Ma)
Periods and stages Spore-PollenZonation
Dynoflagellataecyst biozones
Kimmeridgian
Oxfordian
Callovian
Bathonian
Bajocian
Aalenian
Toarcian
Pliensbachian
Sinemurian
Hettangian
Rhaetian
Norian
LATE
TRI
AS
EARL
Y JU
RASS
ICM
IDD
LE J
URA
SSIC
LATE
JU
RASS
IC A
B
C
U
L
U
L
U
L
M. florida
C. cooksoniae
D. complex
C. turbatus
C. torosa
A. reducta
M. crenulatus
S. wigginsii
W. listeri
H. balmei
R. rhaetica
D. priscum
No data
Luehndea assemb.
No data
D. caddenseN. deflandreiW. verrucosa
W. indotata
T. balmei
V. tabulataC. ancorum
W. spectabilis
W. clathrata
D. swanense LowerVulcanFm.
MontaraFm.
PLOVERFM.
Nome Fm.
Litho-stratigraphy
TRC1
TRR
JH
JS
JC
JO
JK
Keysurf.
Challis Fm.
Jearly
Climate
warmhumid
not seasonal
warm-hothumid
seasonal
aridseasonal
warm, but cooler
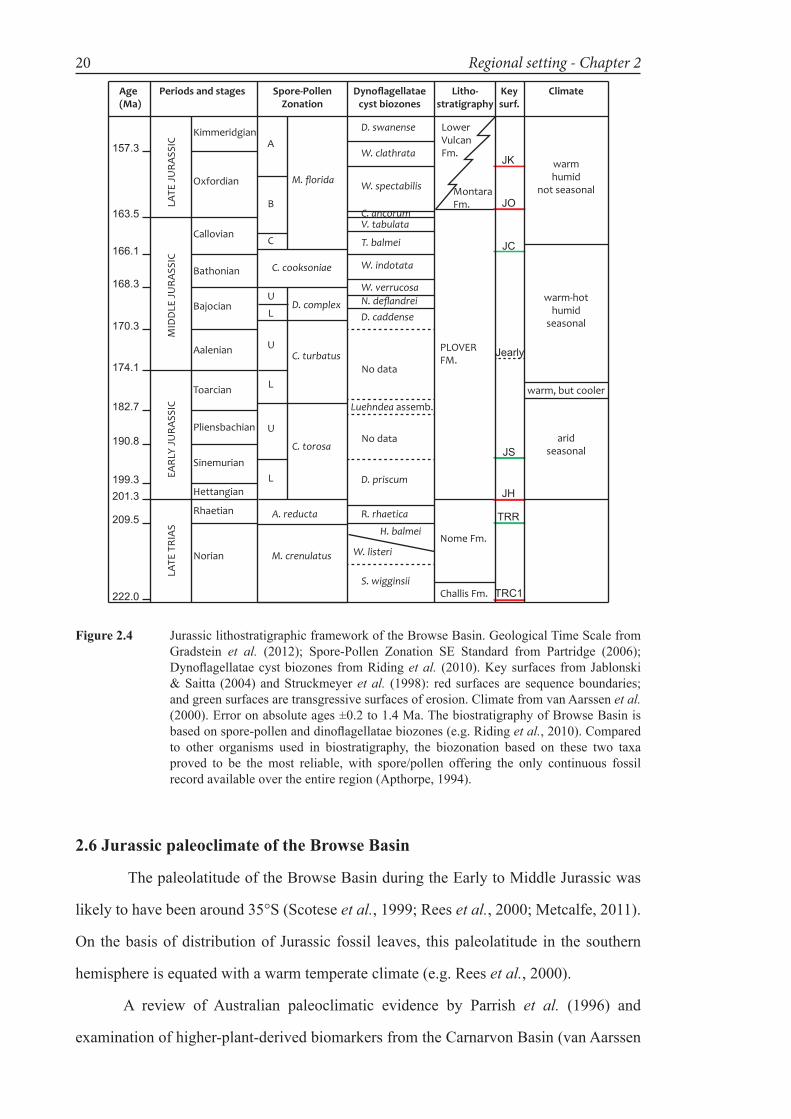
Figure 2.4 Jurassic lithostratigraphic framework of the Browse Basin. Geological Time Scale from Gradstein et al. (2012); Spore-Pollen Zonation SE Standard from Partridge (2006);Dynoflagellataecystbiozones fromRidinget al. (2010). Key surfaces from Jablonski & Saitta (2004) and Struckmeyer et al. (1998): red surfaces are sequence boundaries; and green surfaces are transgressive surfaces of erosion. Climate from van Aarssen et al. (2000). Error on absolute ages ±0.2 to 1.4 Ma. The biostratigraphy of Browse Basin is basedonspore-pollenanddinoflagellataebiozones(e.g.Ridinget al., 2010). Compared to other organisms used in biostratigraphy, the biozonation based on these two taxa proved to be the most reliable, with spore/pollen offering the only continuous fossil record available over the entire region (Apthorpe, 1994).
2.6 Jurassic paleoclimate of the Browse Basin
The paleolatitude of the Browse Basin during the Early to Middle Jurassic was
likelytohavebeenaround35°S(Scoteseet al., 1999; Rees et al., 2000; Metcalfe, 2011).
OnthebasisofdistributionofJurassic fossil leaves, thispaleolatitude in thesouthern
hemisphere is equated with a warm temperate climate (e.g. Rees et al., 2000).
A review of Australian paleoclimatic evidence by Parrish et al. (1996) and
examinationofhigher-plant-derivedbiomarkersfromtheCarnarvonBasin(vanAarssen
Chapter 2 - Regional setting 21
et al., 2000) led these authors to propose four climatically distinct periods during the
Jurassic.Theseperiodsrangebetween5 to20myrs induration(Fig.2.4)andshowa
transition from an essentially arid Lower Jurassic to a more humid Middle and Upper
Jurassic.ThesefindingsareinagreementwiththoseofBradshaw&Brakel(1995),who
suggested a Pangaean monsoonal influence and an overall warm and seasonally dry
climate during the Early Jurassic followed by a cooler and/or wetter climate, that was less
monsoonallyinfluenced,duringtheMiddleJurassic.
2.6 Jurassic stratigraphy and paleogeography of the Caswell Sub-basin and Brecknock-Scott Reef Trend
TheCaswellSub-basin is themajordepocentreof theBrowseBasin(Fig.2.5)
and contains a Carboniferous to Holocene stratigraphic succession at least 15 km thick
(Hocking et al., 1994; Baillie et al., 1994 Struckmeyer et al, 1998). Early to Middle
Jurassic strata are up to 1.5 km thick and are represented predominantly by the siliciclastic
PloverFormation(Struckmeyeret al., 1998).
The Plover Formation is equivalent to theNorthRankin,Athol andLegendre
Formations in the Northern Carnarvon Basin and records widespread fluvio-deltaic
depositionalong theNWSafter theNorian inversion (Longleyet al., 2002; Jablonski
& Saitta, 2004; Turner et al., 2009; Fig. 2.6).The formation unconformably overlies
theNomeFormation(JHerosionalsurface)andistruncatedatthetopbyawidespread
unconformity(JO/MU)whichseparatesitfromtheUpperJurassicMontaraandLower
VulcanFormations(Fig.2.4).
ThePloverFormationwasdepositedduringperiodsofactivefaultingduringthe
Jurassicextensionandhasbeen,therefore,interpretedasasyn-riftsuccession(Struckmeyer
et al., 1998; Blevin et al., 1998). It typically infills highly irregular topography that
previous regional studies interpreted as partially inherited fromNorian inversion and
partially created by the ongoing extensional tectonism (Bradshaw et al., 1988; Blevin et
al., 1998; Keall & Smith, 2004). Consequently, thickness and lateral continuity of this
unit are highly variable throughout the Browse Basin (Struckmeyer et al.,1998;Fig.2.5).
The formation thins towards the Scott Reef Trend and the Leveque Shelf and is absent on
Regional setting - Chapter 222
Figu
re 2
.5
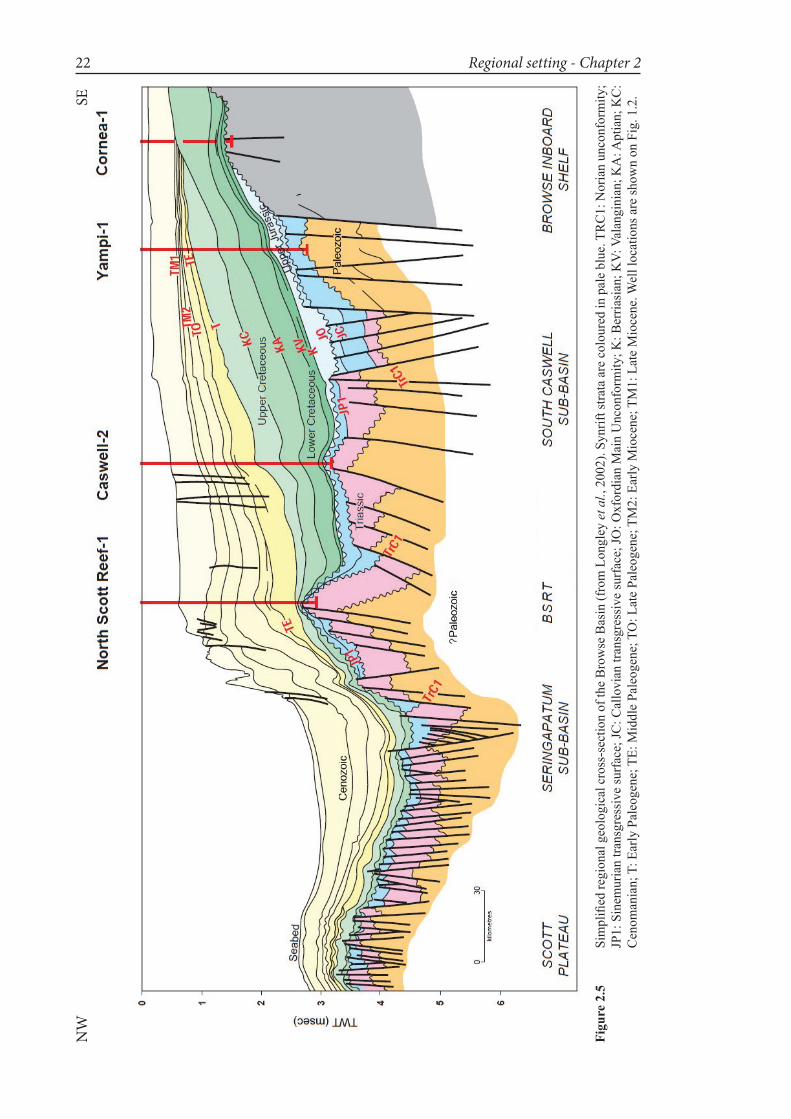
Simplifiedregionalgeologicalcross-sectionoftheBrowseBasin(fromLongleye
t al.,2002).Synriftstrataarecolouredinpaleblue.TRC1:Norianunconformity;
JP1:Sinem
uriantransgressivesu
rface;JC
:Calloviantransgressivesurface;JO
:OxfordianM
ainUnconformity;K
:Berriasian;K
V:Valanginian;K
A:A
ptian;KC:
Cenom
anian;T:E
arlyPaleogene;TE:M
iddlePaleogene;TO:L
atePaleogene;TM2:EarlyM
iocene;TM1:LateMiocene.W
elllocationsaresh
ownonFig.1.2.
NW
SE

Chapter 2 - Regional setting 23
Figure 2.6 Lithostratigraphic correlation chart for Jurassic Formations of theBonaparte, Browseand Carnarvon Basins, matched against the chronostratigraphic scale of Gradstein et al. (2012)andOgget al.(2008).FromTurneret al. (2009).
the Yampi Shelf (Stevenson & Cadman, 1994; Blevin et al., 1998).
Sandstones, mudstones and minor carbonate rocks constitute the main rock types
ofthePloverFormation(Willis,1988;Blevinet al., 1998; Keall & Smith, 2004). The broad
depositional environment proposed is a large, tidally influenced to tidally dominated,
sandy delta fed by rivers draining uplifted areas to the east of the basin (e.g. Precambrian
Kimberley Craton; Longley et al., 2002; Ainsworth et al., 2008). Igneous rocks are
present at several stratigraphic levels within the formation and have been interpreted as
volcanic units and subvolcanic intrusions related to synrift volcanism associated with a
majorvolcanicprovince(Symondset al., 1998; Blevin et al., 1998; Struckmeyer et al.,
Regional setting - Chapter 224
1998).
Informal subdivision of the Plover Formation in theBrowseBasin into lower
(?HettangiantoToarcian)andupper(AaleniantoOxfordian)unitscanbeinferredfrom
CadmanandStevenson(1994),althoughtheydidnotdefineitclearly.Struckmeyeret
al. (1998) and Blevin et al. (1998) recognised a Jearlyevent(intra-C. turbatus;Fig.2.4)
on seismic and well data and interpreted it as a sequence boundary marking the onset of
extensionalfaultingintheHeywoodGraben(Fig.1.2)andoveralldeltaicprogradationin
theBarcoo-1area(Fig2.1).Thiseventcouldrepresentaneffectiveboundarybetweena
lower and a upper parts of the formation. In other studies, two important regional seismic
events (JP1/JS and JC) have been recognized in the Jurassic section of theNorthern
Carnarvon Basin and correlatedwith the Browse Basin (Jablonski, 1996; Longley et
al., 2002). These surfaces have been interpreted as regional transgressive surfaces of
Sinemurian (JP1/JS) and Callovian (JC) age because they have been recognized also in
wellsoftheCaswellSub-basin(Blevinet al., 1998; Struckmeyer et al., 1998; Longley et
al., 2002; Jablonski & Saitta, 2004).
BroadpaleogeographicmapsfortheNWShavebeenproposedbyBradshawet al.
(1988 and 1998) and Longley et al. (2002). Early regional paleogeographic reconstructions
of the Browse Basin centred on the Scott Reef Plateau were presented by Exon & Stagg
(1981). Apthorpe 1994 presented a preliminary paleogeographic interpretation of the
Browse area based on the recognition of foraminifera and other marine microfossils as
wellasindicationsofnon-marinedeposition(e.g.woodfragmentsandleaves)fromsix
wellslocatedintheCaswellandBarcooSub-basins.Amorecompletepaleogeographic
analysis,directlybasedondatafromtwenty-threewells,wasalsoproposedbyStevenson
& Cadman (1994).
The Early to Middle Jurassic paleogeography as summarized by Stevenson &
Cadman (1994; Figs 2.7A and 2.7B) is characterized bymajor land areas located to
the east and northeast (Yampi Shelf and Kimberley craton). The possible existence of
Plover sediment source to the west has been also considered likely by some authors (e.g.
Stevenson & Cadman, 1994; Blevin et al., 1998) and implies emergent areas also in the
ScottSub-basintothewest.IntheCaswellSub-basin,partoftheBrecknock-ScottReef
Chapter 2 - Regional setting 25
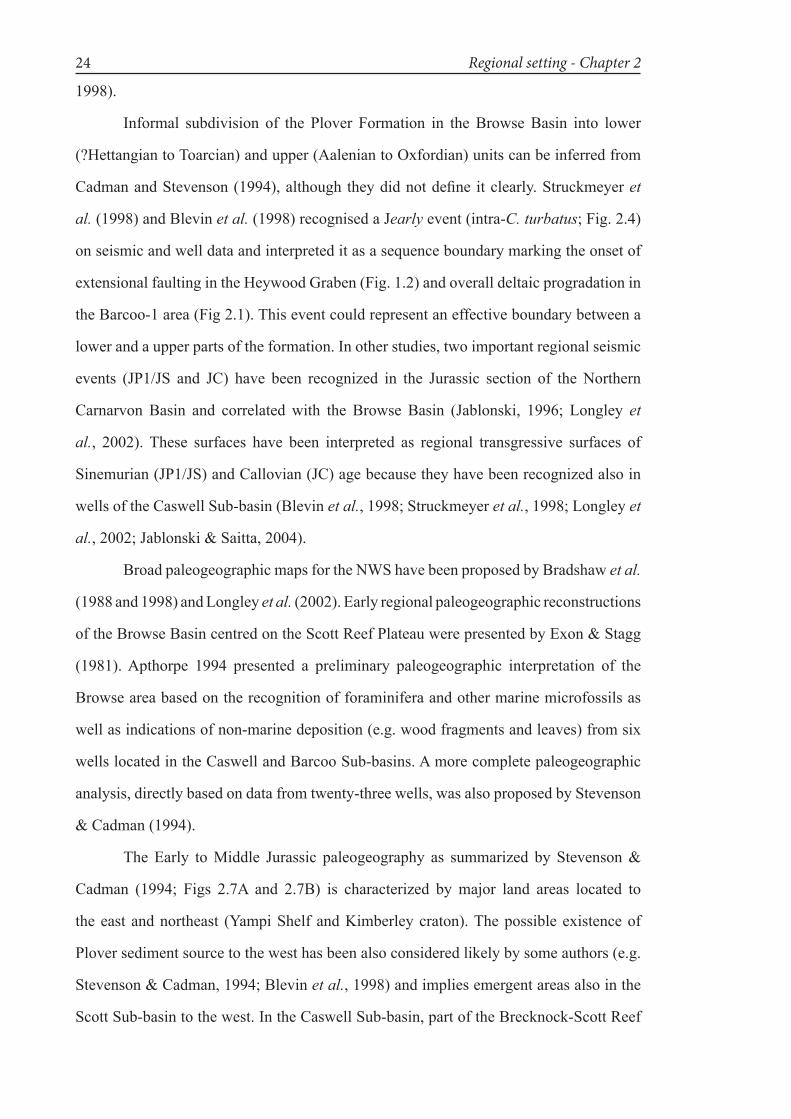
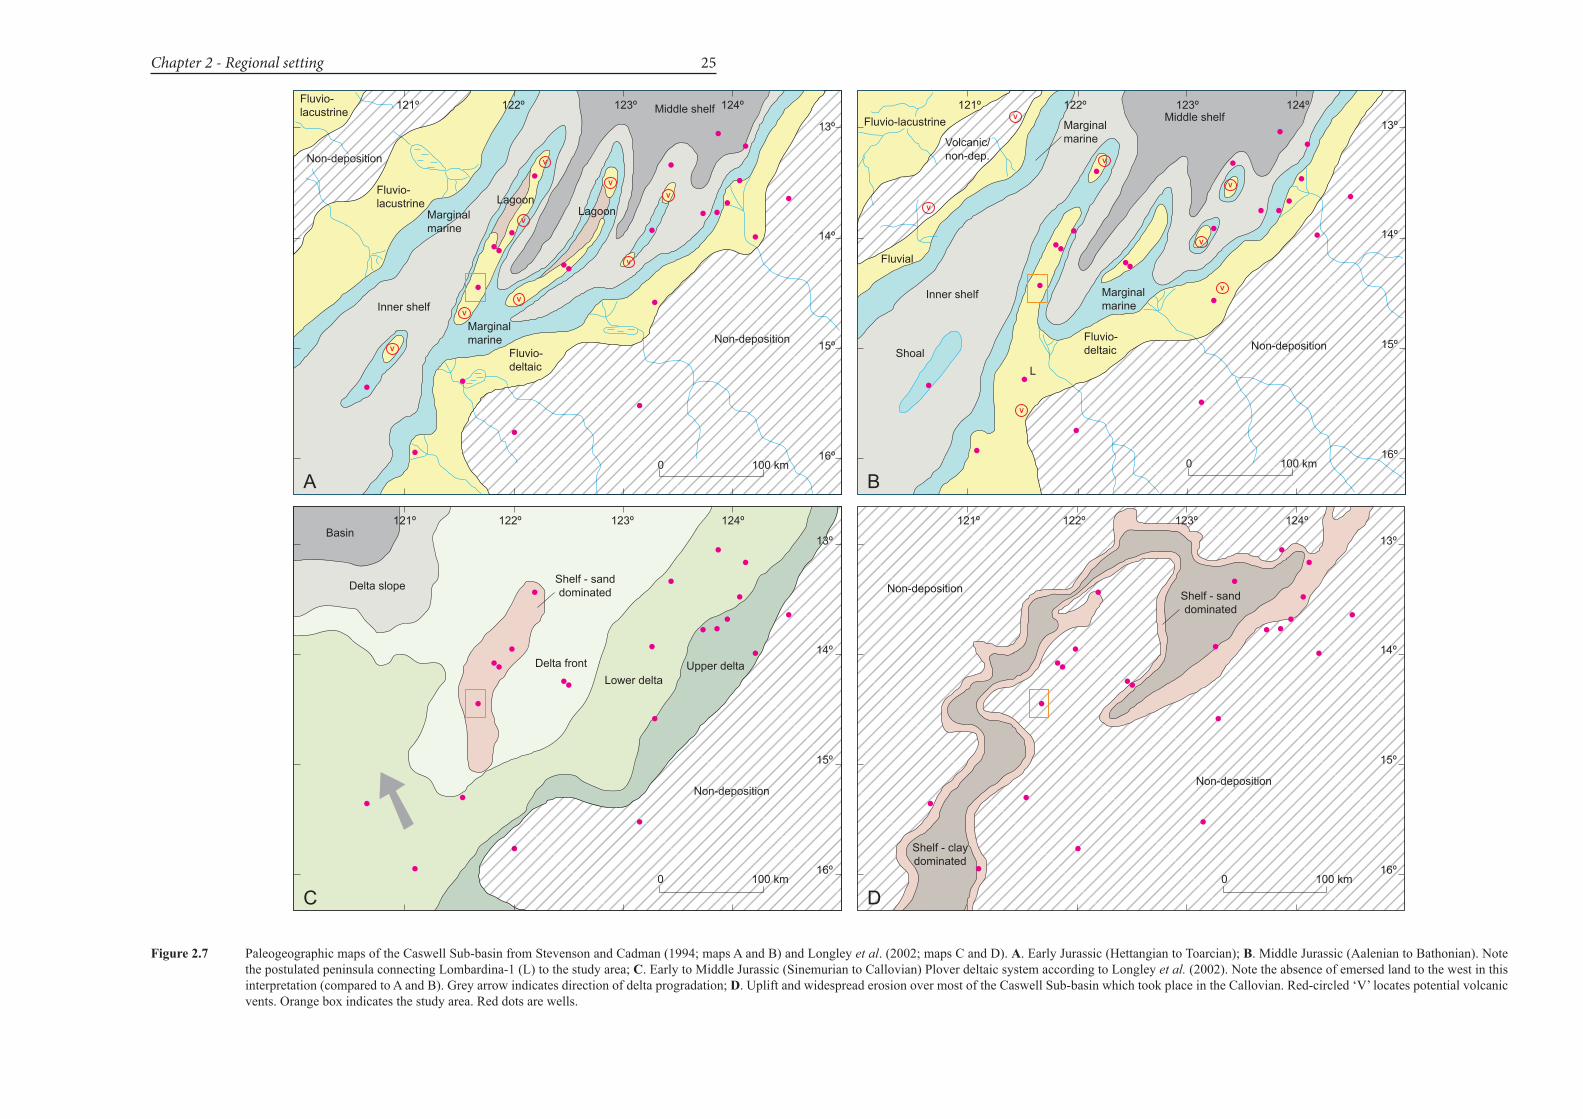
Figure 2.7 PaleogeographicmapsoftheCaswellSub-basinfromStevensonandCadman(1994;mapsAandB)andLongleyet al. (2002; maps C and D). A. Early Jurassic (Hettangian to Toarcian); B.MiddleJurassic(AaleniantoBathonian).NotethepostulatedpeninsulaconnectingLombardina-1(L)tothestudyarea;C. Early to Middle Jurassic (Sinemurian to Callovian) Plover deltaic system according to Longley et al.(2002).Notetheabsenceofemersedlandtothewestinthisinterpretation (compared to A and B). Grey arrow indicates direction of delta progradation; D.UpliftandwidespreaderosionovermostoftheCaswellSub-basinwhichtookplaceintheCallovian.Red-circled‘V’locatespotentialvolcanicvents.Orangeboxindicatesthestudyarea.Reddotsarewells.
V
V
V
V
V
V
V
V
16º
15º
14º
13º
100 km0
Non-deposition
Middle shelf
Fluvio-deltaic
Marginalmarine
Inner shelf
Fluvio-lacustrine
LagoonLagoon
Marginalmarine
Fluvio-lacustrine
Non-deposition
121º 122º 123º 124º
A
V
V
V
V
V
V
V
16º
15º
14º
13º
100 km0
Non-deposition
Middle shelf
Fluvio-deltaic
Marginalmarine
Inner shelf
Shoal
Volcanic/non-dep.
Fluvio-lacustrine
Fluvial
Marginalmarine
121º 122º 123º 124º
B
L
16º
15º
14º
13º
100 km0
121º 122º 123º 124º
Non-deposition
Non-deposition
Shelf - claydominated
Shelf - sanddominated
D16º
15º
14º
13º
100 km0
121º 122º 123º 124º
Upper deltaLower delta
Delta front
Delta slope
Basin
Shelf - sanddominated
Non-deposition
C

Regional setting - Chapter 226
Chapter 2 - Regional setting 27
Trendandothersmall,northeast-trendinghorstsformedelongatedislandsorpeninsulas,
probably of volcanic origin (Stevenson & Cadman, 1994). Coastal areas were dominated
byfluvio-deltaic to estuarine sedimentation andwere connected to narrow, northeast-
trending shallow marine depositional areas (Stevenson & Cadman, 1994; Bradshaw et al.,
1998). Progradation of an extensive deltaic system which was building westward from
theAustraliancontinentduringtheEarly-MiddleJurassichasbeenproposedbyJablonski
(1997) and Longley et al.(2002;Fig.2.7C).Accordingtotheseauthors,theBSRTarea
wasasand-dominatedshelfsurroundedbywidespreaddeltafrontareas.Distributionof
volcanicvents, althoughstillunknown,waspotentiallyparallel to theoverallNE-SW
structural grain of the basin (Stevenson & Cadman, 1994).
Thepaleogeographicsettingchanged in theCallovian -earlyOxfordian,when
uplift led towidespreaderosionovermostof theCaswellSub-basin,withonlyminor
areas of coastal or shallow marine deposition (Longley et al.,2002;Fig.2.7D).Flooding
intheOxfordianre-establishedmarineconditionsovertheentireregion.