Embed Size (px)
Citation preview

Department of the Treasury
Treasury Franchise Fund
Congressional Budget
Justification and Annual
Performance Report and Plan
FY 2019

TFF - 2
Table of Contents
Section I – Budget Request........................................................................................................... 3
A – Mission Statement ................................................................................................................ 3
B – Summary of the Request ...................................................................................................... 3
1.1 – Appropriations Detail Table .............................................................................................. 4
1.2 – Budget Adjustments Table ................................................................................................. 4
C – Budget Increases and Decreases Description ....................................................................... 5
1.3 – Operating Levels Table ..................................................................................................... 6
D – Appropriations Language and Explanation of Changes ...................................................... 6
E – Legislative Proposals ............................................................................................................ 6
Section II – Annual Performance Plan and Report ................................................................... 7
A – Strategic Alignment ............................................................................................................. 7
B – Budget and Performance by Budget Activity ...................................................................... 8
2.1.1 – Shared Services Programs Resources and Measures ..................................................... 8
2.1.2 – Centralized Treasury Administrative Services Resources and Measures ....................... 9
2.1.3 – Administrative Services Resources and Measures ....................................................... 10
2.1.4 – Information Technology Resources and Measures ....................................................... 13
C – Changes in Performance Measures .................................................................................... 14
Section III – Additional Information ........................................................................................ 15
A – Summary of Capital Investments ....................................................................................... 15
B – TFF Program Costs ............................................................................................................ 15

TFF - 3
Section I – Budget Request
A – Mission Statement
To assist customer agencies in meeting their mission by providing responsive, customer-focused,
cost-effective administrative and information technology support services.
B – Summary of the Request
The Treasury Franchise Fund (TFF) supports effective administrative and information
technology services through commitment to service, efficient operations, openness to change,
and values-based behavior. The TFF achieves cost savings, promotes economies of scale, and
increases productivity and efficiency in the use of resources by shared services providers.
The TFF providers include Departmental Offices’ Shared Services Programs (SSP) and the
Fiscal Service’s Administrative Resource Center (ARC). SSP and ARC provide financial
management, HR, IT, and other administrative services to federal customers on a fully cost
recoverable, fee-for-service basis. Treasury proposes to move additional Departmental Offices
(DO) administrative services to the TFF in FY 2019 to consolidate broad-scale administrative
functions and capital investment activities into one account. The transition will also provide one
governance process for reimbursable programs in DO. The TFF structure allows for more
effective capital investments over multiple fiscal years and provides stability during a continuing
resolution for more efficient contract execution. Customers will benefit from consolidation of
like services, consistent points of contacts for service providers, less confusion during budget
execution, and increased direct customer involvement through joint governance. Administrative
programs will benefit as they will budget for and execute all services in one account and will be
able to better leverage staff across functions. The move also will streamline cash management as
services are paid for in consistent monthly amounts rather than billed in arrears based on actuals.
In FY 2019, there is support for increasing shared services across government and the TFF is
well positioned to support the provision of high quality services in response to the demand. The
TFF mission aligns with the Office of Management and Budget (OMB) reform priority M-17-22,
an initiative that directs agency reform proposals to leverage shared services that will streamline
mission support functions. The TFF also supports the OMB crosscutting reform proposals to
reduce the fragmented or duplicated services across government.
The TFF and its providers will continue to be integral federal partners to customer agencies. We
will provide responsive, high quality and cost effective shared services to federal agencies
through our commitment to streamlined processes to ensure compliance and eliminate
redundancy, and focus on maximizing cost sharing opportunities that take advantage of
economies of scale.
The TFF aligns to the following Treasury strategic goals as presented in the new strategic plan:
Goal 4: Transform Government-wide Financial Stewardship
Goal 5: Achieve Operational Excellence
TFF - 4
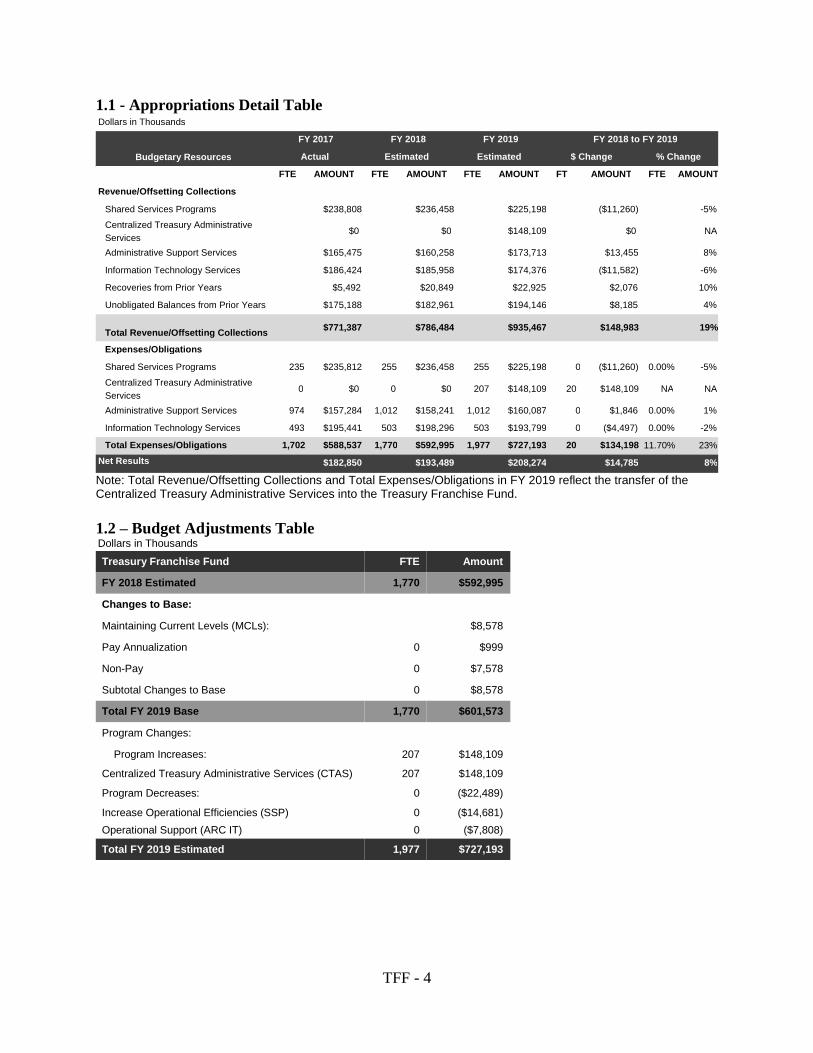
1.1 - Appropriations Detail Table
Note: Total Revenue/Offsetting Collections and Total Expenses/Obligations in FY 2019 reflect the transfer of the Centralized Treasury Administrative Services into the Treasury Franchise Fund.
1.2 – Budget Adjustments Table Dollars in Thousands
Treasury Franchise Fund FTE Amount
FY 2018 Estimated 1,770 $592,995
Changes to Base:
Maintaining Current Levels (MCLs): $8,578
Pay Annualization 0 $999
Non-Pay 0 $7,578
Subtotal Changes to Base 0 $8,578
Total FY 2019 Base 1,770 $601,573
Program Changes:
Program Increases: 207 $148,109
Centralized Treasury Administrative Services (CTAS) 207 $148,109
Program Decreases: 0 ($22,489)
Increase Operational Efficiencies (SSP) 0 ($14,681)
Operational Support (ARC IT) 0 ($7,808)
Total FY 2019 Estimated 1,977 $727,193
Dollars in Thousands
Budgetary Resources FTE AMOUNT FTE AMOUNT FTE AMOUNT FT
E AMOUNT FTE AMOUNT
Revenue/Offsetting Collections Shared Services Programs $238,808 $236,458 $225,198 ($11,260) -5% Centralized Treasury Administrative Services $0 $0 $148,109 $0 NA
Administrative Support Services $165,475 $160,258 $173,713 $13,455 8% Information Technology Services $186,424 $185,958 $174,376 ($11,582) -6% Recoveries from Prior Years $5,492 $20,849 $22,925 $2,076 10% Unobligated Balances from Prior Years $175,188 $182,961 $194,146 $8,185 4%
Total Revenue/Offsetting Collections $771,387 $786,484 $935,467 $148,983 19%
Expenses/Obligations Shared Services Programs 235 $235,812 255 $236,458 255 $225,198 0 ($11,260) 0.00% -5% Centralized Treasury Administrative Services 0 $0 0 $0 207 $148,109 20
7 $148,109 NA NA
Administrative Support Services 974 $157,284 1,012 $158,241 1,012 $160,087 0 $1,846 0.00% 1% Information Technology Services 493 $195,441 503 $198,296 503 $193,799 0 ($4,497) 0.00% -2% Total Expenses/Obligations 1,702 $588,537 1,770 $592,995 1,977 $727,193 20
7 $134,198 11.70% 23%
Net Results $182,850 $193,489 $208,274 $14,785 8%
FY 2017 FY 2018 FY 2019 FY 2018 to FY 2019 Actual Estimated Estimated $ Change % Change
TFF - 5
C – Budget Increases and Decreases Description
Maintaining Current Levels (MCLs) .................................................... + $8,578,000 / + 0 FTE Pay Annualization +$999,000 / +0 FTE
Funds are required for annualization of the January 2018 pay-raise.
Non-Pay +7,578,000 / +0 FTE
Funds are required for non-labor expenses such as travel, contracts, rent, supplies, and
equipment.
Program Increases………………………………………………… + $148,109,000 / + 207 FTE Centralized Treasury Administrative Services
Treasury proposes to move DO administrative services to the TFF in FY 2019 to consolidate
broad-scale administrative functions and capital investment activities into one account. It will
also provide one governance process for reimbursable programs in DO. The TFF structure
allows for more effective capital investments over multiple fiscal years and provides stability
during a continuing resolution for more efficient contract execution. Customers will benefit
from consolidation of like services, consistent points of contacts for service providers, less
confusion during budget execution, and increased direct customer involvement through joint
governance. Administrative programs will benefit as they will budget for and execute all
services in one account and will be able to better leverage staff across functions. The move also
will streamline cash management as services are paid for in consistent monthly amounts rather
than billed in arrears based on actuals.
Program Decreases……………………………………………………..- $22,489,000 / + 0 FTE Increase Operational Efficiencies (SSP) -$14,681,000 / +0 FTE
Decrease of $14,681,000 is due to modifications and investments that will not recur in FY 2019,
such as the HR Connect upgrade. This decrease is also due to the identification of efficiencies in
non-labor costs, primarily IT contracts.
Operational Support (ARC IT) -$7,808,000 / +0 FTE
Decrease of $5,319,569 is due to a timing differences in the collection of funds and obligation of
those funds in support of a major cybersecurity initiative known as CyberClean. Decrease of
$1,871,351 due to significant non-recurring FY 2018 investments to enhance the TreasuryDirect
(Treasury Retail Investment Manager) system that will be offset by hardware and software
annual maintenance. The remaining decrease is the net of various increases and decreases for
numerous operational support contracts that are the result of typical fluctuations that occur with
IT operations.
TFF - 6
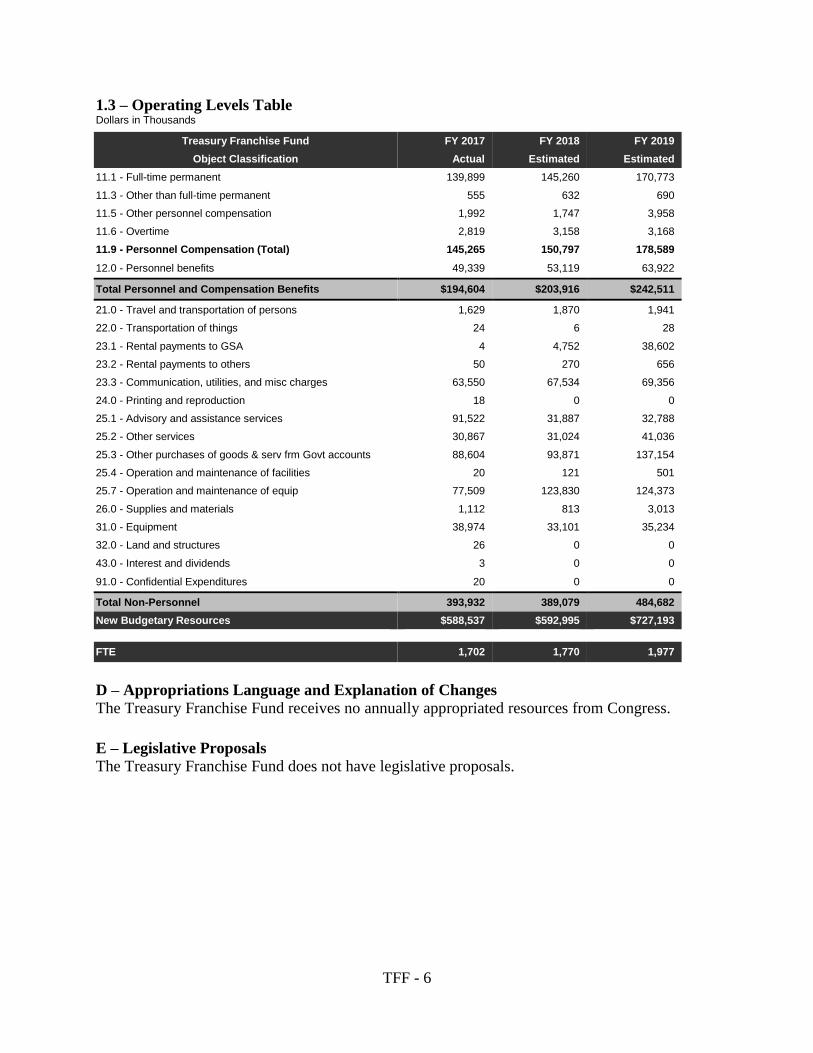
1.3 – Operating Levels Table Dollars in Thousands
Treasury Franchise Fund FY 2017 FY 2018 FY 2019
Object Classification Actual Estimated Estimated
11.1 - Full-time permanent 139,899 145,260 170,773
11.3 - Other than full-time permanent 555 632 690
11.5 - Other personnel compensation 1,992 1,747 3,958
11.6 - Overtime 2,819 3,158 3,168
11.9 - Personnel Compensation (Total) 145,265 150,797 178,589
12.0 - Personnel benefits 49,339 53,119 63,922
Total Personnel and Compensation Benefits $194,604 $203,916 $242,511
21.0 - Travel and transportation of persons 1,629 1,870 1,941
22.0 - Transportation of things 24 6 28
23.1 - Rental payments to GSA 4 4,752 38,602
23.2 - Rental payments to others 50 270 656
23.3 - Communication, utilities, and misc charges 63,550 67,534 69,356
24.0 - Printing and reproduction 18 0 0
25.1 - Advisory and assistance services 91,522 31,887 32,788
25.2 - Other services 30,867 31,024 41,036
25.3 - Other purchases of goods & serv frm Govt accounts 88,604 93,871 137,154
25.4 - Operation and maintenance of facilities 20 121 501
25.7 - Operation and maintenance of equip 77,509 123,830 124,373
26.0 - Supplies and materials 1,112 813 3,013
31.0 - Equipment 38,974 33,101 35,234
32.0 - Land and structures 26 0 0
43.0 - Interest and dividends 3 0 0
91.0 - Confidential Expenditures 20 0 0
Total Non-Personnel 393,932 389,079 484,682
New Budgetary Resources $588,537 $592,995 $727,193
FTE 1,702 1,770 1,977
D – Appropriations Language and Explanation of Changes
The Treasury Franchise Fund receives no annually appropriated resources from Congress.
E – Legislative Proposals
The Treasury Franchise Fund does not have legislative proposals.
TFF - 7
Section II – Annual Performance Plan and Report
A – Strategic Alignment
The TFF aligns to the following Department of the Treasury (Treasury) Stategic Plan for FY
2018-2022 goals and objectives:
Goal 4: Transform Government-wide Financial Stewardship
Objective 4.3 – Federal Financial Performance: Improve federal financial management
performance using innovative practices to support effective government.
Goal 5: Achieve Operational Excellence
Objective 5.1 – Workforce Management: Foster a culture of innovation to hire, engage,
develop, and optimize a diverse workforce with the competencies necessary to
accomplish Treasury’s mission.
Objective 5.2 – Treasury Infrastructure: Better enable mission delivery by improving the
reliability, security, and resiliency of Treasury’s infrastructure.
Objective 5.3 – Customer Value: Improve customer value by increasing the quality and
lowering the cost of Treasury’s products and services
Treasury Franchise Fund Strategic Goals:
Establish a level of transparency and a governance process that sets the standard for
government service providers.
Maintain status as a Financial Management Federal Shared Service Provider (FSSP).
Commitment to continual improvement of operational service levels and process
improvement efforts that reduce service costs.
Prioritize resiliency, security (including cybersecurity), and data integrity of all IT systems
and services.
Promote and maximize shared services benefits in support of Treasury and government-wide
initiatives.
Continue to assess and report the TFF’s performance and provide timely feedback to
customers.
In FY 2019, the TFF will maintain its commitment to excellence and to meeting all strategic
goals, financial goals and benchmarks In order to meet the goal of reducing costs to customers,
the TFF will maximize shared service value and continue to look for opportunities to improve
the efficiencies in business processes and technologies used in service delivery. The TFF strives
to incorporate the customer perspective into the decision-making process. Customer
involvement and input provide an opportunity to obtain constructive and directed feedback
which allows customer concerns to be addressed and services to meet customer demand.
TFF-IT effectively protects customer systems and data through cybersecurity initiatives that
enhance operations and promote resiliency in critical IT infrastructure and systems. The
Treasury Memo, “Data Loss Prevention (DLP)” dated December 11, 2015, and recent Treasury
mandates require upgrades to the Trusted Internet Connections (TIC) managed within TFF-IT.
To satisfy these requirements, IT will deploy a number of cybersecurity enhancements to satisfy
each requirement of the memo. These enhancements are being initiated in FY 2018, and will
TFF - 8
continue into FY 2019, with continuous reassessment thereafter. Additionally, IT has initiated a
multi-year CyberClean initiative. The objective of this project is to strengthen Treasury’s
cybersecurity posture by working with a third party to benchmark the effectiveness of system
security controls, identify gaps or deficiencies in the controls, strengthen response capabilities
and assist with incident response, in the event a significant cybersecurity incident or data breach
should occur.
B – Budget and Performance by Budget Activity
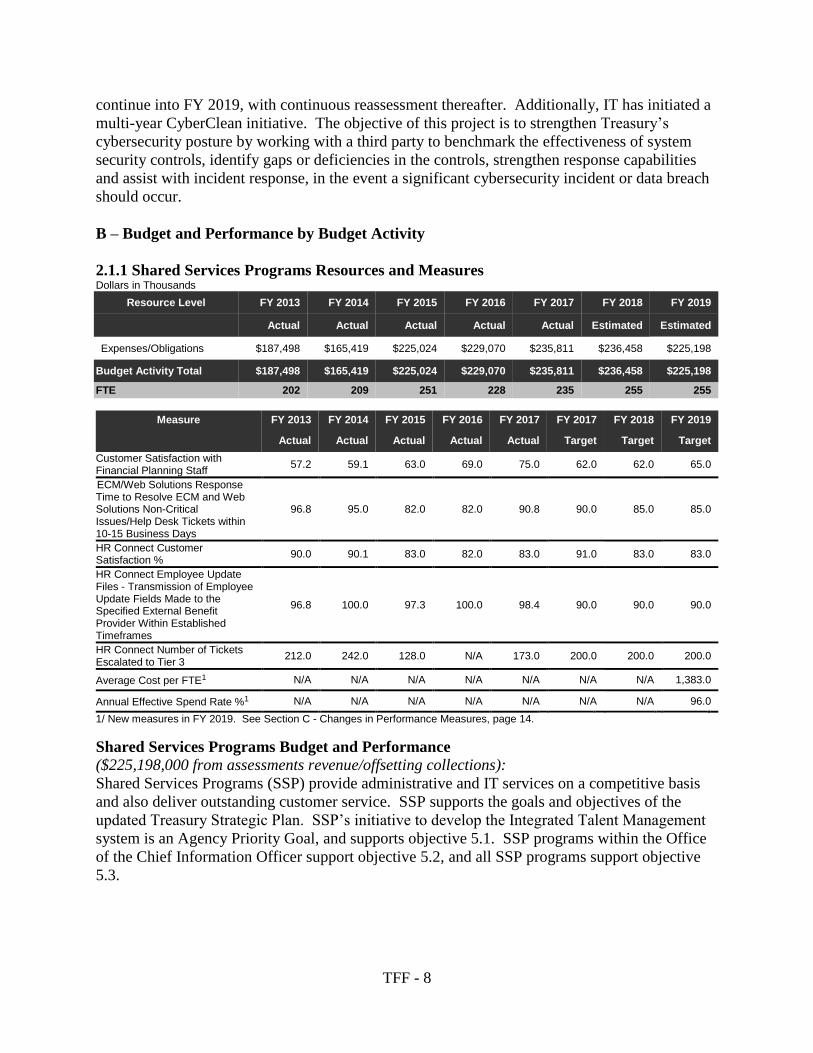
2.1.1 Shared Services Programs Resources and Measures Dollars in Thousands
Resource Level FY 2013 FY 2014 FY 2015 FY 2016 FY 2017 FY 2018 FY 2019
Actual Actual Actual Actual Actual Estimated Estimated
Expenses/Obligations $187,498 $165,419 $225,024 $229,070 $235,811 $236,458 $225,198
Budget Activity Total $187,498 $165,419 $225,024 $229,070 $235,811 $236,458 $225,198
FTE 202 209 251 228 235 255 255
Measure FY 2013 FY 2014 FY 2015 FY 2016 FY 2017 FY 2017 FY 2018 FY 2019
Actual Actual Actual Actual Actual Target Target Target
Customer Satisfaction with Financial Planning Staff
57.2 59.1 63.0 69.0 75.0 62.0 62.0 65.0
ECM/Web Solutions Response Time to Resolve ECM and Web Solutions Non-Critical Issues/Help Desk Tickets within 10-15 Business Days
96.8 95.0 82.0 82.0 90.8 90.0 85.0 85.0
HR Connect Customer Satisfaction %
90.0 90.1 83.0 82.0 83.0 91.0 83.0 83.0
HR Connect Employee Update Files - Transmission of Employee Update Fields Made to the Specified External Benefit Provider Within Established Timeframes
96.8 100.0 97.3 100.0 98.4 90.0 90.0 90.0
HR Connect Number of Tickets Escalated to Tier 3
212.0 242.0 128.0 N/A 173.0 200.0 200.0 200.0
Average Cost per FTE1 N/A N/A N/A N/A N/A N/A N/A 1,383.0
Annual Effective Spend Rate %1 N/A N/A N/A N/A N/A N/A N/A 96.0
1/ New measures in FY 2019. See Section C - Changes in Performance Measures, page 14.
Shared Services Programs Budget and Performance
($225,198,000 from assessments revenue/offsetting collections):
Shared Services Programs (SSP) provide administrative and IT services on a competitive basis
and also deliver outstanding customer service. SSP supports the goals and objectives of the
updated Treasury Strategic Plan. SSP’s initiative to develop the Integrated Talent Management
system is an Agency Priority Goal, and supports objective 5.1. SSP programs within the Office
of the Chief Information Officer support objective 5.2, and all SSP programs support objective
5.3.

TFF - 9
Description of Performance:
Customer Satisfaction with Financial Planning Staff – All SSP customers are surveyed
and the measure reflects the percentage of customers who rate their experience with
financial planning staff as “good” or “excellent” on a 5-point scale. This target was
exceeded in FY 2017 and SSP strives to exceed this target in FY 2018 as well. SSP will
start administering the CTAS budget activity in FY 2019, and the target has been
adjusted to reflect this additional work.
Enterprise Content Management/Web Solutions: This target reflects the percentage of
non-critical tickets which are resolved within 10-15 business days. The target service
response times are lower in FY 2018 and FY 2019 due to potentially reduced contractor
support stemming from recent budget cuts.
HR Connect Customer Satisfaction: This measure reflects the percentage of customers
satisfied with the HR Connect system. The FY 2017 target was not met due to the
onboarding of new customers who are less familiar with the system. The HR Connect
team strives to improve upon this actual in FY 2018 and FY 2019, but may be impacted
by budget constraints.
HR Connect Employee Update Files: Target reflects the transmission of employee update
files made to an external benefit provider within established timeframes. Targets are
consistent with the targets used for quarterly Capital Planning and Investment Control
and OPM reporting for HR Connect.
HR Connect Number of Tickets: HR Connect continues to maintain its current target
levels. This target is based on implementing process improvements in the Design
Documents and Quality Assurance environments.
2.1.2 Centralized Treasury Administrative Services Resources and Measures Dollars in Thousands
Resource Level FY 2013 FY 2014 FY 2015 FY 2016 FY 2017 FY 2018 FY 2019
Actual Actual Actual Actual Actual Estimated Estimated
Expenses/Obligations 0 0 0 0 0 0 $148,109
Budget Activity Total 0 0 0 0 0 0 $148,109
FTE 0 0 0 0 0 0 207
Measure FY 2013 FY 2014 FY 2015 FY 2016 FY 2017 FY 2017 FY 2018 FY 2019
Actual Actual Actual Actual Actual Target Target Target
Annual Effective Spend Rate %1 N/A N/A N/A N/A N/A N/A N/A 96.0
1/ New measure in FY 2019. This target measures the obligation rate for CTAS program to ensure customers pay accurate prices for services rendered. See Section C - Changes in Performance Measures, page 14.
Centralized Treasury Administrative Services Budget and Performance
($148,109,000 from assessments revenue/offsetting collections):
Treasury proposes to move Centralized Treasury Administrative Services (CTAS) to the TFF,
consolidating broad-scale administrative functions and capital investment activities in one
account. CTAS provides financial management, travel, human resources, IT, real estate and
facilities management, building maintenance and other administrative services to federal
customers within and outside of Treasury.
TFF - 10
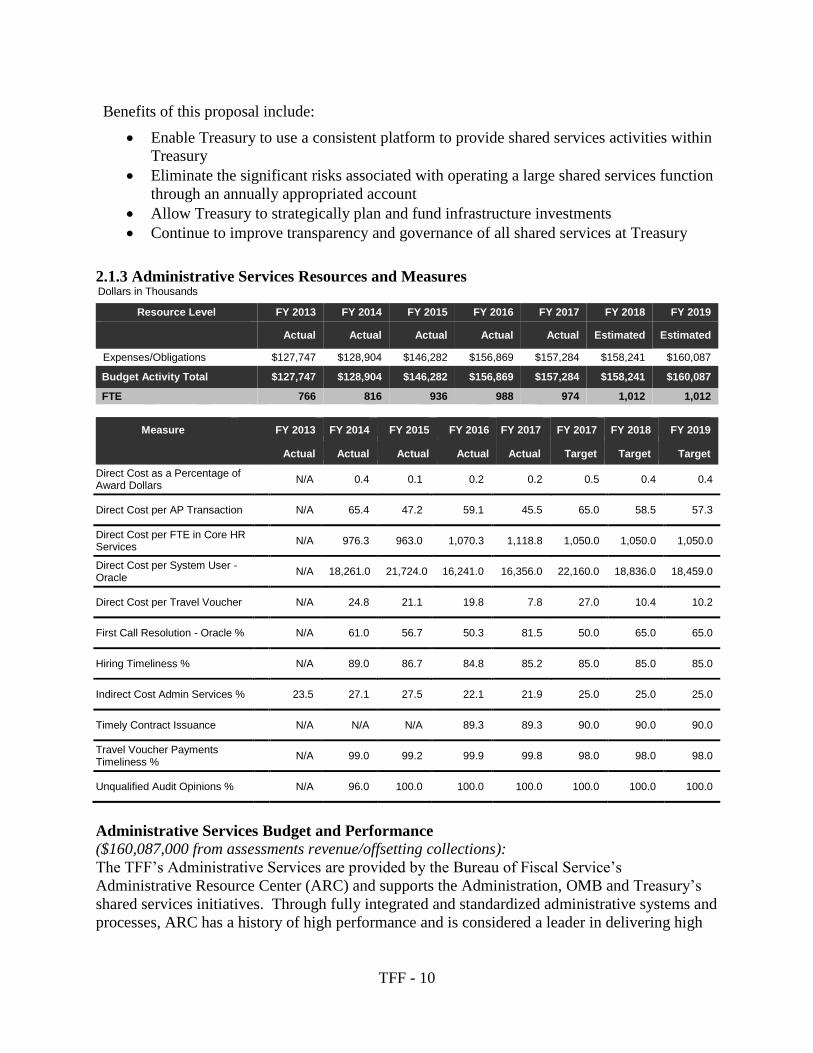
Benefits of this proposal include:
Enable Treasury to use a consistent platform to provide shared services activities within
Treasury
Eliminate the significant risks associated with operating a large shared services function
through an annually appropriated account
Allow Treasury to strategically plan and fund infrastructure investments
Continue to improve transparency and governance of all shared services at Treasury
2.1.3 Administrative Services Resources and Measures Dollars in Thousands
Resource Level FY 2013 FY 2014 FY 2015 FY 2016 FY 2017 FY 2018 FY 2019
Actual Actual Actual Actual Actual Estimated Estimated
Expenses/Obligations $127,747 $128,904 $146,282 $156,869 $157,284 $158,241 $160,087
Budget Activity Total $127,747 $128,904 $146,282 $156,869 $157,284 $158,241 $160,087
FTE 766 816 936 988 974 1,012 1,012
Measure FY 2013 FY 2014 FY 2015 FY 2016 FY 2017 FY 2017 FY 2018 FY 2019
Actual Actual Actual Actual Actual Target Target Target
Direct Cost as a Percentage of Award Dollars
N/A 0.4 0.1 0.2 0.2 0.5 0.4 0.4
Direct Cost per AP Transaction
N/A 65.4 47.2 59.1 45.5 65.0 58.5 57.3
Direct Cost per FTE in Core HR Services
N/A 976.3 963.0 1,070.3 1,118.8 1,050.0 1,050.0 1,050.0
Direct Cost per System User - Oracle
N/A 18,261.0 21,724.0 16,241.0 16,356.0 22,160.0 18,836.0 18,459.0
Direct Cost per Travel Voucher
N/A 24.8 21.1 19.8 7.8 27.0 10.4 10.2
First Call Resolution - Oracle %
N/A 61.0 56.7 50.3 81.5 50.0 65.0 65.0
Hiring Timeliness %
N/A 89.0 86.7 84.8 85.2 85.0 85.0 85.0
Indirect Cost Admin Services %
23.5 27.1 27.5 22.1 21.9 25.0 25.0 25.0
Timely Contract Issuance
N/A N/A N/A 89.3 89.3 90.0 90.0 90.0
Travel Voucher Payments Timeliness %
N/A 99.0 99.2 99.9 99.8 98.0 98.0 98.0
Unqualified Audit Opinions %
N/A 96.0 100.0 100.0 100.0 100.0 100.0 100.0
Administrative Services Budget and Performance
($160,087,000 from assessments revenue/offsetting collections):
The TFF’s Administrative Services are provided by the Bureau of Fiscal Service’s
Administrative Resource Center (ARC) and supports the Administration, OMB and Treasury’s
shared services initiatives. Through fully integrated and standardized administrative systems and
processes, ARC has a history of high performance and is considered a leader in delivering high

TFF - 11
quality and cost effective federal shared services. As a critical partner to OMB and Treasury,
Administrative Services supports:
the Financial Management Line of Business, designated FSSP by OMB,
the Budget Formulation and Execution Line of Business, designated FSSP by OMB, and
Treasury's Human Resources Line of Business.
ARC provides services in the areas of financial management, procurement, travel and relocation,
and human resources. Service value is achieved through cost sharing opportunities in systems
capital investments and maintenance, as well as, reduced operating costs through standardized,
compliant and streamlined, high quality and responsive, value added services. The
Administrative Services Activity’s success is demonstrated by its growing customer base,
increasing demand for services, meeting or exceeding our performance measures, high customer
satisfaction results and commitment to cost effective and stable customer prices.
ARC Administrative Services supports Strategic Objectives 4.3, 5.1 and 5.3.
Description of Performance:
In FY 2017 ARC continued to establish themselves as a leader in federal shared services through
meeting high expectations and performance standards; the following bullets highlight
Administrative Services’ performance:
Each service line reports a financial and quality metric.
o Direct Cost as a Percentage of Award Dollars – Procurement Services measure
comparing direct operational costs to total amount of award dollars obligated
o Direct Cost per AP Transaction – Financial Management Services measure
comparing all direct accounts payable operational costs to # of accounts payable
transactions
o Direct Cost per FTE in Core HR Services – Human Resource Services measure
comparing direct operational costs to # of unique employees serviced within
Classification, Staff Acquisition, Processing Operations, and Employee Benefits.
o Direct Cost per System User - Oracle – Systems measure comparing all Oracle direct
operational costs to # of Oracle users
o Direct Cost per Travel Voucher – Travel Services measure comparing direct
operational costs of E-Gov travel services to # travel drivers within same service
o First Call Resolution - Oracle % – Systems measure of first call resolution of call-
related tickets about Oracle concerns
o Hiring Timeliness % – Human Resource Services measure of percentage completed
of ARC portion of the hiring process within 23 calendar days
o Timely Contract Issuance – Procurement Services measure of percentage of all
contract types completed within their designated business days as labeled on service
description (varies between 60 to 120 days depending on type)
o Travel Voucher Payments Timeliness % – Travel Services measure of percentage of
approved travel vouchers, including split disbursements, paid within five business
days
o Unqualified Audit Opinions % – Financial Management measure of percentage of
audit opinions for items under ARC control and responsibility

TFF - 12
One business line measure
o Indirect Cost Admin Services % – Total indirect costs across entire Administrative
business line vs all costs
All quality measures generally within same range as previous FY except for First Call
Resolution – Oracle % because previously both email and call related tickets were considered
while FY 2017 results and future targets only focus on call related tickets. Calls are
generally less complex and more likely to be accomplished on first attempt.
All financial measures continue trend in favorable position for ARC except for one measure
discussed subsequently.
Met 9 of 11 performance metrics, the following are the two exceptions;
o Timely Contract Issuance – the Timely Contract Issuance metric was implemented in
FY 2016 and the actual performance is less than 1 percent from the initial target for
the second straight year. ARC is confident that the new metric target is achievable
and the service line owner is committed to achieving it in future years.
o Direct Cost per FTE in Core HR Services – the achievement of this service metric
was impacted by the government-wide hiring freeze. The freeze resulted in a
significant work volume decrease from historical levels supported by our federal
workforce. ARC continues to work with customer agencies to understand the
changes to the HR service demand for future years, thereby enabling them to align
resources to support the demand and achieve the cost target in FY 2018 and FY 2019.
Expanded, improved, and implemented services and new requirements in support of current
and future customers.
o Initial implementation of Oracle’s Service Oriented Architecture, provides flexibility
for third party integrations and ARC’s standard solution.
o Deployed Concur’s “Skybridge” and mobile enhancements, improving travel booking
and user convenience/experience.
o Successfully met new DATA Act reporting requirements for all customers.
Improved stakeholder confidence by receiving unmodified opinions on financial statements
for 20 Administrative Service customers and receipt of the 14th consecutive clean Statement
on Standards for Attestation Engagements (SSAE) report on ARC service controls.
In FY 2018 and FY 2019, Administrative Services will continue to provide high quality service
and continue support of shared services in transforming the way federal administrative services
are delivered. This will include a commitment to expanding shared service usage, meeting or
exceeding service metrics, and continuing efforts to improve efficiency and effectiveness,
including upgrades to the Oracle E-Business Suite and other support systems, and deployment of
business intelligence/data analytics and accounting reconciliation and financial statement
solutions.
TFF - 13
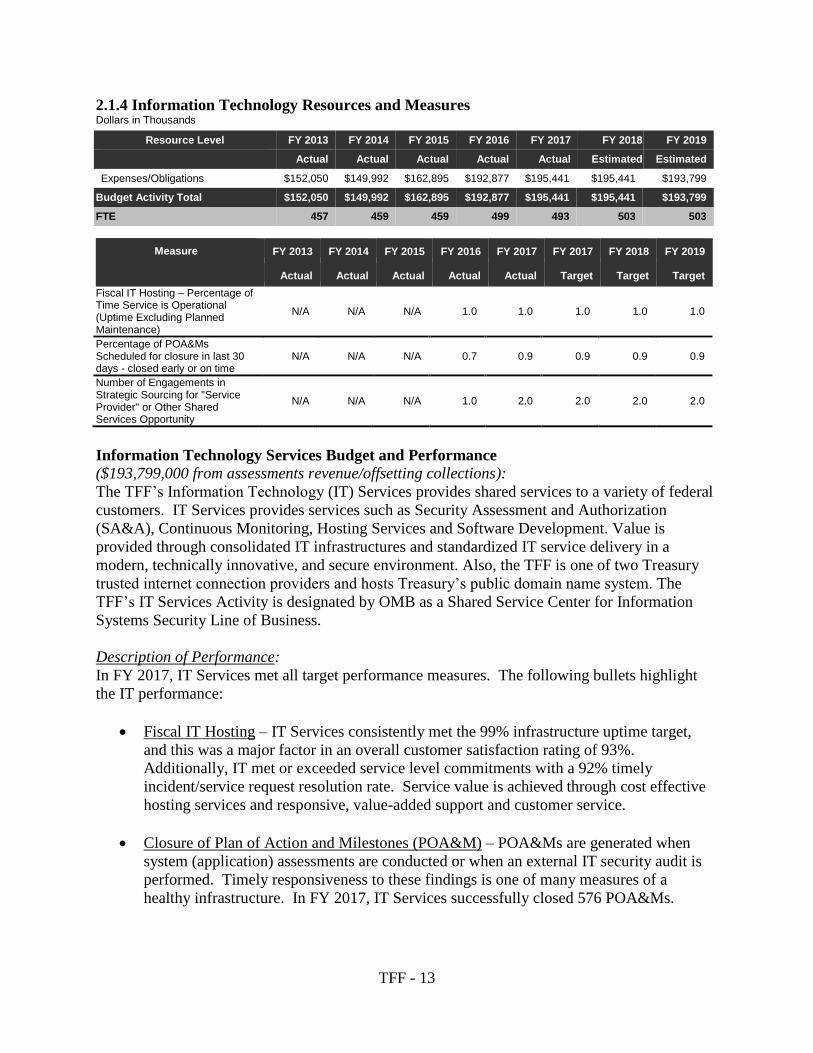
2.1.4 Information Technology Resources and Measures Dollars in Thousands
Resource Level FY 2013 FY 2014 FY 2015 FY 2016 FY 2017 FY 2018 FY 2019
Actual Actual Actual Actual Actual Estimated Estimated
Expenses/Obligations $152,050 $149,992 $162,895 $192,877 $195,441 $195,441 $193,799
Budget Activity Total $152,050 $149,992 $162,895 $192,877 $195,441 $195,441 $193,799
FTE 457 459 459 499 493 503 503
Measure FY 2013 FY 2014 FY 2015 FY 2016 FY 2017 FY 2017 FY 2018 FY 2019
Actual Actual Actual Actual Actual Target Target Target
Fiscal IT Hosting – Percentage of Time Service is Operational (Uptime Excluding Planned Maintenance)
N/A N/A N/A 1.0 1.0 1.0 1.0 1.0
Percentage of POA&Ms Scheduled for closure in last 30 days - closed early or on time
N/A N/A N/A 0.7 0.9 0.9 0.9 0.9
Number of Engagements in Strategic Sourcing for "Service Provider" or Other Shared Services Opportunity
N/A N/A N/A 1.0 2.0 2.0 2.0 2.0
Information Technology Services Budget and Performance
($193,799,000 from assessments revenue/offsetting collections):
The TFF’s Information Technology (IT) Services provides shared services to a variety of federal
customers. IT Services provides services such as Security Assessment and Authorization
(SA&A), Continuous Monitoring, Hosting Services and Software Development. Value is
provided through consolidated IT infrastructures and standardized IT service delivery in a
modern, technically innovative, and secure environment. Also, the TFF is one of two Treasury
trusted internet connection providers and hosts Treasury’s public domain name system. The
TFF’s IT Services Activity is designated by OMB as a Shared Service Center for Information
Systems Security Line of Business.
Description of Performance:
In FY 2017, IT Services met all target performance measures. The following bullets highlight
the IT performance:
Fiscal IT Hosting – IT Services consistently met the 99% infrastructure uptime target,
and this was a major factor in an overall customer satisfaction rating of 93%.
Additionally, IT met or exceeded service level commitments with a 92% timely
incident/service request resolution rate. Service value is achieved through cost effective
hosting services and responsive, value-added support and customer service.
Closure of Plan of Action and Milestones (POA&M) – POA&Ms are generated when
system (application) assessments are conducted or when an external IT security audit is
performed. Timely responsiveness to these findings is one of many measures of a
healthy infrastructure. In FY 2017, IT Services successfully closed 576 POA&Ms.

TFF - 14
Number of engagements for strategic sourcing – This metric is defined as new work
(Hosting, Security Services, Software Engineering, etc.) outside of the current scope for
existing customers, onboarding of new customers, or establishment of a contract vehicle
for Treasury or Government-wide use. In the second quarter of FY 2017, IT Services
took the lead on awarding a Treasury-wide strategic contract vehicle for Adobe licenses.
In the third quarter, IT performed a Security Assessment & Accreditation (SA&A)
review for a HHS system that had not previously been part of our customer portfolio.
For FY 2018 and FY 2019, IT Services continues to strive for high performance targets for all
three performance measures and will use targeted efforts with regular reviews to monitor
progress.
C – Changes in Performance Measures
Performance Measure or Indicator Change and Justification
1. Average Cost per FTE
(New SSP Performance Measure)
This target measures the cost to Treasury
customers for SSP programs. The total budget
for Treasury shared programs, excluding
customer specific requests and modifications,
is divided by the number of enacted Treasury
FTE to determine the per FTE cost for these
programs. SSP strives to provide these shared
services to customers at a competitive price.
The FY 2019 target is based on historical
budget data. See section 2.1 Shared Services
Programs Resources and Measures.
2. Annual Effective Spend Rate:
(New SSP Performance Measure)
This target measures the obligation rate for
SSP programs, excluding funds that are
collected for reserve programs. SSP strives to
attain a high obligation rate to ensure that
customers pay accurate prices for services
rendered. The FY 2019 target is based on
historical budget data. See 2.1.1 Shared
Services Programs Resources and Measures.
3. Annual Effective Spend Rate:
(New CTAS Performance Measure)
This target measures the obligation rate for
CTAS programs, excluding funds that are
collected for reserve programs. CTAS strives
to attain a high obligation rate to ensure that
customers pay accurate prices for services
rendered. The FY 2019 target is based on
historical budget data. See section 2.1.2 CTAS
Resources and Measures.
With the publication of the Treasury Strategic Plan for FY 2018-2022, the TFF will work this
year to baseline its performance against the new strategic objectives. This could result in
additional changes to performance measures in the FY 2020 budget.

TFF - 15
Section III – Additional Information
A – Summary of Capital Investments
The TFF’s planned investments enhance the capabilities and capacity of our financial
management shared services. Investing in Service Oriented Architecture will allow customers to
streamline application connections resulting in benefits that include reducing development time,
using industry development best practices for coding efforts, allowing real time processing of
transactional data between systems, and independent communication between systems. This
effort will also reduce redundancy, providing more flexible and efficient interfaces with
customers' third-party applications.
The TFF plans to expand the use of an enterprise-wide financial statement reporting tool and
update operational (transactional) reporting and analytical tools in order to provide a more
efficient interpretation of large volumes of data, long-term stability, and improved presentation
and distribution capabilities.
A summary of capital investment resources, including major IT and non-technology investments
can be found at:
http://www.treasury.gov/about/budget-performance/Pages/summary-of-capital-investments.aspx
This website also contains a digital copy of this document.
ARC’s capital investments are contained within the Fiscal Service capital investment summary.
SSP’s capital investments are contained within the Departmental Offices capital investment
summary.
B - TFF Program Costs
This information is provided to fulfill requirements of the annual Financial Services and General
Government appropriations bill (Section 124 in the FY 2017 enacted).

TFF - 16
Treasury Franchise Fund – Shared Services Programs, FY 2017 Total Charges by
Customer
2017 SSP Customers
Enterprise
Business
Solutions
Infrastructure
OperationsCybersecurity
IT Strategy And
Technology
Management
Non-
Information
Technology
Services
Total
Alcohol Tobacco Tax and Trade Bureau 356,720 584,796 83,284 24,296 312,173 1,361,268
Bureau of Printing and Engraving 1,435,546 4,038,810 235,249 92,748 873,254 6,675,607
Bureau of the Fiscal Service 5,499,956 765,586 358,828 110,247 1,515,240 8,249,857
Consumer Financial Protection Bureau 1,234,709 5,790 411 199,736 1,440,646
Commodities Futures Trading Commission 58,310 58,310
DHS Customs and Immigration Service 66,759 66,759
DHS Headquarter 165,784 165,784
DHS U.S. Secret Service 1,498,752 22,648 1,607 63,912 1,586,919
Community Development Financial
Institutions Fund227,034 38,532 7,813 3,808 117,933 395,120
DC Pensions 27,829 101,135 4,706 964 67,065 201,700
Federal Financing Bank 143,566 161,753 7,524 1,543 67,966 382,352
Financial Stability Oversight Council 322,971 180,598 7,996 1,639 64,164 577,368
Treasury Office of Financial Research 216,829 5,539,490 237,890 11,087 396,317 6,401,612
Treasury Office of Financial Stability 1,133,836 415,407 17,642 3,615 292,850 1,863,350
Treasury Office of Technical Assistance 21,405 104,337 3,295 675 186,588 316,299
Small Business Lending Fund Administration 27,793 96,074 4,471 916 49,415 178,669
Treasury Departmental Offices 5,340,002 7,786,985 1,050,181 71,103 3,406,520 17,654,792
State Small Business Credit Initiative
Administration20,577 45,578 2,123 434 54,857 123,568
Treasury Executive Office of Asset Forfeiture 1,230,224 190,127 6,822 1,398 110,179 1,538,751
Treasury Terrorism Risk Insurance Program 7,941 50,532 2,351 482 26,682 87,988
Department of Commerce 11,159,248 169,597 12,034 608,886 11,949,764
DOD - U.S. Air Force 135,907 135,907
Department of Energy 1,560 1,560
Department of Interior 92,715 3,815 96,530
DOJ - Drug Enforcement Agency 40,019 40,019
DOJ - Executive Office of Immigration Review 12,979 12,979
DOJ Alcohol Tobacco Firearms and Explosives 1,686,040 29,061 2,062 122,141 1,839,303
Department of Labor 5,156,661 56,365 4,000 205,953 5,422,979
DOL - Bureau of Labor Statistics 31,366 31,366
DOL - Office of the Inspector General 5,408 5,408
DOT Federal Transit Agency 24,780 24,780
Department of Education 114,324 114,324
Export Import Bank Office of the Inspector
General4,326 4,326
Federal Communications Commission 46,007 1,844 47,851
Federal Deposit Insurance Corporation 164,512 3,716 168,228
Federal Deposit Insurance Corporation -
Office of the Inspector General10,572 10,572
Federal Emergency Management Agency 399,159 101,324 500,483
Federal Housing Finance Agency 55,190 55,190
Financial Crimes Enforcment Network 249,276 1,008,157 54,808 16,583 254,600 1,583,424

TFF - 17
2017 SSP Customers
Enterprise
Business
Solutions
Infrastructure
OperationsCybersecurity
IT Strategy And
Technology
Management
Non-
Information
Technology
Services
Total
Federal Reserve Board 4,332 4,332
Government Accountability Office 639,567 11,043 784 27,364 678,758
General Services Administration 150,638 150,638
Housing and Urban Development 3,614,457 26,454 1,877 297,611 3,940,398
HUD - Office of Inspector General 173,633 173,633
Internal Revenue Service 42,944,733 67,956,930 8,889,397 4,006,139 15,238,678 139,035,876
U.S. Mint 1,495,602 1,461,722 249,858 90,338 973,334 4,270,853
National Records and Archives
Administration41,398 41,398
Office of the Comptroller of the Currency 2,263,597 1,174,067 394,653 169,800 892,601 4,894,718
Office of Government Ethics 6,455 6,455
Treasury Office of Inspector General 214,281 476,167 27,866 10,268 124,013 852,596
Overseas Private Investment Corporation 18,067 18,067
Peace Corps 138,833 4,555 143,388
Small Business Administration 604,574 68,407 672,982
Special Inspector General for TARP 265,059 1,073,480 45,160 9,256 161,611 1,554,565
National Gallery of Art 30,285 30,285
TFF - Administrative Resource Center/1 1,489,592 2,599,993 148,968 72,260 389,797 4,700,610
Treasury Inspector General for Tax
Administration658,883 2,340,112 132,207 41,505 396,366 3,569,073
USAID 2,746,198 17,331 1,230 104,920 2,869,678
Veterans Affairs 71,306 71,306
Total 94,953,316 98,528,658 11,997,092 4,741,104 28,844,736 239,064,905
1/ SSP bills all customers for services, including ARC. SSP costs collected from ARC are initially billed and collected from the ARC customers.
TFF - 18
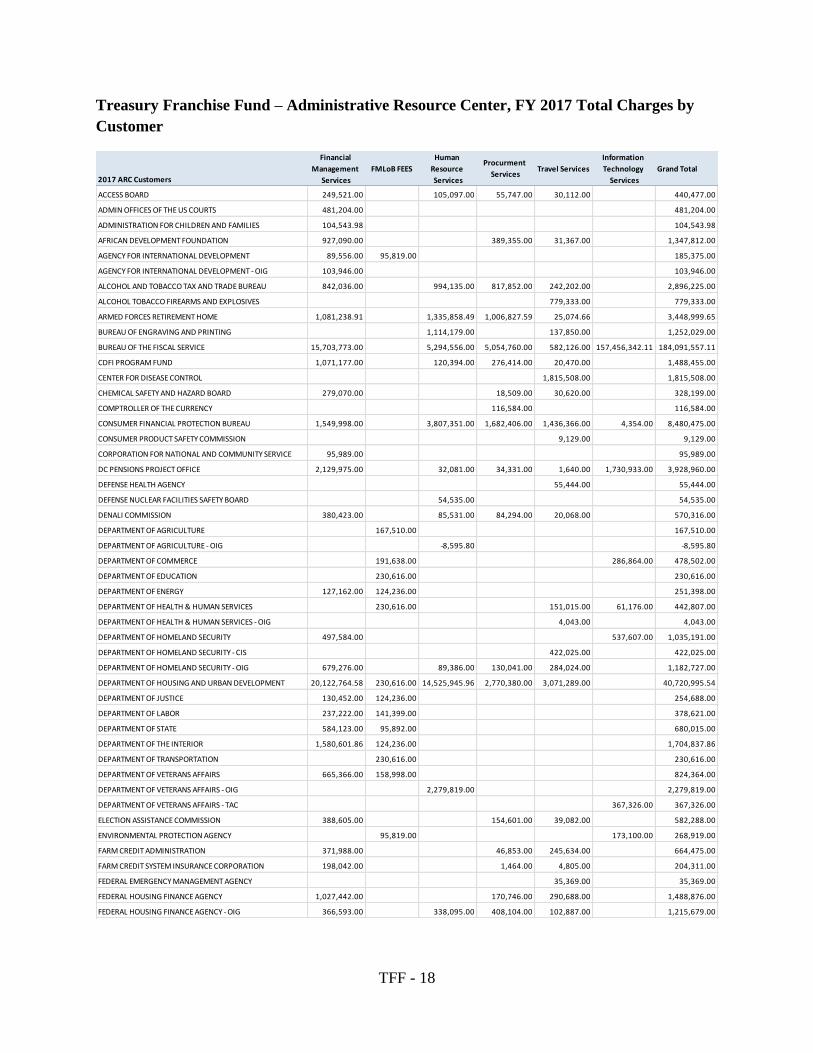
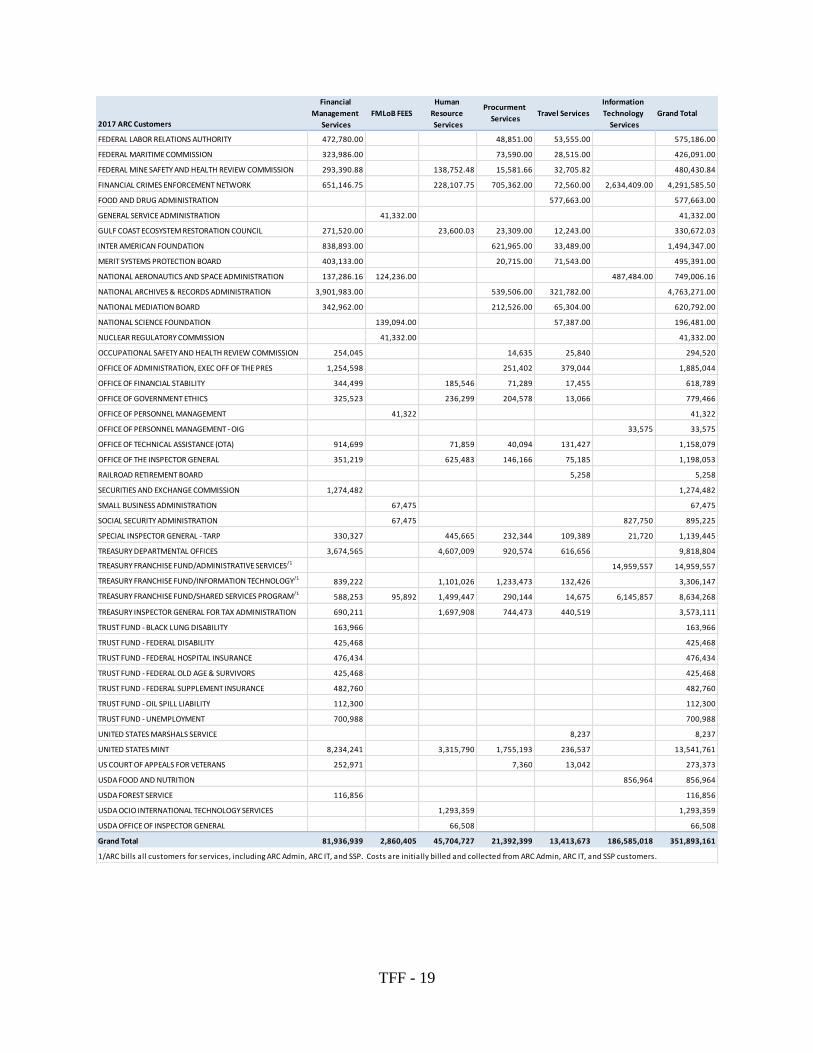
Treasury Franchise Fund – Administrative Resource Center, FY 2017 Total Charges by
Customer
2017 ARC Customers
Financial
Management
Services
FMLoB FEES
Human
Resource
Services
Procurment
ServicesTravel Services
Information
Technology
Services
Grand Total
ACCESS BOARD 249,521.00 105,097.00 55,747.00 30,112.00 440,477.00
ADMIN OFFICES OF THE US COURTS 481,204.00 481,204.00
ADMINISTRATION FOR CHILDREN AND FAMILIES 104,543.98 104,543.98
AFRICAN DEVELOPMENT FOUNDATION 927,090.00 389,355.00 31,367.00 1,347,812.00
AGENCY FOR INTERNATIONAL DEVELOPMENT 89,556.00 95,819.00 185,375.00
AGENCY FOR INTERNATIONAL DEVELOPMENT - OIG 103,946.00 103,946.00
ALCOHOL AND TOBACCO TAX AND TRADE BUREAU 842,036.00 994,135.00 817,852.00 242,202.00 2,896,225.00
ALCOHOL TOBACCO FIREARMS AND EXPLOSIVES 779,333.00 779,333.00
ARMED FORCES RETIREMENT HOME 1,081,238.91 1,335,858.49 1,006,827.59 25,074.66 3,448,999.65
BUREAU OF ENGRAVING AND PRINTING 1,114,179.00 137,850.00 1,252,029.00
BUREAU OF THE FISCAL SERVICE 15,703,773.00 5,294,556.00 5,054,760.00 582,126.00 157,456,342.11 184,091,557.11
CDFI PROGRAM FUND 1,071,177.00 120,394.00 276,414.00 20,470.00 1,488,455.00
CENTER FOR DISEASE CONTROL 1,815,508.00 1,815,508.00
CHEMICAL SAFETY AND HAZARD BOARD 279,070.00 18,509.00 30,620.00 328,199.00
COMPTROLLER OF THE CURRENCY 116,584.00 116,584.00
CONSUMER FINANCIAL PROTECTION BUREAU 1,549,998.00 3,807,351.00 1,682,406.00 1,436,366.00 4,354.00 8,480,475.00
CONSUMER PRODUCT SAFETY COMMISSION 9,129.00 9,129.00
CORPORATION FOR NATIONAL AND COMMUNITY SERVICE 95,989.00 95,989.00
DC PENSIONS PROJECT OFFICE 2,129,975.00 32,081.00 34,331.00 1,640.00 1,730,933.00 3,928,960.00
DEFENSE HEALTH AGENCY 55,444.00 55,444.00
DEFENSE NUCLEAR FACILITIES SAFETY BOARD 54,535.00 54,535.00
DENALI COMMISSION 380,423.00 85,531.00 84,294.00 20,068.00 570,316.00
DEPARTMENT OF AGRICULTURE 167,510.00 167,510.00
DEPARTMENT OF AGRICULTURE - OIG -8,595.80 -8,595.80
DEPARTMENT OF COMMERCE 191,638.00 286,864.00 478,502.00
DEPARTMENT OF EDUCATION 230,616.00 230,616.00
DEPARTMENT OF ENERGY 127,162.00 124,236.00 251,398.00
DEPARTMENT OF HEALTH & HUMAN SERVICES 230,616.00 151,015.00 61,176.00 442,807.00
DEPARTMENT OF HEALTH & HUMAN SERVICES - OIG 4,043.00 4,043.00
DEPARTMENT OF HOMELAND SECURITY 497,584.00 537,607.00 1,035,191.00
DEPARTMENT OF HOMELAND SECURITY - CIS 422,025.00 422,025.00
DEPARTMENT OF HOMELAND SECURITY - OIG 679,276.00 89,386.00 130,041.00 284,024.00 1,182,727.00
DEPARTMENT OF HOUSING AND URBAN DEVELOPMENT 20,122,764.58 230,616.00 14,525,945.96 2,770,380.00 3,071,289.00 40,720,995.54
DEPARTMENT OF JUSTICE 130,452.00 124,236.00 254,688.00
DEPARTMENT OF LABOR 237,222.00 141,399.00 378,621.00
DEPARTMENT OF STATE 584,123.00 95,892.00 680,015.00
DEPARTMENT OF THE INTERIOR 1,580,601.86 124,236.00 1,704,837.86
DEPARTMENT OF TRANSPORTATION 230,616.00 230,616.00
DEPARTMENT OF VETERANS AFFAIRS 665,366.00 158,998.00 824,364.00
DEPARTMENT OF VETERANS AFFAIRS - OIG 2,279,819.00 2,279,819.00
DEPARTMENT OF VETERANS AFFAIRS - TAC 367,326.00 367,326.00
ELECTION ASSISTANCE COMMISSION 388,605.00 154,601.00 39,082.00 582,288.00
ENVIRONMENTAL PROTECTION AGENCY 95,819.00 173,100.00 268,919.00
FARM CREDIT ADMINISTRATION 371,988.00 46,853.00 245,634.00 664,475.00
FARM CREDIT SYSTEM INSURANCE CORPORATION 198,042.00 1,464.00 4,805.00 204,311.00
FEDERAL EMERGENCY MANAGEMENT AGENCY 35,369.00 35,369.00
FEDERAL HOUSING FINANCE AGENCY 1,027,442.00 170,746.00 290,688.00 1,488,876.00
FEDERAL HOUSING FINANCE AGENCY - OIG 366,593.00 338,095.00 408,104.00 102,887.00 1,215,679.00
TFF - 19
2017 ARC Customers
Financial
Management
Services
FMLoB FEES
Human
Resource
Services
Procurment
ServicesTravel Services
Information
Technology
Services
Grand Total
FEDERAL LABOR RELATIONS AUTHORITY 472,780.00 48,851.00 53,555.00 575,186.00
FEDERAL MARITIME COMMISSION 323,986.00 73,590.00 28,515.00 426,091.00
FEDERAL MINE SAFETY AND HEALTH REVIEW COMMISSION 293,390.88 138,752.48 15,581.66 32,705.82 480,430.84
FINANCIAL CRIMES ENFORCEMENT NETWORK 651,146.75 228,107.75 705,362.00 72,560.00 2,634,409.00 4,291,585.50
FOOD AND DRUG ADMINISTRATION 577,663.00 577,663.00
GENERAL SERVICE ADMINISTRATION 41,332.00 41,332.00
GULF COAST ECOSYSTEM RESTORATION COUNCIL 271,520.00 23,600.03 23,309.00 12,243.00 330,672.03
INTER AMERICAN FOUNDATION 838,893.00 621,965.00 33,489.00 1,494,347.00
MERIT SYSTEMS PROTECTION BOARD 403,133.00 20,715.00 71,543.00 495,391.00
NATIONAL AERONAUTICS AND SPACE ADMINISTRATION 137,286.16 124,236.00 487,484.00 749,006.16
NATIONAL ARCHIVES & RECORDS ADMINISTRATION 3,901,983.00 539,506.00 321,782.00 4,763,271.00
NATIONAL MEDIATION BOARD 342,962.00 212,526.00 65,304.00 620,792.00
NATIONAL SCIENCE FOUNDATION 139,094.00 57,387.00 196,481.00
NUCLEAR REGULATORY COMMISSION 41,332.00 41,332.00
OCCUPATIONAL SAFETY AND HEALTH REVIEW COMMISSION 254,045 14,635 25,840 294,520
OFFICE OF ADMINISTRATION, EXEC OFF OF THE PRES 1,254,598 251,402 379,044 1,885,044
OFFICE OF FINANCIAL STABILITY 344,499 185,546 71,289 17,455 618,789
OFFICE OF GOVERNMENT ETHICS 325,523 236,299 204,578 13,066 779,466
OFFICE OF PERSONNEL MANAGEMENT 41,322 41,322
OFFICE OF PERSONNEL MANAGEMENT - OIG 33,575 33,575
OFFICE OF TECHNICAL ASSISTANCE (OTA) 914,699 71,859 40,094 131,427 1,158,079
OFFICE OF THE INSPECTOR GENERAL 351,219 625,483 146,166 75,185 1,198,053
RAILROAD RETIREMENT BOARD 5,258 5,258
SECURITIES AND EXCHANGE COMMISSION 1,274,482 1,274,482
SMALL BUSINESS ADMINISTRATION 67,475 67,475
SOCIAL SECURITY ADMINISTRATION 67,475 827,750 895,225
SPECIAL INSPECTOR GENERAL - TARP 330,327 445,665 232,344 109,389 21,720 1,139,445
TREASURY DEPARTMENTAL OFFICES 3,674,565 4,607,009 920,574 616,656 9,818,804
TREASURY FRANCHISE FUND/ADMINISTRATIVE SERVICES/114,959,557 14,959,557
TREASURY FRANCHISE FUND/INFORMATION TECHNOLOGY/1839,222 1,101,026 1,233,473 132,426 3,306,147
TREASURY FRANCHISE FUND/SHARED SERVICES PROGRAM/1588,253 95,892 1,499,447 290,144 14,675 6,145,857 8,634,268
TREASURY INSPECTOR GENERAL FOR TAX ADMINISTRATION 690,211 1,697,908 744,473 440,519 3,573,111
TRUST FUND - BLACK LUNG DISABILITY 163,966 163,966
TRUST FUND - FEDERAL DISABILITY 425,468 425,468
TRUST FUND - FEDERAL HOSPITAL INSURANCE 476,434 476,434
TRUST FUND - FEDERAL OLD AGE & SURVIVORS 425,468 425,468
TRUST FUND - FEDERAL SUPPLEMENT INSURANCE 482,760 482,760
TRUST FUND - OIL SPILL LIABILITY 112,300 112,300
TRUST FUND - UNEMPLOYMENT 700,988 700,988
UNITED STATES MARSHALS SERVICE 8,237 8,237
UNITED STATES MINT 8,234,241 3,315,790 1,755,193 236,537 13,541,761
US COURT OF APPEALS FOR VETERANS 252,971 7,360 13,042 273,373
USDA FOOD AND NUTRITION 856,964 856,964
USDA FOREST SERVICE 116,856 116,856
USDA OCIO INTERNATIONAL TECHNOLOGY SERVICES 1,293,359 1,293,359
USDA OFFICE OF INSPECTOR GENERAL 66,508 66,508
Grand Total 81,936,939 2,860,405 45,704,727 21,392,399 13,413,673 186,585,018 351,893,161
1/ARC bills all customers for services, including ARC Admin, ARC IT, and SSP. Costs are initially billed and collected from ARC Admin, ARC IT, and SSP customers.