Embed Size (px)
Citation preview

Department of the NavyFY2012 In-Progress Review
to Acting Deputy Under Secretary of Defense
(Installations and Environment)
Leslie Holland, MS, CSP, CIH Director, Occupational Safety and Health
ODASN (Safety)
March 25, 2013

Agenda
• Potential Impacts to Safety from Sequestration
• Attachment 1 – Requested Briefing Subjects– Risk Assessment– Risk Control– Mishap Investigations– Management System Implementation
• Attachment 2 – Backup Data– 5-year trends
• Military Mishap Fatalities • Aviation Class A Mishap Rates• Civilian and Military Injury & Illness Rates• Hearing Loss Rates
2

Potential Impacts to Safety from Sequestration
The Department of the Navy anticipates as-yet-unknown decrements to its operational system from the austere fiscal
climate that will reveal themselves in many ways, both short and long term.
Safety performance will be an important indicator of those impacts to the Department.
3

Potential Impacts to Safety from Sequestration
Military Personnel Decrements in proficiency due reduced flying and steaming
hours, mission evolutions, reduced training Negative human factors outcomes from burden of reduced civilian manning (e.g., fatigue, error, lack of expertise) Continued pressure to continue to perform with fewer resources Reduced civilian manning in performance of functions with high risk impact (e.g. air traffic controllers, high risk training, etc.)
Civilian Personnel Reduced proficiency due to reduced work task evolutions, training Inability to meet production demands with fewer man hours Increase in workers compensation claims Work-induced stress from financial impacts Reduced safety oversight
4

Potential Impacts to Safety from Sequestration
Infrastructure Secondary consequences from delayed or non-availability of mission-specific platforms Reduction in system redundancies Degradation of infrastructure with secondary impacts (e.g., explosives safety,
bird strikes,etc.) Equipment loss/damage due to reduced maintenance.
Mission Safety Support Requirements Inability to meet mission safety support requirements with impacts to mission readiness:
• Loss of safety billets• Loss of lessons learned from mishap investigations• Fewer safety inspections leading to unidentified latent hazards• Less motorcycle training• Reduced ESAMS* contract support
* Enterprise Safety Applications Management Systems 5

Potential Impacts to Safety from Sequestration
- Actions -
Leadership, Leadership, Leadership Under Secretary Statement ASN (EI&E) Statement CNO Directive US Fleet Forces Commander
“I rely on you to be bold and accountable and, when required, say ‘no’ when sailors and units have reached their safe limits,”
Chief of Naval Operations Adm. Jon Greenert, NAVADMIN 041/13
“Top brass have warned of a more dire consequence if the Navy isn't allowed to shrink its global mission to match economic realities: more accidents. -- could lead to
fatigued sailors and hazardous results”—"We're not going to do this any faster than safe,“ --"We won't push out anybody who isn't ready for the mission.“
ADM Bill Gortney, U.S. Fleet Forces Command and Retired Vice Adm. Peter Daly, chief executive officer of the U.S. Naval Institute, in Navy Times Article, Navy Officials: Cuts Could Degrade Fleet, Safety, 20 Feb 2013
6
Attachment 1Requested Briefing Subjects
7

Risk Assessment-Workplace Visits-Percent Completion (%)
1. Local - Annual Inspections (includes high, medium, low risk) (# Performed/# Required) a. Navy – 96%b. Marine Corps – 100%
2. Command Self-Assessments – Annual - (# Performed/ # Required )c. Navy - 88%d. Marine Corps – 100%
3. Headquarters Oversight (trienniel) – (# Performed/ # Required) e. Navy - 73% (Most at or near 100% with exception of two commands)b. Marine Corps – 100%
Source: Naval Safety Center; CMC Safety Division 8

0
10
20
30
40
50
60
70
80
90
100
FY 07 FY 08 FY 09 FY 10 FY 11 FY 12
Perc
ent W
orkp
lace
Haz
ard
Char
acte
rizati
ons
Com
plet
ed
High Risk
Medium Risk
Low Risk
Afloat
Emergent
DOEHRS-IH
Risk Assessment-Workplace Hazard Characterizations-
Percent Completion (%)
FY 12 DOEHRS-IH Category 1 (High Risk) Completion Metric: 72%
% Workplace Hazard Characterizations Completed = # Workplaces Assessed x 100% / # Workplaces Requiring Assessment
- 91%
- 90%- 87%
- 89%
- 100%
- 72%(Cat 1 – High Risk)
Source: BUMED metrics; DOEHRS IH- Defense Occupational and Environmental Health Readiness System (Industrial Hygiene)
9 9

0
10
20
30
40
50
60
70
80
90
100
FY 07 FY08 FY 09 FY 10 FY 11 FY 12
Pe
rce
nt
of
Mo
nit
ori
ng
Pla
ns
Co
mp
lete
d
% Activities with Current Exposure Monitoring Plan (EMP)
% Samples Specified in the EMP Collected
DOEHRS-IH WMP Metric
FY 12 DOEHRS-IH Monitoring Plans Completed Metric: 33.8%
% Workplace Monitoring Plan (WMP) Closed = # WMP Started & Completed x 100% / Total # of WMP
Source: BUMED metrics; DOEHRS IH- Defense Occupational and Environmental Health Readiness System (Industrial Hygiene)
10
Risk Assessment-Monitoring Plans Completed-
Percent Completion (%)
10

NavyTotal Medical Surveillance
Completion Rate
NavyAudiogram Completion
Rate
USMCTotal Medical Surveillance
Completion Rate
USMCAudiogram
Completion Rate
FY12 87% (464,991/533,934)
86% (128,669/149,933)
78% (243243/312101)
76% (210037/276505)
- All -
78% **(140338/179652)
- Active Duty -
Risk Assessment -Medical Surveillance & Audiograms-
Tracking
Source: Navy: NAVADMIN 213/12 Data Call ; USMC: MARADMIN 581/12 and MRRS HCP Report 11

Inter-Service Support Agreements• Varies by location; in some cases, ISSAs don’t exist
• Joint Base Safety Working Group (JBSWG) – Established under the Joint Service Safety Council (JSSC) to address joint safety management concerns.
Navy LeadNS Pearl Harbor/Hickam AFB = Joint Base Pearl Harbor-HickamNavy Base Guam/Andersen AFB = Joint Region MarianasAnacostia Annex/Bolling AFB = Joint Base Anacostia-BollingNAB Little Creek/Ft Story = Joint Base Little Creek-Story
Army LeadFt Myer/Henderson Hall = Joint Base Myer-Henderson Hall
Air Force LeadCharleston AFB/NWS Charleston = Joint Base CharlestonMcGuire AFB/Ft Dix/NAES Lakehurst = Joint Base McGuire-Dix-LakehurstAndrews AFB/NAF Washington = Joint Base Andrews-Naval Air Facility Washington
12
Lead service provides
Installation Support for
the entire Joint Base
incl. Safety

RAC 1 Hazards(Mitigated or Abated within
10 Days)
RAC 2 Hazards(Mitigated or Abated within
30 Days)
RAC 3 Hazards(Mitigated or Abated within
90 Days)
Navy 98% 66% 74%
Marine Corps 100% 56% 67%
Risk Control-Hazard Mitigation-
Percentage of Safety and Health Hazards Mitigated or Permanently Abated (%)
Source: Naval Safety Center; CMC Safety Division 13

CurrentDSES Defense Safety Enterprise System WESS Web Enabled Safety System
CZR Combat Zone Reports ESAMS Enterprise Safety and Management System SaFER Safety First Event Reporting (Marine Corps) SOUMS Safety of Use MessagesMCCLL Lessons Learned Reporting (Marine Corps) QDR Product Deficiency Reporting / Quality Deficiency
Reports AHLTA Armed Forces Health Longitudinal
Technology ApplicationWAMHRS WESS Aviation Mishap and Hazard Reporting
System Significant Events Journal Entries – Operational Command SIPR (High-side Entries)Daily personal reconciliation with medical and maintenance reports OPREP-3 (Serious Incident Report)
Navy and Marine Corps Public Health Center EpiData Center Department completed FY12 review of injury data abstracted from standard inpatient and outpatient medical encounter records for all AD Navy service members.
Future
TRICARE Medical Data; MOU developed and undergoing review
SaFER Safety First Event Reporting (Navy)
Mishap Investigations-Data Sources Used to Identify Mishaps-
14

Management System Implementation- Status -
• OSHA Voluntary Protection Program (VPP)• 15 Navy and Marine Corps VPP Star Sites• 3 VPP Star “like” sites OCONUS• Multiple sites at various stages of implementation
• Navy Civilian Maritime Fleet – Military Sealift Command (MSC)• Adopted the International Maritime Organization (IMO) International
Management System (ISM) as the MSC Safety Management System (SMS)• Fleet-wide, well-established, high functioning SMS
• Naval Aviation • Publication of OPNAVINST 3750.6S, Naval Aviation Safety Management System, in
progress• Based on Federal Aviation Administration’s SMS
• Department of the Navy (DON) • Overarching DON SMS will be represented in the Secretary of the Navy Instruction
5100.10K, Department of Navy Safety Program (in draft) • DON SMS will overlay existing management systems• Policy will apply life cycle, systems approach
15

Attachment 2Backup Data
16
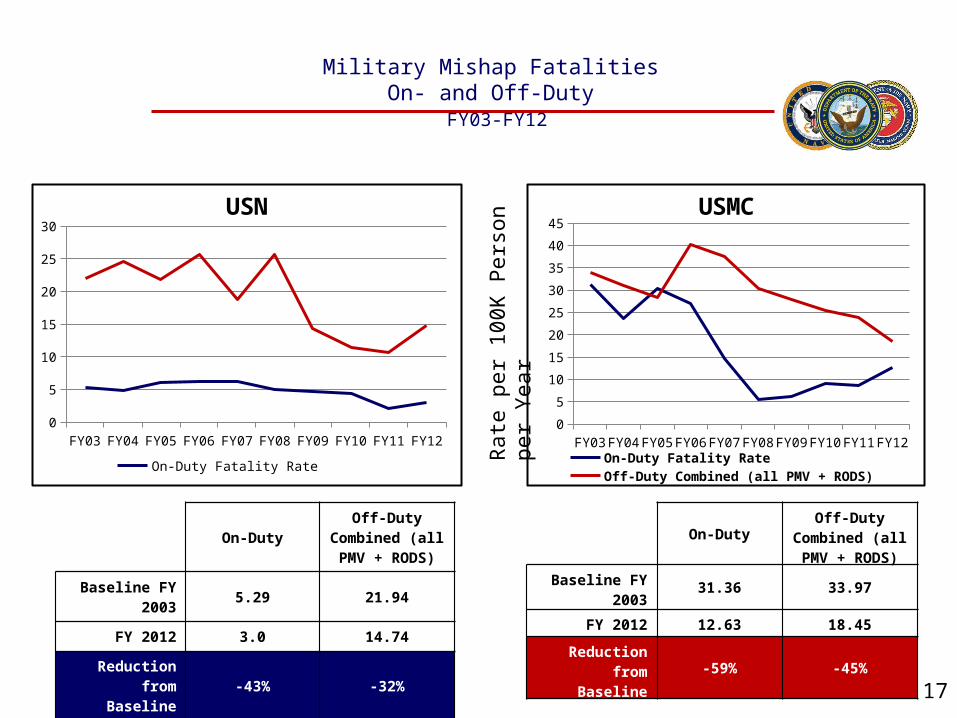
Military Mishap FatalitiesOn- and Off-Duty
FY03-FY12
On-DutyOff-Duty
Combined (all PMV + RODS)
Baseline FY 2003 5.29 21.94
FY 2012 3.0 14.74
Reduction from Baseline -43% -32%
17
Rate
per
100
K Pe
rson
per
Yea
r
On-DutyOff-Duty
Combined (all PMV + RODS)
Baseline FY 2003 31.36 33.97
FY 2012 12.63 18.45
Reduction from Baseline -59% -45%
FY03 FY04 FY05 FY06 FY07 FY08 FY09 FY10 FY11 FY120
5
10
15
20
25
30
On-Duty Fatality Rate Off-Duty Combined (PMV + RODS
USN
FY03 FY04 FY05 FY06 FY07 FY08 FY09 FY10 FY11 FY120
5
10
15
20
25
30
35
40
45
On-Duty Fatality Rate Off-Duty Combined (all PMV + RODS)
USMC

Aviation Class A Mishap Rates-Total*-
FY03-FY12
Baseline FY 2003 2.55
FY 2012 0.98
Reduction from Baseline
-62%
Baseline FY 2002 2.91
FY 2012 2.53
Reduction from Baseline
- 13%
*does not include UAVsSource: Naval Safety Center 18
FY03 FY04 FY05 FY06 FY07 FY08 FY09 FY10 FY11 FY120
1
2
3
4
5
6
7
Class A Mishap Rate per 100K Flight Hours
USMC
FY03 FY04 FY05 FY06 FY07 FY08 FY09 FY10 FY11 FY120
0.5
1
1.5
2
2.5
3
Class A Mishap Rate per 100K Flight Hours
USN

Class A Mishap Rates- Fixed Wing –
FY02-FY12
Baseline FY 2002 1.15
FY 2012 0.75
Reduction from Baseline
-35%
Baseline FY 2002 4.32
FY 2012 1.58
Reduction from Baseline
- 63%
Source: Naval Safety Center
FY02 FY03 FY04 FY05 FY06 FY07 FY 08 FY 09 FY10 FY11 FY120
0.5
1
1.5
2
2.5
3
USN
Fixed Wing Class A Mishap Rate per 100K Flt Hrs
FY02 FY03 FY04 FY05 FY06 FY07 FY08 FY09 FY10 FY11 FY120
1
2
3
4
5
6
USMC
Fixed Wing Class A Mishap Rate per 100K Flt Hrs
19

Class A Mishap Rate- Rotary Wing –
FY02-FY12
Baseline FY 2002 4.18
FY 2012 1.56
Reduction from Baseline
-63%
Source: Naval Safety Center
Baseline FY 2002 3.38
FY 2012 2.67
Reduction from Baseline
-21%
20
FY02 FY03 FY04 FY05 FY06 FY07 FY08 FY09 FY10 FY11 FY120
1
2
3
4
5
6
7
8
9
10
USMC
Rotary Wing Mishap Rate per 100K Flt Hrs
FY02 FY03 FY04 FY05 FY06 FY07 FY08 FY09 FY10 FY11 FY120
0.5
1
1.5
2
2.5
3
3.5
4
4.5
USN
Rotary Wing Mishap Rate per 100K Flt Hrs

Unmanned/Remotely Piloted Mishaps by Count
FY02-FY12
Source: Naval Safety Center 21
FY02 FY03 FY04 FY05 FY06 FY07 FY08 FY09 FY10 FY11 FY120
2
4
6
8
10
12
14
USMC
FY02 FY03 FY04 FY05 FY06 FY07 FY08 FY09 FY10 FY11 FY120
1
2
3
4
5
6
7
8USN

Afloat Class A Mishap Rates- Total -
FY03 FY04 FY05 FY06 FY07 FY08 FY09 FY10 FY11 FY120
0.5
1
1.5
2
2.5
3
3.5
4
Class A Afloat Mishap Rate per per 100 Ships per Year
Baseline FY 2003 2.11
FY 2012 1.62
Reduction from Baseline
-23%
Source: Naval Safety Center 22

Total Case Rates (TCR) and Lost Time Case Rates (LTCR)Navy and Marine Corps Civilians
FY 03-FY 12
Source: Department of Labor/OSHA, Federal Agency Injury and Illness Statistics by Year, 2003 -2012; https://www.osha.gov/dep/fap/statistics/ fedprgms_stats12_final.html
03 04 05 06 07 08 09 10 11 120
0.5
1
1.5
2
2.5
3
3.5
4
4.5
TCR
LTCR
Fiscal Year (FY)
Case
Rat
es p
er 1
00 E
mpl
oyee
s/Ye
ar
-43%
-44%
23
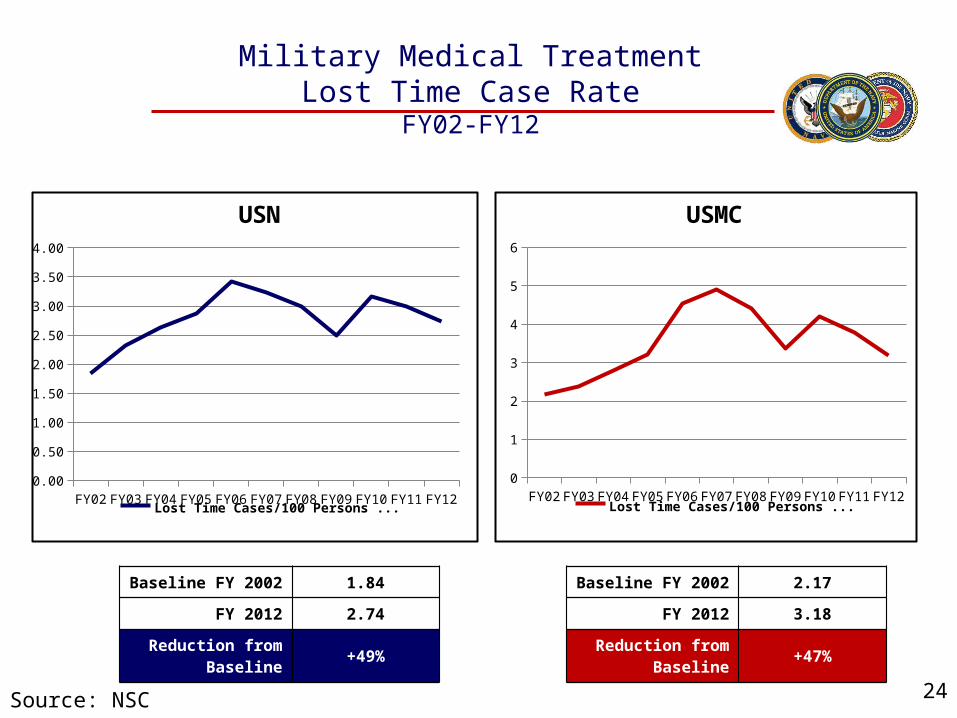
Military Medical TreatmentLost Time Case Rate
FY02-FY12
Baseline FY 2002 1.84
FY 2012 2.74
Reduction from Baseline
+49%
Source: NSC
Baseline FY 2002 2.17
FY 2012 3.18
Reduction from Baseline
+47%
24
FY02 FY03 FY04 FY05 FY06 FY07 FY08 FY09 FY10 FY11 FY120.00
0.50
1.00
1.50
2.00
2.50
3.00
3.50
4.00
Lost Time Cases/100 Persons per Year
USN
FY02 FY03 FY04 FY05 FY06 FY07 FY08 FY09 FY10 FY11 FY120
1
2
3
4
5
6
Lost Time Cases/100 Persons per Year
USMC
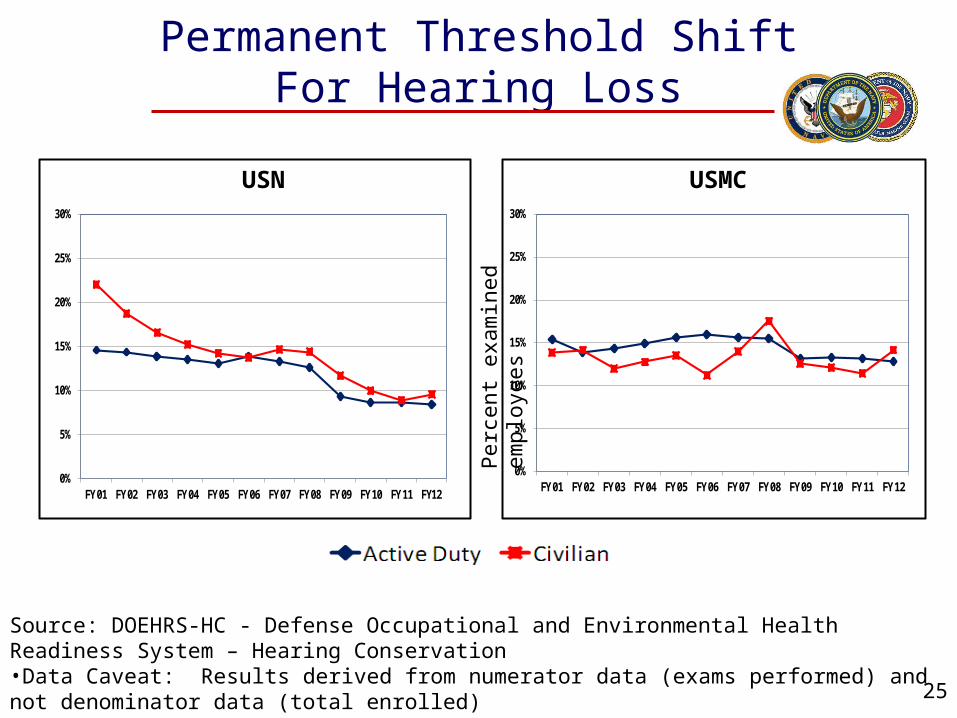
Source: DOEHRS-HC - Defense Occupational and Environmental Health Readiness System – Hearing Conservation•Data Caveat: Results derived from numerator data (exams performed) and not denominator data (total enrolled)
Permanent Threshold ShiftFor Hearing Loss
0%
5%
10%
15%
20%
25%
30%
FY 01 FY 02 FY 03 FY 04 FY 05 FY 06 FY 07 FY 08 FY 09 FY 10 FY 11 FY 120%
5%
10%
15%
20%
25%
30%
FY 01 FY 02 FY 03 FY 04 FY 05 FY 06 FY 07 FY 08 FY 09 FY 10 FY 11 FY12
25
USMCUSN
Perc
ent e
xam
ined
em
ploy
ees

0%
5%
10%
15%
20%
25%
30%
FY 01 FY 02 FY 03 FY 04 FY 05 FY 06 FY 07 FY 08 FY 09 FY 10 FY 11 FY 12
Source: DOEHRS-HC - Defense Occupational and Environmental Health Readiness System – Hearing Conservation •Data Caveat: Results derived from numerator data (exams performed) and not denominator data (total enrolled)
Significant Threshold Shift
0%
5%
10%
15%
20%
25%
30%
FY 01 FY 02 FY 03 FY 04 FY 05 FY 06 FY 07 FY 08 FY 09 FY 10 FY 11 FY 12
26
USN USMC
Perc
ent e
xam
ined
em
ploy
ees

Background Slides
27
Doctrinal Requirements•Deferred repair of USS MIAMI (SSN 755) (fire damage), USS PORTER (DDG 78) (collision damage)•Deferred start of the scheduled Refueling Complex Overhaul (RCOH) for USS ABRAHAM LINCOLN (CVN 72)•Delayed deployment: USS HARRY S TRUMAN (CVN 75), USS GETTYSBURG (CG 64)Personnel•Froze civilian hiring; Reduced temp/term employees; limited use of overtime and comp time•Marine Corps reduced planned CIVPERS expenditures•Reduced routine training not-related to readiness of deployed or next-to-deploy forces•Cancelled non-essential travel, temporary duty, conferences, and training courses.Infrastructure•Deferred facilities maintenance projects that are not immediately mission-critical or life, health, or safety sustaining; Deferred all facilities demolition projects•Reduced base operating support (BOS)•Reduced administrative overhead expenses, IT expenditures and minor purchasing•Reduced military community services, recreation, and installation services•Deferred afloat storeroom replenishments and noncritical organizational-level (O-level) maintenance on non-deployed units•Notified contractors of the potential to cancel and/or de-scope private sector 3rd and 4th quarter surface ship maintenance availabilities
Department of Navy Actions (taken prior to 01 March)

Department of Navy Actions (taken as of 01 March)
Doctrinal Requirements•Prepare to shut down Carrier Air Wing Two (CVW-2) in April. This will initiate the preparations to gradually stand-down flying in five carrier air wings with two additional air wings being reduced to minimum safe flying levels by the end of the year•Defer USNS COMFORT humanitarian deployment to Central and South America, “Continuing Promise 2013”, including supporting ships, Seabees, and medical units•Prepare to cancel deployments of USS GRASP (1 Apr), Underwater Construction TM1 (1 Apr), USS KAUFFMAN (5 Apr), and Intel Exploitation TM6 (15 Apr).•Defer USS CHUNG HOON (DDG 93) deployment to the western Pacific•Prepare to lay up four Combat Logistics Force (CLF) units in PACOM starting 1 April•Prepare to return USS SHOUP (DDG 86) and not proceed as USS NIMITZ (CVN 68) escort to CENTCOM based upon SECDEF decisions on GFMAP requirements•Prepare to cancel USS THACH (FFG 43) deployment to SOUTHCOM based upon SECDEF decisions on GFMAP requirements•Reduce hours of operation at ports and airfields•Begin negotiating contract modifications to de-obligate efforts for any investment programs for which the remaining unobligated balance will be insufficient after the sequestration reduction is applied. Major programs affected:
VIRGINIA-class SSN Advance ProcurementReactor Power UnitsJoint High Speed Vessel (JHSV 10)

Department of Navy Actions (taken as of 01 March) – cont’d
Doctrinal Requirements•Reduce scope of Naval Safety Center investigations
Personnel•Cancel March Introductory Flight Screening for future Pilots/NFOsUSMC will commence final planning activities to cancel Marine Corps Maintenance Depot contracts and notify 845 depot maintenance employees of pending layoffs•Cease new USMC enrollments in voluntary education Tuition Assistance (TA)•Cancel March Navy recruiting media support and reduce advertising contracts•Reduce fitness and other Morale Welfare and Recreation operating hours•Announce intention to cancel Blue Angels shows scheduled for April 2013 [Four shows: Tampa FL (MacDill AFB), Corpus Christi TX, Vidalia GA, Beaufort SC] •Reduce legal assistance for service members at Navy Legal Service Centers•Limit Navy Band support to only the National Capital Region for March and April
Infrastructure•De-scope USS DENVER (LPD 9) maintenance availability•Defer Landing Craft-Air Cushion (LCAC 7) maintenance availability•Defer unexecuted NAVSUP logistics contracts; implement service-wide transportation (SWT) reductions


![Occupational Exposure to Hexavalent Chromium [Cr(VI)] Doug Fletcher, CIH, CSP OSHA - OAO](https://img.dokumen.tips/doc/110x75/56649e4a5503460f94b3dff6/occupational-exposure-to-hexavalent-chromium-crvi-doug-fletcher-cih-csp.jpg)