Embed Size (px)
Citation preview
THE METABOLISM AND PLASMA CONCE~~RATIONS OF
L-ALPHA-ACETYLMETHADOL AND ITS METABOLITES IN MAN
by
Bryan Smith Finkle
A dissertation submitted to the faculty of the University of Utah in partial fulfillment of the requirements
for the degree of
Doctor of Philosophy
Department of Pharmacology
University of Utah
June 1977

THE UNIVERSITY OF UTAH GRADUATE SCHOOL
SUPERVISORY COMMITTEE APPROVAL
of a dissertation submitted by
BRYAN SMITH FINKLE
I have read this dissertation and have doctoral degree.
�-/q- 27 Dale
I have read this dissertation and have found it to be of satisfactory quality for a doct{;;i �gE� Z2
.�� (/ .� Date Salvatore :v. Fidone, Ph.D.
Member, Supervisory Committee
I have read this dissertation and have found it to be of satisfactory quality for a
doctoral degree.
<{- 77 Dale
Michael R. Franklin, Ph.D. Member, Supervisory Committee
I have read this dissertation and have found it to be of satisfactory quality for a
do�toral deere!;:.
�- 9� 77 C M.D., Ph.D.
Member. Supervisory Committee
I have read this dissertation and have found it to be of satisfactory quality for a doctor�e?": �
� ...J tZ�/ � ',r S, -i,..t... ... " ....
Date J Louis S. Goodman, M .• D., Ph.D. Member. Supervisory Committee
have read this dissertation and hay 1 for a dOC;7;%
a Dale /
I have read this dissertation and
dOCIoraizre% 5'��='7
Date '
have found it to be of satisfactory quality for a
Oi on M. Woodbury, P � . Member. Supervis0ry Committee

THE UNIVERSITY OF UTAH GRADUATE SCHOOL
FINAL READING APPROVAL
To the Graduate Council of The University of Utah:
I have read the dissertation of Brya n Smi th Fi n k 1 e
m lts
final form and have found that (l) its format, citations, and bibliographic style are
consistent and acceptable; (2) its illustrative materials including figures, tables, and
charts are in place; and (3) the final manuscript is satisfactory to the Supervisory
Committee and is ready for submission to the Graduate School.
May 18, 1977
Date
Approved for the Major Department
Chairman! Dean
Approved for the Graduate Council

ABSTRACT
The plasma disposition of L-a-acetylmethadol
(LAAM) and its two active metabolites, nor-LruLM and
dinor-LAAM, has been determined in 12 human subjects
as part of a controlled, clinical pharmacological
study. h~ was administered orally three times per
week for ten doses, ranging from 0.73 mg/kg to 1.51
mg/kg (80 mg doses), with five subjects receiving 1.0
mg/kg. Plasma concentrations were followed at short
intervals after the first three and last doses and for
a total of approximately 1000 hr, where possible. A
new quantitative, specific, and very sensitive analy
tical method was developed for the study and is re
ported in detail. The method involves organic solvent
extraction, amide-derivative formation of the metabo
lites, and gas chromatography-chemical ionization
multiple ion monitoring-quadrupole mass spectrometry,
with methane as carrier and ammonia as reagent gases.
Deuterated stable isotopes of LAAM and the two metabo
lites are used as internal standards. The method has
quantitative sensitivity to 5 ng/ml for a 2.0 ml plasma
sample with 10-15% accuracy and precision. For the
range used in the study, the dose of LAAM is not a

critical variable with respect to ultimate plasma con
centrations achieved and cannot be used to predict max
imum concentrations or the possibility of drug or
metabolite accumulation. The mean time taken to reach
maximum plasma concentration after the first dose of
LAAM was 4.4 hri for nor-LAAM, 5.6 hri and for dinor
LAAM, 6.6 hr. There was no change in these values
after the tenth and final dose. Maximum concentrations
after the first dose varied from 52 to 510 ng/ml for
LAAMi 65-175 ng/ml for nor-LAAMi and 11-92 ng/ml for
dinor-LAAM. Three subjects cont~nuously accumulated
L~1 and both metabolites; these three plus two others
accumulated LAAM, and the five plus one other accumu
lated dinor-LAAM. The otherffix subjects reached plateau
concentrations after the anticipated 4-5 half-lives of
elimination. The mean half-lives in hours were LAAM
t~~ 2.4, t~S 37.5 (first dose), t~B 46.8 (last dose)i
nor-LAAM, t~B 38.2 (first dose), t~B 64.6 (last dose);
dinor-LAAM, t~B 168 (last dose). The maximum plasma
concentrations increased over the ten-dose period by
a factor of approximately 2.0 for LAAM, 2.0-4.0 for nor
LAAM, and 4.0-10.0 for dinor-LAAM. The t~B for LAAM was
independent of dose throughout the study, and the plasma
concentration-time-course profiles are generally con
sistent with a two-compartment, first-order kinetic
model.
vi

ACKNOWLEDGEMENTS
I wish to take this means of expressing my deep
appreciation to certain members of the College of Medi
cine, Pharmacology Department, faculty and staff without
whose interest, advice, and constant support my educa
tion and this research could not have been completed.
They are Drs. Louis S. Goodman, Ewart A. Swinyard, James
w. Freston, and James W. Gibb.
In addition, the skillful and dedicated techni
cal assistance of Messrs. Thomas A. Jennison and Dennis
M. Chinn at the Center for Human Toxicology was an inte
gral and indispensable part of the analytical work.
Clinical management of the human subjects was carried
out by Drs. Walter Ling, Elaine D. Holmes, and Stuart
SeIter at the Veteran's Administration Hospital,
Sepulveda, California. Their cooperation in executing
protocols involving drug administration and specimen
withdrawal in very exacting circumstances is acknowl
ledged.
Finally, the research was financially supported
throughout by the National Institute on Drug Abuse
under contract numbers DA-01391 and 271-76-3323.
TABLE OF CONTENTS
ABSTRACT. . . . . . .
ACKNOWLEDGEMENTS.
INTRODUCTION. .
METHODS . . •
Analytical Methods.
Analytical Method Critique.
Extraction Procedure ••.
Gas Chromatography-Mass Spectrometry ..
GC-MS Data, Calculation, and Manipulation •
Analysis of Biological Test Samples •
Clinical Study. • . . •
RESULTS . . • • •
DISCUSSION.
REFERENCES ..
FIGURES .
APPENDIX:
VITA. . •
Tables .
Page
v
vii
1
12
12
18
18
22
27
30
31
36
45
53
60
224
266

INTRODUCTION
In 1965 Dole and Nyswander reported on the use
of methadone as a medical treatment for heroin addic
tion, and the following year Dole et ale (1966) des
cribed the rationale for methadone maintenance programs ..
They stated that, by inducing tolerance to methadone in
the heroin addict and subsequently maintaining the tol
erant condition by daily oral doses of methadone, the
pharmacological action of heroin was blocked and the
addict's compulsion to use opiate narcotic drugs was
eliminated. Thus, methadone maintenance was found to
be an effective means of treating heroin dependence
in individuals who were apparently unresponsive to other
forms of rehabilitation.
Since 1969 there has been a flood of papers
published on almost every conceivable aspect of metha
done maintenance programs. Those by Jaffe (1972),
Goldstein (1972), Kreek (1973), ~1artin et ale (1973),
Lipsitz and Blatman (1974), and Harms (1975) are repre
sentative. Methadone has not proved to be a panacea
for all cases of narcotic drug dependence. Al though
some of the problems related to its clinical use can be
attributed to poor administration at some clinical

2
facilities, other problems are indirectly related to
the pharmacology of methadone. The drug has a duration
of action of approximately 24 hr and, therefore,
patients must visit the clinic every day to receive the
drug or they must be allowed to self-administer the
medication away from the clinic. Daily visits are a
major inconvenience to the patient and inhibit cooper
ation; hence, providing the patient with take-home
weekend dosages has become a common practice. There
are serious problems associated with permitting metha
done to be taken out of the clinic (Jaffe et al., 1970),
including the opportunity for nontolerant individuals,
especially children, to be accidentally poisoned and
the possible illegal diversion of the drug for sale or
illicit use. Both of these possibilities have been all
too frequently realized. Occurrence of these and other
problems would be curtailed if alternative modes of
successful therapy were available, or if patients could
be adequately maintained on a narcotic agonist with a
longer duration of action. Currently, the latter al
ternative appears to be the best hope for the thousands
of heroin users seeking treatment for their addiction.
The acetylmethadols were synthesized as deriva
tives of the parent compound, methadone, in an attempt
to find a drug with negligible addiction liability
(see review of Way and Adler, 1960). Figure 1 shows the
synthesis of l-a-acetylrnethadol (LAAM) from methadone.

The synthesis of this drug and preliminary preclinical
investigations of its pharmacology were first carried
out by Chen in 1948. LAAM has an analgesic effect
maintained up to 72 hr in animals (Keats and Beecher,
1952) and man (Fraser and Isbell, 1952). Jaffe and
coworkers (1970) supposed that other pharmacological
effects of LAAM might also persist beyond that known
for methadone, especially those effects which prevent
narcotic abstinence syndrome in physically dependent
individuals. If this proved to be correct, then LAAM
might be useful in lOllg-term maintenance treatment of
heroin addicts. Early work (Fraser and Isbell, 1952)
suggested this reasoning was valid, and more recently
it was concluded from a study in which LAAM and metha
done were compared in the treatment of heroin users
(Jaffe et al., 1970) that LAAM may possess the sought
after practical therapeutic advantages over methadone.
Later, it was reported (Jaffe and Senay, 1971) that
3
LAAM provided effective weekend treatment for narcotic
addicts, and it has been suggested that the frequency of
visits to the clinic by addicts could be reduced to
three times each week (Levine et al., 1973). Further
more, because LAAM is apparently less active than some
of its metabolites (Smith, 1974; Nickander et al., 1974),
the onset of action is delayed until the metabolites
are bioavailable. One result of this is that LAAM is

not likely to reinforce drug taking, because drug
users generally desire drugs with a rapid onset of
action. In addicts, LAAM is more rapidly effective
orally than intravenously, the preferred route of
heroin addicts (Blackly, 1971; Fraser, 1952).
In June, 1971, the Special Action Office for
Drug Abuse Prevention (SAODAP) was established by
Executive Order of the President, and, because of the
potential advantages of LAAM over methadone, it man
dated the expansion of research on long-lasting, non
addictive blocking and antagonist drugs or other
pharmacological substances for the treatment of heroin
addiction. Dr. Jerome Jaffe, Director of SAODAP, in
itiated in 1971 a comprehensive review of the status
of LAAM. The conclusion was drawn from the review
that LAAM was the most promising compound available at
the time but that its pharmacological development was
not proceeding. SAODAP created a governmental mech
anism for developing LAAM, and in the Spring of 1972,
an Interagency Pharmacology Task Force was formed to
review, plan, and coordinate development work toward
a New Drug Application (NDA) to the Food and Drug Ad
ministration (FDA).
When SAODAP was phased out of existence in the
Fall of 1974, the coordination and direction of the
L~1 Project, including the Pharmacology Task Force,
4

5
were transferred to the Division of Research, National
Institute on Drug Abuse. Today almost all the Phase I
new drug research is complete, much of Phase II is
complete or in progress, and LAAM is now on the verge
of undergoing large-scale Phase III clinical trials
with FDA approval. Despite this rapid and broad prog
ress, the pharmacology and toxicology of LAAM are still
not thoroughly studied or well documented. This is
particularly true for the pharmacodynamics and metabo
lism of the drug in man. There are several reasons
for these deficiencies, but perhaps most important was
the lack of an analytical method by which LAAM and its
principal metabolites could be accurately and simul
taneously quantitated in small-volume plasma and urine
samples, and specifically identified. It was, there
fore, the first and foremost objective of the research
described in this report to develop such a method. If
successful, the method would be applied in a controlled
clinical study to determine the plasma time-course dy
namics of LAAM and its metabolites in human subjects.
The first metabolic study on LAAM was carried
out by Sung and Way in 1954 using rats and mice. The
drug was determined in tissues by a modified methyl
orange-complex technique, but unfortunately, the sen
sitivity of the procedure was very poor and the re
sulting quantitative data unreliable. However, it was

noted that uptake was rapid and that high tissue
levels resulted after parenteral administration. The
morphine-like effects did not become apparent until
4 to 6 hr after injection but persisted for at least
24 hr. Following oral administration, the tissue
6
levels were very low, and the onset of action was about
1 hr later. The authors concluded that LAAM was con-
verted to an active metabolite, a process which oc-
curred more rapidly after oral than after parenteral
administration. The effect of prior administration of
the microsomal enzyme inhibitor, SKF 525-A, was also
studied (Veatch et al., 1964) on the assumption that if
LAAM was converted to an active metabolite by liver
microsomal biotransformation, then the SKF 525-A would
inhibit the pharmacological effects, such as analgesia,
of the drug. The study revealed that SKF 525-A did de
crease the analgesic response to LAfu~. In 1965 McMahon
et ale showed, by means of c14-radiolabelled drug in
rats, that nor-acetylmethadol (nor-LAAM) is a major
metabolite of LAAM. The second methyl group was also
removed to give the dinor compound (dinor-LAAM). It
appeared that the first demethylation occurred at ap
proximately three times the rate of the second, so that
the primary metabolite, nor-LAAM, tended to accumulate
in the body. Subsequently, this work was confirmed
(Billings et al., 1973) in the rat: there are two active

metabolites of LAAM which are formed by successive
enzymatic N-demethylations, nor-LAAM and dinor-LAAM.
Billings et al. used a gas chromatographic method for
the analysis of nor-LAAM which involved forming the
trichloroacetamide derivative and electron capture de
tection. The metabolite identities were established
7
by mass spectrometry. Although it is very sensitive,
this method is, unfortunately, complex and time
consuming and does not lend itself to routine use.
Figure 2 shows the biotransformation of LAAM, includ
ing a deacetylation pathway to methadols which have
been detected in animal urine. In 1976, Kochhar con
firmed the identity of the methadols as metabolites of
LAAM after in vitro incubation of the drug with a
microsomal fraction obtained from rat liver homogenates
and, also, from the urine of rats which were given the
drug intraperitoneally.
In a further study, Billings et al. (1974) ad
ministered 100 mg of LAAM three times a week to three
human subjects and measured the nor and dinor metabo
lites in blood and urine, using their derivative gas
chromatography procedure. Analyses were made after the
first dose and after repeated doses of the drug. The
results showed that the total blood levels of the two
metabolites were variable between subjects, ranging from
250 to 370 ng/ml of plasma after the first dose, and 300

to 700 ng/ml after the twentieth dose. Kaiko and
Inturrisi also described two slightly different gas
chromatographic assays for LAAM and its metabolites
in 1973 and 1975. In one method, a benzomorphan de
rivative was used as an internal standard and, in the
other, SKF 525-A was used. Flame ionization was the
method of detection in both procedures, but no account
was made of percent recovery from plasma for LAAM or
the metabolites at the solvent extraction stage in
either method. In consequence, sensitivity limits
8
were barely at the submicrogram level, and the accuracy
of the quantitative analyses is suspect. The methods
were used to determine plasma levels in eight out
patients receiving 40-60 mg of LAAM three times a week
and to correlate the results with observed changes in
pupil diameter. Peak plasma levels of acetylmethadol
occurred at 4 hr post-administration and almost com
pletely disappeared at 24 hr. Nor-LAAM plasma concen
trations peaked in 48 hr and declined slowly over the
following 40 hr. Dinor-LAAM apparently remained con
stant throughout the treatment dosing interval. The
reported half-lives for LAAM, nor-LAAM, and dinor-LAAM
were extremely variable at 2-12 hr, 13-78 hr, and in
finitely long, respectively.
In a 1975 report, Henderson and Lau monitored
plasma concentrations of LAAM and metabolites in

9
patients receiving 60-85 mg of LAAM three times each
week and found that plasma levels of the parent drug
were only slightly higher after 90 days than in the
initial period, whereas the two metabolites were 5-10
times greater. These investigators used a gas chro
matographic method involving halogenation of the drugs
by trichloro-acetic anhydride and electron capture
detection. The method is sensitive in the low nanogram
range but suffers from complex chemistry and interfer
ences on the gas chromatogram caused by derivatized
biochemical artifacts which disturb the usable sensi
tivity and quantitative accuracy of the procedure.
Goldstein, in an unpublished 1975 report, also
found by gas chromatography analysis very low plasma
concentrations of LAAM at 72 hr post-administration in
patients maintained on the drug, but dramatically in
creased levels of nor-LAAM and dinor-LAAM were present
at 24-48 hr, with no decrease in concentrations through
72 hr.
Although several animal studies, including pri
mates, have been carried out to evaluate the biodispo
sition and metabolism of LAAM (Sung and Yay, 1954;
McMahon et al., 1965; Billings et al., 1973; Sullivan
et al., 1973; Welling, 1974; Lau and Henderson, 1975;
North-Root and Henderson, 1975; Musta et al., 1976;
Henderson, 1976), the only human studies reported are
10
those of Billings, Kaiko and Inturrisi, Henderson and
Lau, and Goldstein, discussed previously. In each
case, the data were incidental to monitoring heroin
addict patients undergoing treatment with methadone and
LAAM and were obtained by analytical methods with seri
ous limitations in either sensitivity or quantitative
accuracy. The only other published analytical methods
require tritium or carbon-14 labels for LAAM followed
by thin-layer chromatography and scintillation counting
(Misra et al., 1975), enzyme immunoassay (McIntyre et
al., 1975), or thin-layer chromatography alone (Kuttab
et al., 1976). All these techniques are qualitatively
nonspecific and best suited to urine screening analysis
for the drug.
Nonetheless, it is evident from the animal
studies and limited human data that the active metabo
lites of LAAM play an important role in the general
action of the drug. An appreciation of their signifi
cance is critical to understanding the slow onset and
long duration of action, and the apparent cumulative
effects which have been observed. Large variations in
the rates of formation and elimination of LAAM and its
metabolites were noted in all the studies, as well as
considerable variation between individuals in plasma
concentrations of LAAM, nor-LAAM, and dinor-LAAM. If
confirmed, these individual variations, with respect

11
to the metabolism of LAAM, could possibly explain some
of the clinical response differences seen in patients
undergoing therapy with the drug, including adverse
side effects such as anxiety, confusion, and aggression
(Billings et al., 1974; Fraser and Isbell, 1952). The
questions of safety in chronic treatment and cumulative
toxicity still remain to be scientifically investigated.
It is against this background that the need for
a controlled human study to determine accurately the
plasma disposition of LAAM and its metabolites became
clear, with the essential prerequisite of a new analy
tical method which would be qualitatively specific for
the drug and metabolites, sensitive to concentrations
below 10.0 ng/ml, and have accuracy and precision of
about 10-15% at this concentration. The subject of
this research report is the development of such a
method and its application to determine plasma concen
trations of LAAM, nor-LAAM, and dinor-LAAM in humans
following oral administration of the drug in acute and
chronic therapeutic doses.

METHODS
Analytical Methods
The first objective of the research was to
develop a new analytical method suitable for routine
detection and simultaneous quantitation of LAAM and
its two principal metabolites, nor-LAAM and dinor-
LAAM, in small-volume blood and urine samples. The
complete procedure is new in all its essentials, in
cluding sample preparation and extraction, derivati
zation, and gas chromatography-chemical ionization-
mass sepctrometry-selected ion monitoring, with methane
as the carrier gas and ammonia as the reagent gas. The
d 3 , deuterated stable isotopes of LAAM and its metabo
lites are used as internal standards. Computer programs
have been written for a desk-top instrument capable of
automatic calculation of plasma sample concentrations
from the raw analytical data, mathematical manipula
tion, and graphic plotting of time-course concentration
curves. The procedure permits analysis of batches of
40 samples plus ten standards per week. Sensitivity to
less than 5 ng/ml and precision of 15% at 10 ng/ml is
easily maintained.
A schematic flow diagram of the solvent ex
traction procedure and amide derivative formation
are shown in Figure 3. The following materials are
required:
Apparatus
1. 50 ml g.g. stoppered extraction tubes
2. 50 ml centrifuge tubes
3. Pasteur pipets
4. 2 ml Class A serological pipets
5. 0.5 ml Class A serological pipets
6. Mechanical shaker
7. Centrifuge
8. "Repipets" for solvent dispensing
9. vortex mixer
10. Water-bath with thermostat control
Reagents
1. De1ory-King (1945) carbonate-bicarbonate buffer
(pH 9.78)
13
0.1 M sodium carbonate and 0.1 M sodium bicar
bonate in a volume ratio 4:6. 0.1 ml of buffer
added to 2.0 ml of plasma gives a pH 9.2
2. n-Butyl chloride. J.T. Baker Chemical Company
3. Chloroform. Ma1linckrodt nanograde
4. Methanol, anhydrous. Mallinckrodt AR
5. 0.2 N Hydrochloric acid
6. 5.0 N Sodium hydroxide

14
7. Drifilm sc-a7. 5% in toluene for siliconizing
evaporation tubes. Pierce Chemical Company.
Standards
Stock solutions in water: 10 ~g/ml of LAAM-HCl,
nor-LAAM-HCl, and dinor-LAAM-maleate. Equivalent to
9.06, 9.00, and 7.40 wg/ml of free base, respectively.
Working standards are prepared by dilution of the
stock solution with blank plasma, as required.
Internal Standards
D3 - LAAM
D3 - nor-LAAM
D3 - dinor-LAAM
(l-a-acetyl methadol, -2,2,3,2H3-HCl)
2 (l-a-acetyl- H3-normethadol·HCl)
(1-a-acetYl-2H3- N,N-dinormethadol.HCl)
Stock solutions of the stable isotope internal
standards are prepared in methanol to 1.0 mg/ml, and a
2.0 ml aliquot is diluted to 1.0 1 with water for a
stock solution. The stock solution is diluted 1:10 in
blank plasma for a mixed working internal standard solu-
tion of 200 ng/ml. The pure LAAM and its metabolites
and the deuterated stable isotopes used in this study
were obtained from Research Triangle Institute (Chemistry
and Life Sciences Division), Research Triangle Park,
North Carolina, U.S.A. through the courtesy of the
National Institute of Drug Abuse, Rockville, Maryland,
U.S.A.

15
Procedure
One ml of mixed internal standard solution and
1.0 ml of buffer are added to 2.0 ml plasma in a 50 ml
g.g. stoppered centrifuge tube. (= 200 ng into std/ml
of plasma.) Ten mls of n-butyl chloride is added and
the mixture is shaken mechanically for 10 min and then
centrifuged at 1500 rpm for 5 min to separate the
phases.
The organic phase is transferred to a second 50 ml
g.g. stoppered tube and extracted with 10.0 ml 0.2 N
hydrochloric acid. The mixture is centrifuged to sep
arate the phases and the organic solvent then dis
carded by aspiration.
One-half ml of 5.0 N sodium hydroxide is added to
the acid phase to bring the pH to 13 and the mixture is
then incubated at room temperature for 30 min and then
in a 70°C water-bath for 10 min. This step converts the
metabolites and metabolite-internal standards to their
amide derivatives.
Following incubation, the mixture is cooled and
extracted with 10 ml chloroform by vortex mixing. The
phases are again separated and the chloroform is trans
ferred to a 50 ml silanized centrifuge tube and evapo
rated to dryness under an airstream of not less than
200cc/min. The residue is reconstituted in approximately
25 ~l of methanol for GC-CI-MS analysis.

16
Quantitative Analysis by GC-CI-MS--Multiple Ion Monitoring
Instrument: FINNIGAN MODEL 3200 F GC-
MS, fitted with a chemical
ionization source and a six-
channel programmable multi-
pIe ion monitor with a six
pen Rikadenki strip chart
recorder.
Strip chart recorder for
total ion monitoring and
light beam oscillograph for
recording complete mass
spectra.
Gas Chromatographic Conditions
Column: 1.5 m x 2 rom id: glass U-
tube packed with 3.0% OV-17 on
Gaschrom Q. AW. DMCS. 80-
100 mesh.
Carrier Gas: Methane. Flow: approxi-
mately 12 cc/min through the
column, adjusted to achieve
a pressure of 500 ~ in the
MS source.
Temperatures: Injection port and oven:

17
Relative Retention Times: LA~, 0.59; dinor-L~l, 1.00;
nor-LAAM, 1.3.
Elapsed GC Time Per
Analysis: Approximately 3 min.
CI-Mass Spectrometer Conditions
Reagent Gas:
Diverter Valve:
Source Temperature:
Ionizing Voltage:
Filament Emission
Current:
Electron Multiplier:
Multiple Ion Monitor
LAAM
nor-LAAM
dinor-LAAM
Sampling Time:
Recorder:
Ammonia (Union Carbide-Linde.
Speciality Gas Products
Group) 200 ~ source pressure.
open 18 sec post-GC sample
injection.
100 EV.
0.70 milli-amps.
1700 V.
354 amu, D3-LAAM 357 amu
340 amu, D -nor-LAAM 3 343 amu
326 aniu, D3-dinor-LAAM 320 amu
100 milli-sec each channel.
0.5Hz filter.
Chart speed, 1 em/min. Full-
scale deflection adjusted be-
tween 50-100 mv for required
sensitivity.

Typical Analytical Recording
See Figure 9.
GC-MS Data, Calculation and Manipulation
S.P. 4000 Microprocessor with two analog-to-
digital converters (Spectraphysics, Santa Clara,
California) interfaced to the GC-MS multiple-ion mon
itor and a Teletype-printer output.
18
This device is programmed to integrate, auto
matically and on-line, the monitored ion peak areas,
calculate the peak area ratios drug:internal stand
ard for each component, refer the ratio to a stored
standard concentration regression curve, and calculate
and print-out the final concentrations of LAAM, nor
LAAM, and dinor-LAAM.
The analytical concentration data for LAAM
and the metabolites are entered into a mini-computer via
a keyboard, TEK 4051 (16 K) with Interactive Printer
Plotter, TEK 4662 Tektronix. The data can then be
manipulated in a variety of ways for statistical anal
ysis, tabulation, and graphic display.
Analytical Method Critique
Extraction Procedure
Although there are some similarities to the ex
traction procedures published by Kaiko, Billings, and

19
Lau et al., there are significant differences which con
tribute to better recovery, accuracy, and ultimate sen
sitivity. In particular, these are the use of deuterated
LAAM, nor-LAAM, and dinor-LAAM as internal standards,
initial extraction of the sample at pH 9.2, and conver
sion of the metabolites to their amide derivatives by
incubation at alkaline pH greater than 13, for not less
than 30 min and at least 70°C. No hexane wash or other
clean-up steps are necessary. The final solvent evapo
ration is carried out in silanized glass tubes, which
also enhances the recovery. The recovery is in the range
of 65-70% for each of the drugs, but it only has meaning
relative to sensitivity limits of the method, because the
isotope standards internally compensate for this and all
other loss factors throughout the procedure. There are
a number of critical steps in this simple procedure to
which careful attention must be paid if best sensitivity
and accuracy are to be achieved. n-Butyl chloride and
pH 9.2 were chosen as the extraction conditions after
experiments clearly showed that extraction efficiency
was pH-dependent and that other solvents, notably chloro
form at any pH value above neutral, gave very dirty gas
chromatograms and, therefore, demanded that clean-up
steps be introduced--with a subsequent loss in recovery.
The pH dependency of n-butyl chloride has previously
been noted by Walen (1968) in regard to propoxyphene and

20
methadone extractions from plasma. It is simply not
possible to extract nor-LAAM and dinor-LAAM at any pH
above neutral without some spontaneous formation of the
amide derivative. In consequence, after the decision
was made to convert the metabolites to their amides for
quantitative analysis, pH 9.2 assisted the transforma
tion from the first step of the extraction procedure.
The use of n-butyl chloride does finally produce
very clean gas chromatograms, and the hexane wash pre
viously reported by Kaiko (1975) is not necessary. How
ever, following centrifugation to separate the plasma
and solvent phases, a thin, white interface invariably
occurs. It consists of lipid and must not be trans
ferred with the solvent to the second extraction tube.
Very careful removal of about 8.0 ml of the solvent with
a pasteur pipet is required. Following extraction into
0.2 N hydrochloric acid, the solvent can be removed by
aspiration with a very clean interface. The alkaline
incubation stage was tested to determine the optimal
conditions of pH, time, and temperature for complete
conversion of the metabolites to the corresponding
amides, over a wide concentration range (25 ng -2 ~g in
approximately 5 ml of solution). All experiments were
conducted at pH 13, because it was known that strong
alkaline conditions were required, and this pH value was
easy to achieve by adding sodium hydroxide. It was

21
further determined that temperature was an important
consideration and must be maintained at about 70°C.
Excessive heat will degrade LAAM. Time can also be
critical, and it is essential that at least 30 min be
allowed, otherwise at higher concentrations amide for
mation will not be complete. Table 1 shows the com
parative efficiency of various incubation conditions.
The final extraction is with chloroform, be
cause it is efficient and readily evaporated. The
evaporation tubes were siliconized by standing them for
10 min in 5% Drifilm in toluene, oven drying, and then
water washing, and again drying. Evaporation of the
chloroform extract, either in a 70°C water-bath with
approximately 200 cc/min air flow or at room temperature
(25°C) overnight, provides the best recovery. Supporting
experimental data are given in Table 2. The efficient
reconstitution and concentration of the extract residue
in approximately 25 ~l of methanol were greatly facili
tated by the siliconized tubes which prevented any ad
sorption on the glass walls and gave a smooth solvent
film evenly distributed over the tube walls.
If these points are carefully followed and con
sidered, then the extraction scheme shown in Figure 3
is simple and efficient and lends itself to routine,
multiple-batch analysis for LAAM and its metabolites.

Gas Chromatography-Mass Spectrometry
It was originally thought that GC-electron
impact MS-selected ion monitoring of LAAM and its
22
metabolites would be possible. This notion was quickly
abandoned because, as described in the flAnalytical
Methods fl discussion, the extraction chemistry inevi-
tably converted the LAAM metabolites to their amide
forms and, as even a cursory inspection of the complete
EI spectra shows, the M + 1 protonated molecules were
useless for quantitative purposes, representing less
than 1.0% of the base peak, Figures 4A and 4B. The
only potentially useful ions in the spectrum occurred
below 100 amu, at M/e 85 and 83 but, unfortunately, were
associated with background interference, and could not
be used without an on-line computer or interactive data
system to subtract background. In any event, the in-
tensities of these ions were only approximately 20%.
Electron-impact spectra studies were, therefore,
stopped in favor of chemical ionization, selected ion
monitoring, with an emphasis on utilizing the parent
(M + 1) ions and methane as conventional GC carrier and
reagent gas. Although the CI-mass spectra of LAAM and
the amide-metabolites were clean, the M + 1 ions were
less than 2% of the base peak and gave M + 2 and M - 1
peaks of sufficient intensity to cause concern for

23
intolerable interference when D3-stable isotopes were
used as internal standards. Furthermore, other peaks
in the spectra were generally less than 10% of the base
peak (see Figures SA, B, and C). In consequence, both
isobutane and ammonia were tested as reagent gases. A
summary of the results is shown in Table 3. From a
practical standpoint, isobutane proved to be just as
inadequate as methane and, additionally, was a poor GC
carrier gas--producing distorted peaks and inferior
resolution. Although the M + 1 ions of the amide
metabolites increased to 18%, the protonated molecule
of LAAM remained at about 1%. This was important be
cause, as expected, many of the plasma samples in the
clinical study contained concentrations of the parent
drug in the low nanogram range, particularly late
samples after a single dose.
For the ammonia studies, the gas was intro
duced directly into the MS source and methane was again
used as the GC-carrier gas. Under these conditions, the
mass spectra showed intense M + 1 ions with virtually no
M - 1 or M + 2 contributions. The protonated molecule
for LAAM was also the base peak, and both amide
metabolites gave M + 1 ions of 30% intensity, Figures
6A, B, and C. Various source pressures of ammonia were
tried, but no significant differences were observed be
tween 150 and 250~. Two-hundred microns pressure was

24
selected for routine operation, because it was within
the reliable, useful range of the instrument control
valve. Figure 7 compares the molecular-ion monitoring
of LAAM and metabolites with methane alone or methane
ammonia. The figure indicates a sensitivity increase
with the use of the gas mixture; 3-SX for LAAM, 7-7X for
nor-LAAM, and 26X for dinor-LAAM over methane alone_
There are two important instrument operating
conditions which were carefully evaluated for their
quantitative effects on the analysis. These were
the timing and use of the GC effluent diverter valve
following sample injection, and the source temperature
differential which occurs when the filament is off or
on. The filament on-off time following sample injection
into the GC was, therefore, important. It was found
that unless the source temperature was maintained in a
steady state (120°C with the filament on), the frag
mentation patterns varied uncontrollably and seriously
affected quantitation. A compensating heater was de
signed, built, and installed so that, when the filament
was off, the heater maintained the source temperature
at 120°C. This solved the problem. A similarly simple
solution to control the GC effluent during operation of
the diverter valve was achieved by constructing an auto
matic, timed control for the valve which is located be
tween the GC column exit and the MS source_ The valve

25
is open for exactly 18 sec during each analysis immed
iately following the sample injection, so that all
components of the extract eluted from the GC column
prior to LP~, the metabolites, and internal standards
are diverted to a roughing vacuum pump and do not enter
the MS source. This device, plus stabilizing the MS
source temperature and the very short GC analysis
time, does much to maintain a clean source and low
background in the MID chromatogram. Although as little
as 50-100 pg of pure LAAM and metabolites can be easi
ly detected following injection into the gas chromato
graph, extraction, derivatization and reconstitution
from 2.0 ml plasma had previously indicated that the
method could maintain good precision to 15-20 ng/ml for
parent LAAM and 10-15 ng/ml fo.r the amide metabolites.
By modifying the analytical extraction procedure and
conditions for amide derivative formation, as described
earlier, sensitivity limits were greatly improved for
~I. GC-MS modifications in the ion-monitoring
parameters, sacrificing some resolution for sensitivity,
gave a further significant increase. Initially, reso
lution on each ion-monitoring channel was set at 0.2 amu
with a 10% valley between adjacent peaks. By setting
the resolution at 1.0 amu and accepting a reduced valley
between peaks, the MID sensitivity could be increased up
to 10-fold. Figure 8 is a representation of this

26
improvement for 1.0 ng of LAAM drawn from two super
imposed recordings and indicates approximately a five
fold increase in sensitivity.
The only aspect of gas chromatography conditions
rigorously tested was column packings. Dexsil 300, OV-
17, OV-l, and SE-30 liquid phases were evaluated, all
in 1-3% concentrations. Particular examination was
made of the GC-CI-MS background, temperature stability,
and acceptable resolution of LAAM and its amide
metabolites in a retention time period limited to 5 min.
Three percent OV-17 was superior to all the other phases,
including its temperature stability, which permitted iso
thermal analysis at 275°C, in the operational range for
LAAM and the metabolites. Relative retention times are:
LAAM, 0.59; dinor-LAAM, 1.00: nor-LAAM, 1.30; and the
total elapsed time between serial injections is approx
imately 2.5-3.0 min.
As a result of observing an apparent increase in
sensitivity, judged from peak heights on the MID re
cording as serial analyses were made of plasma samples,
various techniques of GC column preconditioning were
tried. Lipids and fatty acids contained in the extracts
seemed to be critical to the phenomenon, but when a
series of fatty acids and esters were tried, only tris
tearin improved the sensitivity to the observed levels.
Peak heights for all six components of the analysis
27
increased by greater than 50%. The column required an
injection of at least 70 ~g of tristearin. By reinject-
ing previously analyzed plasma extracts before beginning
a batch of new samples, a useful, lasting improvement
was achieved. This technique is routine practice as
part of the analytical procedure. Figure 9 shows a
multiple ion-recorded chromatogram for LAAM, the two
metabolite-amide derivatives, and their corresponding
isotope internal standards following a typical analysis.
GC-MS Data, Calculation, and Manipulation
Manual manipulation of the raw data measured
and calculated from the multiple-ion monitor recording
of six peaks, is a complex, extremely time-consuming
task. There are six data points on each chromatogram,
six recorder attentuations to be rationalized, six base-
lines to subtract background, and six peak heights to be
measured. These data must then be fed into mathematical
formulae to calculate drug concentrations in the original
sample. With several hundred analyses required in the
clinical pharmacology study, it was prudent to design
a device and build a system that could automatically
perform this task.
Only two analog-to-digital converters were needed
to handle the six GC-MS ion peaks, three each, because
the time resolution between the peaks was sufficient to

28
allow serial processing. Circuitry was built which
would calculate peak areas by total signal summation and
not by the more conventional time-sampling technique.
This provides an actual peak area value. Programs
supplied with the SP 4000 microprocessor allow for stor
age of instrument calibration data, standard regression
curves, and appropriate calculations. In consequence,
the simultaneous analysis of LAAM and its metabolites
in a plasma sample can be carried through rapidly and
automatically from extract aliquot injection into the
gas chromatograph to print-out of the concentrations
on a teletype, and it is completely free of possible
operator error at the data reduction stages.
Similarly, the necessity for storing the very
large quantity of data and subsequently presenting it
in tabulated and various graphic forms argued for com
puter capability. The Tektronix 4051 desk-top model with
interactive printer-plotter was ideal for the purpose.
The data and programs are stored on magnetic tapes;
programs can be written in basic, alpha-numeric language,
and there is 16 K capacity of which only 2 K is required
by the instrument for executive functions. Necessary
programs were written so that all of the data tables,
linear and semi-log concentrations, time-course graphs,
and calculated results presented in this report were
produced through the Tektronix instrumentation.

29
By experimentally testing and optimizing each of
the parameters in the complete method, chemical and
instrumental, it is possible to maintain acceptable pre
cision and quantitative sensitivity below 5 ng/ml for
LAAM and both metabolites in a 2.0 ml plasma sample.
Standard curves, constructed following repetitive anal
ysis of 2.0 ml fortified plasma samples, are shown in
Figures IDA, B, and C. The vertical axes are shown
equally divided but without fixed-ratio values. The
individual values can be quite different for any given
run of standard plasmas, because the ion-monitoring re
corder voltage values for each channel are adjusted for
each sample and for each of the six constituents of each
sample, in order to record on-scale peaks of measurable
size as the run proceeds. The peak heights are not nor
malized to a fixed voltage in the calculation of the
ratios.
Precision at 200 ng/ml is 2.0%; at 25 ng/ml,
7%; at 10 ng/ml, 15%, at 5 ng/ml, 20%.
Sensitivity to 3 ng/ml with a 2.0 ml plasma
sample is practical and routine. Below this concentra
tion, background from the plasma becomes a contributing
factor to the quantitative analysis. This limit can
obviously be improved, if necessary, by using larger
plasma samples or dissolving the extract in a smaller
volume of methanol and injecting a larger aliquot into
the GC-MS.

Analysis of Biological Test Samples
30
Samples of plasma taken from monkeys, each given
oral doses of LAAM, were analyzed as a pilot test of the
analytical method. The drug concentration versus time
profiles was plotted, and the results were used as a
guide to the concentration ranges likely to be encountered
in the human study.
One hundred-forty plasma samples taken from
four monkeys were analyzed, along with appropriate
standards and blank monkey plasma. For the purpose of
this report, the results of 23 samples (6, 6, 6, and 5
from the four monkeys) taken following a single, acute
oral dose of LAAM at 2 mg/kg are shown in Table 4 and
Figures IlA, B, C, and D. The monkey study and plasma
samples were generously provided by Dr. David Downs,
Parke-Davis and Company, Ann Arbor, Michigan, according
to an agreed protocol for dose and blood-drawing times.
It is most striking that the plasma concentra-
tions of the drug and metabolites are very low, the
highest being at 28 ng/ml for nor-LAAM in monkeys 6733
and 6719. All other values are less than 15 ng/ml.
Many of the later data points are close to the sensitiv-
ity limit of the method for reliable quantitation. The
points were used, however, because the samples did con-
tain LAAM and metabolites. LAAM appears to be very

31
rapidly degraded in the monkey; only those samples drawn
up to 2 hr post-ingestion contained LAAM, but both
metabolites were continuously detectable. The data are
generally pharmacodynamically consistent and, although
the concentration values are different, the time-course
curves for the four animals are approximately parallel.
The experience with these samples and the ease
with which they were assayed proved the efficacy of the
total analytical procedure. In addition, it allowed an
operations time study of the procedure from sample re
ceipt to data generation. It is convenient to analyze
'samples in batches of 40, each batch having ten stan-
dards and reagent blanks. With current equipment, com
plete processing of a batch requires approximately 27
man-hours. It includes: 2.5 hr centrifuge time, 1 hr
for solvent extraction, 30 min incubation time, and 2.5
hr of other wet chemistry. It requires 12 hr GC-CIMS
MID, including 2 hr for instrument set-up and "tuning";
also, about 9 hr is needed to make all the computations
necessary to generate the final concentration values and
plot the time-course curves.
Clinical Study
The human clinical-pharmacology study was a col
laborative endeavor between Dr. Walter Ling of the

32
University of California, Los Angeles, and the Veterants
Administration Hospital, Sepulveda, California, and the
author. Dr. Ling provided the human subject volunteers
and maintained them in the hospital under medical super
vision for the duration of the study. He was responsi
ble for their medical care and all the clinical aspects.
The pharmacological design, including drug administra
tion, blood sampling protocols, methods of collecting
and preserving the samples, and, finally, analysis of
the plasma and data interpretation, was the responsi
bility of the author. There were 12 human subjects in
the collaborative study. They were all adult (mean
age, 36 years), male heroin addicts who had been main
tained on methadone at 60-80 mg daily for at least two
years. The subjects comprised five Caucasians, four
Mexican-Americans, and three Blacks. They were all
within the normal IQ range and had normal clinical chem
istry profiles, including liver function, and no recent
major medical problems. Blood clinical chemistry anal
yses were performed for each subject at the beginning,
in the middle, and at the end of each LAAM study period.
No abnormalities were revealed.
Table 5 shows the dose of LAAM ingested and the
body weight of each subject. Seven subjects (001 through
005, and all and 012) received 80 rng doses irrespective
of body weight, and five subjects (006 through 010)

33
received doses of 1 mg/kg body weight. The weights of
all the subjects, excepting 003, changed during the
study period~ Although subject 012 gained eight pounds,
from 134 to 142 pounds (approximately 6%), all the other
subjects remained in the range (-4% to +4%) of their
starting weight, and none of the changes was regarded
as having a significant influence on the pharmacokine
tic interpretation of the analytical data.
Each received ten oral doses of LAAM, given in
fruit juice at 48 hr and 72 hr intervals, over a total
period of 22 consecutive days. The first dose was given
on Friday, followed by Monday, Wednesday, Friday-
regularly through 22 days. Table 6 shows the time of
dose administration for each subject as a function of
hours into the study. It will be seen that dose times
were uniform to within a few min for all the subjects.
Blood samples were drawn according to the fol
lowing protocol, maintaining the draw-times as closely
as practically possible. Times are in hours following
each dose. Samples were drawn over a total period of
42 days, including 21 days following the last dose.

Zero. Dose 1:
Zero. Dose 2:
0.25, 0.5, 1.0, 1.5, 2, 4, 6, 12,
16, 24, 48, 72.
0.25, 0 .. 5, 1.0, 1.5, 2, 4, 6, 12,
16, 24, 48.
Zero. Dose 3: 0.25, 0.5, 1.0, 1.5, 2, 4, 6, 12,
16, 24, 48.
Zero. Doses 4-9: 1.0, 12, 24, 48 (72).
Zero. Dose 10: 0.25, 0.5, 1.0, 1.5, 2, 4, 6, 12,
34
24, 48, 72, 144 (6 days), 168 (7 days),
240 (10 days), 336 (14 days), 408 (17
days), 504 (21 days).
For the first three subjects, 49 plasma samples per
subject were drawn and analyzed. The blood samples
were drawn in vacutainer tubes containing fluoride,
immediately centrifuged to separate the plasma, which
was then transferred to chemically clean and inert
screw-capped tubes and stored frozen until analyzed.
This procedure minimized any sample contamination from
plasticizers or components of the vacutainer stoppers.
For subjects 004 through 012, 65 plasma samples per
subject were drawn and analyzed.
Every 12 hr throughout the study period a urine
specimen was collected from each subject, total volume
and pH were recorded, and two 20-ml samples from each
l2-hr collection were preserved for analysis. These
urine samples (710) are stored frozen and will be

35
analyzed as interpretation of the plasma data dictates,
for complete pharmacokinetic evaluation. At intervals
during the study, urine analyses were performed for
each subject to determine whether any other drugs had
been surreptitiously ingested. There were positive
findings in three subjects: imipramine was detected
in subject 010 on two occasions four days apart; pseudo
ephedrine on two consecutive days, and cocaine on one
other day in subject 011; barbiturate on two consecu
tive days, and pseudoephedrine, morphine, and propoxy
phene, once each on separate days in subject 012. In
subject 010, imipramine was detected , four days prior to
the first dose. The pseudoephedrine was detected in
subjects OIl and 012 on the day of the eighth dose. The
other findings occurred substantially during the final
three weeks of the study on the day or immediately after
the last dose. They did not disturb the analytical
method or affect the assay accuracy for LAAM and its
metabolites in plasma.

RESULTS
The plasma concentrations of LAAM, nor-LAAM
and dinor-LAAM following repetitive oral doses of LAAM
over a 42 day period are given for each of the 12 human
subjects in Tables 7 through 18. Times at which blood
samples were drawn are given in the tables, both as
cumulative time in hours into the study and as times
following each dose. The data are presented graphically
as log-concentrations versus linear-time plots for each
subject. Separate graphs, Figures 12A and B through
23A and B, depict the time courses of LAAM and its
metabolites following the first dose and the last dose
of the drug. The total time-course profiles for LAAM,
nor-LAAM, and dinor-LAAM are shown in Figures l2C, D,
E, through 23C, D, and E.
By inspection and analysis of the data in the
graphs and tables, it can be seen that within the study
range of 0.73-1.51 mg/kg, the dose of LAAM ingested is
not a critical variable with respect to subsequent plas
ma concentrations achieved and that it cannot be used
to predict either the likely maximum concentrations of
LAAM and its metabolites following single or multiple
doses or the possibility of drug and metabolite

37
accumulation in any given patient. Subjects 006-010 are
a uniform dose group, each having received 1 rng/kg LAAM.
However, from examination of their plasma concentration
profiles and their concentration ranges between first
and last doses, it is apparent that there are two sub
groups--subjects 006, 007, and 008 and subjects 009 and
010. The former are within narrow tolerances following
first and last doses, as are subjects 009 and DID, but,
as separate groups, they are quite disparate. Differ
ences in maximum concentrations between the two groups
for LAAM, nor-LAAM, and dinor-LAAM (first and last doses)
are in the range of 20-45%. Subjects 009 and 010 are
consistently lower. The difference in dosage was
greatest between subjects 002 and 004, at 0.73 mg/kg and
1.51 mg/kg, a decrease of 27% and an increase of 51% from
the uniform dose group, respectively; yet the differences
in the maximum concentrations between these two subjects
for LAAM and the metabolites following both first and
last doses are only in the range of 5-25%. Figure 24
illustrates these observations, particularly the simi
larity in plasma concentration values for subjects 006,
007, and 008 and for subjects 009 and 010 and, also, the
significant differences between them as two groups, des
pite each subject having received the same 1 mg/kg dose
of LAAM. In contrast, there are relatively minor dif
ferences between subjects 002 and 004, despite their

38
doses differing from each other by almost 100%. In
addition, subject 002, who received the minimum dose,
did not exhibit the minimum plasma concentrations after
the first dose nor did subject 004, who received the
maximum dose, have the maximum plasma concentrations,
although he required the longest time to reach maxi
mum concentrations of nor-LAAM (10 hr) and dinor-LAAM
{40-48 hr}. It is evident from all the foregoing re
sults that the dose range of LAAM used in the study
was too narrow to overcome the individual biological
variations within the 12 subjects and, consequently,
predictable dose-response patterns are not revealed.
The time taken to reach maximum plasma concen
tration following the first dose was very similar for
LAru1 in all 12 subjects, 3-6 hr with a mean of 4.4 hr.
For nor-LAAM, ten subjects were within the 4 to 7 hr
period, with a mean value of 5.6 hr. Subjects 004 and
010 required approximately 10 hr. For dinor-LAAM,
eight subjects required 5 to 7 hr, with a mean of 6.6 hr.
The remaining four subjects, numbers 002, 004, 005, and
010, required from 24 to 48 hr to reach their maximum
dinor-LAAM concentrations.
For each of the subjects, the time required to
reach maximum plasma concentrations of Lk~, nor-LAAM,
and dinor-LAAM following the tenth (last) dose was vir
tually the same as that seen after the first dose.

39
The maximum plasma concentrations for LAAM and
the metabolites after the first dose varied over a wide
range without any apparent relation to dose. For LAAM,
values ranged from 52 to 510 ng/ml. However, six sub
jects were between 100 and 200 ng/ml; four had less
than 100 ng/ml; two (subjects 008 and all) exhibited
extraordinary high.maximum concentrations of 268 ng/ml
and 510 ng/ml, respectively. Maximum nor-LAAM concen
trations varied between 65 and 175 ng/ml. There were
five subjects with less than 100 ng/ml and another
five had between 100 and 150 ng/ml. Only two subjects
(number 004, at 162 ng/ml and number 008 at 175 ng/ml)
had greater than 150 ng/ml. For dinor-LAAM, the range
was 11-92 ng/ml with five subjects less than 20 ng/ml
and five between 20 and 40 ng/ml. Two subjects (011
and 012) had greater than 40 ng/ml (92 and 67 ng/ml,
respectively). Although the time-course profiles with
respect to plasma concentrations of LAAM and its metab
olites are generally pharmacokinetically reasonable for
each subject, with some exceptions such as seen in sub
ject 011, there are no apparent correlations between
different subjects. For example, it might be expected
that those subjects with LAAM concentrations in the
lowest range (less than 100 ng/ml) would have the
highest nor-LAAM or dinor-LAAM concentrations. This is
not the case. Similarly, the two patients (numbers all

and 008) with the highest values of LAAM are not the
same two with the highest nor-LAAM (numbers 004 and
008), or dinor-LAAM (numbers 011 and 012).
40
By inspection of the total time-course plasma
concentration curves, it is evident that some subjects
accumulated LAAM and/or its metabolites for as long as
dosing was continued. Only subjects 006, 007, and 008
continuously accumulated all three drugs, LAAM, nor
LAAM, and dinor-LAAM. These three subjects, plus two
others (004, 005), accumulated LAAM, and these five,
plus 003, accumulated dinor-LAAM. This phenomenon was
seen by examining the total time-course curves in vari
ous ways. The broken line shown in Figures 12C, D, E
through 23C, D, and E traces plasma concentration values
at a fixed time after each dose and clearly illustrates
the trend to plateau or accumulation. Also, by deter
mining the plasma concentration difference at two time
points, e.g., 100 and 400 hr after the first dose, the
magnitude of increase or decrease for each subject can
be evaluated and compared. Similarly, the concentration
change between two different dose times, e.g., between
dose 3 and dose 10, can be used. Each of these tech
niques have limitations, but the pattern of drug and/or
metabolite(s) accumulation in six of the subjects is
clear. The accumulation is not related to dose, at
least within the range used in this study, and subject

41
007 exhibited the phenomenon most dramatically of all
subjects. It is equally clear for the other six sub-
jects (001, 002, 009, 010, 011, 012) on exactly the
same dosage regimen that there was no continuous in-
crease in concentrations, and they reached a plateau
at a time in keeping with approximately four to five
half-lives of elimination. An apparent plateau was
achieved for LAAM after three to four doses (mean 3.7
doses, or 218 hr), for nor-LAAM after three to four
doses (mean 3.4 doses, or 196 hr), and for dinor-LAAM
after three to six doses (mean 4.3 doses, or 267 hr) .
Subjects 009 and 010 were strikingly similar in this
regard and, again, contrast remarkably with subjects
006, 007, and 008, the three who most obviously accumu-
lated LAAM and the metabolites, and with whom they form
the uniform dose group at 1 mg/kg.
The plasma concentrations of LAAM and the
metabolites increased between the maximum achieved
after the first dose and the concentration at plateau
or maximum after the last dose, for all subjects except
011. The factor of increase for LAAM was 1.2-2.0; for
the five subjects accumulating the drug, 1.2-2.5. For
nor-LAAM, the factor was 1.4-2.0, with three accumula-
tors at 1.7-4.1. Dinor-LAAM ranged from 3.0-4.0 with
six accumulators at 5.0-10.0. Subject 007 accumulated
ECCLES ,.. j CE llBR/iny

LAM4 2.5-fo1dj nor-LAAM, 4.l-fo1d; and dinor-LAAM,
lO.O-fold over the ten-dose study period.
42
The semi-log scale graphs of plasma concentra
tions versus time for each of the patients describe
curves with an absorption phase, a distribution phase
occurring between 4 and 12 hr, and an elimination or
clearance phase between 24 and 72 hr after the first
dose of LAAM. A plasma elimination phase for nor-LAAM
is clearly described, but in all subjects the concen
tration of dinor-LAAM continued to increase, or at best
plateau, between the first and second doses. Accord
ingly, half-lives were calculated following the first
dose, for LAAM during its distribution (t~a) and elimi
nation phases (t~8), and for nor-LAAM elimination (t~S).
Half-lives of elimination were calculated for LAAM,
nor-LAAM, and dinor-~1 following the last dose, from
506-1008 hr. These data are given in Table 19. Inas
much as concentration values were measured frequently
over a long period of time, the equation t~ = 0.693/Ke
= 0.693/8 was used to calculate the half-life values
where Ke is the rate constant of elimination and B the
rate constant for first-order kinetics. The least
squares regression line was calculated by computer from
the graphs, and the slope and B values determined from
the equations log C = log Co - (S/2.303)t and B = slope
x 2.303.

43
For the a distribution phase of LAAM, it was
necessary to "feather" the curve to obtain the line of
first-phase residuals. This was done by computer in
which the B phase regression line was extrapolated to
zero-time and the extrapolated concentrations values
subtracted from the concentrations on the experimental
curve at the data time points. Alpha was then equal to
2.303x the slope of the residual line, and the half-life
(t~) equaled 0.693/0.. These calculations were also
made with the Tektronix 4051 mini-computer.
The mean value of t~o. for LAAM was 2.4 hr.
Seven of the subjects had values between 1.1 and 2.9 hr
with a mean of 1.5 hr, and the other five subjects
ranged from 3.0 to 4.5 hr with a mean of 3.7 hr. The
t~S for LAkM after the first dose ranged from 21.5 to
45.8 hr with a mean of 37.5 hr. The LAAM t~S after the
last dose had a greater range for the 12 subjects,
15.9-104.5 hr, but the mean at 46.8 hr was not remark
ably different from that after the first dose. By
contrast, the S for nor-LAAM increased by approxi
mately 63%, from a mean of 38.2 hr (range 13.5-60.2)
after the first dose to 62.4 hr (range 12.9-129.6) after
the tenth and final dose. After the first dose there
were two subjects at less than 30.0 hr and three others
greater than 50.0 hr, but the mean value was changed
only negligibly to 35.7 hr by neglecting these five

44
sUbjects. The plasma elimination half-life for dinor
Lk~M after ten doses and following the decay curve for
about 500 hr beyond the last dose was extremely vari
able, ranging from 22.5 hr to 429.9 hr. The mean value
was 161.9 hr. Neglecting the bizarre 22.5 hr value for
subject 011, the range was still 96.7 to 429.9 hr, and
the mean at 174.6 hr. Subjects 002 and 003 eliminated
LAAM and both metabolites at significantly slower rates
than the mean times, and subjects 005, 009, 011, and 012
exhibited faster rates for all three drug components.
The t~S for LAAM throughout the study appears to be in
dependent of dose and generally consistent with first
order pharmacokinetics.

DISCUSSION
Although interpretation of the analytical data
from this study is obviously limited by the fact that
only 12 subjects were involved, all of whom were male
opiate-narcotic addicts, and by the apparent range and
diversity of the results, it is nonetheless the largest
group studied and the first in which the human subjects
were completely controlled throughout the period. In
addition, the new GC-CIMS analytical method permitted
specific, accurate, quantitative analyses of the parent
drug and both metabolites in plasma to sensitivity
levels not possible previously. The reports of Billings
and McMahon (1974), Kaiko and Inturrisi (1975), and
Henderson (1976, 1977) were all severely constrained
by available analytical methodology and patient control.
Notwithstanding, many of the inferences and conclusions
in this report are consistent with or substantiate those
of these earlier investigators. A principal difference
is the LAAM t~a of 2.4 hr from this study against their
6 to 7 hr value. Only Henderson (1976) reported a S
phase elimination value for LAAM. His value of 49 hr
after 30 doses compares favorably with the results of
this study, 37.5 (first dose) and46.8 hr (last dose).

The t~ values for nor-LAAM are also similar to
Henderson's, but the dinor-LAAM values in this report
(range 162-175 hr) are the first to be calculated,
made possible by the accuracy and sensitivity of the
analytical method.
46
The appearance of nor-LAAM and dinor-LAAM in the
plasma very rapidly follows the absorption of LAAM, and
the metabolite concentrations rise to their maxima only
1.0 to 2.0 hr after the parent drug. This probably
results from a first-pass hepatic metabolism effect fol
lowing oral administration and is in keeping with obser
vations for similar drugs, such as propoxyphene. Despite
this rapid onset of metabolism, the t~a for LAAM is short
and the t~S, long, suggesting significant plasma protein
and tissue binding of the drug with a consequent large
volume of distribution.
From the study data, it is not possible to pre
dict a quantitative time-course for the drug and metabo
lites based on dose. If a greater range of doses had
been used, significant differences between patients
could have been anticipated; but this is not likely
when doses of 1 mg/kg ~25%, which achieve a satisfactory
clinical response, are administered three times per
week. For those patients who reached plateau plasma
concentrations, as seen by inspection of the total time
course graphs, they did so after the third dose and

47
and before the fifth dose, for LAAM (218 hr), nor-LAAM
(196 hr), and dinor-LAAM (300 hr). These times approx-
imate the theoretical pharmacokinetic factor of three
to five half-lives, except for the dinor-LAAM secondary
metabolite. This is not surprising in view of its
apparent very long half-l (approximately 170 hr)
and its production being dependent upon two stages of
metabolism and other in vivo variables.
Although only three subjects accumulated LAAM
and both metabolites continuously, five subjects ac-
cumulated more than one of the drugs, and six accumu-
lated dinor-LAAM. Henderson (1977) has suggested that
LAAM will not accumulate if administered in doses less
than 0.86 mg/kg and at intervals greater than 48 hr.
The half-life values and accumulation observed in this
study support the view that at 1 mg/kg doses, three times
per week, accumulation of the metabolites is likely to
occur in at least half the subjects and is not readily
predictable for any particular individual; and, impor-
tantly, that LAAM will also accumulate in some subjects
on this regimen. Inter-subject variations in medical
health, diet, drug metabolism rates, and other pharma-
cokinetic factors will obviously influence the possibil-
ity of accumulation for any particular subject.
Although the plasma concentration ranges varied
widely between subjects, the individual time-course

profiles of the parent drug and metabolites relative
to each other express reasonable pharmacodynamics and
kinetics. As a sub-group, subjects 006, 007, and OOB
compare very closely in regard to the time taken to
reach maximum concentration and the values achieved
after the first dose. They all accumulated LAAM and
4B
the metabolites, particularly dinor-LAAM, which was
increasing steeply even between the first and second
doses. This is especially true for subject 007, who
had the longest half-life of elimination for nor-LAAM
and a very long dinor-LAAM half-life. Subjects 009 and
010 are also closely matched as a pair but are very
different from 006, 007, and OOB. From considerations
of drug dose, body weights, medical histories including
opiate narcotic use, and clinical response to LAAM dur
ing the study, there is no obvious explanation why these
subjects should appear as more uniform relative to any
other subject in the study with the possible exception
of 011. Subject 011 achieved maximum plasma concentra
tions of LAAM and nor-LAAM within the study mean follow
ing the first dose and at a similar time to the other
subjects; but, in all other regards, the time-course
profiles of LAAM and metabolites were extremely erratic
and eccentric. This is especially true for dinor-LAAM,
which followed a course unlike that in any other subject
from onset to the end of the study period. The plasma

49
concentrations of the secondary metabolite plunged from
20 ng/ml at 18 hr after the first dose to zero at 24 hr,
and then back to 100 ng/ml at 48 hr before continuing
to rise to levels more than three times this concentra
tion after the tenth dose. The nor-LAAM concentrations
fell dramatically after the tenth and final dose at a
rate unique to this subject. For the first four doses,
the course of LAAM in subject all was similar to that
in the other subjects, but thereafter it, too, was very
erratic. Just prior to the sixth, eighth, and tenth
doses, the concentration of LAAM fell to zero, and within
12 hr after the last dose it was again at zero. This
pattern was not seen in any other subject but is remin
iscent of the metabolism profile observed in the test
monkeys, Figures llA, B, C, D. Overall, the plasma con
centration differences between maxima after first and
last doses is remarkable. LAAM decreased by a factor of
0.36, as did nor-LAAM by 0.75. Only dinor-LAAM ulti
mately increased by a factor of 3.0, but its terminal
half-life was incredibly short at 22.5 hr against a mean
of about 170 hr.
The total picture for subject all can be ration
alized if the possibility of nor-LAAM having a biphasic
effect on hepatic microsomal drug metabolism is recog
nized, first inhibitory via inactive P-450-nor-LAAM
complex formation (Franklin, 1977) J and then apparently

50
stimulatory at a later time after compensatory P-450
has been synthesized and the complex begins to degrade.
This phenomenon has been reported extensively by
Buening et al. (1976) and by Roberts et ale (1976) for
SKF 525-A and propoxyphene, drugs with structural formu
lae and biotransformation characteristics similar to
LAAM. The initial absorption and distribution of LAAM
and its first elimination from the plasma would be seen
as normal, with a rapid hepatic first-pass production of
nor-LAAM which would then complex and inactivate a sig
nificant proportion of the cytochrome P-450 available for
drug metabolism. Consequently, metabolism would be inhib
ited and the appearance of dinor-LAAM would be slow and
the apparent plasma clearance of nor-LAAM rapid. Further
more, as new cytochrome P-450 (which is not all capable
of forming a complex during metabolism) was synthesized
to compensate for the apparent loss of the initial cyto
chrome P-450 to the inactive complex, the metabolism rate
would be steadily restored, and the metabolism of LAAM
and nor-LAAM would be noticeably stimulated. This would
result in a fast elimination of the parent drug and me
tabolites from the plasma, as evidenced in subject 011
by the extraordinarily short half-lives and a large in
crease in the concentration of dinor-LAAM.

51
There is also the suggestion in the data from
subjects 004 and 012 that the same mechanism may be
involved but less significantly than in 011. In subject
004, the appearance of dinor-LAAM was very erratic, and
in subject 012 the plasma clearance of nor-LAAM was
even faster than in 011 after the first dose, although
it was re-established closer to the study mean after
multiple doses of the drug. If correct, this biochem
ical mechanism could be important for potential drug
interactions which would alter hepatic drug metabolism
in addicts treated with LAAM as clinical outpatients,
particularly as they are prone to use and abuse multi
ple drugs.
There are a number of necessary studies to be
undertaken as this research continues, all of which are
vital to an unequivocal pharmacodynamic and kinetic
description of LAAM in man. Most importantly a single
dose by intravenous injection or infusion is required
to describe the kinetics free from absorption and any
first-pass effects. Plasma concentrations should be
folllowed for at least five half-lives. Similarly, the
half-life elimination should be determined for LAAM and
nor-LAAM, after a single oral dose at 1 mg/kg, from plas
ma concentrations followed for as long as the analytical
method will permit. This is a very difficult clinical
undertaking because the narcotic addict patient would

52
be threatened by onset of withdrawal symptoms unless
given additional doses. Female subjects should be stud
ied and, because of the kinetic and time-course profile
disparaties, the monkey as a primate model for the human
condition needs to be very carefully evaluated. Also,
human plasma protein binding data are needed for the
range of LAAM and metabolite concentrations seen in
this study, so that accurate volumes of distribution
can be determined experimentally. Finally, urine samples
collected during the study will be analyzed to develop
quantitative metabolite excretion data which should sub
stantiate the plasma findings.

REFERENCES
Billings, R.E., Booher, R., Smits, S., Portland, A., and
McMahon, R.E. Metabolism of acetylmethadol in
the rat. A sensitive assay for nor-acetylmeth
adol and the identification of a new active
metabolite. J. Med. Chern. ~:305, 1973.
Billings, R.E., McMahon, R.E., and Blake, D.A. 1-
acetylmethadol (LAM) treatment of opiate depend
ence: plasma and urine levels of two pharmaco
logically active metabolites. Life Sci. !!:1437,
1974.
Blachly, P.H. I-alpha acetylmethadol in treatment of
opiate addiction: Progess report, Methadone
1971 Workshop Proceedings. P.H. Blachly, ed.
ACEB Books, Corvallis, Oregon. 1971.
Buening, M.K. and Franklin, M.R. SKF 525-A inhibition,
induction, and 452 nm complex formation. Drug
Metab. Disp. i:244, 1976.
Chen, K.K. Pharmacology of methadone and related
compounds. Annals N.Y. Acad. Sci. 51:83, 1948.
Delory, G.E., and King, E.J. A sodium carbonate
bicarbonate buffer for alkaline phosphatases.
Biochem. J. ~:245, 1945.

54
Dole, V.P. and Nyswander, M. A medical treatment for
diacetylmorphine (heroin) addiction. A clinical
trial with methadone hydrochloride. J. Amer.
Med. Assn. 193:646, 1965.
Dole, V.P., Nyswander, M., and Kreek, M.J. Narcotic
blockade. Arch. Intern. Med. 118:304, 1966.
Franklin, M.R. and Roberts, S.M. The cytochrome P-450
dependent metabolism of drugs of possible use
in opiate addiction treatment programs. Fed.
Proc. 36:940, 1977.
Fraser, H.F. and Isbell, H. Actions and addiction
liabilities of alpha-acetylmethadols in man.
J. Pharmacol. EXp. Ther. 105:458, 1952.
Goldstein, A. Heroin addiction and the role of methadone
in its treatment. Archs. Gen. Psychiat. 26:291,
1972.
Goldstein, A. LAAM and LAAM metabolites: plasma levels
in patients. Summary, Research Progress Report
to the National Institute on Drug Abuse. Un-
published, 1975.
Harms, E. Some shortcomings of methadone maintenance.
Brit. J. Addict. 2Q:77, 1975.
Henderson, G.L. Biological fate of 3H- LAAM in rat, dog,
and monkeys. Proc" Nat'l. Drug Abuse Conf.,
New York, March 28, 1976.

55
Henderson, G.L. and Lau, H.M. Plasma levels of 1-0-
acetylmethadol {L~n and its metabolites fol
lowing acute and chronic oral administration in
man. Proc. West. Pharmacol. Soc. 18:270, 1975.
Henderson, G.L., Weinberg, A.J., Hargreaves, W.A.,
Lau, D.H.M., Tyler, J., and Baker, B. Accumula
tion of l-o-acetylmethadol (LAAM) and active
metabolites in plasma following chronic admin
istration. J. Anal. Tox. !:l, 1977.
Henderson, G.L., Wilson, B.K., Lau, D.B.M. Plasma
levels of l-a-acetylmethadol (LAAM) following
acute and chronic administration. J. Clin.
Pharmacol. Therap.
Jaffe, J.B. The maintenance approach to the management
of opiate dependence. In, Drug Abuse: Proc. of
the International Conf., Zarafonetis, C.J.D., ed.,
Lea & Febiger, Philadelphia, 1972.
Jaffe, J.H. and Senay, E. Methadone and l-methadyl
acetate: use in the management of narcotic
addicts. J. Amer. Med. Assn. 216:1303, 1971.
Jaffe, J.B., Schuster, C., Smith, B., and Blachly, P.
Comparison of acetylmethadol and methadone in
the treatment of long-term heroin users. J.
Amer. Med. Assn. 211:1834, 1970.

56
Kaiko, R.F. and Inturrisi, C.E. A gas liquid chromato
graphic method for the determination of acetyl
methadol and its metabolites in human urine.
J. Chromatogr. ~:3l5, 1973.
Kaiko, R.F. and Inturrisi, C.E. Disposition of acetyl
methadol in relation to pharmacological activ
ity. Clin. Pharmacol. Ther. 18:96, 1975.
Keats, A. and Beecher, H. Analgesic activity and toxic
effects of acetylmethadol isomers in man. J.
Pharmacol. EXp. Ther. 105:210, 1952.
Kreek, M.J. Medical safety and side effects of methadone
in tolerant individuals. J. Amer. Med. Assn.
223:665, 1973.
Kochhar, M.M., Hamrick, M.E., and Bhushan, R.S. Rapid
TLC determination of methyadyl acetate and some
in vitro metabolites. J. Pharm. Sci. 65(1):137,
1976.
Kuttab, S.H., North-Root, H., and Henderson, G.L. Ex
traction method and thin layer chromatographic
system for the determination of a-l-acetylmetha
dol and metabolites in biological fluids. J.
Chromatogr. 117:193, 1976.
Lau, H.M. and Henderson, G.L. Sex related differences
in the metabolism of l-a-acetylmethadol (LAAM)
in the rat. Pharmacologist 17:176, 1975.

Levine, R., Zaks, A. , Fink, M., and Freedman, A.M.
Levomethadyl acetate. Prolonged duration of
opioid effects I including cross-tolerance to
heroin in man. J. Amer. Med. Assn. 226:316,
1973.
McIntyre, J.A., Armansi, A.E., Risen, L.P., Ling, W.,
and Harberfelde, G.C. Thin layer chromatog
raphy and enzyme immunoassay of l-a-acetyl
methadol and methadone metabolites in urine.
Clin. Chern. 21:109, 1975.
McMahon, R.E., Culp, H.W., and Marshall, F.J. The
metabolism of a-dl-acetylmethadol in the rat:
the identification of the probable active
metabolite. J. Pharmacol. EXp. Therap. 149:
436, 1965.
57
Misra, A.L., Bloch, R., and Mule~ S.T. Estimation of 1-
a-[2- 3H]acetylmethadol in biological materials
and the separation from some metabolites and
congeners on glass fibre sheets. J. Chromatogr.
106:184, 1975.
Misra, A.L., Varoy, J., and Bloch, R. Pharmacokinetics
and metabolism of (3H)-LAAM in the mouse and
disposition of (3 H)-naltrexone in the CNS of
the rat. Proc. Nat'l. Drug Abuse Conf., New
York, March 28, 1976.

Misra, A.L., Varoy, J., Bloch, R., Mule~ S.J., and
Deneau, G.A. Pharmacokinetics and metabolism
of {-)-a-[2-3H]acetylmethadol (LAAM) in the
monkey. Evidence for a new metabolite. J.
Pharm. Pharmacal. ~:3l6, 1976.
58
Nickander, R., Booher, R., Miles, H. l-a-acetylmetha
dol and its N-demethylated metabolites have
potent opiate action in the guinea-pig isolated
ileum. Life Sci. !!:20ll, 1974.
North-Root, H., Huttab, S.H., and Henderson, G.L.
Biological disposition and transformation of 1-
a-acetylmethadol in the monkey, dog, and rat.
Proc. Nat'l. Res. Council/Nat '1. Acad. of Sci.
Committee on Problems of Drug Dependence, 645,
1975.
North-Root, H., Kuttab, S.H., and Henderson, G.L.
Biliary metabolism and excretion of l-a
acetylmethadol in the rat. Pharmacologist 17:
176, 1975~
Roberts, S.M., and Franklin, M.R. Propoxyphene and in
vivo formation of cytochrome P-450 metabolic
intermediate (MI) complexes. The Pharmacolo
gist ~:2l0, 1976.
Smits, S.E. The analgesic activity of l-a-acetylmethadol
and two of its metabolites in mice. Res. Comma
in Chern. Path. and Pharmacol. ~f 575, 1974.

Sullivan, H.R., Due, S.L., and McMahon, R.E. Metabo
lism of a-l-methadol. N-acetylation, a new
metabol pathway. Res. Comm. in Chern. Path.
and Pharmacol. ~, 1072, 1973.
59
Sung, C.Y. and WaYI E.L. The fate of the optical
isomers of alpha-acetylmethadol. J. Pharmacol.
Exp. Therap. 110, 260, 1954.
Upsitz, P.J. and Blatman, S. Newborn infants of mothers
on methadone maintenance. N.Y. State J. Med .
.?i, 994, 1974.
Veatch, R.M., Adler, T.K., and Way, E.L. The importance
of steric configuration in certain rnorphine
mimetic actions of synthetic analgesics. J.
Pharmacol. Exp. Therap. 145, 11, 1964.
Way, E. and Adler, T. The pharmacologic implications of
the fate of morphine and its surrogates.
Pharmacol. Rev. 12, 383, 1960.
Welling, P.G. Pharmacokinetic studies on l-alpha
acetylmethadol (LAAM) in dogs. Report to the
National. Institute on Drug Abuse. Unpublished,
1974.
Wolen, R.L. and Gruber, C.M. Determination of propoxy
phene in human plasma by gas chromatography.
Anal. Chern .. !Q..' 1243, 1968.

FIGURES

Figure 1. Synthesis scheme for 1-a-acety1methado1
(LAAM) from methadone.
61

9~
Q
o H
II
I .....
. CH
3 H
3C
-H
2C
-C-C
-CH
2 -
C-
N
O I
'C
H3
~
CH
3
I~
o II
9 18
OH
H
H
2
I I
/C
H3
)It.
H
3C
-CH
2-C
H6
C C
H2
-9-N
, C
H
CH
3
~
3 I
#'
H3C
-C
-? \.
7 /' C
H3
(CH
3C
O)2
0.,
. H3C-H2C-CH-C-CH2-~-N'CH3
C5
H5
N
~
CH
3
U
0')
N

Figure 2. Biotransformation pathways for l-a
acetylmethadol (LAAM).
63

........ C
H3
CH
3-C
H2-
CH
-C
-CH
2 -C
H-
N
16
I '
CH3
Q
CH
3-C
-O
~
CH
3
AC
ET
YLM
ET
HA
DO
L ~
...
I \
(1
/ N
-DE
ME
TH
YL
AT
ION
0
~
/CH
3
~
........ C
H3
CH
3-C
H2
-CH
-C-C
H2
-CH
-N
CH
3-C
H2-
CH
-C-C
H2-
CH
-N
I 6
I 'H
I 6
I '
CH3
CH
3-C
-O
'7
CH
3 HO
~
CH
3 "
I I
o ~
~
NO
RACE
TYLM
ETH
AD
OL
MET
HA
DO
L j
N
DE
ME
TH
YLA
TIO
N 1
DE
AC
ET
YLA
TIO
N
N-D
EM
ET
HY
LA
TIO
N
/H
CH
3-C
H2
-CH
-C-C
H2
-CH
-N
16
I 'H
C
H3-
C-O
~
CH
3 II
I o ~ 9
DIN
ORA
CETY
LMET
HA
DO
L
Q
....... C
H3
CH
3-C
H2
-CH
-C-C
H2
-CH
-N
16
I 'H
HO
-:
y
CH
3 I
. ~
NO
RMET
HA
DO
L 0
'\
~

65
2.0 rnl PLASMA + 1.0 rnl Int. Std. Solution + 1.0 ml Buffer (pH 9.2) + 10.0 ml n-Butyl Chloride
Shake 10' , Centrifuge 1500 rpm 5'
AQUEOUS PHASE:DISCARD
ORGANIC SOLVENT PHASE DISCARD
AQUEOUS PHASE: DISCARD
I
ORGANIC SOLVENT PHASE
Extract with 10 rnl 0.2N HCl Shake 10', Centrifuge 1500 rpm 5'
I
ACID PHASE
Adjust to pH 12-13, add 0.5 ml 5 N NaOH Incubate 30' @R.T. then finally
10 min @70°C Cool, extract with 10 ml CHC1
3
VORTEX FOR 5'
CHC1 3 PHASE
Evaporate to dryness with air ({200CC/min)
Reconstitute with { 25 VI methanol for GC-CI-MS
Figure 3. Extraction method for LAAM, metabolites, and
isotope internal standards from plasma.

66
Figure 4A. LAAM, electron impact mass spectrum.

o o
o t{)
~
o
o t{) r0
o o r0
o LO C\J
o o N
o LO(J)
N
LO
O(J) Ot{)
CD Nr<1 """CO
o t{)
67

68
Figure 4B. Dinor-L~~, electron impact mass spectrum

I 0 0 0 0 lO
~
o L{) tf)
o o rr>
o L{) N
0 0 N
0 lC)
L{)
lO
-~ tf)
lC)
0 0 --en
en OL() L{)
69
OJ
" ~

Figure SA. LAAM, chemical ionization mass spectra
using methane reagent gas.
70

o o
o 10
~
+ 2
o
o LO N
o o N
o 10
71

Figure SB. Nor-LAAM amide, chemical ionization mass
spectra using methane reagent gas.
72

o o
00 lC)~
+ r<)r<)
~ N N r<)
0 0 r<>
am lC)~ C\J N
I"-
02 0 N
I"-
0 L()
o ----------------------~O
a lC)
~
o
o L()
73
OJ
" ~

74
Figure SC. Dinor-LAAM amide, chemical ionization mass
spectra using methane reagent gas.

o o o
to
~
o
Oen L()~ NN
l'-
0° ON N
l'-
0 LO
N 00 0-
o L{)
<.0 OJ
75
Q)
"'-~

Figure 6A. LA&~, chemical ionization mass spectra
using methane-ammonia as reagent gas.
76

+ ~
o o o lO
~
o
77
¢ oL() L{)r<1 t<)
N -Ot(") 0 t<)
LO <..0 N
00 L()'\t NN
r0 N N
N ~ 00
ON ~ N CO
0 L()

Figure 6B. Nor-LAAM amide, chemical ionization mass
spectra using methane-ammonia as reagent gas.
78

o o
o o rno
----I.- CO
o t.{)
N
o t.()
N
______________________ ~o o
o L()
~
o
o l{')
79

80
Figure 6C. Dinor-LAAM amide, chemical ionization mass
spectra using methane-ammonia as reagent gas.

o o
o I,{)
~
+ ___ ..r
~
o
o l!) r0W
N r0
CO o Ot0 o r<>
81
o Q)
o " N ~
o LD
o If)
CO

82
Figure 7. Comparative GC-CI-MS, molecular ion monitor
ing of LAAM and metabolites using methane or methane
ammonia as reagent gas.

LAAM~ ~NOR
A-
'DINOR
- CH4: NH3 GAS
t --- CH4 GAS 1\ '\ II
: I I I I ! I I
...' I ..
83

Figure 8. M.S. recorder responses at molecular ion
for 1.0 ng LAAM, at maximum resolution (0.2 amu) and
minimum resolution (1.0 amu).
84

85
- MIN. --- MAX.

Figure 9. Multiple ion monitor recording of LAAM,
nor-LAAM, dinor-LAAM, and isotope internal standards.
86

M/e
3
54
3
57
3
40
3
43
3
26
3
29
LA
D
3
no
r
D3
d
in
D3
AM
:=
M
/e 3
54
-
LA
AM
=
M/e
35
7
-L
AA
M -
AM
IDE
=
M/e
34
0
-n
or-
LA
AM
A
MID
E
= M
/e 3
43
or
-L
AA
M-A
MID
E
= M
/e 3
26
-
din
or
-L
AA
M --
AM
IDE
= M
/e 3
29
(X)
-....J

88
Figure IDA. Standard assay calibration curve for L~1.
Concentration range zero-IOO ng/ml plasma.

o o
o 0'>
o CO
o I'-
0 to
0 L{)
0 ¢
0 r0
0 N
o
89
E
" 01 C

90
Figure lOB. Standard assay calibration curve for nor
LAAM. Concentration range zero-IOO ng/ml plasma.

£0 00 01.1 V't:J
91
o E 1.0" 01
o c: ~
o r(')

92
Figure IOC. Standard assay calibration curve for dinor
LAAM. Concentration range zero-IOO ng/ml plasma.

£0 00 OI..lU'tl
o o
o (j)
93
o E l!)"-..
CJ1 c

94
Figure llA. Monkey 6719. Monkey plasma concentration
time courses of LAAM, nor-LAAM, and dinor-LAAM follow
ing a single acute 2 mg/kg oral dose of LAAM.

45
40
35
30
25
N
G/M
L 2
0
15
10
5 e 0
5 to
KEY
LA A
M =
II
nor-
LA
AM
=
0
dfno
r-L
AA
M
= <
)
-.""
'-. -..
MON
KEY
*671
9 D
ose
= 2
M
g/K
g
15
2
0
25
3
0
35
4
0
HOUR
S
45
5
0
~

96
Figure lIB. Monkey 6733. Monkey plasma concentration
time courses of LAAM, nor-LAAM, and dinor-LAAM follow
ing a single acute 2 mg/kg oral dose of LAAM.

45
40
35
30
25
20
15
10
5 13
e 5
10
KEY
LAAH
=
A
nor-
-LA
AM
=
0
dino
r-L
AA
M
= <
>
MON
KEY
+67
33
Do
se =
2
Mg
/Kg
15
2
0
25
31
3 3
5
40
HOUR
S
45
5
0
\.0
-.
J

98
FigurellC. Monkey 6751. Monkey plasma concentration
time courses of LAAM, nor-LAAM, and dinor-LAAM follow
ing a single acute 2 mg/kg oral dose of LAAM.

45
4e
35
30
25
N
G/M
L 2
0
15
Ie
5 e o
5 Ie
KEY
LAAM
:=
I::
l no
r-LA
AM
=
0
dino
r-L
AA
M =
0
MON
KEY
i675
1 D
ose
=
2
Mg
/Kg
15
2
0
25
3
0
35
4
0
HO
URS
45
5
0
\.0
\.
0

100
Figure lID. Monkey 6775. Monkey plasma concentration
time courses of LAAM, nor-LAAM, and dinor-LA&~ follow
ing a single acute 2 mg/kg oral dose of LAAM.

45
413
35
30
25
N
G/H
L 2
0
15
10
5 £1 0
5 to
KEY
LA AM
=
b,.
nor-
LA
AM
=
0
dfno
r-L
AA
M =
<>
MON
KEY
+67
75
Do
se =
2
Mg/
Kg
t5
20
2
5
30
HOUR
S 3
5
413
45
5
0
6 ......,

102
Figure 12A. Subject 1. Human plasma concentration
time courses of LAAM, nor-LAAM, and dinor-LAAM follow
ing the first dose of LAAM at zero time to 72 hr.

Ieee
t00
NG
/ML 10
1 •.
<1>
,
e 5
Ie
~ D
ose
+1
KEY
LAAM
=
~
nor-L
AA
M
==
0 df
nor-
LA
AM
=
<>
SU
BJE
CT
t t
Do
se
='
80
M
g B
od
y
weIg
ht
= 6
2
Kg
/ tl
' -_
_
= _~
15
20
2
5
30
3
5
40
4
5
S0
5
5
60
6
5
HOUR
S
70
7
5
~ I-
'
Do
se +2~

104
Figure 12B. Subject 1. Human plasma concentration
time courses of LAAM, nor-LAAM, and dinor-LAAM follow
ing the tenth (last) dose of LAAM at 504 hr to 575 hr.

Ieee
10
e
NG/ML.~
te
KEY
LA AM
=
~
nor-L
AA
M
= 0
df
nor-
LA
AM
=
<>
SUB
JEC
T:
t D
ose
=
80
M
g B
od
y welgh~
= 6
2
Kg
1.
, '
I I
I ,
I ,
, I
, ,
I ,
,
50
0 ~05
51
0
51
5
52
0 5
25
53
0
53
5
54
0
54
5
55
0
55
5
56
0
56
5 5
70
5
75
~
Dos
e tI
e
HO
URS
~

106
Figure 13A. Subject 2. Human plasma concentration
time courses of LAAM, nor-LAAM, and dinor-LAAM follow
ing the first dose of LAAM at zero time to 72 hr.

10
e0
tee
NG
/ML 10
1 ..
I
e 5
~ D
ose
.,
KEY
LAAM
=
II
nor~LAAM
= 0
dl
nor..
".LA
AM
=
<>
SUBJECT~
2 D
ose
=
80
M
g B
ody
welgh~
= t
eg
K
g
te
t5'
20
2
5
30
3
5
40
45
S8
55
6
a 6
5
70
75
~
~ H
OU
RS
D
ose
+
2 ~

108
Figure l3B. Subject 2. Human plasma concentration
time courses of LAAM, nor-LAAM, and dinor-LAAM follow
ing the tenth (last) dose of LAAM at 504 hr to 575 hr.

Ieee
t 001
= a
I '0
KEY
LA AM
=
ll.
nor-
-LA
AM
=
0 dl
nor-
LA
AM
=
<>
Q
SU
BJE
CT
t 2
Do
se =
80
M
g B
ody
welg
hl
= te
g
Kg
I¢t
1 I
' I'
, ,
, ,
, ,
' I
I I
, I
50
0 ~05 5
t0 5
15
52
0 5
25
53
0 5
35
54
0 5
45
55
0 5
55
56
0 5
65
57
0 5
75
~
Dos
e tI
e
HO
URS
~

110
Figure 14A. Subject 3. Human plasma concentration
time courses of LAAM, nor-LAAM, and dinor-LAAM follow
ing the first dose of LAAM at zero time to 72 hr.

Ieee
t00
NG
/ML
KEY
LAAM
=
~
no
r .....
LAAM
==
0
dfno
r-L
AA
M
:=
<>
SU
BJE
CT
t 3
Dos~
:=I
80
M
g B
od
y
welg
hl
=
94
K
g
1 •• I~ _
_ ~ _
_ ~ _
__
_ ~ _
__
_ ~ _
__
__
__
_ ~ _
__
_ ~ _
__
_ ~ _
_ ~~ _
_ ~ _
__
_ ~ _
__
_ ~ _
_ ~ _
__
_ ~ _
_ ~
~ 5
te
Do
se it
15
2e
25
se
3
5
4e
HO
URS
45
5e
55
60
6
5
7e
75
+
~ D
ose
+
2 :
::

112
Figure 14B. Subject 3. Human plasma concentration
time courses of LAAM, nor-LAAM, and dinor-LAAM follow
ing the tenth (last) dose of LAAM at 504 hr to 575 hr.

Ieee
t00
NG
/ML 10
KEY
LAAM
=
~
nor-
LA
AM
=
0
dfno
r-L
AA
M
= <>
SUB
JEC
T::
3 D
ose
::
8
0
Mg
Bo
dy
we
igh
t =
94
K
g '-'--------~
t ,
I I
I I
I I
, I
, I
! ,
, ,
I
see 5
05
5t0
51
5
52
0 5
25
53
0 5
35
54
0
54
5 5
5e
55
5 5
6e
56
5 5
70
57
5
~ D
ose
+to
HO
URS
.-...
.-...
w

114
Figure l5A. Subject 4. Human plasma concentration
time courses of LAAM, nor-LAAM, and dinor-LAAM follow
ing the first dose of LAAM at zero time to 72 hr.

Ieee
te0
NG
/ML 10
KEY
LAAH
=
6,
nor-L
AA
M
= 0
df
nor-
LA
AM
=
<>
~~_/
----
----
/1
/
SUB
JEC
T:
4 D
ose
=
8e
Mg
Bo
dy
weIg
ht
= 5
3
Kg
~ .....
. ~
1 ~ A
'<3
I'
Tt
e 5
~ D
ose
+1
te
15
2e
25
3
0
35
40
45
5
e
55
6
e 6
5
HO
URS
---...., ...
~:> <~
~~~\,
'",
7fJ
75
~
~ D
ose
1
2 ~

116
Figure l5B. Subject 4. Human plasma concentration
time courses of LAAM, nor-LAAM, and dinor-LAAM follow
ing the tenth (last) dose of LAAM at 504 hr to 575 hr.

Ieee
t 00
. 'r-
"'U-
10
KEY
LAAM
=
8
nor-L
AA
M
= 0
df
nor-
LA
AM
=
<>
/~ ~.
SUB
JEC
T:
4 D
ose
=
8
0
Mg
Bo
dy
welg
hl
= 5
3
Kg
I.
I '
, I
I ,
, I
I I
I '
, I
I
5ee
~e5
51
e 5
15
52
e 5
25
53
e 5
35
54
e 54
5 5
5e
55
5 5
6e
56
5 5
7e
57
5 ~
Dos
e 1
10
H
OU
RS
~

118
Figure l6A. Subject 5. Human plasma concentration
time courses of LAAM, nor-LAAM, and dinor-LAAM follow
ing the first dose of LAAM at zero time to 72 hr.

Iee
e
10
0
NG
/ML 10
1 IE
'>
'
o 5
~ D
ose
.1
KEY
LAAM
=
~
nor-
LAA
M
= 0
di
nor-
LA
AM
=
<>
SUB
JEC
T:
5 D
ose
=
8
e
Mg
Bo
dy
w
eig
ht
=
61
Kg
-------
------
~
-----~----
---- 10
15
2
0
25
3
0
35
40
45
5
0
55
60
6
5
HO
URS
70
75
~ .....
.,
Do
se
+2
~

120
Figure 16B. Subject 5. Human plasma concentration
time courses of LAAM, nor-LAAM, and dinor-LAAM follow
ing the tenth (last) dose of LAAM at 504 hr to 575 hr.

10
00
10
0c=
-~
NG
/MLL
A
}.
10
KEY
LAAM
=
~
nor-
LA
AM
=
0
dfno
r-L
AA
M
= <>
SUB
JEC
T:
5 D
ose
=
80
M
g B
od
y
weig
ht
= 6
1 K
g
-------
I.
I !
I !
' ,
, ,
I I
' ,
! I
I
50
0
50
5
51
0
51
5
52
0
52
5
53
0 5
35
5
40
5
45
5
50
5
55
5
60
5
65
5
7e
57
5
~ D
ose
il
0
HOUR
S
~
~
~

122
Figure 17A. Subject 6. Human plasma concentration
time courses of LAAM, nor-LAAM, and dinor-LAAM follow
ing the first dose of LAAM at zero time to 72 hr.

tee
e
100~
NG
/ML 10
1_
f 5
10
Dos
e +1
KEY
LAAM
=
!J.
nor-
LAA
M
=
0 di
nor-
LA
AM
=
<>
15
2e
2
5
30
3
5
40
HOUR
S
SUB
JEC
T:
6 D
ose
=
1
Mg
/Kg
45
50
5
5
60
6
5
70
~ 7
5
Do
se
+2
f-!
I:\J
W

124
Figure l7B. Subject 6. Human plasma concentration
time courses of L~1, nor-LAAM, and dinor-LAAM follow
ing the tenth (last) dose of LAAM at 504 hr to 575 hr.

Ieee
KE
Y LA
AM
= ~
nor-
LA
AM
=
0 di
nor-
LA
AM
=
<>
SUB
JEC
T:
6 D
ose
=
1 M
g/K
g
100~
0;
kJ
:
*"
1.
I ,
, •
I '
I '
I ,
' ,
, I
I
50
0 ~05
51
0 5
15
52
0 5
25
53
0 5
35
54
0 5
45
55
0 5
55
56
0 5
65
57
0 5
75
~
Dos
e 11
0 H
OU
RS

126
Figure 18A. Subject 7. Human plasma concentration
time courses of LAAM, nor-LAAM, and dinor-LAAM follow
ing the first dose of LAAM at zero time to 72 hr.

teee
10
0
NG
/ML 113
KEY
LAAM
=
~
nor-
LAA
M
= 0
di
nor-
LA
AM
=
<>
1 _
' ,
o 5
~ -
~ 1
0
15
2
0
Dos
e +1
25
31
3 3
5
40
HOUR
S
SUB
JEC
T:
7 D
ose
=
1
Mg
/Kg
45
50
5
5
60
6
5
70
75
~ D
ose
+
2
~
I\J '"

128
Figure l8B. Subject 7. Human plasma concentration
time courses of LAAM, nor-LAAM, and dinor-LAAM follow
ing the tenth (last) dose of LAAM at 504 hr to 575 hr.

Iee
e
1130
~-..-s-,~~--~ .. --~-
NG
/ML 10
SUB
JEC
T:
7 D
ose
=
1
Mg
/Kg
'----_
_ ..Jr
-t
L:J
r---
----
----
____
__
A.
----
-.--.
v'
....--
----.
----
-~ .. --
.----~------------:II
KEY
LAAM
=
~
nor-
LA
AM
=
0
dfno
r-L
AA
M
=
<>
1L
I I
I '
, I
' I
I ,
' I
, ,
I
50
e 5
05
51
0
51
5
52
0 5
25
53
0 5
35
54
0 5
45
55
e 5
55
56
e 5
65
57
0
57
5 ~
+
~ D
ose
*
10
HO
URS

130
Figure 19A. Subject 8. Human plasma concentration
time courses of LAAM, nor-LAAM, and dinor-LAAM follow
ing the first dose of LAAM at zero time to 72 hr.

Iee
e
10
0 ..
.
NG
/ML 10
KEY
LAAM
=
~
nor-
LAA
M
= 0
di
nor-
LA
AM
=
¢
SUB
JEC
T:
8 D
ose
:::
1
Mg
/Kg
=---.
. ---------{-~~------~.--'-----------.-.---.----~---.
1 P
H
• ..
e 5
~ 1e
15
2
e 2
5
30
3
5
40
4
5
50
5
5
60
6
5
70
7
5
+
Do
se
+t
HO
UR
S D
ose
+2
I-'
W
I-'

132
Figure 19B. Subject 8. Human plasma concentration
time courses of LAAM, nor-LAAM, and dinor-LAAM follow
ing the tenth (last) dose of LAAM at 504 hr to 575 hr.

Ieee
10
0
NG
/ML 10
KEY
LAAM
=
b.
nor-
LA
AM
=
0 di
nor-
LA
AM
=
¢
SUB
JEC
T:
8 D
ose
= t
Mg
/Kg
"~------v'
----.---
----_ ... -
------
--.--
-~.-.
1 ,
' !
, •
, ,
! ,
, ,
, ,
I I
,
50
e
50
5
51
0
51
5
52
0
52
5
53
0
53
5
54
0
54
5
5S
0
55
5
56
0
56
5
57
0
57
5
~ G
D
ose
tIe
H
OUR
S
134
Figure 20A. Subject 9. Human plasma concentration
time courses of LAAM, nor-LAAM, and dinor-LAAJ1 follow
ing the first dose of LAAM at zero time to 72 hr.
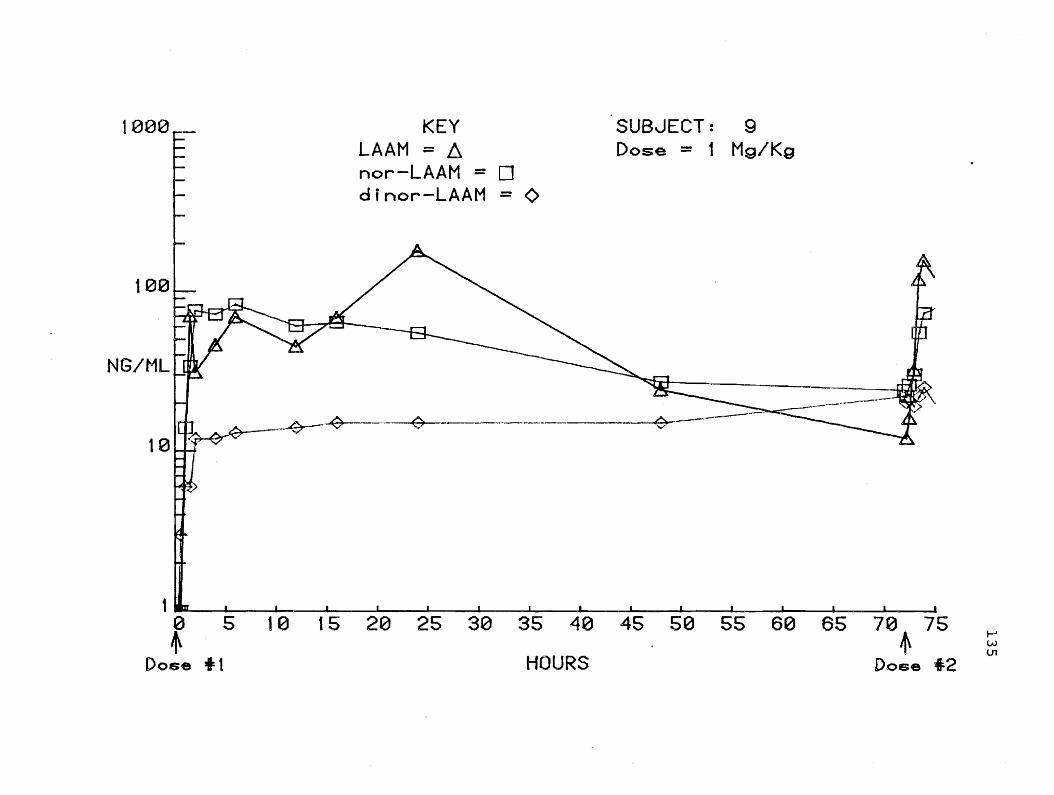
10
00
__
t00
NG
/ML 1e
1..
. I
o 5
tf\ D
ose
+1
KEY
LAAM
=
!;;
. no
r-L
AA
M
= 0
di
nor-
LA
AM
=
0
(7
SUB
JEC
T:
9 D
ose
=
t
Mg
/Kg
10
15
20
2
5
30
3
5
40
45
50
5
5
60
6
5
70
7
5
+
HO
URS
D
ose
+2
......
LV
U
1

136
Figure 20B. Subject 9. Human plasma concentration
time courses of LAAM, nor-LAAM, and dinor-LAAM follow
ing the tenth (last) dose of LAAM at 504 hr to 575 hr.

Iee
e
100
NG
/ML 113
KEY
LA AM
:=
t:,
. no
r-LA
AM
=
0
dino
r-L
AA
M
=
<>
SUB
JEC
T:
9 D
ose
:=
1
Mg
/Kg
1.
I ,
, I
, ,
, •
, ,
I ,
, ,
I
50
0 5
05
51
0 5
15
52
0 5
25
53
0 5
35
54
0 5
45
55
0 5
55
56
0 5
65
57
0
57
5
~ D
ose
fi
e
HOUR
S
~
W
-..J

138
Figure 21A. Subject 10. Human plasma concentration
time courses of LAAM, nor-LAAM, and dinor-LAAM follow
ing the first dose of LAAM at zero time to 72 hr.

Iee
e
lee
NG
/ML 10
I _
. o
5 ~
Do
se
+1
KEY
LA AM
=
I:J.
nor-
LAA
M
= 0
df
nor-
LA
AM
=
<>
~~-~
10
1
5
20
2
5
3a
3
5
40
HOUR
S
SU
BJE
CT
: 10
D
ose
=
1
Mg
/Kg
A-
----"'y"
45
5
0
55
6
0
65
7
0
75
~
Do
se
+2
I-'
W
\.0

140
Figure 21B. Subject 10. Human plasma concentration
time courses of LAAM, nor-LAAM, and dinor-LAAM follow
ing the tenth (last) dose of LAAM at 504 hr to 575 hr.

Iee
e
t00
NG
/ML 10
KEY
LAAM
=
6-
nor-
LAA
M
= 0
dl
nor-
LA
AM
=
<>
~
<>
SUB
-.JEC
T:
10
Do
se =
1
Mg
/Kg
v
1.
I I
, I
, '
I !
, •
• •
, I
I
5ee
~e5 5
te 5
15
52
e 5
25
53
e 5
35
54
e 5
45
55
e 5
55
56
e 5
65
57
e 5
75
~
Dos
e .1
0
HO
URS
~

142
Figure 22A. Subject 11. Human plasma concentration
time courses of LAAM, nor-LAAM, and dinor-LAAM follow
ing the first dose of LAAM at zero time to 72 hr.

1013
0
10
0
NG
/ML 10
KEY
LAAM
=
D.
nor-
LAA
M
= 0
di
nor-
LA
AM
=
<>
1 w
an>
A
r..'
; 5
10
1
5
Do
se it
20
2
5
30
3
5
40
HO
URS
SUB
JEC
T:
11
Do
se
=
80
M
g B
od
y
welg
hl
=
57
K
g
45
5
0
55
6
0
65
7
0
75
~
Do
se
+2
j--I
~
w

144
Figure 22B. Subject 11. Human plasma concentration
time courses of LAAM, nor-LAAM, and dinor-LAAM follow
ing the tenth (last) dose of LAAM at 504 hr to 575 hr.

Ieee
10
0
NG
/ML 10
KEY
LAAM
=
~
nor-
LA
AM
=
0
dino
r-L
AA
M
= <
>
SUB
JEC
T:
11
Do
se =
se
Mg
Bo
dy
weig
hl
=
57
K
g
... ~ -...
......
'--
1. :
:=m
e,
, 'f)
• '0
'
, ,
, '0
'
, ,
I I
5ee
50
5 5
1e
51
5
52
e 5
25
5
3e
53
5 5
40
5
45
55
0 5
55
56
0 5
65
57
0
57
5 ~
~ D
ose
.1
0
HOUR
S ~
U1

146
Figure 23A. Subject 12. Human plasma concentration
time courses of LAAM, nor-LAAM, and dinor-LAAM follow
ing the first dose of LAAM at zero time to 72 hr.

1130
13
10
0
NG/M
L 10
KEY
SUB
JEC
T:
12
Do
se
= 8
0
Mg
LAAM
=
11
nor-
LA
AM
=
0 di
nor-
LA
AM
=
0 B
ody
wei
gh
t =
61
Kg
//
,/-""
//
/"",/
/~/
~--
~~ --"
'- .... ,-
, "'-"
--'-
.
1sn
I
IT
].J
e 5
10
15
20
2
5
30
3
5
40
45
50
5
5
60
65
7
0
75
~
~ ~
~ D
ose
+1
HO
URS
Dos
e +2

148
Figure 23B. Subject 12. Human plasma concentration
time courses of LAAM, nor-LAAM, and dinor-LAAM follow
ing the tenth (last) dose of LAAM at 504 hr to 575 hr.

Ieee
1013
NG/ML~
10
KEY
LAAM
=
l:1
nor-
LA
AM
=
0
dino
r-L
AA
M =
<>
SUB
JEC
T:
12
Do
se =
80
M
g B
od
y
weig
ht
= 6
1 K
g
.A.
1.
I I
I '
, ,
, I
, '
, ,
, J
I
50
0 5
05
51
0 5
15
5
20
52
5 5
3e
53
5 5
40
54
5 5
50
55
5 5
60
56
5 5
7e
57
5
~ D
ose
i1
0
HO
URS
I-
-' .t:>
. \.
0

150
Figure 12C. Subject 1. Human plasma concentrations of
LAAM; total time course.

65
0
60
0
550
S0e
450
400
350
NG/M
L 30
0
250
20
0
150
t00
50
0 (3
+ +1
0~
~ 20
0 ~
+00 +
SUB
JEC
T:
1 D
ose
=
8
0
Mg
LA A
M
Bo
dy
w
eig
ht
= 6
2
Kg
6 =
C
on
cen
trati
on
8
hrs
p
ost
do
se
~
= D
ose
ad
min
isle
red
400
Si0
+ ~
HdUR
S 60
0 70
0 80
0 9
00
10
00
........
Ul
........

152
Figure 12D. Subject 1. Human plasma concentrations of
nor-LAAM; total time course.

(,I) L
L. -0
0)00 ~
Q)
L Q)
l: C-'"' <tN 0 (J) « CD .-...J ...... C
fl 0 0) L E
-:Lo+Jo+J -0 ..c. C 0
~ 0) OJ .. 00 .- U Q) t- Q) c: (J) UII 300 W U Q J Q) >-m (1)""0 II n :::::> 0 0 (J) Q CD <:J -E-
CS) CS) (!l LJ) N
153
CS) (S) (0
(f) 0:
CS) E => (S) 0 LJ) :::t:
..rE-
~~ "¢'
--E-CS)
~
--E-CS) (S) N
-E-
(S)--E-(S)
-E-
CS)-E-CS) (S) (S)
U') (5)

154
Figure 12E. Subject 1. Human plasma concentrations of
dinor-LA&~; total time course.

lI) (\J (\J
~
VJ o Q.
VJ L
.L -0
0)00 ~
tl> L (J)
2: C""'" <C (\J 0 en <l: <0 .--J ....., C
II 0 0) L E
-2:~~ -0 .J:.. C 0
(S.) 0) OJ .. ro .- U (l) t- Q) C (f) U U 3 0 0 W U C J (J) >-en en -0 II II ~ 0 0 (f) C CO<:] ~
-- ........ ..... - ................. -
U? (\J Q
155
Ci.;) Q C)
(S) CS) (1')
CS) CS) ........
CS) (S) tD
(J) 0::
~<5 U) :I:
...re-
~-E-..q-
-E-CS)
~
~ CS) CS) {\J
-E-
CS)-E-Q
-E-
Q-E-

156
Figure l3C. Subject 2. Human plasma concentrations of
LAAMi total time course.

6se
6ae
5se
5ee
450
400
350
NG/M
L 30
0
250
2ea
IS0
lea
50
0 0 +
+10~
+
2
00
+ +0
0 +
SU
BJE
CT
: 2
Do
se
=
80
M
g LA
AM
B
od
y
weig
ht
=
10
9
Kg
6 =
Co
ncen
trati
on
8
hrs
p
ost
do
se
t =
D
ose
ad
min
iste
red
4013
5
i0
+ +
HduRS
60
0 70
0 80
0 g
00
10
00
j-J
U1
.......
158
Figure 13D. Subject 2. Human plasma concentrations of
nor-LAAMj total time course.

..., (J) o 0..
(J) L
L -0 0) (l) ~ CO L
a> L 0) C ""'"' <t (S.) 0 C/} <:t - .--.J .., C
II 0 0) L E
N:E~"" -0 ..c. C 0
(S) 0> Q) .. 00 .- U Q)
r- ~ C tfJ UII::tO 0 w u a J Q) )0.-en W-O U lJ => 0 0 (f)oro<J~
159
CS) CS) (s;) -CS) (s;) C)
(S) CS) co
(S) CS) .......
CS) Ci) co
(f) a:
CS) -E ::> CS} 0 lJ) :I:
--E-
~--E-~
-E-CS)
~
-E-CS) CS) (\J
-E-
(S)ooE-CS)
~
CS)-E-CS) (S) (S)
LJ) (S)

160
Figure l3E. Subject 2. Human plasma concentrations of
dinor-LAAM; total time course.

LO N N
(j) UJ o
""0
......, U) o 0-
Il) L
...c -0 0) (l) ~ CO L
Il)
LC» C-+J «0 0 ({J <:( - .--1 ......, C
II 0 0) L E
N~""">"" -0 ..r. C 0
(S) 0) (j) .. CO .- U ~ I- (J) C (f} U Jl ): 0 0 W U 0 -') 0) >-en 00-0 11 II :J 0 0 (f) 0 m <J --E-
CS) l/) l/)
N CS)
161
cs:> G) 0)
Q cs;) CO
CSi) (S) ,......
cs;) (s;) co
(f) Q:
CS) -E ::> C5:) 0 IJ) :z:
-Eo-
~-E-*'q'"
-E-(S)
~
-Eo-CS) (S) N
-E-
(S)~ CS)
-E-
QooE-

162
Figure l4C. Subject 3. Human plasma concentrations of
LAAMi total time course.

65
3
60
0
550
500
450
400
350
NG/M
L 30
0
250
200
150
100
50
0 0 ~
+10~
+ 200
+ ~0
0 +
SU
BJE
CT
: 3
Do
se =
80
M
g LA
AM
B
od
y
weig
ht
= 9
4
Kg
6 =
C
on
cen
trati
on
8
hrs
p
ost
do
se
t =
D
ose
ad
min
iste
red
40
0
5~0
+ +
HOURS
60
0
70
0
800
900
t00
a I-
-' C
!"l
W

164
Figure l4D. Subject 3. Human plasma concentrations of
nor-LAAMi total time course.

53
0
459
430
3se
3ee
NG/M
L 2
5e
200
150
lee
5e
e e ~
lee
~ ~
~ 2ee
~
~00 ~
SU
BJE
CT
: 3
Do
se =
80
M
g LA
AM
Bo
dy
w
eig
ht
= 9
4
Kg
~
=
Co
ncen
trati
on
8
hrs
p
ost
do
se
t =
D
ose
ad
min
iste
red
41 ~
5~e
HOUI~S
see
700
see
gee
Ieee
.....
.. Q
)
U1

166
Figure l4E. Subject 3. Human plasma concentrations of
dinor-LAAMi total time course.

225
220
175
150
125
NG/M
L
H3e
75
50
25
e
f le
e
~ ~
+2
00
+ ~0
0 +
SU
BJE
CT
: 3
Do
se
= 8
0
Mg
LA A
M
Bo
dy
w
eig
ht
= 9
4
Kg
6 =
C
on
cen
trati
on
8
hrs
p
ost
do
se
~ =
Do
se
ad
min
iste
red
400 + +
5'10 Hd
URS
6ee
700
800
ge
0
1000
I--'
0"1
-....J

168
Figure 15C. Subject 4. Human plasma concentrations of
LAAM; total time course.

65
0
Be0
550
500
450
400
3513
NG
/HL
3013
250
200
150
100
50
0 0 +
~104
~ 20
0 ~
+00
~
SU
BJE
CT
: 4
Dos
e =
80
M
g LA
AM
Bo
dy
we
igh
t =
5
3
Kg
6
=
Co
ncen
trati
on
1
2 h
rs
po
st
do
se
~ =
D
ose
ad
min
iste
red
40
0
5~0
~ ~
BdUR
S 6
00
70
0 8
00
9
00
10
00
I-' '" 'J)

170
Figure l5D. Subject 4. Human plasma concentrations of
nor-LAAMi total time course.

see
459
400
35
0
3ee
NG/H
L 2
50
200
150
tee
50
e
~ I
I I I
'~\
I \
I \
I \
+1
0+
, 1 I I I I , I r I I I I I I , 1
\ \ \ \ \ \ \ \ \ \
+ 200
+
\ \ \ \ \ \
\ \ \ , \ \ , \
~00 +
\ \ \ \ \ \ , \ , , \ ,\
SU
BJE
CT
: 4
Dos
e =
80
M
g LA
AM
Bo
dy
weig
ht
= 5
3
Kg
6
=
Co
ncen
trati
on
1
2 h
rs
t =
Do
se
od
min
isle
red
I I I I I I I I I I I I I 41 +
5~0
HduR
S 60
0 70
0 80
0
po
st
do
se
90e
1000
.....
. ...
..)
......

172
Figure 15E. Subject 4. Human plasma concentrations of
dinor-LAAJ1; total time course.

225
2ae
175
150
_ r , \ , 1 , ,
I ,
125
L f
I ,
I ,
, 1
, (
, ,
I
lee
L I
\ f
\ 1
, I
I I
I ,
75
L f 1 I , , ,
sa
L , , , , ,
25
1\
I r
e
; +I
e~ +
20
0 +
+00 +
I I I I I I I I I I I I I
lJ I,
SU
BJE
CT
: 4
Do
se
= 8
0
Mg
LAA
M
Bo
dy
w
eig
ht
= 5
3
Kg
6
= C
on
cen
trati
on
1
2 h
rs
po
st
do
se
t =
Do
se
ad
min
iste
red
800
ge0
1000
40
0 5
i0
~ +
HdURS
60
0 70
0 t-
' ...
.,J
w

174
Figure l6C. Subject 5. Human plasma concentrations of
LAAM; total time course.

Q) (J) o
-0
~
tJ)
o Q..
(/) L
L -0
N (1) 0>- L ~ a>
L C~ <t ...... 0 ({J <{ «) .--.J -+J C
11 0 0> L E
If) l: -+J -+J ""'0 Leo
(S) 0) Q,I "CO'- U (l)
!-- Q) C (j) U II 3 0 0 w u Ci J !l) >-CO (j) -0 II II ::J 0 0 (f) Ci aJ <J ~
('i) l.f) N
175

176
Figure 16D. Subject 5. Human plasma concentrations of
nor-LAAMi total time course.

53
0
450
40e
350
300
NG/M
L 25
0
200
150
10e
S0 e
4 ~I
e+ +
2ee +
~ee +
SU
BJE
CT
: 5
Do
se
= 8
0
Mg
LAA
M
Bo
dy
w
eig
ht
=
61
Kg
6 =
C
on
cen
trati
on
1
2 h
rs
po
st
do
se
t =
Do
se
ad
min
iste
red
4ee
+ 5+e
+
HO
URS
B0e
70
3 se
e ge
e 10
00
I-'
-...J
-...J

178
Figure 16E. Subject 5. Human plasma concentrations of
dinor-LAAMi total time course.

....., 01 o Q.
01 L
...c -0
N Q) 0)- L ~ <D
:E C~ <t..- 0 (J) <l: <0 .--.J ~ C
II 0 0) L E
lJ) ::E ~ ~ -0 ..c C 0
Ci) 0) Q) •. CO .- U <D }- IV C (J) U H 3 0 0 W U 0 J (l) > m (J)(J II 11 ::,:) 0 0 (J) C CCl <J ~
I , I
I I
t I
I I
.... ......
179
CS) Ci) C',)
Ci) (S) CO
Ci) (S) ,......
CS) (S) CO
(J) ~
(S) 1lIIIE :::J (S) 0 lJ) ::c
-Eo-
~-E-""""
-E-CS)
~
-Eo-CS) (S) (\J
......... -E-
Q-orE-CS)
-orE-
CS)--E-
lJ) (\J CS)

180
Figure 17C. Subject 6. Human plasma concentrations of
LAAMi total time course.

65
0
600
550
500
450
40
0
350
NG/H
L 3
00
250
20
0
150
, , " 10
0 I
50
(3
(3 ~
t00
20
0 te
0 ~
~ 4
+ 'l\
~
, ,
SUB
JEC
T:
6 D
ose
= 1
Mg/
Kg
LAAM
~
=
Co
ncen
trati
on
1
2 h
rs
po
st
do
se
t =
D
ose
ad
min
iste
red
, , , , 4~
+ 5~0
Hd
~RS
600
700
80
e
90
0
100e
I-
-' 0
0
I--'

182
Figure 17D. Subject 6. Human plasma concentrations of
nor-LAJL~; total time course.

183
Q) (S)
Ui Q
0 (S)
-0
oo+J Ui (S)
0 Q
0-0)
Ui L Q ..r.. (S)
-0 co N G)
2:- L « aJ « C ......., (S)
-I 0 t.n Q I'-
O)~ C ~ 0
" t. E Q
CO O)~ -0 (S)
~ C 0 co aJ
.. - 0 aJ (J) t- C fJ) Q! U Ii 0 0 ~5 w u a 1.1) :I: """') Q) co (J) II II -Eo-.::J 0 (j) a <J --E- ~-E-
oq-
--E-(S)
~
-E-Q (S) C\I
-Eo-
Q-E-Q
--E-
0-E--J
Q Q (S) (S) (S) ::I:(S) (S) Q Q 0 lI) 0 lI) ($.) '-11) Q If) Q (S;) LJ) "'It' "'It' ('r) ('r) C!>N N Lf) (S)
z

184
Figure l7E. Subject 6. Human plasma concentrations of
dinor-LAAM; total time course.

225
230
17
5
150
12
5
NG/H
L
tee
75
50
25
o o ~
+10~
+ 2
00
+
~00 +
400 ~
SUB
JEC
T:
6 D
ose
= 1
Mg/
Kg
LAAM
6
= C
on
cen
trati
on
1
2 h
rs
po
st
t =
Do
se
ad
min
isle
red
5~0
+ HdU
RS
60e
700
8e0
900
le0
e
~
00
t.
n

186
Figure laC. Subject 7. Human plasma concentrations of
LAAJ1; total time course.

(£) (.D 0
-0 ......,
(0 0 0-
(0 L.
.r:. -0
('\J Q)
e- t-o (£) o C ...,.,
-.J 0 fh
0)-.) C ~ 0 ........ '- e
f'.. O)~ -0 l: C 0
(£) .. - 0 <I) t- C (0 uno 0 W U 0 -, Q) co U) II n ~ 0 (f)Q<l~
\ \ \ \ \ \
... ....... ... ... ... .... ......
('5) lI) N
...... ... ... ..............
187

188
Figure l8D. Subject 7. Human plasma concentrations of
nor-LAAMi total time course.

500
453
400
3se
300
NG/M
L 2
50
200
15
0
100
so
e
~
, , , , , ,
+Hl~
+2
e0 +
", ,
", ,
I I
I I
I
~ee +
I I
I I
I , I , 4e+
+ 5~e
HO
URS
SUBJ
ECT:
7
Do
se =
1
Mg/
Kg
Loa
m
6 =
Concen~ro~lon
12 h
rs po
s~
do
se
~ =
Do
se od
mJnl
s~er
ed
eoe
7ee
soo
900
1000
I-'
00
\.
0

190
Figure l8E. Subject 7. Human plasma concentrations of
dinor-LruL~; total time course.

191
(l,l (S) en (S)
0 (S.)
-0 .......,
(J] CS) 0 cs;)
Q.. 0)
(J]
L ...c (S)
-0 (S)
N a> CO
:L- L « Q)
« c ......, (S)
-.J 0 U) (S) .......
0)......., C ~ 0
" L E
'" 0) ~ -0 (S)
:L C 0 (S)
(J) CO
.. - U Q)
t- C (f) (f)
U II 0 0 ~ (S) -E :::::>
W U Cl <S> 0 -:) Q) lJ) :x: ro (J) U II -E-::) 0 (f) Cl <J ...:E- (S)-Eo-
" \ (S) '\ "t'
\ '\ \
\ -E-'\
CS)
~
-E-CS) (S) (\J
-E-
(S)-E-C'li)
-Eo-
CS)-E-Lf) CS) If) CS) If) CS) (\I (.'\) r.... lI) N cs:> Lf) (S) If) C\I C\J r.... U) C\J CS)

192
Figure 19C. Subject 8. Human plasma concentrations of
LAAM; total time course.

650
600
550
50
0
450
40
0
350
NG/H
L 3
00
25
0
20
0
150
t00
50
0 0 t
+ 10~ +
20
0 +
+00 +
SUB
JEC
T:
8 D
ose
=
1
Mg
/Kg
LA
AM
6
= C
on
cen
trati
on
1
2 h
rs
po
st
do
se
t =
Do
se
ad
min
iste
red
4~ +
5+0
600
700
S0e
90
0
l00
0
HOUR
S I--
-' \D
W

194
Figure 19D. Subject 8. Human plasma concentrations of
nor-LAAM; total time course.

see
450
4ee
35e
3ee
NG/Hl
""' .
.. "
25
0
i./r
~~~~
2e
e
150
100
50
o
+ +1
0~
+ 2
00 +
~00 +
SUB
0EC
T:
8 D
ose
=
1 M
g/K
g LA
AM
6 =
C
on
cen
trati
on
1
2 h
rs
po
st
do
se
~
= D
ose
ad
min
iste
red
41 +
5 10
HOUR
S
60
0
70
0
80e
90
0
10
00
t--'
\.0
11
1

196
Figure 19E. Subject 8. Human plasma concentrations of
dinor-LAAM; total time course.

¢'I CI) o
'"'0 ....
to o 0-
'" c.. ..r:. "'0
(\J <i> e- c.. o <i> OC ....
....J 0 to CI;)......, C ~O, c.. e
co CI;)......, "'0 ~CO
cP •• - 0 (,?
..... C to U II 0 0 W UQ J G) CD (I) II U :::> 0 C/) 0<J-E---------
LI) N C\J
('S) lt)
lJ) N
, " , , , , , , , , ,
Lf) ,...... (S) lJ) lJ) (\J (S)
197
('S) (S) 0)
(S) (S) 0)
(S) CS) ,.....
CS) (S) CO
C/) ~
~5 l/) :r:
...:e-
~...:e-"¢"
"'IIIiE-(S)
~
...e-CS) (S) (\J
...e-
(S)-E-(S)
~
('S)-E-

198
Figure 20C. Subject 9. Human plasma concentrations of
LAAM; total time course.

......, (J)
o Q..
(f) L
L
N ~<t <t C ..J 0
...., (f)
0)......, C ~ 0 "L E (J) 0) .,..J -0 ~ C 0
CJ •• - (J ~ t- C (f) U II 0 0 W U Q ~ Q) m (/) 11 n :::> 0 (f) 0 <J ....:E-
CS) If) N
(S) (Sj N
199
<.'S) CS) CJ)
<.'S) ,(S) Q:)
<.'S) CS) 1'00
<.'S) <S) <0
(f) c:t:
~~ lJ) J:
~
~-E-• r • V I I ,
I -E-I I (S)
" ~ " \
'\ '\ -E-'\
\ <S) '\
'\ CS) '\ (\J
-E-
(S)-E-CS) -~

200
Figure 20D. Subject 9. Human plasma concentrations of
nor-LAAM; total time course.

see
450
4ee
350
3e0
NG/H
L 25
0
20e
150
t0e
50
o
+ +
10~ +
20
0 +
~00 +
SUB
JEC
T:
9 D
ose
=
t
Mg
/Kg
LA
AM
~
= C
on
cen
lrati
on
1
2 h
rs
po
st
do
se
t =
Do
se
ad
min
iste
red
400
5i0
~ +
HdURS
60
0 70
0 80
0 90
0 10
00
tv
o r-'

202
Figure 20E. Subject 9. Human plasma concentrations of
dinor-LAAM; total time course.

225
230
175
150
125
NG/H
L le
e
75
50
25
o
+ +10
+ +
200 +
+00 +
SUB
JEC
T:
9 D
ose
=
1
Mg
/Kg
LA
AM
6
= C
on
cen
trati
on
1
2 h
rs
po
st
do
se
~
= D
ose
ad
min
iste
red
400
sqa
+ +
H~URS
600
700
800
900
1000
N
o w

204
Figure 2lC. Subject 10. Human plasma concentrations of
LAAM; total time course.

650
60
0
550
500
450
400
350
NG/M
L 30
0
250
200
t50
100
50
0
f +10
+ +
200 +
~00 +
SUB
JEC
T:
10
Do
se
=
1 M
g/K
g LA
AM
L
=
C
on
cen
trati
on
1
2 h
rs
po
st
do
se
~ =
Do
se
ad
min
iste
red
4~ +
:l:RS
600
700
800
ge0
1000
tv
o U1

206
Figure 2lD. Subject 10. Human plasma concentrations of
nor-LAAM; total time course.

530
4se
400
3S0
30
0
NG/M
L 25
0
200
IS0
t0e
50
o
+ ~1
0~ ~ 2
00 +
~00 +
SUB
.JEC
T=
10
Do
se
= 1
M
g/K
g LA
AM
6
=
Co
ncen
trati
on
1
2 h
rs
po
st
do
se
t =
Do
se
ad
min
iste
red
400
s'le
~ +
HduRS
60
0 70
0 80
0 90
0 10
0e
I\.)
o ....,J

208
Figure 21E. Subject 10. Human plasma concentrations of
dinor-LAAM; total time course.

225
2ee
175
150
125
1'30
75
50
25
e
~ ~Ie+
~ 2ee
~
~ee ~
SU
BJE
CT
: 10
D
ose
= 1
Mg/
Kg
LAAM
6
= C
on
cen
lrali
on
1
2 h
rs
po
sl
do
se
t =
Do
se
ad
min
isle
red
400
500
~ ~
H~URS
600
7e0
80
0
900
1000
I:
\.)
o \..0

210
Figure 22C. Subject 11. Human plasma concentrations of
LAAM; total time course.

211
CS)
Q) (S)
w CS)
0 -0 ...., (.'S)
w CS)
0 m Q.
In (S) L CS)
.J: (X)
-0 N (1)
0)- L ~ Q) CS)
L: C -a.J (S)
«('-. 0 en ,.......
« If) .---1 ...., C
l! 0 CS) - 0) L E (S)
-:E-a.J-a.J V (0
.J: C 0 (S) 0) Q) (f)
.. 00 .- U (J.) ~
1- cl) C en (S)--E-=:J U 11 3- 0 0
., ~ 0 ,;- lJ) :::t:
W U Q , ,
-; (1) >-,
--E-, , en IJ) -0 11 II , => 0 0
, CS)-E-
(f)QQ:)<J CS) v
-E-(S)
~ , I I -E-I I CS) ,
(S) r N
-E-
CS)--E-(S)
-Eo-
....J CS)--E-
CS) CS) CS) CS) (S) CS) cs)::I:cs) (S) CS) (S) (S) If) (S.) If) CS) If) CS) I.J)'CS) I.J) CS) If) (S) (S) (0 (0 lJ) Lf) v v ('I"')(!)('I"') C\J C\J lJ) CS)
Z

212
Figure 22D. Subject 11. Human plasma concentrations of
nor-LAAMi total time course.

52
0
453
430
3S0
30e
NG/H
L 25
0
200
t50
tee
50
o
+ +1
0~ +
200 +
~e0 +
SUB
JEC
T:
It
Do
se
= 8
0
Mg
LAA
M
Bo
dy
w
eig
ht
= 5
7
Kg
6 =
Co
ncen
trati
on
1
2 h
rs
po
st
do
se
t =
D
ose
ad
min
iste
red
41 5~0
+ Hdu
RS
600
700
80
0
ge0
t000
tv
,....
.., w

214
Figure 22E. Subject 11. Human plasma concentrations of
dinor-LAAM; total time course.

225
230
175
150
125
NG/H
L 10
0
75
50
25
o
+ ~1
0~ ~ 2
00 ~
~00 ~
SUB
JEC
T:
t 1
Do
se =
80
M
g LA
AM
Bo
dy
weig
ht
= 5
7
Kg
6
=
Co
ncen
trali
on
1
2 h
rs p
ost
do
se
~
=
Do
se ad
min
iste
red
400
5'10
~ ~
HJUR
S 60
0 70
0 80
0 g
e0
10
00
tv
I--'
U1

216
Figure 23C. Subject 12. Human plasma concentrations of
LAAM; total time course.

65
e
6~0
550
500
450
40
0
350
NG/M
L 3
00
25
0
20
0
150
100
50
0 B
~ ~0
0 +
t00
~ ~
+2
00
+
, f , , I , , , , , I , , , , I , , , I , , , , , I , , , I I , I 4+ +
5+0
HOUR
S
SUB
JEC
T:
12
Dos
e =
80
M
g LA
AM
Bod
y w
eig
hl
=
61
Kg
6 =
C
on
cen
lrali
on
12
h
rs p
ost
do
se
t =
Do
se
ad
min
isle
red
600
700
800
90
0
10
00
tv
I--
-' -...
.J

218
Figure 23D. Subject 12. Human plasma concentrations of
nor-LAAM; total time course.

se0
450
430
350
330
NG/M
L 25
0
200
t50
10e
50
e
+ +10
+ +
200 +
~00 +
SU
BJE
CT
: 12
D
ose
=
80
M
g LA
AM
B
od
y
weig
hl
= 6
1 K
g 6
= C
on
cen
trati
on
1
2 h
rs
po
st
do
se
t =
Do
se ad
min
iste
red
I I I I I I I I I
400
50
0
+ +
H~URS
600
700
800
gee
10
00
tv
t-'
1..0

220
Figure 23E. Subject 12. Human plasma concentrations of
dinor-LAAM; total time course.

U') (\J C\I
OJ (J) o
-0 .....,J
(I) o a. en L
-C -0
N (J.) 0)- L ~ Q)
',E C.....,J <- 0 (J) <<0---l .....,J C
II 0 N 0> L. E -',E.....,J......, -0
-C C 0 (S) 0) Q)
··00·- 0 (J.) to- (1)C (I) U II 3 0 0 W U 0 "J Q) >-en (J) -0 11 II ::;:) 0 0 (j') a co <l .....:E-
--- - .........
(S) If)
... _- .......... --- ................ -.... -
lJ) N CS)
221
('Ii) (S) 0)
(S) CS) 0)
(S) ('Ii) r-..
(S) (S) <0
(/) 0::
CS) E ::::> (S) 0 IJ) :J::
-E-
~~ ~
~ CS)
~
-E-CS) CS) (\f
--E-
(5)--E-CS)
-E-
CS)...e-

Figure 24. Comparison of mean concentration-time
courses.
A. Following first dose: Subjects 6, 7, and 8.
B. Following last dose: Subjects 6, 7, and 8.
C. Following first dose: Subjects 9 and 10.
D. Following last dose: Subjects 9 and 10.
E. Following first dose: Subjects 2 and 4.
F. Following last dose: Subjects 2 and 4.
Black:
Red:
Blue:
LAAM
Nor-LAAM
Dinor-LAAM
222

10
00
1
00
0
1000
100
1°°1
100
NG
N
G
NG
ML'
- M
L
ML
,.
........
1°1
10
10 I'
HO
UR
S A
H
OU
RS
C
HO
UR
S
E
I-P
i i
i i
i i
i I
0 2
0
40
6
0
80
0
20
4
0
60
8
0
0 2
0
40
6
0
80
1000~
1000
-:1
10
00
IOO~1
.... 10
0-::1
.--~
loo~r ~
NGJ
NG
~
NG
--
-_f
l M
L M
L M
L 10
10
10
B
0
II. F
I P
i I
HO
UR
S
HO
UR
S H
OU
RS
i
i i
i i
i I
J I
i i
I ,
I tv
tv
50
4 5
24
54
4 5
64
58
4
50
4 5
24
54
4 5
64
58
4
50
4
52
4 5
44
56
4 5
84
w

APPENDIX
Table Page
1 COMPARATIVE EFFICIENCY OF METABOLITE-AMIDE DERIVATIVE FORMATION WITHOUT DEGRADATION OF LAAM. . .. ... 226
2 RECOVERY EFFICIENCY FOR LAAM AND METABOLITES UNDER VARIOUS CONDITIONS OF SOLVENT EVAPORATION . . . . . . . 227
3 GC-CHEMICAL IONIZATION-MS: LAAM, NOR-LAAM AND DINOR-LAAM PROTONATED MOLECULES AS A PERCENTAGE OF THEIR BASE PEAKS USING VARIOUS REAGENT GASES. . . . 228
4 MONKEY PLASMA CONCENTRATIONS OF LAAM AND HETABOLITES FOLLOWING SINGLE ORAL 2 mg/kg DOSE OF LAAM AT ZERO TIME. . .. 229
5 HUMAN STUDY: INDIVIDUAL DOSE OF LAAM AND BODY WEIGHT FOR EACH SUBJECT . . . . .. 230
6 TIMES OF DOSE ADMINISTRATION HOURS INTO STUDY. . . . . . . . . . . . . . . . . . 231
7 SUBJECT 001: HUMAN PLASMA CONCENTRATION OF LAAM AND METABOLITES OVER A 42-DAY PERIOD FOLLOWING REPETITIVE ORAL DOSES OF 80 mg LAAM. . . . . . . . . . . . .. 23 2
8 SUBJECT 002: HUMAN PLASMA CONCENTRATION OF LAAM AND METABOLITES OVER A 42-DAY PERIOD FOLLOWING REPETITIVE ORAL DOSES OF 80 mg LAAM. . . . . • . . . . . . .. 234
9 SUBJECT 003: HUMAN PLASMA CONCENTRATION OF LAAM AND METABOLITES OVER A 42-DAY PERIOD FOLLOWING REPETITIVE ORAL DOSES OF 8 0 mg LAAM. . . . . . . . . . . . .. 2 3 6
10 SUBJECT 004: HUMAN PLASMA CONCENTRATION OF LAAM AND METABOLITES OVER A 42-DAY PERIOD FOLLOWING REPETITIVE ORAL DOSES OF 80 mg LAAM. . . . . . . . . • . . .. 238

Table
11 SUBJECT 005: HUMAN PLASMA CONCENTRATION OF LAAM AND fvlETABOLITES OVER A 42-DAY PERIOD FOLLOWING REPETITIVE ORAL DOSES
225
Page
OF 8 a mg LAA..M. . . . . . . . . . . . .. 241
12 SUBJECT 006: HUMAN PLASMA CONCENTRATION OF LAAM AND METABOLITES OVER A 42-DAY PERIOD FOLLOWING REPETITIVE ORAL DOSES OF 73 mg LAAM. . . . • . . . . . . . •. 244
13 SUBJECT 007: HUMAN PLASMA CONCENTRATION OF LAAM AND METABOLITES OVER A 42-DAY PERIOD FOLLONING REPETITIVE ORAL DOSES OF 89 mg LAAM. . . . .. • .. .. • • . . . . 247
14 SUBJECT 008: HUMAN PLASMA CONCENTRATION OF LAAM AND !-1ETABOLITES OVER A 42-DAY PERIOD FOLLOWING REPETITIVE ORAL DOSES OF 75 mg LAAM. . . . .. . . . . . .. .. .. 250
15 SUBJECT 009: HU~Vlli PLASMA CONCENTRATION OF LAJU1 AND METABOLITES OVER A 42-DAY PERIOD FOLLOWING REPETITIVE ORAL DOSES OF 82 MG LAAM. . . . . .. .. .. • . .. . ... 253
16 SUBJECT 010: HUMAN PLASMA CONCENTRATION OF LAAM AND METABOLITES OVER A 42-DAY PERIOD FOLLOWING REPETITIVE ORAL DOSES OF 80 mg LAA..~. . . . . . . . . .. . . .. 256
17 SUBJECT 011: HUMAN PLASMA CONCENTRATION OF LAAM AND METABOLITES OVER A 42-DAY PERIOD FOLLONING REPETITIVE ORAL DOSES OF 80 mg LAA..T>.1. • . . . . . . . • . . . . 259
18 SUBJECT 012: HUMM~ PLASMA CONCENTRATION OF LAAM AND METABOLITES OVER A 42-DAY PERIOD FOLLOWING REPETITIVE ORAL DOSES OF 80 mg LAAM. . . • • • • . • 262
19 PLASMA HALF-LIVES IN HOURS FOR LAAM AND METABOLITES. • .. . . . . . . . 265

LAA
M
din
or-
LA
AM
no
r-A
mid
e
TA
BL
E
1
CO
MPA
RA
TIV
E
EF
FIC
IEN
CY
O
F M
ET
AB
OL
ITE
-AM
IDE
D
ER
IVA
TIV
E
FOR
MA
TIO
N
WIT
HO
UT
D
EG
RA
DA
TIO
N
OF
LAA
M
25
°C
-3
0
Min
7
0°C
-
70
°C
-2
5°C
-
25
°C
-7
0°C
-
50
°C
-3
0
Min
3
0
Min
1
0
Min
3
0
Min
1
0
Min
1
0
Min
H
C1
NaO
H
NaO
H
NaO
H
NaO
H
NaO
H
100%
32
%
90%
90
%
90%
85
%
0%
100%
>9
0%
>90%
>9
0%
>90%
0%
100%
50
%
65%
70
%
70%
NO
TE
: 5
.0
N N
aOH
u
sed
at
pH
13
.
50
°C
-3
0
Min
N
aOH
53%
90%
70%
N
N
0'\

LAA
M
TA
BL
E
2
REC
OV
ERY
E
FF
ICIE
NC
Y
FOR
LA
AM
A
ND
M
ET
AB
OL
ITE
S U
ND
ER
VA
RIO
US
CO
ND
ITIO
NS
O
F SO
LV
EN
T
EV
APO
RA
TIO
N
50
ng
LA
AM
D
o A
dd
ed
to B
ott
om
of
Ev
ap
ora
tio
n
Tu
be
100%
50
n
g
LAA
M
Do
Ad
ded
to
1
0
ml
Ch
loro
form
55%
50
ng
LA
AM
D
o A
dd
ed
to
10
m
l C
hlo
rofo
rm D
ried
w
ith
A
dd
itio
n o
f 2
00
cc/m
in o
f F
ilte
red
A
ir
>90%
NO
TE
: A
ll
ev
ap
ora
tio
ns w
ere
p
erf
orm
ed
in
a
70
°C w
ate
r b
ath
.
Reco
veri
es
were
dete
rmin
ed
b
y ad
din
g
50
ng
o
f LA
AM
D
3 to
th
e d
ry resi
du
es,
a rati
o o
f LA
AM
D
o/L
AA
M
D3
= 1
.0 =
10
0%
.
l\J
l\J
-....
j

228
TABLE 3
GC-CHEMICAL IONIZATION-MS: LAAM, NOR-LAAM AND DINOR-LAAM PROTONATED MOLECULES AS A PERCENTAGE OF THEIR BASE
PEAKS USING VARIOUS REAGENT GASES
Methane
LAAM <1
nor-LAAM (amide) <2
dinor-LAAM (amide) <1
Isobutane
1
18
17
Ammonia-Methane
100
30
30

229
TABLE 4
MONKEY PLASMA CONCENTRATIONS OF LAAM AND METABOLITES FOLLOWING SINGLE ORAL 2 mg/kg DOSE
Monkey Number
6719
6733
- - - - -
6751
-
- - - - - -
6775
OF LAAM AT ZERO TIME
Sample Time (Hours)
- -
- -
zero 2 4 6
11 24
zero 2 4 6
11 24
zero 2 4 6
11 24
zero 4 6
11 24
- - - -
- - - -
- -
- -
Concentration in ng/m1
LAAM nor-LAAM dinor-LAAM
0 0 0 11 28 15
7 11 11 0 5 7 0 1 3 0 0 0
- - - ------
0 0 0 8 6 5 8 8 7 8 7 8 0 2 4 0 2 3
- - - - -- - - - - - - - -
0 0 0 3 7 15 1 2 7 0 1 4 0 0 2 0 0 1
- - - - - - - - - - - -0 0 0 0 3 3 0 2 2 0 1 2 0 0 0

230
TABLE 5
HUMAN STUDY: INDIVIDUAL DOSE OF LAAM AND BODY WEIGHT FOR EACH SUBJECT
Subject Dose (rng/kg) Body Wt (kg) Dose (rng)
002 0.73 109 80
003 0.85 94 80
006 1.00 73 73
007- 1.00 89 89
008 1.00 75 75
009 1.00 82 82
010 1.00 80 80
001 1.29 62 80
012 1.31 61 80
005 1.39 61 80
011 1.40 57 80
004 1.51 53 80

231
TABLE 6
TIMES OF DOSE ADMINISTRATION HOURS INTO STUDY
Dose Subject No.
No. 1 2 3 4 5 6
1 0.08 0.89 0.25 0.03 0.08 0.08
2 72 72.08* 72.18 72.12 72.17 72.17
3 120 120.08 120.25 120.12 120.17 120.17
4 168 168.08 168.25 168 168.08 168.17
5 240 240.08 240.25 240* 240* 240*
6 287.83 288.08 288.42 288* 288* 288.08*
7 335.92 336 336.42 336* 336* 336*
8 408* 408* 408* 408.08 408.10 408.17
9 455.92 456 456.25 456* 456* 456*
10 503.92 504 504.25 405.03 504.25 405.17
Dose Subject No.
No. 7 8 9 10 11 11
1 0.08 0.08 0.08 0.08 0.25 0.08
2 72.17 72.17 72.17 72.08 72.08 72.08
3 120.17 120.17 120.17 120.25 120.08 120.08
4 168.17 168.17 168.25 168.25 168.08 168.08
5 240* 240* 240* 240* 240* 240*
6 288.17 288.17 288.33 288.08 288.08 288.08
7 336* 336* 336* 336* 336* 336*
8 408.17 408.33 408.08 408.08 408* 408*
9 456* 456* 456* 456 456* 456*
10 504.17 504.24 504.25 405.08 504.08 504.08
*Approximate time.

232
TABLE 7
SUBJECT 001: HUMAN PLASMA CONCENTRATION OF LAAM AND METABOLITES OVER A 42-DAY PERIOD FOLLOWING
REPETITIVE ORAL DOSES OF 80 mg LAAM
--Specimen Hour(s) Hour (s) Concentration in ng/ml
No. Into Study Post Dose LAAM Nor-LAAM Dinor-LAAM
1 0 0 0 0 0
2 2 +1*
2 46 40 0
3 4 4 52 50 20
4 5 5 51 64 28
5 6 6 54 65 25
6 7 7 46 60 28
7 8 8 4E 66 30
8 10 10 29 58 32
9 12 12 23 49 17
10 16 16 21 46 32
11 24 24 13 29 24
12 48 48 9 18 32
13 72 72/0 9 10 29
14 78 +2*
6 58 74 40
15 80 8 39 68 50
16 120 +3*
48/0 23 34 55
17 126 6 88 112 89
18 128 8 68 112 162
19 168 48/0 31 41 70
20 174 +4*
6 88 115 1-3
21 176 8 84 132 130
22 240 72/0 16 36 77
23 246 + 5*
6 88 122 64
24 248 8 71 116 115
25 288 48/0 33 49 100 +6*
26 294 6 92 122 113

233
TABLE 7 (continued)
Specimen Hour(s) Hour(s) Concentration in ng/ml No. Into Study Post Dose LAAM Nor-LAAM Dinor-LAAM
27 296 6 92 122 113
28 336 48/0
29 342 +7*
6 94 109 73
30 344 8 155 95 118
31 408 72/0 56 15 75
3] 414 +8*
6 72 93 84
33 416 8 75 90 85
34 456 48/0 69 42
35 462 +9*
6 91 95 102
36 464 8 79 102 40
36 464 8 79 102 40
37 504 48/0 30 33 70
38 506 +10*
2 140 96 86
39 508 4 110 107 83
40 509 5 94 92 89
41 510 6 75 96 88
52 511 7 79 105 101
43 512 8
44 514 10 54 79 86
45 516 12 25 71 79
46 520 16 29 61 80
47 528 24 37 52 71
48 552 48 29 32 72
49 576 72 27 25 31
*Indicates time of dose. See Table 6.

234
TABLE 8
SUBJECT 002: HUMAN PLASMA CONCENTRATION OF LAAM AND METABOLITES OVER A 42-DAY PERIOD FOLLOWING
REPETITIVE ORAL DOSES OF 80 rng LAAM
Specimen Hour(s) Hour(s) Concentration in ng/m1 No. Into Study Post Dose LAAM Nor-LAAM Dinor-LAAM
1 0 +1* 0 0 0 0
2 2 2 72 83 16
3 4 4 67 III 20
4 5 5 72 69 21
5 6 6 62 72 22
6 7 7 55 72 23
7 8 8 50 72 23
8 10 10 39 62 24
9 12 12 37 67 42
10 16 16 38 65 26
11 24 24 32 67 33
12 48 38 21 83 31
13 72 +2* 72/0 37 32
14 78 6 34 205 76
15 80 8 54 105 41
16 120 +3* 48/0 20 53 43
17 126 6 90 117 54
18 128 8 67 100 56
19 168 +4* 48/0 27 60 51
20 174 6 84 105 59
21 176 8 66 117 58
22 240 +5* 72/0 14 35 44
23 246 6 76 107 56
24 248 8 76 50 76
25 288 +6* 48/0 26 77 76
26 294 6 106 182 94

235
TABLE 8 (continued)
Specimen Hour{s) Hour (s) Concentration in ng/m1 No. Into Study Post Dose LAAM Nor-LAAM Dinor-LAAM
27 296 8 76 155 94
28 336 +7* 48/0 26 72 70
29 342 6 33 138 182
30 344 8 68 125 76
31 408 +8* 72/0 21 19 70
32 414 6 125 170 112
33 416 8 92 32 44
34 456 +9* 48/0 28 80 70
35 462 6 120 147 64
36 464 8 96 155 88
37 504 +10* 48/0 43 100 88
38 506 2 76 98 76
39 508 4 100 182 88
40 509 5 82 76 53
41 510 6
42 511 7 115 165 88
43 512 8 100 133 76
44 514 10 77 133 76
45 516 12 77 129 70
46 520 16 54 50 76
47 528 24 45 133 76
48 552 48 34 94 64
59 576 72 30 76 76
*Indicates time of dose. See Table 6.

236
TABLE 9
SUBJECT 003: HUMAN PLASMA CONCENTRATION OF LAAM AND METABOLITES OVER A 42-DAY PERIOD FOLLOWING
REPETITIVE ORAL DOSES OF 80 mg LAAM
Specimen Hour(s) Hour (s) Concentration in ng/ml No. Into Study Post Dose LAAM Nor-LAAM Dinor-LAAM
1 0 +-1 *
0 0 0 0
2 2 2 54 38 13
3 4 4 68 50 16
4 5 5 55 58 16
5 6 6 55 65 20
6 7 7 47 65 20
7 8 8 47 65 21
8 10 10 39 56 20
9 12 12 31 56 22
10 16 16 21 47 21
11 24 24 15 43 20
12 48 48 8 26 23
13 72 +-2*
72/0 7 16 13
14 78 6 73 55 28
15 80 8 55 52 22
16 120 +-3*
48/0 34 50 49
17 126 6 103 100 54
18 128 8 77 102 49
19 168 +-4*
48/0 40 56 52
20 174 6 103 92 69
21 176 8 80 92 57
22 240 +- 5*
72/0 27 41 31
23 246 6 85 88 67
24 248 8 80 95 68
24 248 8 80 95 68
25 288 +-6*
48/0
26 294 6 97 105 68

237
TABLE 9 (continued
Specimen Hour(s) Hour(s) Concentration in ng/ml No. Into Study Post Dose LAAM Nor-LAAM Dinor-LAAM
27 296 8 85 105 75
28 336 -,:-7* 48/0 27 45 47
29 342 6 86 84 64
30 344 8 66 84 66
31 408 -,:-8* 72/0 22 37 62
32 414 6 95 89 76
33 416 8 95 116 100
34 456 -':-9* 48/0 23 44 66
35 462 6 106 100 108
36 464 8 84 89 71
37 504 -,:-10* 48/0 27 57 71
38 506 2 160 116 90
39 508 4 142 128 85
40 509 5 134 120 76
41 510 6 120 120 76
42 511 7 103 112 76
43 512 8 97 116 85
44 514 10 79 104 76
45 516 12 74 104 76
46 520 16 57 112 90
47 528 24 42 92 80
48 552 48 24 58 62
49 576 72 22 45 66
*Indicates time of dose. See Table 6.

238
TABLE 10
SUBJECT 004: HUMAN PLASMA CONCENTRATION OF LAAM AND METABOLITES OVER A 42-DAY PERIOD FOLLOWING
REPETITIVE ORAL DOSES OF 80 mg LAAM
Specimen Hour(s} Hour(s) Concentration in ng/ml No. Into Study Post Dose LAAM Nor-LAAM Dinor-LAAM
1 0 +1* 0 0 0 0
2 0.25 0.25 0 0 0
3 0.5 0.5 24 0 0
4 1 1 58 -62 0
5 1.5 1.5 151 85 2
6 2 2 145 109 0
7 4 4 144 105 0
8 6 6 119 136 0
9 12 12 66 162 24
10 16 16 52 135 0
11 24 24 47 134 8
12 48 48 32 101 31
13 72 +2* 72/0 22 50 10
14 72.25 0.25 28 76 8
15 72.5 0.5 46 76 8
16 73 1 III 115 8
17 73.5 1.5 140 134 7
18 74 2 194 161 10
19 76 4 176 209 5
20 78 6 151 229 18
21 84 12 104 255 23
22 88 16 79 180 15
23 96 24 80 150 32
24 120 + 3* 48/0 26 125 21
25 120.25 0.25 36 128 18
26 120.5 0.5 44 128 19

239
TABLE 10 (continued)
Specimen Hour(s) Hour(s) Concentration in ng/ml No. Into Study Post Dose LAAM Nor-LAAM Dinor-LAAM
27 121 1 98 153 21
28 121.5 1.5 153 222 41
29 122 2 139 173 34
30 124 4 144 183
31 126 6 145 247 33
32 132 12 83 184 158
33 136 16 82 222 71
34 144 +-4* 24 58 250 28
35 168 48/0 51 339 69
36 169 1 65 227 169
37 180 12 123 509 48
38 192 24 70 406 51
39 216 +- 5* 48 47 221 81
40 288 +- 6* 48/0 55 200 73
41 289 1 46 200 32
42 300 12 153 334 63
43 312 +-7* 24 88 244 60
44 408 +-8* 72/0
45 409 1
46 420 12 190 79 81
47 432 +-9* 24 153 294 76
48 504 +-10* 48/0 97 221 146
49 504.25 0.25 214 209 190
50 504.5 0.5 109 217 161
51 505 1 172 223 154
52 505.5 1.5 277 373 156
53 506 2 311 101 61
54 508 4
55 510 6 323 288 148

240
TABLE 10 (continued)
Specimen Hour(s) Hour(s} Concentration in ng/ml No. Into Study Post Dose LAAM Nor-LAAM Dinor-LAAM
56 516 12 242 297 158
57 520 16 191 286 175
58 528 24 155 298 153
59 552 48 101 226 137
60 576 72 77 298 154
61 672 168 8 35 71
62 744 240 16 24 41
63 840 336 4 12 19
64 912 408 1 4 6
65 1008 504 0 4 1
*Indicates time of dose. See Table 6.

241
TABLE 11
SUBJECT 005: HUMAN PLASMA CONCENTRATION OF LA.Al1 AND METABOLITES OVER A 42-DAY PERIOD FOLLOWING
REPETITIVE ORAL DOSES OF 80 mg LAAM
Specimen Hour(s) Hour (s) Concentration in ng/m1 No. Into Study Post Dose LAAM Nor-LAAM Dinor-LAAM
1 0 +1* 0 0 0 0
2 0.25 0.25 0 11 0
3 0.5 0.5 13 18 0
4 1 1 35 29 0
5 1.5 1.5 92 66 1
6 2 2 129 82 3
7 4 4 148 92 4
8 6 6 154 109 8
9 12 12 103 III 10
10 16 16 65 92 11
11 24 24 47 92 13
12 48 48 20 64 8
13 72 +2*
72/0 10 40 16
14 72.25 0.25 19 44 18
15 72.5 0.5 49 51 8
16 73 1 61 68 21
17 73.5 1.5 57 68 16
18 74 2 89 94 24
19 76 4 100 130 24
20 78 6 84 136 31
21 84 12 36 149 42
22 88 16 35 132 35
23 96 24 21 106 14
24 120 48/0 7 63 29 +3*
25 120.25 0.25 10 69 32
26 120.5 0.5 200 65 29

242
TABLE 11 (continued)
Specimen Hour(s) Hour (s) Concentration in ng/ml No. Into Study Post Dose LAAM Nor-LAAM Dinor-LAAM
27 121 1 44 80 31
28 121.5 1.5 52 87 71
29 122 2 74 101 36
30 124 4 95 133 43
31 126 6 101 149 46
32 132 12 63 134 42
33 136 16 52 129 52
34 144 24
35 168 +4* 48/0 15 82 37
36 169 1 36 87 37
37 180 12 82 139 78
38 192 24 39 120 21
39 216 +5* 48 21 94 20
40 288 +6* 48/0 20 81 48
41 289 1 70 105 54
42 300 12 80 136 64
43 312 +7* 24 52 142 64
44 408 +8* 72/0
45 409 1
46 420 12 168 134 99
47 432 +9* 24 41 120 39
48 504 +10* 48/0 31 90 83
49 504.25 0.25 33 108 90
50 504.5 1 99 112 81
52 505.5 1.5 207 218 62
53 506 2 139 163 107
54 508 4 144 182 106
55 510 6 129 255 120
56 516 12 121 168 115

243
TABLE 11 (continued)
Specimen Hour{s) Hour{s) Concentration in ng/m1 No. Into Study Post Dose LAAM Nor-LAAM Dinor-LAAM
57 520 16 61 206 112
58 528 24 36 180 103
59 552 48 24 132 88
60 576 72 4 40 24
61 672 168 11 38 49
62 744 244 0 20 24
63 840 336 0 0 0
64 912 408 0 0 0
65 1008 504 0 0 0
*Indicates time of dose. See Table 6.

244
TABLE 12
SUBJECT 006: HUMAN PLASMA CONCENTRATION OF LAAM AND METABOLITES OVER A 42-DAY PERIOD FOLLOWING
REPETITIVE ORAL DOSES OF 73 mg LAAM
Specimen Hour(s) Hour(s) Concentration in ng/ml No. Into Study Post Dose LAAM Nor-LAAM Dinor-LAAM
1 0 0 0 0 0 +1*
2 0.25 0 0 0 0
3 0.5 0.5 34 27 3
4 1 1 76 66 8
5 1.5 1.5 138 94 10
6 2 2 131 101 12
7 4 4 85 94 12
8 6 6 143 III 9
9 12 12 45 76 13
10 16 16 38 78 15
11 24 24 31 66 16
12 48 48 14 48 15
13 72 72/0 13 38 22 +2*
14 72.25 0.25 20 40 22
15 72.5 0.5 51 54 23
16 73 1 134 89 43
17 73.5 1.5 156 106 25
18 74 2 153 118 27
19 76 4 114 III 27
20 78 6 93 109 29
21 84 12 56 102 31
22 88 16 41 88 27
23 96 24 36 96 33
24 120 48/0 27 75 38 +3* 25 120.25 0.25 40 83 40
26 120.5 0.5 88 93 42

245
TABLE 12 (continued)
Specimen Hour(s) Hour(s) Concentration in ng/m1 No. Into Study Post Dose LAAM Nor-LAAM. Dinor-LAAM
27 121 1 149 118 43
28 121.5 1.5 215 136 44
29 122 2 180 144 46
30 124 4 137 154 47
31 126 6 00
32 132 12 75 147 47
33 136 16 56 123 41
34 144 24 56 130 51
35 168 48/0 41 113 59
36 169 1 74 116 54
37 180 12 97 052 56
38 192 24 65 157 68
39 216 48 39 94 59
40 288 48/0 21 75 75
41 289 1 75 104 91
42 300 12 104 136 78
43 312 24 65 148 89
44 408 +-8* 72/0 66 108 81
45 409 1 235 163 97
46 420 12 218 108 58
47 432 +-9* 24 151 112 "114
48 504 +-10* 48/0 96 145 92
49 504.25 0.25 105 169 108
50 504.5 0.5 55 155 235
51 505 1 156 165 92
52 505.5 1.5 213 180 101
53 506 2 115 198 102
54 508 4 343 208 100
55 510 6 339 245 114

246
TABLE 12 ( continued)
= Specimen Hour (s) Hour(s) Concentration in ng/m1
No. Into Study Post Dose LAAM Nor-LAM! Dinor-LAAM
56 516 12 227 222 107
57 520 16 149 208 102
58 528 24 129 217 104
59 552 48 96 146 90
60 576 72 81 131 91
61 672 168 30 47 74
62 744 240 21 24 61
63 840 336 16 18 30
74 912 408 16 3 17
65 1008 504 12 3 10
*Indicates time of dose. See Table 6 .

247
TABLE 13
SUBJECT 007: HUMAN PLASMA CONCENTRATION OF LAAM AND METABOLITES OVER A 42-DAY PERIOD FOLLOWING
REPETITIVE ORAL DOSES OF 89 mg LAAM
Specimen Hour(s) Hour(s) Concentration in ng/m1 No. Into Study Post Dose LAAM Nor-LAAM D i nor - LAAr-1
1 0 +1* 0 0 0 0
2 0.25 0.25 32 5 0
3 0.5 0.5 66 18 0
4 1 1 150 58 3
5 1.5 1.5 200 84 5
6 2 2 117 48 2
7 4 4 174 87 6
8 6 6 71 III 12
9 12 12 95 103 9
10 16 16 96 6 11
11 24 24 54 104 14
12 48 48 22 78 14
13 72 + 2* 72.0 22 54 19
14 72.25 0.25 50 78 18
15 72.5 0.5 101 89 22
16 73 1 251 140 23
17 73.5 1.5 285 163 24
18 74 2 288 187 25
19 76 4 213 176 25
20 78 6 187 148 22
21 84 12 106 67 26
22 88 16 94 187 32
23 96 24 61 161 31
24 120 +3* 48/0 50 131 36
25 120.25 0.25 129 36
26 120.5 0.5 91 144 36

248
TABLE 13 (continued)
Specimen Hour(s) Hour (s) Concentration in ng/ml No. Into Study Post Dose LAAM Nor-LAAM Dinor-LAAM
27 121 1 232 201 41
28 121.5 1.5 283 250 45
29 122 2 305 254 44
30 124 4 237 256 48
31 126 6 173 225 42
32 132 12 114 230 45
33 136 16 90 209 43
34 144 24 73 225 52
35 168 +4* 48/0 49 183 57
36 169 1 123 197 56
37 180 12 103 214 55
38 192 24 78 233 71
39 216 48 52 170 62 +-5* 40 288
+6* 48/0 65 198 76
41 289 1 94 201 76
42 300 12 155 307 85
43 312 +7* 24 106 295 88
44 408 +8* 72/0 116 272 88
45 409 1 193 249 69
46 420 12 347 433 106
47 432 +9* 24 219 387 92
48 504 +10* 48/0 156 327 92
49 504.25 0.25 166 345 101
50 504.5 0.5 190 369 107
51 505 1 255 390 109
52 505.5 1.5 306 384 103
53 506 2 412 407 105
54 508 4 616 488 114
55 510 6 569 478 113

249
TABLE 13 (continued)
Specimen Hour (s) Hour(s) Concentration in ng/ml No. Into Study Post Dose LAAM Nor-LAAM Dinor-LAAM
56 516 12 377 498 117
57 520 16 307 442 105
58 528 24 276 481 119
59 552 48 395 109
60 576 72 106 325 96
61 672 168 61 187 83
62 744 240 33 104 65
'63 840 336 10 53 51
64 912 408 1 22 30
65 1008 504 0 9 18
*Indicates time of dose. See Table 6.

250
TABLE 14
SUBJECT 008: HUMAN PLASMA CONCENTRATION OF LAAM AND METABOLITES OVER A 42-DAY PERIOD FOLLOWING
REPETITIVE ORAL DOSES OF 75 mg LAAM
Specimen Hours(s) Hour(s) Concentration in ng/m1 No. Into Study Post Dose LAAM Nor-LAAM Dinor-LAAM
1 0 +1* 0 0 0 0
2 0.25 0.25 0 0 0
3 0.5 0.5 33 18 3
4 1 1 141 83 9
5 1.5 1.5 227 119 12
6 2 2 268 147 15
7 4 4 265 175 23
8 6 6 182 147 23
9 12 12 97 134 25
10 16 16 69 125 27
11 24 24 47 106 32
12 48 48 24 73 34
13 72 +2* 72/0 15 48 36
14 72.25 0.25 32 51 35
15 72.5 0.5 71 64 36
16 73 1 190 104 37
17 73.5 1.5 55 154 39
18 74 2 276 166 44
19 76 4 270 182 50
20 78 6 208 170 49
21 84 12 116 160 49
22 88 16 79 169 47
23 96 24 66 143 47
24 120 +3* 48/0 52 96 51
25 120.25 0.25 68 104 53
26 120.5 0.5 89 109 53

251
TABLE 14 (continued)
Specimen Hour(s) Hour(s) Concentration in ng/rn1 No. Into Study Post Dose LAAM Nor-LAAM Dinor-LAAM
27 121 1 261 163 57
28 121.5 1.5 302 195 60
29 122 2 330 222 64
30 124 4 264 232 67
31 126 6 197 216 65
32 132 12 138 215 68
33 136 16 104 214 69
34 144 24 80 180 73
35 168 +4* 48/0 50 134 70
36 169 1 148 159 72
37 180 12 160 240 91
38 192 24 92 194 87
39 216 +5* 48 61 160 97
40 288 +6* 48/0 66 159 97
41 289 1 180 198 109
42 300 12 177 273 127
43 312 +7* 24 128 286 126
44 408 +8* 72/0 99 166 104
45 409 1 331 248 118
46 420 12 257 304 127
47 432 +9* 24 161 258 121
48 504 +10* 48/0 123 194 113
49 504.25 0.25
50 504.5 0 .. 5 187 201 113
51 505 1 222 215 116
52 505.5 1.5 305 246 124
53 506 2 365 268 125
54 508 4 413 291 131
55 510 6 418 317 142

252
TABLE 14 (continued)
Specimen Hour(s} Hour(s} Concentration in ng/ml No. Into Study Post Dose LAAM Nor-LAAM Dinor-LAAM
56 516 12 283 315 140
57 520 16 211 279 136
58 528 24 174 275 133
59 552 48 144 243 205
60 576 72 101 184 135
61 672 168 34 44 63
62 744 240 16 20 36
63 840 336 8 10 13
64 912 408 7 8 6
65 1008 504 5 8 4
*Indicates time of dose. Table 6.

253
TABLE 15
SUBJECT 009: HUMAN PLASMA CONCENTRATION OF LAAM AND METABOLITES OVER A 42-DAY PERIOD FOLLOWING
REPETITIVE ORAL DOSES OF 82 mg LAAM
--Specimen Hour (s) Hour(s) Concentration in ng/ml
No. Into Study Post Dose LAAM Nor-LAAM Dinor-LA&~
1 0 +1* 0 0 0 0
2 0.25 0.25 0 0 0
3 0.5 0.5 0 0 3
4 1 1 14 6
5 1.5 1.5 70 34 6
6 2 2 31 76 12
7 4 4 46 72 12
8 6 6 69 83 13
9 12 12 45 61 14
10 16 16 68 64 15
11 24 24 180 55 15
12 48 48 24 27 15
13 72 +2* 72/0 24 22
14 72.25 0.25 12 22 20
15 72.5 0.5 16 26 21
16 73 1 32 30 19
17 73.5 1.5 118 55 22
18 74 2 156 73 25
19 76 4 97 82 16
20 78 6
21 84 12 104 81 27
22 88 16 96 77 21
23 96 24 134 73 30
24 120 +3* 48/0 50 43 29
25 120.25 0125 54 35 28
26 120 .. 5 0.5 72 51 30

254
TABLE 15 (continued)
Specimen Hour (s) Hour(s) Concentration in ng/ml No. Into Study Post Dose LAAM Nor-LAAM Dinor-LAAM
27 121 1 43 61 35
28 121.5 1.5 56 85 37
29 122 2 60 106 35
30 124 4 197 132 32
31 126 6
32 132 12 76 117 43
33 136 16 33 92 51
34 144 24 15 101 61
35 168 +4* 48/0 50 44 30
36 169 1 101 60 32
37 180 12 131 73 32
38 192 24 59 102 41
39 216 +5* 48 37 64 36
40 288 +6*
48/0 34 52 30
41 289 1 79 77 38
42 300 12 187 120 45
43 312 +7* 24 41 112 49
44 408 +8* 72/0 20 59 29
45 409 1 96 74 28
46 420 12 171 112 49
47 432 +9* 24 65 84 43
48 504 +10* 48/0 79 68 45
49 504.25 0.25 58 65 42
50 504.5 0.5 138 119 53
51 505 1 184 122 53
52 505.5 1.5 180 117 61
53 506 2 250 121 54
54 508 4 324 173 67
55 510 6 229 129 52

255
TABLE 15 (continued)
Specimen Hour{s) Hour{s) Concentration in ng/ml No. Into Study Post Dose LAAM Nor-LAAM Dinor-LAAM
56 516 12 130 119 51
57 520 16 149 132 56
58 528 24 155 121 54
59 552 48 45 78 42
60 576 72 13 24 12
61 672 168 10 16 23
62 744 240 9 6 16
63 840 336
64 912 408
65 1008 504
*Indicates time of dose. See Table 6.

256
TABLE 16
SUBJECT 010: HUMAN PLASMA CONCENTRATION OF LAAM AND METABOLITES OVER A 42-DAY PERIOD FOLLOWING
REPETITIVE ORAL DOSES OF 80 mg LAAM
Specimen Hour (s) Hour(s) Concentration in ng/m1 No. Into Study Post Dose LAA14 Nor-LAAM Dinor-LAAM
1 0 +1* 0 0 0 0
2 0.25 0.25 0 0 0
3 0.5 0.5 0 0 0
4 1 1 21 10 2
5 1.5 1.5 30 18 3
6 2 2 67 22 3
7 4 4 104 40 6
8 6 6 140 52 7
9 12 12 74 58 9
10 16 16 105 63 12
11 24 24 59 54 15
12 48 48 30 17
13 72 +2* 72/0
14 72.25 0.25
15 72.5 0.5 26 20 16
16 73 1 55 38 18
17 73.5 1.5 180 60 19
18 74 2 181 63 19
19 76 4 124 90 25
20 78 6 123 71 14
21 84 12 103 74 14
22 88 16 68 71 23
23 96 24 13 65 31
24 120 +3* 48/0 40 30
25 120.25 0 .. 25 43 41 29
26 120.5 0.5 41 39 27

257
TABLE 16 (continued)
Specimen Hour(s) Hour (s) Concentration in ng/ml No. Into Study Post Dose LAAM Nor-LAAM Dinor-LAAM
27 121 1 58 50 31
28 121.5 1.5 158 66 32
29 ' 122 2 122 74 34
30 124 4 115 87 33
31 126 6 212 95 28
32 132 12 131 105 40
33 136 16 94 85 30
34 144 24 58 68 32
35 168 +4* 48/0 48 47 30
36 169 1 108 54 31
37 180 12 162 93 38
38 192 24 56 65 22
39 216 +5* 48 27 44 30
40 288 +6* 48/0 48 54 34
41 289 1 95 60 27
42 300 12 147 102 43
43 312 +7* 24
44 408 +8* 72/0
45 409 1 210 79 46
46 420 12 177 99 37
47 432 +9* 24 91 89 49
48 504 +10* 48/0 40 59 39
49 504.25 0.25 75 57 38
50 504.5 0.5 151 66 41
51 505 1 205 75 40
52 505.5 1.5 231 87 41
53 506 2 289 115 51
54 508 4 269 126 50
55 510 6 210 113 46

258
TABLE 16 (continued)
-------- ==============~~============ ~--======== Specimen
No.
56
57
58
59
60
61
62
63
64
65
Hour(s) Into Study
516
520
528
552
576
672
744
840
912
1008
*Indicates time
Hour (s) Post Dose
12
16
24
48
72
168
240
336
408
504,
Concentration in ng/ml LAAt-1 Nor -- LP...c\.l\1 Din 0 r - LAAN
168 113 45
118 105 34
73 84 35
62 67 43
49 61 41
54 21 29
10 9 10
50 3 8
3 3 4
30 2 3
"-----------.--<------.~
of dose. See 'I'c .. ble 6 •

259
TABLE 17
SUBJECT 011: HUMAN PLAS~ffi CONCENTRATION OF LAA}i AND METABOLITES OVER A 42-DAY PERIOD FOLLOWING
REPETITIVE ORAL DOSES OF 80 mg LAAM
Specimen Hour(s) Hour(s) Concentration in ng/m1 No. Into Study Post Dose LAAM Nor-LAAM Dinor-LAAM
1 0 +1* 0 0 0 0
2 0.25 0.25 0 8 0
3 0.5 0.5 0 10 0
4 1 1 20 14 0
5 1.5 1.5 64 24 1
6 2 2 89 38 3
7 4 4 510 84 9
8 6 6 226 108 16
9 12 12 99 88 22
10 16 16 126 71 20
11 24 24 67 80 1
12 48 48 70 92
13 72 +2* 72/0 32 18 19
14 72.25 0.25 50 19 23
15 72.5 0.5 46 23 27
16 73 1 100 37 11
17 73.5 1.5 303 79 10
18 74 2 342 102 34
19 76 4 169 78 22
20 78 6 81 42 53
21 84 12 67 70 46
22 88 16 73 42
23 96 24 90 69 23
24 120 +3* 48/0 40 39 54
25 120.25 0.25 76 80 80
26 120.5 0.5 93 33 29

260
TABLE 17 (continued)
Specimen Hour (s) Hour(s) Concentration in ng/m1 No. Into Study Post Dose LAAM N or-L.Aru1 Dinor-LAAM
27 121 1 50 59 53
28 121.5 1.5 135 72 63
29 122 2 388 82 63
30 124 4 171 126 52
31 126 6
32 132 12 225 130 70
33 136 16
34 144 24
35 168 +4* 48/0 92 53 70
36 169 1
37 180 12 103 78 72
38 192 24 113 75
39 216 +5* 48 595 80 64
40 288 +6* 48/0 0 34 60
41 289 1
42 300 12
43 312 +7* 24 108 136 66
44 408 +8* 72/0 0 8 18
45 409 1
46 420 12 94 70 23
47 432 +9* 24 5 23 33
48 504 +10* 48/0 0 8 18
49 504.25 0.25
50 504.25 0.5 34 109 32
51 505 1 97 181 32
52 505.5 1.5 230 202 51
53 506 2 256
54 508 4 183 197 47
55 510 6 41 144 49

261
TABLE 17 (continued)
Specimen Hour (s) Hour (s) Concentration in ng/ml No. Into Study Post Dose LAAM Nor-LAAM Dinor-LAAM
56 516 12 0 76 52
57 520 16 0 81 56
58 528 24 0 43 43
59 552 48 0 14 27
60 576 72 0 4 10
61 672 168 0 3 0
62 744 240 0 3 0
63 840 336 0 3 0
64 912 408 0 0 0
65 1008 504 0 0 0
*Indicates time of dose. See Table 6.

262
TABLE 18
SUBJECT 012: HU~urn PLASMA CONCENTRATION OF LAAM AND ~mTABOLITES OVER A 42-DAY PERIOD FOLLOWING
REPETITIVE ORAL DOSES OF 80 mg LAAM
Specimen Hour(s) Hour(s) Concentrations in ng/m1 No. Into Study Post Dose LAAM Nor-LAAM Dinor-LAAM
1 0 +1* 0 0 0 0
2 0125 0125 24 0 0
3 0.5 0.5 75 0 0
4 1 1 24 0 0
5 1.5 1.5 100 52 15
6 2 2 92 76 21
7 4 4 101 65 22
8 6 6 80 68 24
9 12 12 80 66 16
10 16 16 52 49 26
11 24 24 25 25 11
12 48 48 82 67
13 72 +2*
72/0 16 0 15
14 72.25 0.25 43 3 13
15 72.5 0.5
16 73 1 176 90 25
17 73.5 1.5
18 74 2 171 98 28
19 76 4 305 118 11
20 78 6 0 107 32
21 84 12 65 57 15
22 88 16 135 68 27
23 96 24 45 52 26
24 120 +3* 48/0
25 120.25 0.25 99 28 39
26 120.5 0.5 80 49 38

263
TABLE 18 (continued)
Specimen Hour(s) Hour (s) Concentration in ng/ml No. Into study Post Dose LAAM Nor-LAAM Dinor-LAAM
27 121 1 189 80 44
28 121.5 1.5 242 104 46
29 122 2 242 130 48
30 124 4 240 116 44
31 126 6 198 120 39
32 132 12 117 107 46
33 136 16
34 144 24 71 65 24
35 168 +- 4 * 48/0 45 49 49
36 169 1 190 63 32
37 180 12 20 134 36
38 192 24 93 86 53
39 216 +- 5* 48 100 51 37
40 288 +- 6 * 48/0 30 37 56
41 289 1 167 61 56
42 300 12 140 133 67
43 312 +-7* 24
44 408 ~8*
72/0 18 38 50
45 409 1
46 420 12 95 100 52
47 432 +-9* 24 90 112 79
48 504 +-10* 48/0 65 33 58
49 504.25 0.25
50 504.5 0.5 203 59 48
51 505 1 509 125 62
52 505.5 1.5 532 159 70
53 506 2 354 171 79
54 508 4 270 163 79
55 510 6 184 189

264
-'ontinued}
_' (s) Concentration in ng/m1 c Dose LAAM Nor-LAAM Dinor-LAAM
12 575 333 191
16 246 146 80
!) 24 110 140 69
59 48 98 139 72
60 72 72 85 56
61 6, ... 168 23 2 15
62 744 240 32 0 5
63 840 336 0 4
64 912 408 17 0 3
65 1008 504 18 0 4
*Indicates time of dose. See Table 6.

Su
bje
ct
Nu
mb
er
LA
AM
00
1
1.2
00
2
1.1
00
3
4.5
00
4
3.0
00
5
3.7
00
6
1.9
00
7
1.2
00
8
3.6
00
9
1.1
01
0
1.8
01
1
1.9
01
2
3.8
Ra
ng
e
1.1
-4.5
Me
an
2
.4
TA
BL
E
19
PL
AS
MA
H
AL
F-L
IVE
S
IN
HO
UR
S
FO
R
LA
AM
A
ND
1
-1E
TA
BO
LIT
ES
Fir
st
Do
se
L
ast
Do
se
t!
1
S
a. L
AA
M t~
S N
or-
LA
AM
t!
1
B
LA
AM
N
or-
LA
AM
45
.8
31
.2
10
4.5
4
4.3
39
.5
56
.0
67
.4
59
.2
43
.6
33
.9
41
.1
42
.1
43
.8
33
.7
43
.2
90
.3
21
.5
39
.9
14
.2
27
.0
38
.3
60
.2
64
.8
84
.2
37
.0
50
.7
35
.9
12
9.6
29
.1
42
.0
52
.6
93
.6
31
.5
36
.3
15
.9
22
.8
40
.6
33
.5
44
.1
71
.4
45
.0
27 .
1
--1
2.9
35
.3
13
.5
31
.6
71
.7
21
.5-4
5.8
1
3.5
-60
.2
14
.2-1
04
.5
22
.8-1
29
.6
66
.8
----
----
--1
2.9
-12
9.6
3
7.5
3
8.2
4
6.8
6
2.4
-
--
Din
or-
LA
AM
14
0.6
32
1.4
42
9.9
15
5.1
10
0.8
14
3.8
18
2.1
96
.7
11
4.2
12
2.8
22
.5
11
2.9
22
.5-4
29
.9
16
1.9
--
----
----
96
.7-4
29
.9
17
4.6
!
tv
0)
U1

NAME:
BIRTHPLACE:
BIRTHDATE:
SCHOOLS:
COLLEGE:
DEGREES:
HONORS:
VITA
Bryan Smith Finkle
Sunderland, County Durham, England
March 5, 1936
Monkwearmouth, Sunderland and Lemington, Newcastle-Upon-Tyne, England
Rutherford College, Durham University, and
Northampton College, London University, England
National and Higher National Certificates in Chemistry, Physics and Pure Mathetmatics (England)
Distinguished Service Award, Santa Clara County District Attorney's Office, California, 1965.
American Academy of Forensic Sciences Award of Merit for Outstanding Service to Forensic Science, 1974.
Certificate of Honor, Awarded for Research in Toxicology by the University of Ghent, Belgium, 1976.
President, International Association of Forensic Toxicologists, 1975 to present.
Vice-President, American Academy of Forensic Sciences, 1973-1974.
President, Executive Board, California Association of Toxicologists, 1975.
President, Forensic Sciences Foundation, 1976 to present.

267
PROFESSIONAL ORGANIZATIONS:
American Academy of Forensic Sciences--Fellow and Past Vice-President
Forensic Science Foundation--President
International Association of Forensic Toxicologists-President
California Association of Toxicologists--Past President
Forensic Science Society of Great Britain
Society of, Toxicology
American Association for the Advancement of Science
American Association of Clinical Chemists
California Association of Criminalists
Sigma Xi
Western Pharmacology Society
PUBLICATIONS:
Sixty-three abstracts and publications at national and international scientific meetings; and the following published research papers:
Jackson, J.V. and Finkle, B.S. Occurrence of pseudobarbiturates in post-mortem material. Nature 199: 1061-1063, 1963.
Sunshine, I. and Finkle, B.S. The necessity for tissue studies in fatal cyanide poisonings. Int. Archiv. fur Gewerbepathologie und Gewerbehygine ~:558-561, 1964.
Finkle, B.S. The identification, quantitative determination, and distribution of meprobamate and glutethimide in biological material. J. Forensic Sci. ~:509-528, 1967.
Finkle, B.S., Biasotti, A.A., and Fradfor, L.W. The occurrence of some drugs and toxic agents encountered in drinking driver investigations. J. Forensic Sci. 13:236-245, 1968.

268
Sunshine, I., Maes, R., and Finkle, B.S. An evaluation of methods for the determination of barbiturates in biological materials. Clin. Toxicol. l:28l-296, 1968.
Smith, W.C., Harding, D.M., Biasotti, A.A., Finkle, .B.S., and Bradford, L.W. Breathalizer experiences under the operational conditions recommended by the California Association of Criminalists. J. Forensic Sci. ~:58-64, 1969.
Maes, R., Hodnett, N., Landesman, H., Kananen, G., Finkle, B.S., and Sunshine, I. The gas chroamtographic determination of selected sedatives (ethchlorvynol, Paraldehyde, Meprobamate, and Carisprodol) in biological material. J. Forensic Sci. 14:235-254, 1969. --
Finkle, B.S. Drugs in drinking drivers: A study of 2,500 cases. J. Safety Res. l:179-l83, 1969.
Finkle, B.S. A progress report on a statewide computer program for analytical and case toxicology data. Fifth International Meeting of Forensic Sciences, Toronto, Ontario, Canada, 1969.
Lebish, P., Finkle, B.S., and Brackett, J.W., Jr. Determination of amphetamine, methamphetamine, and related amines in blood and urine by gas chromatography with hydrogen-flame ionization detector. Clin. Chern. 16:195-200, 1970.
Finkle, B.S., Cherry, E.J., and Taylor, D.M. A GLC based system for the detection of poisons, drugs, and human metabolites encountered in forensic toxicology. J. Chromatographic Sci. ~:393-4l9, 1971.
Finkle, B.S. Ubiquitous reds: A local perspective on secobarbital abuse. Clin. Toxicol. !:253-264, 1971.
Bradford, L.W., Biasotti, A.A., Finkle, B.S., Harding, D. M., and Smith, W.D. Inquiry into standards of practice of blood alcohol analysis. J. Forensic Sci. 11:127-130, 1971.
Forrest, F.M., Forrest, I.S., and Finkle, B.S. Alcoholchlorpromazine interaction in psychiatric patients. Agressologie 13:67-74, 1972.

269
Finkle, B.S. and Taylor, D.M. A GC/MS reference data system for the identification of drugs of abuse. J. Chromatographic Sci. 10:312-333, 1972.
Finkle, B.S. and Taylor, D.M. A GC/MS reference data system for the identification of drugs of abuse. Finnigan Spectra 2, 1972.
"Statement--Secobarbital Abuse." u.S. Senate Judiciary Committee Proceedings. Senator Birch Bayh, Committee on Juvenile Delinquency. 1972.
A GC/MS system for the identification of drugs, narcotics, and poisons. Proceedings: Sixth International Meeting of International Association of Forensic Science, Edinburgh, U.K., 1972.
Secobarbital Abuse--A major factor in escalating traffic accidents in California. Proceedings: Fourth International Congress of Traffic Medicine, Paris, France, 1972.
Finkle, B.S. Forensic Toxicology of Drug Abuse: A status report. Analtyical Chern. !!:18-26, 1972.
Finkle, B.S. A comprehensive GC/MS reference data system for toxicological and biomedical purposes. J. Chromatographic Sci. 12:304-328, 1975.
Finkle, B.S. Forensic Toxicology--Relationship to analytical chemistry. Forensic Science--American Chemical Society Symposium Series, 1974.
Finkle, B.S. "Will the real drugged driver please stand up"--An analytical toxicology assessment of drugs and driving. Proceedings of the Sixth International Conference on Alcohol, Drugs and Traffic Safety, 197.4.
Finkle, B.S. GC-MS: Married Bliss or Breach of Promise. Microfilm. Journal of Legal Medicine, 1976.
Finkle, B.S. and Franklin, M.R. The formation of cytochrome P-450-455 nm complexes in vivo and isolated perfused rat liver. American Society for Pharmacology and Experimental Therapeutics, 1975.

270
Publications of Case Reports in the Bulletin of the International Association of Forensic Toxicologists:
Two Placidyl (Ethchlorvynol) Deaths
Driving Under the Influence of Meprobamate and Glutethinide
Librium and Valium Detection in Urine
Fatal Darvon (Propoxyphene) Ingestion
Brevital (Methohexital) Death
Fatal Ingestion of Viodex (Amphetamine)
Two Arsenic Deaths
Fatal M.D.A. Case
Detection of Tybamate in Urine
Barbiturate and Chloral Hydrate Death
Amphetamine-Tuinal Involvement in a Fatal Single Vehicle Accident
Fatal Multiple Drug (7) Ingestion
Low-Level Alcohol-Barbiturates Fatality
Three Cocaine Fatalities
Drugs and Driving. Four Cases
Pentazocine Fatality
Flurazepam and Alcohol Fatality
Formaldehyde-Methanol Suicide
Amitriptyline and Chlordiazepoxide Death
Fatal Ethchlorvynol
Monograph:
2 (1) , 1965
2 (1) , 1965
2 (2) , 1965
4 ( 3) , 1967
4 (3) , 1967
4 (4) , 1967
5 (1) , 1968
5 (2) , 1968
6 (3) , 1969
8 (I) , 1971
8 (1) , 1971
8 (I) , 1971
8 (1) , 1971
8 (3-4),1972
10 (16), 1974
10 (16), 1974
10(16),1974
11 (2) , 1975
11 ( 2) , 1975
11 ( 2) , 1975
Finkle, B.S., Contributor. Investigation of the problems and opinions of aged drivers. National Safety Council Research Report #5/68, 1968

271
Finkle, B.S., Co-author. Techniques of Combined Gas Chromatography--Mass Spectrometry. Applications in Organic Chemistry and Biochemistry. (McFadden, W.) Wiley & Sons, 1972.
Finkle, B.S. "A descriptive appreciation of modern laboratory instrumentation, with special emphasis on gas chromatography and mass spectrometry." Legal Medicine Annual, 7th ed., 1975. (Cyril H. Wecht) Appleton-Centruy-Crofts.
Finkle, B.S. Contributor. Methodology for analytical toxicology. (Sunshine, I., ed. in chief) CRC, 1975.
Finkle, B.S. Contributor. Manual of Toxicology Methods. (Sunshine, I., ed. in chief) Chemical Rubber Company, Cleveland, Ohio, 1971 and 1975.