Embed Size (px)
Citation preview

Department of MarketingFaculty of Economics
Store location: Evaluation and Selection based on
Geographical Information
Tammo H.A. Bijmolt
Joint project with:Auke Hunneman and Paul Elhorst

Department of MarketingFaculty of Economics
Importance of store location
For many customers, store location is a key For many customers, store location is a key factor driving store choice.factor driving store choice. Store location determines the trade area.Store location determines the trade area. Store location can be a source of competitive Store location can be a source of competitive advantage.advantage. The decision is almost irreversible The decision is almost irreversible costs of costs of mistakes are high.mistakes are high.
Department of MarketingFaculty of Economics
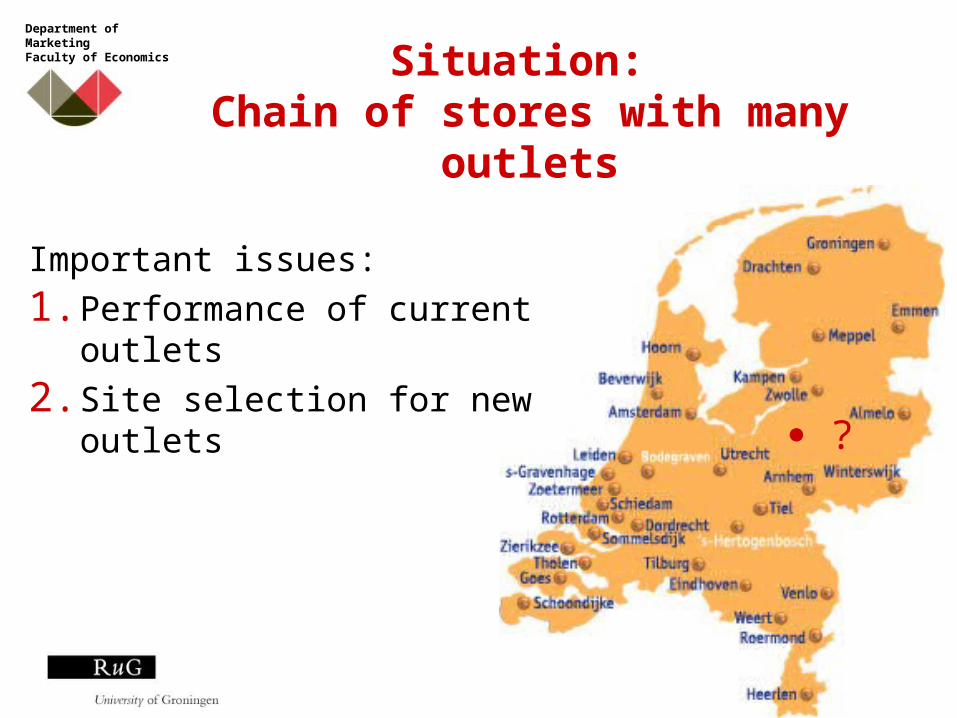
Situation: Chain of stores with many outlets
Important issues:
1. Performance of current outlets
2. Site selection for new outlets ?
Department of MarketingFaculty of Economics
Modeling framework
1. Current outlets: Determine impact of drivers of store performance (characteristics of customers, outlet, and market/competition)
2. Copy relationships found in stage 1 to new sites to determine potential performance.
Department of MarketingFaculty of Economics
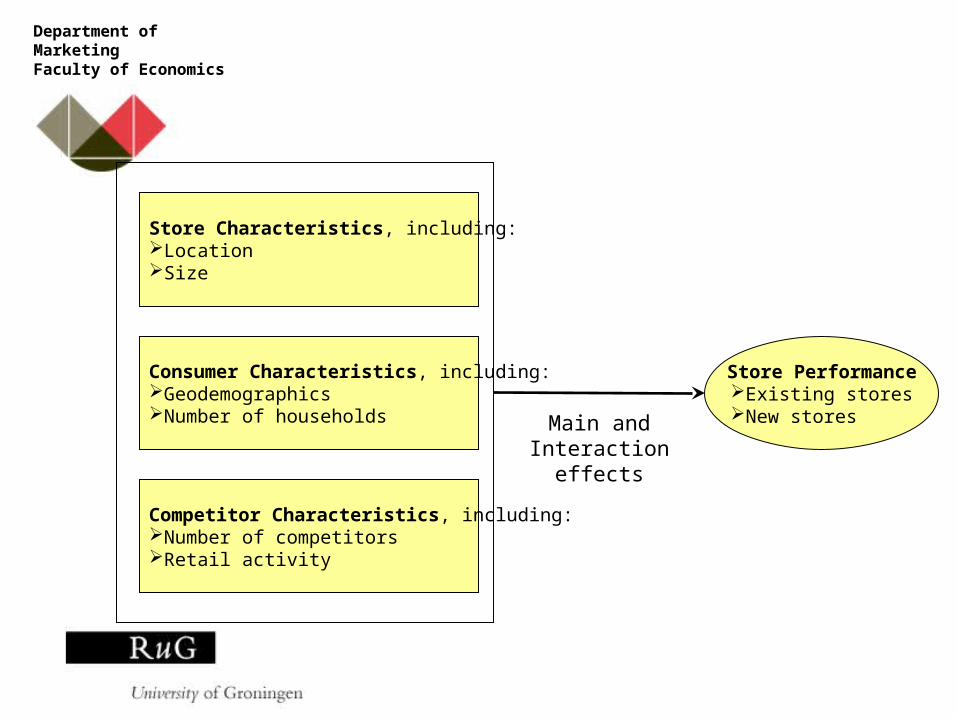
Store Characteristics, including:LocationSize
Consumer Characteristics, including:GeodemographicsNumber of households
Competitor Characteristics, including:Number of competitorsRetail activity
Store PerformanceExisting storesNew stores Main and
Interaction effects
Department of MarketingFaculty of Economics
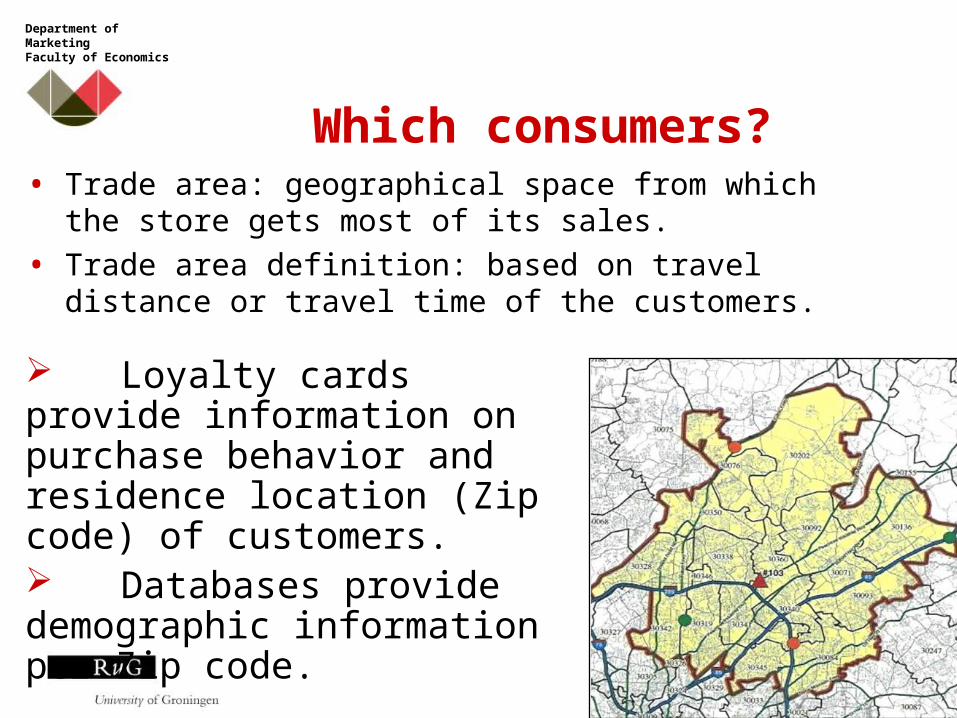
Which consumers?• Trade area: geographical space from which
the store gets most of its sales.
• Trade area definition: based on travel distance or travel time of the customers.
Loyalty cards provide information on purchase behavior and residence location (Zip code) of customers. Databases provide demographic information per Zip code.

Department of MarketingFaculty of Economics
Definition of the trade area
= Trade area
Our approach:1. Rank the ZIP codes on
decreasing sales.
2. Determine which ZIP codes yield 85% of the total sales.
3. Trade area includes all these ZIP codes and those closer to the store.
Store
Department of MarketingFaculty of Economics
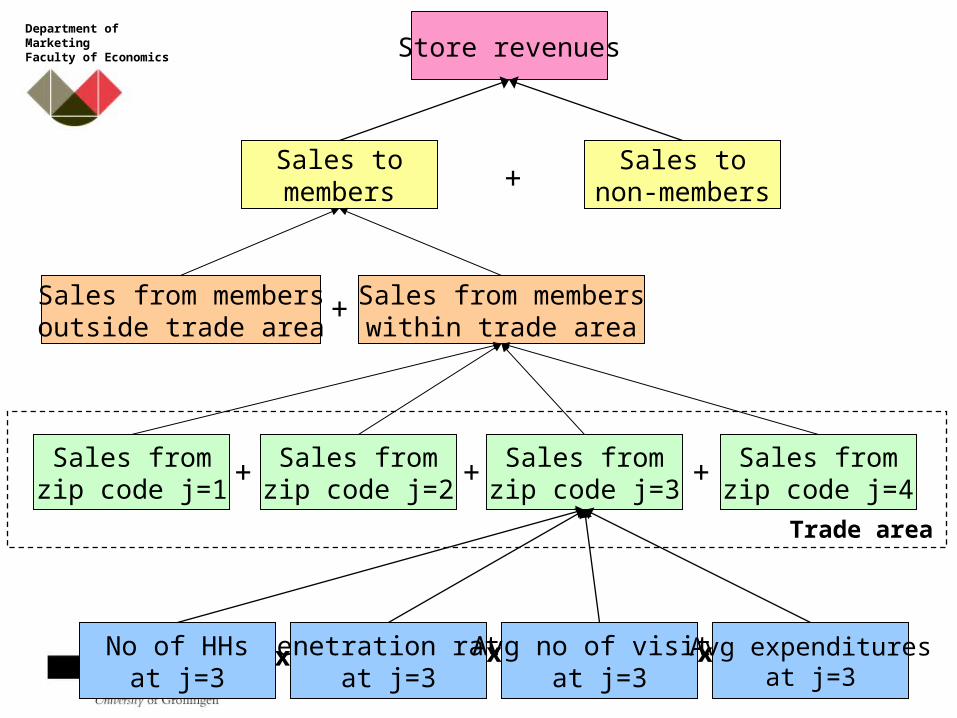
Sales tomembers
Sales fromzip code j=1
Sales fromzip code j=2
Sales fromzip code j=3
Sales fromzip code j=4
Penetration rateat j=3
Avg no of visitsat j=3
Avg expendituresat j=3
No of HHsat j=3
Sales tonon-members
Store revenues
Trade area
+ + +
x x x
+
Sales from membersoutside trade area
Sales from memberswithin trade area
+
Department of MarketingFaculty of Economics
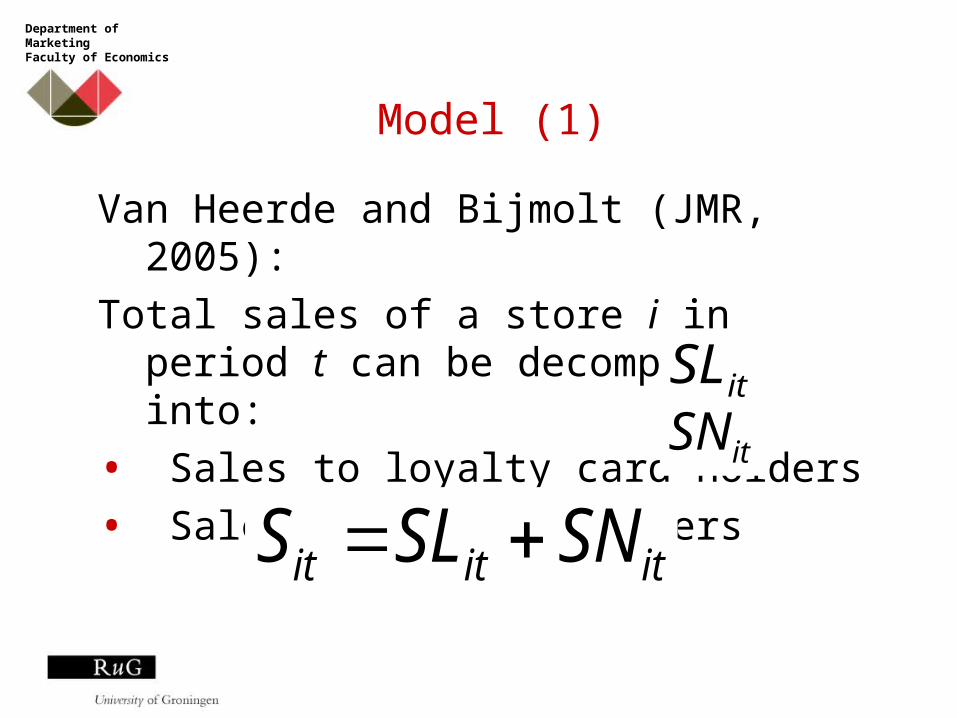
Model (1)
Van Heerde and Bijmolt (JMR, 2005):
Total sales of a store i in period t can be decomposed into:
• Sales to loyalty card holders
• Sales to other customers
ititit SNSLS
itSL
itSN

Department of MarketingFaculty of Economics
Model (2)
Sales to loyalty card holders (within the trade area) can be further decomposed into:
ii J
jjtjtjtjt
J
jijtit EPNVPRNHSLSL
11
jtNH
jtPR
jtEPjtNV
= number of households in zip code area j
= penetration rate of the loyalty card in zip code area j
= avg number of visits of loyalty card holders in j
= avg expenditures per visit of loyalty card holders in j
i: Store
j: Zip code
t: Time period

Department of MarketingFaculty of Economics
Example
Households LC holders Avg number of visits
Avg amount spent
Penetration Rate
ZIP Code 1 100 75 5 €100 0.75 (75/100)
ZIP Code 2 200 100 10 €75 0.50 (100/200)
Sales ZC 1 = NH*PR*NV*EP = 100*0.75*5*100 = €37,500
Sales ZC 2 = NH*PR*NV*EP = 200*0.50*10*75 = €75,000
Total sales to loyalty card holders = €37,500+ €75,000= €112,500

Department of MarketingFaculty of Economics
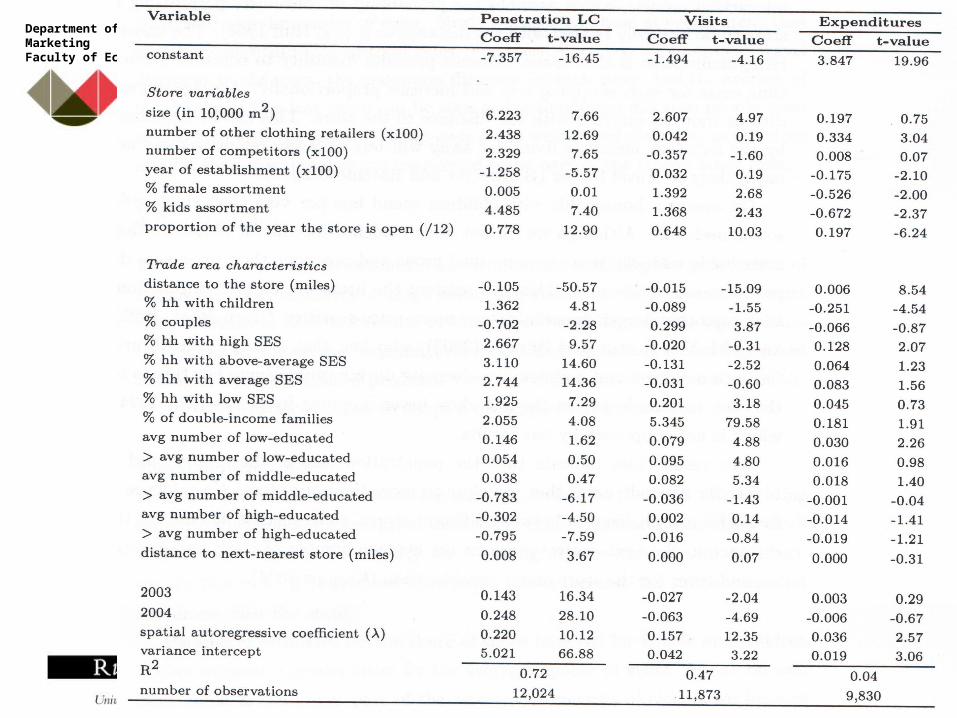
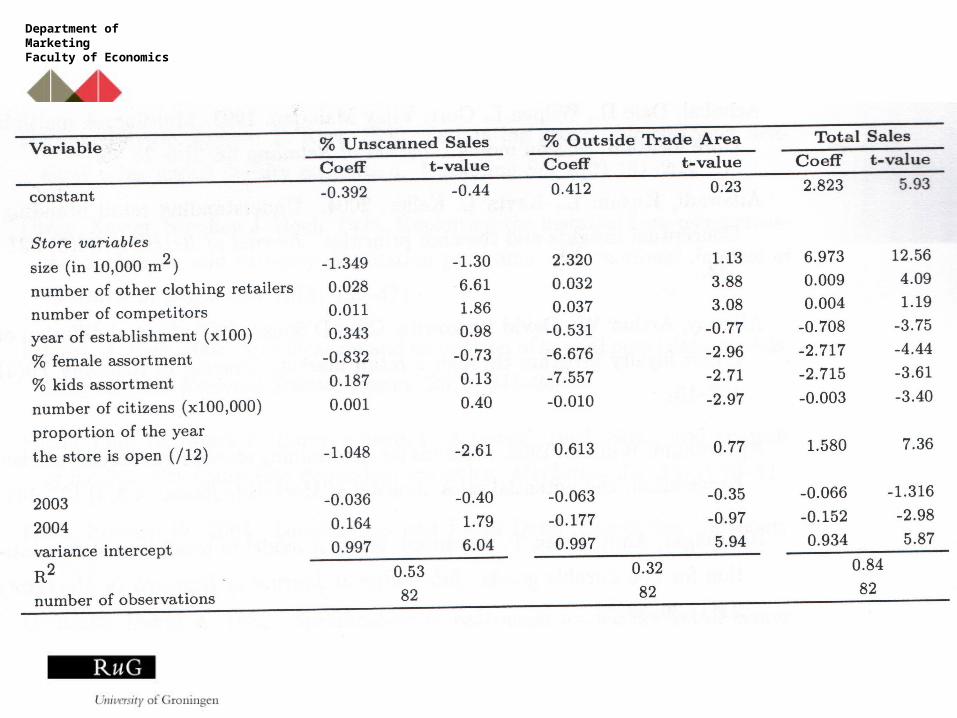
Dependent variables
• Per Zip code: Penetration of loyalty card (Logit) Average number of visits (Ln) Average purchase amount (Ln)
• Percentage of sales to loyalty card holders outside the trade area (Logit)
• Percentage of total sales to other customers (Logit)

Department of MarketingFaculty of Economics
Explanatory variables
Zj predictors that vary between zip code areas
Xi store specific predictors
Components of the sales equation to be explained by factors concerning characteristics of:
• Store
• Consumer
• Market/Competition
e.g. jNVjnNV
N
nnNViNVj RZNV
NV
,,1
,0,ln
iNVikNV
K
kkNVNViNV UX
NV
0,,1
0,00,0,
Department of MarketingFaculty of Economics
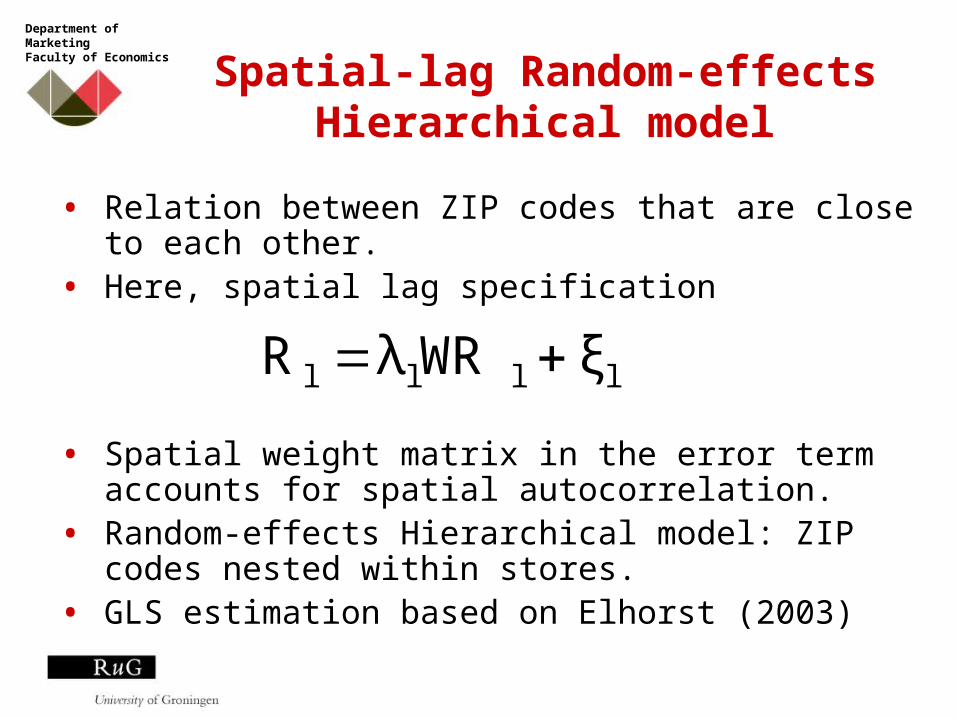
Spatial-lag Random-effects Hierarchical model
• Relation between ZIP codes that are close to each other.
• Here, spatial lag specification
• Spatial weight matrix in the error term accounts for spatial autocorrelation.
• Random-effects Hierarchical model: ZIP codes nested within stores.
• GLS estimation based on Elhorst (2003)
llll ξWRλR

Department of MarketingFaculty of Economics
Empirical study
• Dutch chain of clothing retailer
• 28 stores throughout The Netherlands
• Trade area: about 60 to 200 ZIP codes per store
• 3 years (2002-2004)
• We have data for each store as well as data about characteristics of their market areas (consumer and competitor information).

Department of MarketingFaculty of Economics
Average sales per store
0
500000
1000000
1500000
2000000
2500000
2002 2003 2004
Year
Av
era
ge
sa
les
pe
r s
tore
unscanned
scanned
About 75% of the sales is by loyalty card holders.
Department of MarketingFaculty of Economics

Department of MarketingFaculty of Economics
The relationship between travel distance and the penetration rate
0
0,05
0,1
0,15
0,2
0,25
0,3
0,35
0,4
0 1 2 3 4 5 6 7 8 9 10
travel distance
pre
dic
ted
pe
ne
tra
tio
n r
ate

Department of MarketingFaculty of Economics
The relationship between number of visits and travel distance
2,9
2,922,94
2,96
2,98
33,02
3,04
3,06
3,083,1
3,12
0 1 2 3 4 5 6 7 8 9 10
travel distance
pre
dic
ted
nu
mb
er
of
vis
its
Department of MarketingFaculty of Economics

Department of MarketingFaculty of Economics
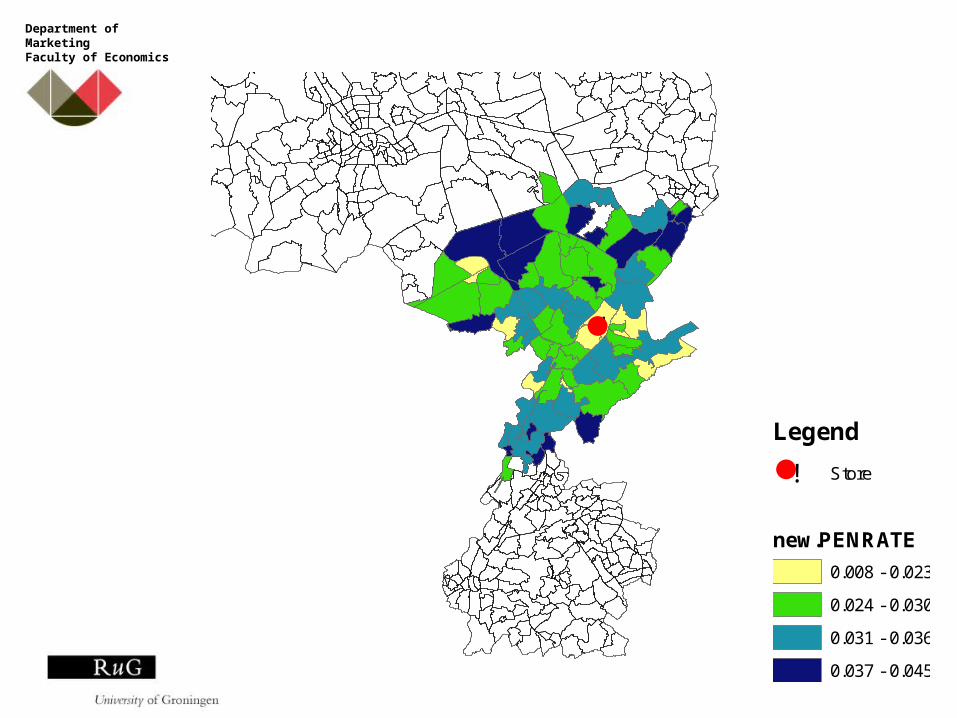
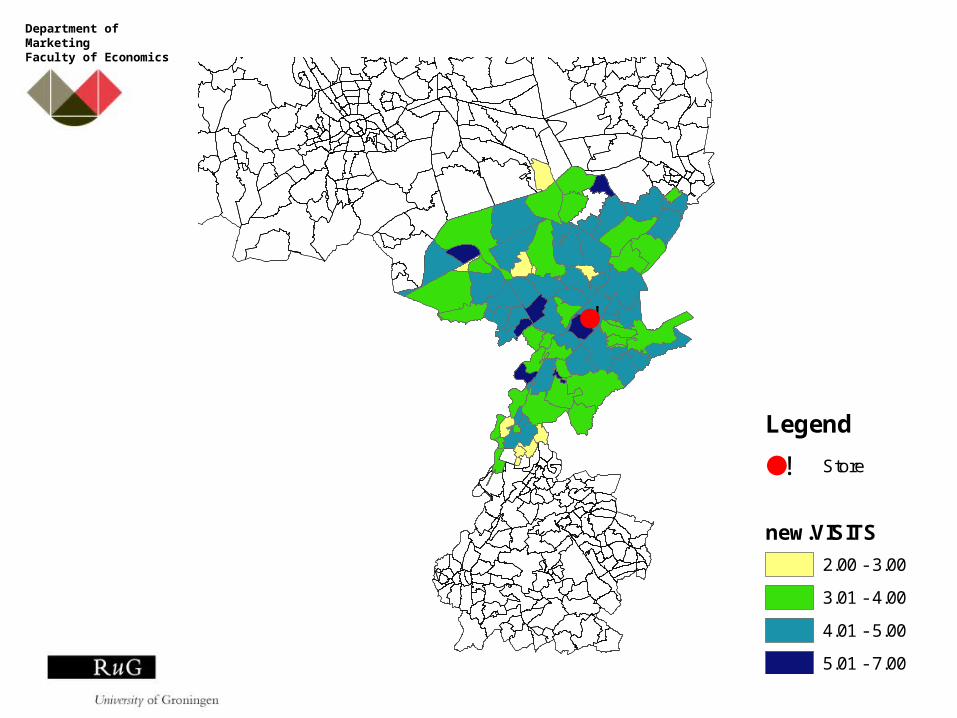
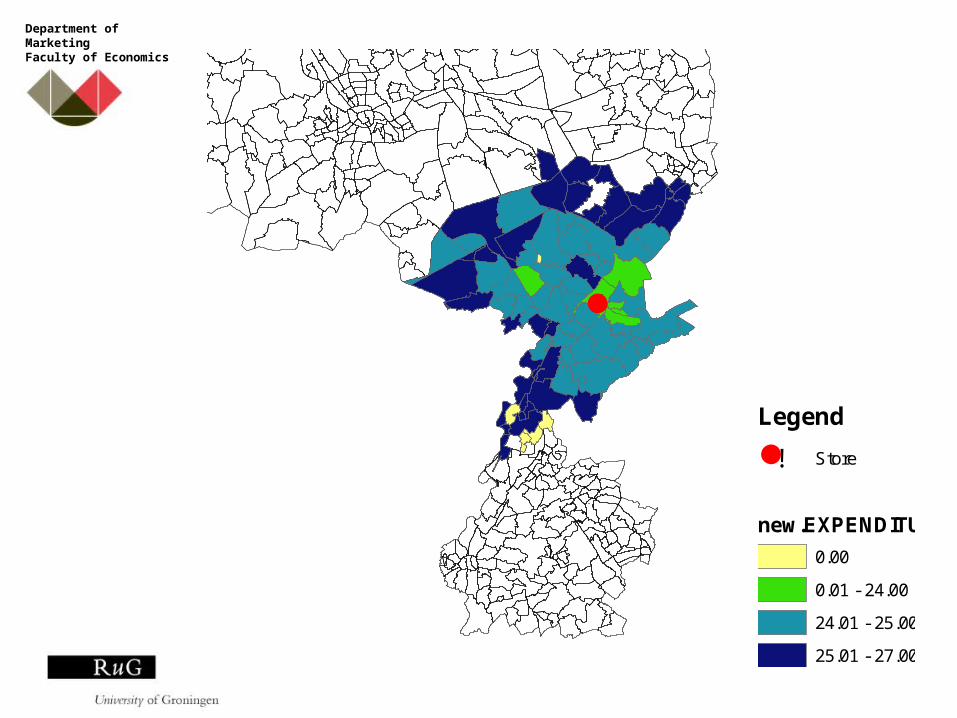
Model predictions: steps
1. Model for explaining revenue components (LP penetration, number of visits, etc.) based on data from existing stores.
2. Model predictions of the revenue components per ZIP code / store.
3. Per ZIP code: # households x LP penetration x # visits x average basket size = predicted revenues.
4. Aggregate predicted revenues across ZIP codes, add the percentage sales outside the trade area and percentage sales to customers without a loyalty card
5. Final result: Prediction of sales per store, per year.
Department of MarketingFaculty of Economics
!
Legend
! Store
new.PENRATE
0.008 - 0.023
0.024 - 0.030
0.031 - 0.036
0.037 - 0.045
Department of MarketingFaculty of Economics
!
Legend
! Store
new.VISITS
2.00 - 3.00
3.01 - 4.00
4.01 - 5.00
5.01 - 7.00
Department of MarketingFaculty of Economics
!
Legend
! Store
new.EXPENDITUR
0.00
0.01 - 24.00
24.01 - 25.00
25.01 - 27.00
Department of MarketingFaculty of Economics
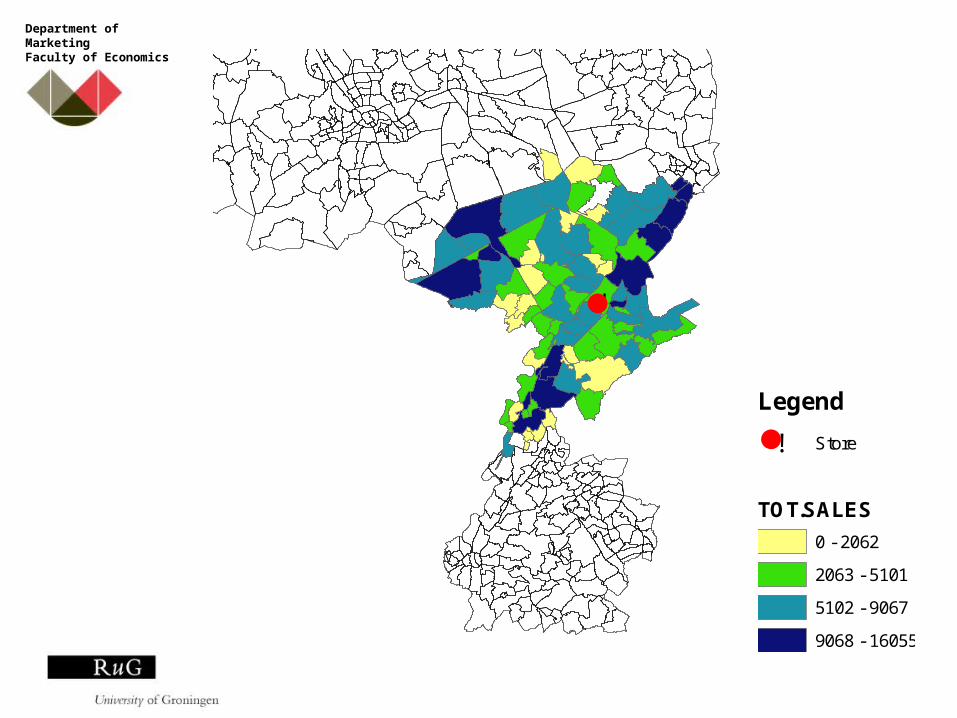
!
Legend
! Store
TOT.SALES
0 - 2062
2063 - 5101
5102 - 9067
9068 - 16055
Department of MarketingFaculty of Economics
Conclusions New methodological tool based on geo-
demographic and purchase behaviour to assess store performance.
We explain a substantial amount of variance in store performance.
We identify important drivers of store performance.
Drivers differ between penetration, number of visits and expenditures, e.g. distance and household composition.

Department of MarketingFaculty of Economics
Further research
• Predictive validity: Predict sales for potential new locations
• Comparison to benchmark models


![[H.a. Macleod] Thin-Film Optical Filters](https://img.dokumen.tips/doc/110x75/553ff9e8550346096e8b4989/ha-macleod-thin-film-optical-filters.jpg)