Embed Size (px)
Citation preview

i
United NationsNew York, 2010
United Nations
E-GovernmentSurvey 2010 Leveraging e-governmentat a time of financialand economic crisis
ST/ESA/PAD/SER.E/131
Department of Economic and Social Affairs

ii

Foreword
iii
United Nations E-Government Survey 2010
Foreword
The high demand for e-government knowledge and skills on the part of Member States has increased considerably in recent years. This upward trend in e-government development has accelerated despite, or maybe in part also due to, the current financial crisis and the pressing need for governments to be compe-tent, transparent, accessible and efficient. The crisis makes a compelling case for e-government. The de-mand for social support has increased dramatically while revenues have declined precipitously. Public sector commitments to stimulus packages and fi-nancial sector support have yielded debt levels that may take a very long time to reduce.
Member States have had to coordinate, make hard choices and weigh spending options very carefully. But we must also consider in this moment that there is a reason why e-government matters beyond the need to maximize efficiency, or even beyond engag-ing citizens in urgent questions of public policy. The compelling factor and the bitter lesson learned from the crisis is that trust matters and lack of confidence in government, as in markets, can lead to calamity. The capacity to respond under difficult conditions and deliver expected results are cornerstones of effec-tive government and a foundation of public trust.
The 2010 edition of the United Nations E-Government Survey, the fifth in a series begun in 2003, makes the case that e-government should play an ever-greater role in development. Many countries have made tremendous strides in the last two years, due in part to recent, exciting advances in the diffusion of technology. With its respon-sive, citizen-centric qualities, I firmly believe that e-government can make a decisive contribution to the achievement of the MDGs, particularly in de-veloping regions.
This publication can become a useful reference to guide development efforts at international, re-gional and local levels. n
Sha Zukang Under-Secretary-General for Economic and Social Affairs
E-government – once a bold experiment and now an important tool for public sector transformation – has progressed to the point where it is now a force for effective gover-nance and citizen participation, both at national and local levels. This is important. Until governments have the capacity to lead development efforts and deliver services that fully respond to the needs of citizens, the achievement of the internationally agreed devel-opment goals will continue to elude us. With the Millennium Development Goal time horizon of 2015 quickly approaching, it is no longer a question of whether we can afford information and communications technology in health, education, environmental pro-tection and a multitude of other areas, but where to deploy them first and how rapidly gains can be realized.

iv

Acknowledgements
v
United Nations E-Government Survey 2010
Acknowledgements
Preparation of the publication was undertaken by a group of senior e-government researchers and advisers at the United Nations, led directly by Haiyan Qian, Director of the Division for Public Administration and Development Management, Department of Economic and Social Affairs. The core research team comprised Richard Kerby, S. Ran Kim, Michael Mimicopoulos, Jonas Rabinovitch, Patrick Spearing and Keping Yao.
Part One on leveraging e-government at a time of financial and economic crisis was prepared by S. Ran Kim and Patrick Spearing with lead authors Tiago Peixoto (Chapter 1), Nick von Tunzelmann (Chapter 2) and S. Ran Kim (Chapter 3). Jeffrey Roy contributed an additional background paper for the study. Interns Aynur Sagin, Shuyi Wang, Jin Xin Liyuan Zhang and Huang Zhao provided research assistance.
Part Two on the state of e-government around the world was prepared by Richard Kerby, Deniz Susar, Carla Valle and Keping Yao with supple-mentary inputs from Michael Mimicopoulos, Jonas Rabinovitch and Patrick Spearing. The evaluation team for the methodology comprised Seema Hafeez, Richard Kerby, S. Ran Kim, Wai Min Kwok, Michael Mimicopoulos, Elida Reci, Silvia Schwarz and Deniz Susar.
The survey benefited from advice and guid-ance on e-government measurement provided by a group of experts who met in New York in December 2008. The group consisted of Kim Andreasson (United States), Frank Bannister (Ireland), Sue Brelade (United Kingdom), Gregory Curtin (United States), Andrea Di Maio (Italy), Morten Goodwin Olsen (Norway), Chris Harman (United Kingdom), Erik Hup (United States),Marijn Janssen (Netherlands), Jeremy Millard (Denmark), David Osimo (Belgium), Chris Parker (United Kingdom), Rajkumar
Prasad (India), Jeffrey Roy (Canada) and Mikael Snaprud (Norway).
Collection of data on online services was over-seen by Gregory Curtin of Civic Resource Group. The CRG research team was led by Charity Tran and Victoria Imsirovic, and included Albane Ariza, Sarah Millar Babovic, Itti Charoenthongtrakul, Sam Imsirovic, Fumi Iwasaki, Jayoon Koo, Leila Lomashvili, Thuy Luong, Suedine Bohn Nakano, Sonia Ghattas Rafidi, Dagfinn Romen, Lyuba Smith, Jessica Tang, Melike Tanrikulu, and a number of other spot researchers and translators around the globe.
Second stage data verification was provided by United Nations staff members Carla Valle, Keping Yao, Deniz Susar, Richard Kerby, Alexei Tikhomirov, Elida Reci, Vyatcheslav Cherkasov, S.K. Belal Hassan, Brian Gutterman, Bruno Bastet, Angela Capati-Caruso, Laura Tedesco, Maria Carreno, Anni L Haataja, Marian Haji-Mohamed, Yoshinobu Yonekawa, Enrica Murmura, Osamah Khawam, Wai Min Kwok and by interns Ashish Kumar, Samir Sayad, Mariam Zaari Jabiri and Pia De Mauleon.
Telecommunication infrastructure and edu-cation data were generously provided by the International Telecommunication Union and the United Nations Educational, Scientific and Cultural Organization respectively.
Technical assistance with data management was provided by Deniz Susar, S.K. Belal Hassan, Zhiliang Yu, and Candace Hosang, United Nations interns Ashish Kumar and Morten Olsen, and CRG interns Artin Mirzaian, Simone Sessler and Anthony Yeung.
Editorial services were provided by Susan Guthridge-Gould and Patrick Spearing. Editorial and administrative assistance were provided by Nathan Henninger, Silvia Schwarz, Candace
The 2010 edition of the United Nations e-Government Survey is the result of the efforts, contributions and support of many people from a number of organizations and thanks are extended to all who were involved directly or indirectly. In particular, the following people are acknowledged for their specific roles in its production.

vi
Hosang, Elizabeth Danseco, Dolores Tanpinco, Madeleine Losch and Milagros Verendia and by interns Marleen Geerlof, David Lung’ano, Julie
Mabine, Jing Tao and Di Zhao.Creative design was directed and executed by
Eliot Sela. n
Acronyms
vii
United Nations E-Government Survey 2010
AcronymsARRA American Recovery and Reinvestment Act
C2C Citizen-to-citizen
C2G Citizen-to-government
CEO Chief executive officer
CEPA Committee of Experts on Public Administration
CPSS Committee on Payments and Settlements Systems
CSC Common services centre
ESRI Environmental Systems Research Institute
EU European Union
FAQ Frequently asked question
FATF Financial Action Task Force
FSA Financial Services Authority
FSAP Financial Sector Assessment Program
G2B Government-to-business
GCC Gulf Cooperation Council
GDP Gross domestic product
GIS Geographic information system
HIV/AIDS Human immunodeficiency virus/acquired immune deficiency syndrome
ICT Information and communications technology
ILO International Labour Organization
IMF International Monetary Fund
IOSCO International Organization of Securities Commissions
ITU International Telecommunication Union
MDG Millennium Development Goal
NEPAD New Partnership for Africa’s Development
NGO Non-governmental organization
OECD Organization for Economic Cooperation and Development
OTC Over-the-counter
REDD Reducing emissions from deforestation and forest degradation
ROSC Report on the observance of standards and codes
SMART Skills matching and referral technology
SME Small- and medium-sized enterprise
SMS Short message service
UNDESA United Nations Department of Economic and Social Affairs
UNDP United Nations Development Programme

viii

Foreword iii
Acknowledgements v
Acronyms vii
Introduction 1
Part 1: Leveraging e-government at a time of financial and economic crisis 7
Chapter1: Stimulusfunds,transparencyandpublictrust 9
1.1 Crisisresponsewebsites 10
1.2 Fromtransparencytoparticipation 14
1.3 Dataaccessandcivilsociety 16
1.4 Conclusions 19
Chapter2: Rolesfore-governmentinfinancialregulationandmonitoring 25
2.1 E-governmentrisksandbenefits 26
2.2 Restoringtrustaftertimesofvolatility 28
2.3 Confidence,capabilitiesandcompetencies 33
2.4 Internationalcooperationande-government 36
2.5 Conclusions 40
Chapter3: E-servicedeliveryandtheMDGs 43
3.1 Whye-services? 44
3.2 Deliveringe-serviceswithaviewtowardsachievingtheMDGs 45
3.3 Conclusions 55
Part 2: The state of e-government around the world 57
Chapter4: Worlde-governmentrankings 59
4.1 Globale-governmentdevelopment 60
4.2 Regionalcomparisons 61
4.3 Economicgroupings 75
4.4 Progressinonlineserviceprovision 75
Chapter5:Citizenempowermentandinclusion 83
5.1 Progressine-participation 84
5.3 Questionsofaccessanddiversity 88
Chapter6: Measuringe-government 93
6.1 Towardsconsensusonindicators 94
6.2 Assessingonlineservicesande-participation 95
6.3 Accountingforcapacityconstraints 96
6.4 Conclusions 97
Notes 99
References 101
Statisticalannex 107
Surveymethodology 109
Datatables 114
Regionalgroupings 125
ix
United Nations E-Government Survey 2010 Table of contents
Contents

x
United Nations E-Government Survey 2010Table of contents
Boxes
Box 2.1 ReportsontheObservanceofStandardsandCodesagreedbytheIMFandWorldBank,November2002 38
Box 3.1 OnlinealertsaboutschoolsandH1N1flu 48
Box 3.2 ‘Shrinking’Australiawithe-educationservices 48
Box 3.3 Promotingfreeandopensourcesoftwareinschoolsinacrisis-affectedcountry 49
Box 3.4 Mobilephonessupportlife-savingHIV/AIDSelectronicrecordssysteminRwanda 53
Box 3.5 Spatiallyenablede-governmenttoolsforforestmanagement 54
Box 4.1 UnitedStatesSocialSecurityAdministrationleadsincustomersatisfaction 60
Box 4.2 BahrainembracesWeb2.0 60
Box 4.3 AfriAfya,Kenya 63
Box 4.4 CyberEthiopia 63
Box 4.5 AlgeriaalertscitizenstotheirnewnationalhotlineforH1N1 64
Box 4.6 Panama’sPrimeraDama 67
Box 4.7 Guatemalae-procurement 67
Box 4.8 Kazakhstan–puttingcitizensfirst 69
Box 4.9 Japaneseportalprovidesaccesstostatisticalinformation 70
Box 4.10 RepublicofKorea’snationalportal 70
Box 4.11 Singaporespearheadsdevelopmentofmobileservices 70
Box 4.12 Malaysia–utilizingmobiletechnology 70
Box 4.13 Belgium’selectronicidentificationcard 73
Box 4.14 Austria–supportforgenderequality 73
Box 4.15 Germany–applyinge-governmenttoolstoeducatechildren 73
Box 4.16 Regionale-governmentstrategies 77
Box 4.17 Leadersintransactionalandconnectede-government 78
Box 5.1 Citizenengagementineconomiccrisisresponse 88
Box 5.2 Singapore’sREACH 89
Box 5.3 E-participationinChina 89
Box 5.4 WomeninruralIndiagainInternetaccess 90
Box 6.1 Thefourstagesofonlineservicedevelopment 95
Figures
Figure 1.1 NettrustintheEuropeanCentralBank(euroarea12),1999-2009 9
Figure 1.2 AustraliaEconomicStimulusPlanwebsitewithgeo-referencingtools 11
Figure 1.3 Crisis-responsewebsiteobjectives,October2009 12
Figure 1.4 Transparencyande-governmentdevelopmentintheUnitedStates,2009 13
Figure 1.5 UseofWeb2.0toolsbydifferentactors,October2009 15
Figure 1.6 UnitedKingdomcrisis-responsewebsitewithcitizenfeedbacktools 16
Figure 1.7 UnitedStatesfederalopendatainitiative 17
Figure 3.1 Gender-disaggregatedemployment-to-populationratios 50
Figure 3.2 Mobilecellphonesubscriptionsper100people 52
Figure 3.3 ICTtrendsinsub-SaharanAfrica(2000-2008) 53
Figure 4.1 E-governmentdevelopmentindexregionalaverages 61
Figure 4.2 E-governmentdevelopmentinAfrica 62
Figure 4.3 E-governmentdevelopmentintheAmericas 65
Figure 4.4 E-governmentdevelopmentinAsia 68
Figure 4.5 E-governmentdevelopmentinEurope 72
Figure 4.6 Nearlyallgovernmentshavewebsites 77
Figure 4.7 Numberofministrieslinkedtoanationalportal 78
Figure 4.8 Featuresofministrywebsites 79
Figure 4.9 Availabilityofstaticonlineforms 79
Figure 4.10 Selectedcountrieswithhightransactionalpresencescores 79
Figure 4.11 Numberofministrywebsiteswithonlineformsandtransactionalservices 80
Figure 5.1 Geographicdistributionofbestperformingcountriesine-participation 85
Figure 5.2 Governmentinteractionswithcitizens 86
Figure 5.3 Countrieswithhighpointsforconnectedservices 86
Figure 5.4 E-participationutilizationlevels 86
Figure 5.5 Ministrywebsiteswithe-consultationfeatures 88
Figure 5.6 Genderempowermentande-governmentdevelopment 90
xi
United Nations E-Government Survey 2010 Table of contents
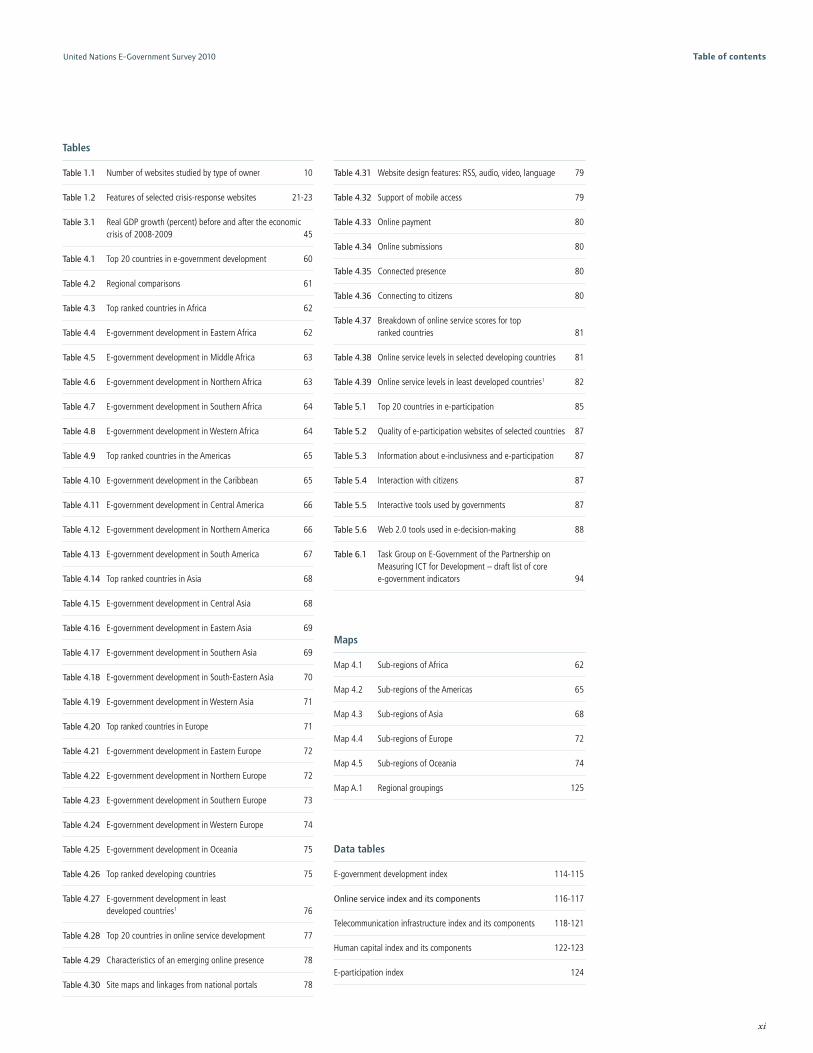
Tables
Table 1.1 Number of websites studied by type of owner 10
Table 1.2 Features of selected crisis-response websites 21-23
Table 3.1 Real GDP growth (percent) before and after the economic crisis of 2008-2009 45
Table 4.1 Top 20 countries in e-government development 60
Table 4.2 Regional comparisons 61
Table 4.3 Top ranked countries in Africa 62
Table 4.4 E-government development in Eastern Africa 62
Table 4.5 E-government development in Middle Africa 63
Table 4.6 E-government development in Northern Africa 63
Table 4.7 E-government development in Southern Africa 64
Table 4.8 E-government development in Western Africa 64
Table 4.9 Top ranked countries in the Americas 65
Table 4.10 E-government development in the Caribbean 65
Table 4.11 E-government development in Central America 66
Table 4.12 E-government development in Northern America 66
Table 4.13 E-government development in South America 67
Table 4.14 Top ranked countries in Asia 68
Table 4.15 E-government development in Central Asia 68
Table 4.16 E-government development in Eastern Asia 69
Table 4.17 E-government development in Southern Asia 69
Table 4.18 E-government development in South-Eastern Asia 70
Table 4.19 E-government development in Western Asia 71
Table 4.20 Top ranked countries in Europe 71
Table 4.21 E-government development in Eastern Europe 72
Table 4.22 E-government development in Northern Europe 72
Table 4.23 E-government development in Southern Europe 73
Table 4.24 E-government development in Western Europe 74
Table 4.25 E-government development in Oceania 75
Table 4.26 Top ranked developing countries 75
Table 4.27 E-government development in least developed countries1 76
Table 4.28 Top 20 countries in online service development 77
Table 4.29 Characteristics of an emerging online presence 78
Table 4.30 Site maps and linkages from national portals 78
Table 4.31 Website design features: RSS, audio, video, language 79
Table 4.32 Support of mobile access 79
Table 4.33 Online payment 80
Table 4.34 Online submissions 80
Table 4.35 Connected presence 80
Table 4.36 Connecting to citizens 80
Table 4.37 Breakdown of online service scores for top ranked countries 81
Table 4.38 Online service levels in selected developing countries 81
Table 4.39 Online service levels in least developed countries1 82
Table 5.1 Top 20 countries in e-participation 85
Table 5.2 Quality of e-participation websites of selected countries 87
Table 5.3 Information about e-inclusivness and e-participation 87
Table 5.4 Interaction with citizens 87
Table 5.5 Interactive tools used by governments 87
Table 5.6 Web 2.0 tools used in e-decision-making 88
Table 6.1 Task Group on E-Government of the Partnership on Measuring ICT for Development – draft list of core e-government indicators 94
Maps
Map 4.1 Sub-regions of Africa 62
Map 4.2 Sub-regions of the Americas 65
Map 4.3 Sub-regions of Asia 68
Map 4.4 Sub-regions of Europe 72
Map 4.5 Sub-regions of Oceania 74
Map A.1 Regional groupings 125
Data tables
E-government development index 114-115
Online service index and its components 116-117
Telecommunication infrastructure index and its components 118-121
Human capital index and its components 122-123
E-participation index 124