Embed Size (px)
Citation preview

Department of Computing Science and MathematicsUniversity of Stirling
Cognitively Inspired Fuzzy Based Audiovisual SpeechFiltering
Andrew K. Abel, Amir Hussain
Technical Report CSM-198
ISSN 1460-9673
April 2014


Department of Computing Science and MathematicsUniversity of Stirling
Cognitively Inspired Fuzzy Based Audiovisual SpeechFiltering
Andrew K. Abel, Amir Hussain
Department of Computing Science and MathematicsUniversity of Stirling
Stirling FK9 4LA, Scotland
Telephone +44 1786 467 421, Facsimile +44 1786 464 551Email [email protected]
Technical Report CSM-198
ISSN 1460-9673
April 2014

AbstractIn recent years, the established link between the various human communication production domains has becomemore widely utilised in the field of speech processing. Work by the authors and others has demonstrated that intel-ligently integrated audio and visual information can have a vital role to play in speech enhancement. Of particularinterest to our work is the potential use of visual information in future designs of hearing aid and listening devicetechnology. A novel two-stage speech enhancement system, making use of audio only beamforming, automaticlip tracking, and visually derived speech filtering, was initially developed by the authors and its potential evalu-ated in a previous paper. This work found that the use of visual information was of benefit in some scenarios,but not all. In addition to the use of visual information based on the concept of lip-reading, there is also scopefor the development of cognitively inspired speech processing approaches that function in a similar manner to themultimodal attention switching nature of the human mind. One example of this is the use of the visual modalityfor speech filtering in only the most appropriate environments (such as when there is a lot of background noise,and when the visual information is of a suitable quality to be used). This cognitively inspired approach ensuresthat visual information is only used when it is expected to improve performance. It is also worth considering thepossibility of environments where multimodal information may be sporadic and of varying quality. One singlespeech filtering approach may produce inadequate results when applied to a wide range of environments. To alle-viate this, we present a cognitively inspired fuzzy logic based multi-modal speech filtering system that considersaudio noise level (using a similar manner to level detectors used in conventional hearing aids) and evaluates thevisual signal quality in order to carry out more intelligent, automated, speech filtering. These detectors are usedas part of a fuzzy logic based system to determine the optimal speech filtering solution for each frame of speech.When tested with a wide variety of challenging data, the results show that a nuanced approach is capable of auto-matically switching between approaches when considered appropriate. The proposed approach is intended to be acognitively inspired scalable, adaptable framework, with promising initial results.
AcknowledgementsThis work was funded by a University of Stirling PhD scholarship, with additional work carried out with the aid ofan EPSRC grant (EP/G062609/1). The authors would also like to thank Leslie Smith of the University of Stirlingfor his assistance and guidance with preparing this report. We are also very grateful for the support and adviceover the years provided by others, particularly participants and organisers of the COST Action 2102, Cross-ModalAnalysis of Verbal and Non-verbal Communication.
ContentsAbstract i
Acknowledgements ii
1 Introduction 11.1 Background . . . . . . . . . . . . . . . . . . . . . . . . . . . . . . . . . . . . . . . . . . . . . . 11.2 Contribution of this Paper . . . . . . . . . . . . . . . . . . . . . . . . . . . . . . . . . . . . . . . 2
2 Previous Research Findings 22.1 Previous Audiovisual System . . . . . . . . . . . . . . . . . . . . . . . . . . . . . . . . . . . . . 2
2.1.1 Reverberant room environment . . . . . . . . . . . . . . . . . . . . . . . . . . . . . . . . 32.1.2 Multiple microphone array . . . . . . . . . . . . . . . . . . . . . . . . . . . . . . . . . . 32.1.3 Audio feature extraction . . . . . . . . . . . . . . . . . . . . . . . . . . . . . . . . . . . 32.1.4 Visual Feature Extraction . . . . . . . . . . . . . . . . . . . . . . . . . . . . . . . . . . . 32.1.5 Visually Derived Wiener Filtering . . . . . . . . . . . . . . . . . . . . . . . . . . . . . . 42.1.6 Gaussian Mixture Model for Audiovisual Clean Speech Estimation . . . . . . . . . . . . 42.1.7 Beamforming . . . . . . . . . . . . . . . . . . . . . . . . . . . . . . . . . . . . . . . . . 4
2.2 Evaluation and Conclusions . . . . . . . . . . . . . . . . . . . . . . . . . . . . . . . . . . . . . . 4
3 Fuzzy Logic Based Approach 53.1 Suitability of a Fuzzy Logic Approach . . . . . . . . . . . . . . . . . . . . . . . . . . . . . . . . 53.2 Fuzzy Based Multimodal Speech Enhancement Framework . . . . . . . . . . . . . . . . . . . . . 5
3.2.1 Overall Design Framework of Fuzzy System . . . . . . . . . . . . . . . . . . . . . . . . 53.3 Fuzzy Logic Based Framework Inputs . . . . . . . . . . . . . . . . . . . . . . . . . . . . . . . . 6
3.3.1 Visual Quality Fuzzy Input Variable . . . . . . . . . . . . . . . . . . . . . . . . . . . . . 63.3.2 Audio Power Fuzzy Input Variable . . . . . . . . . . . . . . . . . . . . . . . . . . . . . . 73.3.3 Previous Frame Fuzzy Input Variable . . . . . . . . . . . . . . . . . . . . . . . . . . . . 8
3.4 Fuzzy Logic Based Switching Supervisor . . . . . . . . . . . . . . . . . . . . . . . . . . . . . . 9
4 Audiovisual Corpus 10
5 Experimental Results 105.1 Visual Quality Fuzzy Indicator . . . . . . . . . . . . . . . . . . . . . . . . . . . . . . . . . . . . 10
5.1.1 Problem Description . . . . . . . . . . . . . . . . . . . . . . . . . . . . . . . . . . . . . 105.1.2 Summary of Results . . . . . . . . . . . . . . . . . . . . . . . . . . . . . . . . . . . . . 12
5.2 Previous Frame Fuzzy Input Variable . . . . . . . . . . . . . . . . . . . . . . . . . . . . . . . . . 155.2.1 Problem Description . . . . . . . . . . . . . . . . . . . . . . . . . . . . . . . . . . . . . 155.2.2 Summary of Results . . . . . . . . . . . . . . . . . . . . . . . . . . . . . . . . . . . . . 16
5.3 Fuzzy System Audio Performance Evaluation . . . . . . . . . . . . . . . . . . . . . . . . . . . . 175.3.1 Objective Testing With Broadband Noise . . . . . . . . . . . . . . . . . . . . . . . . . . 185.3.2 Subjective Testing with Broadband Noise . . . . . . . . . . . . . . . . . . . . . . . . . . 195.3.3 Objective Testing with Inconsistent Transient Noise . . . . . . . . . . . . . . . . . . . . . 21
5.4 Fuzzy System Switching Performance Evaluation . . . . . . . . . . . . . . . . . . . . . . . . . . 235.4.1 Fuzzy Switching with Varying Noise Type . . . . . . . . . . . . . . . . . . . . . . . . . 235.4.2 Fuzzy Switching with Varying Visual Information . . . . . . . . . . . . . . . . . . . . . 255.4.3 Fuzzy Switching with Varying SNR Level . . . . . . . . . . . . . . . . . . . . . . . . . . 25

6 Discussion of Results 296.1 Fuzzy Input Variable Discussion . . . . . . . . . . . . . . . . . . . . . . . . . . . . . . . . . . . 296.2 Fuzzy Switching System Performance Evaluation . . . . . . . . . . . . . . . . . . . . . . . . . . 32
7 Conclusion 33
List of Figures1 High level diagram of two-stage speech filtering system presented in [1]. . . . . . . . . . . . . . . 32 System diagram of proposed fuzzy logic based two-stage multimodal speech enhancement system.
This is an extension of figure 1, with the addition of a fuzzy logic controller to receive inputs anddecide suitable processing options on a frame-by-frame basis. . . . . . . . . . . . . . . . . . . . 6
3 Diagram of fuzzy logic components, showing the three chosen fuzzy inputs and the list of rules tobe applied. . . . . . . . . . . . . . . . . . . . . . . . . . . . . . . . . . . . . . . . . . . . . . . . 6
4 Switching logic input parameter: visual detail level. Depending on the level of visual detail, theestimated parameter can be considered to be ’Good’ or ’Poor’ to varying extents. . . . . . . . . . 7
5 Switching logic input parameter: audio frame power, showing only membership functions forvalues ranging from 0 to 1.5. Depending on the level of audio power, the estimated parameter canbe considered to be ’None’, ’Low’, or ’High’. . . . . . . . . . . . . . . . . . . . . . . . . . . . . 8
6 Switching logic input parameter: previous frame output. This input variable considers the pro-cessing method chosen in the previous frame. Therefore, this input fuzzy set diagram matches theoutput choice. . . . . . . . . . . . . . . . . . . . . . . . . . . . . . . . . . . . . . . . . . . . . . 9
7 Speakers from recorded corpus, using sample frames taken from videos. . . . . . . . . . . . . . . 118 Examples of poor quality visual data due to issues with recording. The top image shows an
example of a glitch during recording, resulting in the face region being removed. The bottomimage shows a situation where light conditions have changed, resulting in a temporarily darkerimage. . . . . . . . . . . . . . . . . . . . . . . . . . . . . . . . . . . . . . . . . . . . . . . . . . 12
9 Examples of lip images regarded to be successfully detected. It can be seen that the images are ofvarying dimensionality, and also include different levels of additional facial detail depending onthe results of the Viola-Jones lip detector. . . . . . . . . . . . . . . . . . . . . . . . . . . . . . . 13
10 Examples of lip images regarded to be unsuccessfully detected. It can be seen that the images areof varying dimensionality, with issues such as identifying the wrong area of an image as the ROI,tracking only part of the lip-region, or poor quality information due to blurring and head motion. . 13
11 Examples of lip images where no ROI was identified and cropping was not successful. It can beseen that this is due to the speaker turning their head or obscuring their face. . . . . . . . . . . . . 13
12 Examples of lip tracker extracting an incorrect image for a sequence of frames. These frameswere consecutive frames from a single sentence and show that while a manual investigation mayidentify this as a partial result, the fuzzy input may be more nuanced, due to most of the mouthbeing present. . . . . . . . . . . . . . . . . . . . . . . . . . . . . . . . . . . . . . . . . . . . . . 15
13 Mean Opinion Score for overall speech quality for speech with washing machine noise added, foraudiovisual speech, audio-only beamforming, and fuzzy-based processing. . . . . . . . . . . . . . 20
14 Interaction plot for overall MOS at varying SNR levels, showing audiovisual speech (black and cir-cle markers), audio-only beamforming (red with square markers), and fuzzy-based system (greenwith diamond markers). . . . . . . . . . . . . . . . . . . . . . . . . . . . . . . . . . . . . . . . . 20
15 Composite objective mean test scores for overall speech quality for speech with transient clappingnoise added, for audiovisual speech, audio-only beamforming, fuzzy-based processing, audio-onlyspectral subtraction, and unprocessed speech. . . . . . . . . . . . . . . . . . . . . . . . . . . . . 22
16 Comparison of fuzzy logic output decision depending on noise type at SNR of 0dB. (a) showsthe input visual information. It can be seen that all values are below 600, therefore every frameis considered to be good quality. As the visual information is unchanged, then this is the samefor both transient and machine noise speech mixtures. (b) shows the transient mixture fuzzy inputvariable. (c) shows the associated transient noise mixture output processing decision. (d) showsthe machine noise mixture fuzzy input variable. (e) shows the machine noise mixture outputprocessing decision. . . . . . . . . . . . . . . . . . . . . . . . . . . . . . . . . . . . . . . . . . . 23

17 Comparison of fuzzy logic output decision depending on noise type at a SNR of -20dB. (a) showsthe input visual information. It can be seen that all values are below 600, therefore every frameis considered to be good quality. As the visual information is unchanged, then this is the samefor both transient and machine noise speech mixtures. (b) shows the transient mixture fuzzy inputvariable. (c) shows the associated transient noise mixture output processing decision. (d) showsthe machine noise mixture fuzzy input variable. (e) shows the machine noise mixture outputprocessing decision. . . . . . . . . . . . . . . . . . . . . . . . . . . . . . . . . . . . . . . . . . . 24
18 Fuzzy logic output decision depending on quality of visual information, for sentence with noframes considered to be of poor quality. (a) shows the input visual variable. It can be seen thatall values are below 600, therefore every frame is considered to be good quality. (b) shows theaudio input variable, with machine noise added to speech at an SNR of -30dB. (c) shows the fuzzyoutput processing decision. . . . . . . . . . . . . . . . . . . . . . . . . . . . . . . . . . . . . . 25
19 Fuzzy logic output decision depending on quality of visual information, for sentence with severalframes considered to be of poor quality. (a) shows the input visual variable. It can be seen thatthere are a small number of frames where there is considered to be poor visual input. (b) showsthe audio input variable, with machine noise added to speech at an SNR of -30dB. (c) shows thefuzzy output processing decision. . . . . . . . . . . . . . . . . . . . . . . . . . . . . . . . . . . 26
20 fuzzy logic output decision depending on quality of visual information, for sentence with severalframes considered to be of poor quality. (a) shows the input visual variable. It can be seen thatthere are a number of frames where there is considered to be poor visual input. (b) shows theaudio input variable, with machine noise added to speech at an SNR of -30dB. (c) shows the fuzzyoutput processing decision. . . . . . . . . . . . . . . . . . . . . . . . . . . . . . . . . . . . . . 27
21 Fuzzy logic output decision depending on SNR level. (a) shows the input audio waveform, withspeech and noise mixed at a SNR of -40dB. (b) shows the audio input variable. (c) shows thevisual input variable, with a small number of frames considered to be of low quality. Finally, (d)shows the fuzzy output decision. . . . . . . . . . . . . . . . . . . . . . . . . . . . . . . . . . . . 28
22 Fuzzy logic output decision depending on SNR level. (a) shows the input audio waveform, withspeech and noise mixed at a SNR of -20dB. (b) shows the audio input variable. (c) shows thevisual input variable, with a small number of frames considered to be of low quality. Finally, (d)shows the fuzzy output decision. . . . . . . . . . . . . . . . . . . . . . . . . . . . . . . . . . . . 29
23 Fuzzy logic output decision depending on SNR level. (a) shows the input audio waveform, withspeech and noise mixed at a SNR of -10dB. (b) shows the audio input variable. (c) shows thevisual input variable, with a small number of frames considered to be of low quality. Finally, (d)shows the fuzzy output decision. . . . . . . . . . . . . . . . . . . . . . . . . . . . . . . . . . . . 30
24 fuzzy logic output decision depending on SNR level. (a) shows the input audio waveform, withspeech and noise mixed at a SNR of +10dB. (b) shows the audio input variable. (c) shows thevisual input variable, with a small number of frames considered to be of low quality. Finally, (d)shows the fuzzy output decision. . . . . . . . . . . . . . . . . . . . . . . . . . . . . . . . . . . . 31
List of Tables1 Overall performance of visual quality fuzzy input variable compared to manual scoring, consider-
ing each frame of all 20 speech sentences. . . . . . . . . . . . . . . . . . . . . . . . . . . . . . . 132 Comparison of assigned values for overall 20 sentence dataset, showing difference in estimated
value for manual inspection and fuzzy logic variable. . . . . . . . . . . . . . . . . . . . . . . . . 143 Error between estimated visual fuzzy input and manual value for each frame of all 20 speech
sentences. . . . . . . . . . . . . . . . . . . . . . . . . . . . . . . . . . . . . . . . . . . . . . . . 144 Comparison of assigned values for 10 sentence reading dataset, showing difference in estimated
value for manual inspection and fuzzy logic variable. . . . . . . . . . . . . . . . . . . . . . . . . 145 Comparison of assigned values for 10 sentence conversation dataset, showing difference in esti-
mated value for manual inspection and fuzzy logic variable. . . . . . . . . . . . . . . . . . . . . . 156 Number and percentage of frames with a difference in fuzzy output decision greater than or equal
to 1, compared to previous frame. . . . . . . . . . . . . . . . . . . . . . . . . . . . . . . . . . . 16

7 Number and percentage of frames with any difference of in fuzzy output decision compared toprevious frame, showing results when smoothing rule is enabled and disabled for one frame, meanof 3 frames, mean of five frames, and mean of 10 frames. . . . . . . . . . . . . . . . . . . . . . 17
8 Composite objective mean test score table for overall speech quality for speech with washingmachine noise added, for audiovisual speech, audio-only beamforming, fuzzy-based processing,audio-only spectral subtraction, and unprocessed speech. . . . . . . . . . . . . . . . . . . . . . . 18
9 Composite objective mean test score table for speech score speech quality for speech with washingmachine noise added, for audiovisual speech, audio-only beamforming, fuzzy-based processing,audio-only spectral subtraction, and unprocessed speech. . . . . . . . . . . . . . . . . . . . . . . 18
10 Composite objective mean test score table for noisy speech quality for speech with washingmachine noise added, for audiovisual speech, audio-only beamforming, fuzzy-based processing,audio-only spectral subtraction, and unprocessed speech. . . . . . . . . . . . . . . . . . . . . . . 18
11 Selected results of Bonferroni Multiple Comparison, showing P-Value results for difference be-tween Audiovisual Filtering and Fuzzy Processed Speech with washing machine noise added foroverall composite scores. . . . . . . . . . . . . . . . . . . . . . . . . . . . . . . . . . . . . . . . 19
12 Selected results of Bonferroni Multiple Comparison, showing P-Value results for difference be-tween Audio-only beamforming and Fuzzy Processed Speech with washing machine noise addedfor overall composite scores. . . . . . . . . . . . . . . . . . . . . . . . . . . . . . . . . . . . . . 19
13 Selected results of Bonferroni Multiple Comparison, showing P-Value results for difference be-tween Audio-only beamforming and Fuzzy Processed Speech for overall subjective scores. . . . . 20
14 Selected results of Bonferroni Multiple Comparison, showing P-Value results for difference be-tween Audiovisual Filtering and Fuzzy Processed Speech for overall subjective scores. . . . . . . 21
15 Selected results of Bonferroni Multiple Comparison, showing P-Value results for difference be-tween Audio-only beamforming and Fuzzy Processed Speech with transient clapping noise addedfor overall composite scores. . . . . . . . . . . . . . . . . . . . . . . . . . . . . . . . . . . . . . 22
16 Selected results of Bonferroni Multiple Comparison, showing P-Value results for difference be-tween Audiovisual Filtering and Fuzzy Processed Speech with transient clapping noise added foroverall composite scores. . . . . . . . . . . . . . . . . . . . . . . . . . . . . . . . . . . . . . . . 22

1 IntroductionThe multimodal nature of both human speech production and perception is well established. The relationshipbetween audio and visual aspects of speech has been investigated in the literature, demonstrating that speechacoustics can be estimated using visual information. This information has become relevant to the field of speechenhancement in recent years. This is a very active field of research, with a number of practical applications,such as improved hearing aids [2] or better surveillance equipment. In recent decades, many different audio-onlyspeech enhancement solutions have been proposed, such as [3], [4], and [5].
1.1 BackgroundA common speech filtering technique is to use multiple microphone techniques such as beamforming that canimprove speech quality and intelligibility by exploiting the spatial diversity of speech and noise sources [6], [7].An alternative speech enhancement technique is to make use of Wiener filtering [8], which compares the noisysignal to an estimate of the noise free speech signal. There are also approaches such as that proposed by Zelinski[3] and refined by others, including [9], [10], and [11] that propose a two stage audio-only speech enhancementsolution that makes use of both adaptive beamforming and Wiener filtering in a single integrated system. In realworld applications where the noise and environment are not consistent, conventional single stage beamforminghas practical limitations, and is the subject of much active research [5], [12]. Efforts have been made to solvethis issue with the use of visual information [13], [14], [15], for aiding source separation, demonstrating thatmultimodal speech filtering is feasible.
The multimodal nature of both perception and production of human speech is well established. Speech isproduced by the vibration of the vocal cords and the configuration of the vocal tract, which is composed ofarticulatory organs. Due to the visibility of some of these articulators (such as lips, teeth and the tongue), thereis an inherent relationship between the acoustic and visible properties of speech production. The relationshipbetween audio and visual aspects of speech perception has been established since pioneering work by Sumby andPollack in 1954 [16], which demonstrated that lip reading improves the intelligibility of speech in noise whenaudiovisual perception is compared with equivalent audio-only perception. This was also confirmed by others[17], including in work by Summerfield in 1979 [18]. Classically, this work reports gains in the region of 10-15dBwhen compared to audio-only perception results [19]. This is further demonstrated by the well-known McGurkeffect [20], which provides a physical demonstration of the relationship between hearing and vision in terms ofspeech perception. This cognitive link between audio and visual information is further demonstrated in workconcerning audio and visual matching in infants by Patterson and Werker [21], [22]. This correlation betweenaudio and visual modalities can also be seen in studies of primates [23].
Further confirming the cognitive links between modalities, it has been shown that speech is perceived to soundlouder when the listener looks directly at the speaker [24], as if audio cues are visually enhanced [25]. In addition,work by researchers including Kim and Davis [26], and Bernstein et al. [27], has shown that visual informationcan improve the detection of speech in noise [28]. In addition to the gain in speech detection, work by Schwartzet al. [24] also investigated if visual cues present in speech information could produce a gain in intelligibilityby using French vowels with very similar lip information and then dubbing different (but very similar) audioinformation over it. Despite the information not matching, a gain in intelligibility was identified when audiovisualinformation was used, suggesting that audio and visual information are integrated at a very early stage.
Studies have also shown that when informational masking (such as a competing speaker) is considered, visualinformation can have a dramatic effect, including research by Helfer and Freyman [29], and Wightman et al [30].An additional detailed discussion of audiovisual speech perception is presented in [31], and a further detailedsummary can be found in work by the authors in [1]. In addition, the correlation between audio and visual aspectsof speech has been deeply investigated in the literature [32], [33], [34], and in work by the authors [35], [36],showing that facial measures provide enough information to reasonably estimate related speech acoustics.
The connection between modalities demonstrates the cognitive nature of hearing. The improvement found inperception and detection of speech when the visual information is involved, along with the multimodal illusiondemonstrated by the McGurk effect, shows that the process of hearing involves cognitive influence. In addition,the switch in attention focus to use varying amounts of visual information depending on relevance, and also theuse of visual cues shows that there is a significant degree of processing in the brain.
Since pioneering multimodal speech enhancement techniques proposed by Girin et al. [37], there has beenmuch development in this field [38], [39]. Recent work has included research by Almajai et al. [40], whomake use of visual information, phoneme based speech segmentation, and a Voice Activity Detector (VAD). The
1

system combines both visual and audio feature extraction, a multimodal VAD, a visually derived Wiener filteringapproach, takes account of the level of noise when it comes to phoneme decoding, and filters the signal differentlydepending on the phoneme identified. The authors report good results, however there are some limitations to thework, such as being trained with a limited training set, the system as presented being strongly reliant on visualinformation, and not taking account of situations without suitable camera input (such as a moving source or lightlevel changes). A recent paper by Abel and Hussain [1] presented a two stage speech enhancement approachthat made use of visually derived Wiener filtering and beamforming. It was concluded that this approach couldfunction effectively in several scenarios (such as extremely noisy environments with an SNR below -20dB), butdid not perform well in all instances (such as when visual information is not available).
1.2 Contribution of this PaperIn this paper, we build on previous audiovisual speech processing work by the authors [36], [35] [1] to presenta cognitively inspired multimodal speech filtering system, making use of both visual and audio information toenhance speech. A multistage speech enhancement system was previously presented by the authors [1], that com-bines both audio and visual information for speech filtering. In this system, noisy speech information received bya microphone array was first pre-processed by Wiener filtering; making use of matching visual speech informationto estimate speech information using an audiovisual model (trained using offline information). This pre-processedspeech is then enhanced further by audio beamforming using a state of the art general transfer function generalisedsidelobe canceler (TFGSC) [6] approach.
The results presented in previous work showed the effectiveness of making use of visual information in envi-ronments with significant levels of background noise, but also identified some limitations with the performance ofthis approach. One such limitation was the use of visual information in scenarios when it was not considered to besuitable. This includes when visual information is not available (for example, due to movement of the speaker), orwhen it is considered to have a negative effect on speech filtering performance (such as in a higher SNR, as foundby Abel and Hussain [1]). This paper presents a cognitively inspired approach that follows the attention switchingmodel, where humans make intermittent use of visual information when available. To do this, our original speechfiltering system presented in [1] is refined with the use of a fuzzy-logic system. With this system, the audio andvisual information is extracted, and a number of fuzzy-logic detectors are then applied. These consist of a leveldetector, a previous frame output, and a visual quality detector. The detectors are used to determine the mostsuitable form of processing to utilise to filter individual frames of an input speech sentence, depending on theinput fuzzy detectors.
To test this system, a corpus of challenging novel data has been recorded, and the results show that the leveldetectors function appropriately as part of a fuzzy logic system, and in turn, the fuzzy logic based cognitivelyinspired filtering is capable of switching between filtering methods correctly depending on environmental condi-tions. Some further limitations with the overall approach are then identified, as visually derived filtering producespoor filtering results when presented with completely novel data that does not resemble that which it has beentrained with, and so while the switching results are positive, the resulting speech requires further improvement.
The remainder of this paper is divided up as follows. Section 2 summarises our previous two-stage audiovisualspeech filtering system and the results previously presented in [1]. The justification and rationale behind the novelcognitively inspired fuzzy logic based system presented in this work is discussed in section 3, as well as a fulldescription of the new system. The novel corpus recorded to test this work is described in section 4, and thenresults are presented in section 5. Limitations, strengths, and possible refinements are discussed in section 6, andfinally, section 7 concludes this paper and briefly outlines future research directions.
2 Previous Research Findings
2.1 Previous Audiovisual SystemThis work makes use of a recently developed visual tracking technique [41], for visual feature extraction, and usesthis as part of a visually derived Wiener filtering system to enhance noisy audio speech signals. The Wiener filteruses Gaussian Mixture Regression (GMM-GMR) [42] to provide an estimate of a noiseless speech signal, trainedoffline with clean audio speech from a number of speakers, based on extracted visual information. This initialsystem is trained using a limited number of speakers, limiting the scope of this work. However, the frameworkis scalable, with potential for expanding the generality of the system. This initially pre-processed speech is then
2

Figure 1: High level diagram of two-stage speech filtering system presented in [1].
filtered with an audio-only TFGSC beamformer. To the knowledge of the authors, this component based two stageframework was not previously demonstrated by any other work in this field. The initial framework presented in[1] is shown in figure 1.
In a previous paper [1], we presented a novel two stage audiovisual speech filtering system that makes useof visually derived pre-processing and audio based beamforming to enhance convolved speech mixtures. Thisapproach extends the idea of two stage audio-only speech enhancement systems to become multimodal with theuse of visual information to pre-process noisy speech signals as part of this system. This system is described infull depth in [1], with a brief summary provided in this section.
2.1.1 Reverberant room environment
In order for speech filtering to be performed in an experimental environment, the speech and noise sources have tobe mixed. A simple additive mixture does not take into account factors such as the difference in location of sourceand noise, atmospheric conditions such as temperature and humidity, or reverberation (a natural consequence ofbroadcasting sound in a room). Here, the noisy speech mixtures used are mixed in a convolved manner. To dothis, a simulated room environment is used, with the speech and noise sources transformed with the matchingimpulse responses. Impulse responses represent the characteristics of a room when presented with a brief audiosample, and these are then applied to the speech and noise signals in the context of their location within thesimulated room. This gives them the characteristics of being affected by environmental conditions with regard tomicrophone input. These sources are then convolved.
2.1.2 Multiple microphone array
In the reverberant room environment, there is an assumption that the signal and noise sources originate fromdifferent locations. Within this simulated room, the convolved signals are then mixed and then received by anarray of microphones within this room (in a similar manner to directional microphones used in hearing aids). In[1], we specified an array of four microphones, positioned 8 cm apart. This results in four convolved noisy audiosignals for processing. These are then Fourier transformed and used for further processing.
2.1.3 Audio feature extraction
The Fourier transformed signals are then used as part of the visually derived filtering process. The signals aretransformed again to produce the magnitude spectrum, and subsequently log filterbank values for each microphoneinput.
2.1.4 Visual Feature Extraction
For each speech sentence, matching visual features are then extracted. This is carried out by using a visual trackingapproach [41] to identify the lip region for each frame of a speech sentence. A 2 dimensional Discrete Cosine
3

Transform was then performed on the extracted lip region to convert the data into a usable format, and this wasthen upsampled to take account of the difference between sampling rates of the audio and visual signal. This wascarried out by duplicating each DCT vector a number of times to match the audio sample rate.
2.1.5 Visually Derived Wiener Filtering
Wiener filtering [8] is a signal processing technique that aims to clean up a noisy signal by comparing a noisyinput signal with an estimation of a noiseless signal [43], [3]. One challenging aspect of Wiener filtering isthe acquisition of an estimation of the noiseless signal. Unlike some other speech filtering approaches, someknowledge of the original signal is required.In this work, visual information is used to produce an estimate of thenoise free signal, which is compared to the transformed noisy audio information to produce a filtered signal. Thisrepresents the first stage of filtering in this two-stage approach. The noise free signal is estimated from a trainedaudiovisual speech model.
2.1.6 Gaussian Mixture Model for Audiovisual Clean Speech Estimation
To estimate the noise free signal, the visual DCT information is used as an input into a Gaussian Mixture Regres-sion (GMR) [42] model, a technique originally designed for training a robot arm. This was trained using a largeaudiovisual training set comprising of related clean audio filterbank and visual DCT vectors. To then produce anestimated noise free signal, the visual information is used as an input into the trained model, which outputs anestimated noise free signal that can be used for Wiener filtering.
2.1.7 Beamforming
Multiple microphone techniques such as beamforming can improve the quality and intelligibility of speech byexploiting the spatial diversity of speech and noise sources to filter speech. In Abel and Hussain [1], a beamformerproposed orignally by Gannot et al. [6] is used to remove noise from unwanted directions, as the second stageof the filtering process (after visually derived filtering). This involves a fixed beamformer(FBF), a blockingmatrix(BM), and a multichannel adaptive noise canceller (ANC). The FBF is an array of weighting filters thatsuppresses or enhances signals arriving from unwanted directions. The column of the BM can be regarded as aset of spatial filters suppressing any component impinging from the direction of the signal of interest, and thesesignals are used by the ANC to construct a noise signal to be subtracted from the FBF output. This techniqueattempts to eliminate stationary noise that passes through the fixed beamformer, yielding an enhanced outputsignal. An inverse Fourier transform is then performed to produce the enhanced final single output audio signal.
2.2 Evaluation and ConclusionsTo evaluate this framework, firstly, the system was tested in environments with very low SNR levels (ranging from-40dB to +10dB). Aircraft noise was added to sentences from the GRID audiovisual speech corpus in a simulatedroom environment to create convolved noisy mixtures with low SNR levels. It was shown with performanceevaluation measures and listening tests that in these environments, this two-stage audiovisual solution producesimproved results when compared to unfiltered noise and an audio-only spectral subtraction approach, suggestingthat in extremely noisy environments, an element of visual processing can be used effectively as part of a speechenhancement system. Secondly, a noisy speech mixture containing an intermittent clapping and silence noisewas presented. It was shown that without the visual pre-processing, the basic audio-only beamformer deliveredunusable results. With the addition of the visual pre-processing stage though, the multimodal system was thenable to produce usable results.
The system was then thoroughly tested with speech sentences from a corpus that was not used for any partof the training process. It was shown that the results were significantly worse when a different corpus was usedfor testing, demonstrating that there were some limitations with the system. Significantly, the approach used foraudiovisual modelling was found to perform very poorly when tested with a completely novel data, suggestingthat this technique is not an optimal approach.
It was established that although the GMM-GMR based approach evaluated in the previous paper can deliverpositive results, it does introduce distortion into the overall results, especially at high SNR levels, which suggeststhat the initial audiovisual model used within this framework for visually derived Wiener filtering can be improvedfurther, and that when presented with completely new visual data, i.e. speakers which the system has not been
4

trained with, the model used in this paper does not adequately generalise at this time. Although this is a commonproblem for multimodal speech filtering systems, this is an aspect which will be refined in future work.
A key limitation of the initial system that was identified was that the variation in performance between ap-proaches at different noise levels suggests that there is not a single speech enhancement approach that is guaranteedto deliver optimum results in all conditions. It can be seen that visual information has a big impact in very noisyenvironments, but hinders results when there is less noise. Furthermore, this initial work did not take account ofscenarios such as those where there is no visual information available, such as a situation where the speaker hashis head turned or changes in light conditions mean that the lip region of the speaker cannot be seen. This meansthat audio and visual information need to be used intelligently, depending on availability and suitability of inputinformation. Existing commercially available hearing aids make use of decision rules to decide on the level ofspeech filtering to apply. As reported by [44], hearing aids exist that can take account of a number of detectors toanalyse the input signal in order to classify the noise. Such an idea can also be seen in neuro-fuzzy systems suchas by [45] that again seek to classify noise.
3 Fuzzy Logic Based Approach
3.1 Suitability of a Fuzzy Logic ApproachThis work proposes to extend the initial multimodal system to make use of audio and visual information in amore autonomous, adaptive and context aware manner using a fuzzy logic controller. This allows for this initialsystem to be extended in the future with a number of different detectors, as used in other commercial hearing aids([46]). When a modern programmable hearing aid is provided, patients are expected to undergo fitting sessions,where their hearing aid is programmed to better fit their individual hearing loss and comfort levels. Therefore, anyproposed system should contain accessible parameters that can be tweaked and tailored in order to adapt to thehearing ability and preferences of the user.
Several approaches were considered for use as part of this system, such as making use of ANNs, GMMs,HMMs, or a hybrid of these approaches, such as neuro-fuzzy approaches, which use fuzzy inference inputs intoa neural network ([45, 47]). Fuzzy logic is an approach that allows for uncertainty to be represented, thereforeit is context aware, in that it is capable of responding to different changes in the environment, based on inputsinto the system. It is also adaptive, in that it can respond to these inputs, so in the system presented here, thedifferent inputs provide information about the environmental context (such as the level of noise), the fuzzy-systemmakes a decision regarding the suitable processing choice, depending on this input. It is also is based on expertknowledge; this means that there are a number of rules that can be programmed and tweaked. The preliminarysystem represented here makes use of very basic detectors, and could theoretically be represented using a differentapproach, such as with HMMs. However, it would arguably be more difficult to extend, train and implement amore sophisticated version of a HMM based system in future, whereas a fuzzy logic system ([48]) is easier torefine and extend, due to its use of expert knowledge and the clearly defined rule base. The initial two-stagesystem presented in [1] is extended with the addition of a fuzzy logic controller and a number of fuzzy inputs.
3.2 Fuzzy Based Multimodal Speech Enhancement Framework3.2.1 Overall Design Framework of Fuzzy System
To integrate the fuzzy logic controller into the multimodal framework described in section 2, the initial systemshown in figure 1 is extended further by the integration of a fuzzy logic controller and the subsequent adjustmentof the speech filtering options. The same Wiener filtering and beamforming processing options are used. Visualtracking and feature extraction is handled in much the same manner, as is the audio feature extraction process.The only addition is to replace the manual identification of the initial lip region with a Viola-Jones [49] detector,developed by Kroon [50]. With regard to speech processing, the two processing options, visually derived Wienerfiltering and audio-only beamforming remain unchanged. However, the difference is that one or both of thesestages may be bypassed on a frame-by-frame basis, depending on the inputs received by the fuzzy logic controller.This redesigned framework is shown in figure 2.
The diagram in figure 2 shows the high level extended system diagram with the alternative speech processingoptions. Depending on the inputs to the fuzzy logic controller, the type of processing performed on the input signalmay vary from frame-to-frame. So for example, if it is detected that there is very little audio activity in a particularframe, then it may be decided to leave that frame unfiltered. Alternatively, if a moderate amount of audio energy
5

Figure 2: System diagram of proposed fuzzy logic based two-stage multimodal speech enhancement system. Thisis an extension of figure 1, with the addition of a fuzzy logic controller to receive inputs and decide suitableprocessing options on a frame-by-frame basis.
Figure 3: Diagram of fuzzy logic components, showing the three chosen fuzzy inputs and the list of rules to beapplied.
is detected, then it may be decided that audio-only beamforming is the most appropriate processing method. Ifhowever, a lot of audio activity is detected in a particular frame and the visual information is considered to be ofgood quality, then the full two-stage process may be used.
The decision as to which option is to be used is taken with the aid of a number of detectors applied to theinput signal. Audio-only hearing aids make use of a wide range of proprietary detectors such as level, wind andmodulation detectors. In this work, three detectors are used. An audio level detector, a visual quality detector,and a feedback input of the processing decision made in the previous frame. Fuzzy logic rules are then used todetermine the most suitable processing method, and each individual frame is processed individually.
3.3 Fuzzy Logic Based Framework InputsThe fuzzy logic controller builds a relationship between system inputs and the rules used to define the processingselection. In order to accomplish this, it takes a number of input variables and applies these to fuzzy logic rules.Each input variable must be decomposed into a set of regions (or fuzzy sets), consisting of a number of membershipfunctions. The composition of these membership functions can vary in size and shape, based on the preference ofthe designer ([51]), trapezoid membership functions were used for all inputs in order to ensure consistency. Thefuzzy-system diagram is shown in figure 3, and there are three inputs to consider, audio level, visual quality, andprevious frame processing decision.
3.3.1 Visual Quality Fuzzy Input Variable
The first input variable is the visual quality. This measures the level of detail found in each cropped ROI. As thesystem is audiovisual, visual information is a key component of the processing. However, this information canbe of varying quality. There are occasions when the entire lip region is visible, but there are also occasions whenthe lip-tracker returns an incorrect result due to scenarios such as the speaker turning their head. There are alsooccasions when the lip region may be blurred due to movement, or only a partial ROI is returned. In real world
6

0 1000 2000 3000 4000 5000 6000
0
0.2
0.4
0.6
0.8
1
De
gre
e o
f M
em
be
rsh
ip
Good Poor
Visual Quality Fuzzy Input Variable − Membership Functions
Figure 4: Switching logic input parameter: visual detail level. Depending on the level of visual detail, the esti-mated parameter can be considered to be ’Good’ or ’Poor’ to varying extents.
environments, there are many more examples of poor visual data to take account of than found in conventionalaudiovisual speech databases [52], [53].
As there were many different potential speakers, an approach with as much flexibility as possible was required.One potential approach was to make use of a machine learning technique such as a HMM to create a model toevaluate the ROI and return a score to use as a fuzzy input variable. However, it was felt that this was not requiredfor the initial implementation presented here. Instead, a simpler approach was devised that made use of the inputDCT vector. A custom corpus was recorded using real data from a variety of volunteers, as will be discussed insection 4, and a number of trial videos were evaluated to calculate the most suitable value, with various variablesinvestigated, such as the DCT input vector, and the tracker parameters of the actual cropped images. It wasestablished that the fourth DCT coefficient was consistently a better representation of the accuracy of the croppedDCT than any other single factor, and so this was used to create a mean value. As the DCT transform representspixel intensity, it was calculated that while the value of this would vary from image to image, the fourth coefficientvalue would remain relatively consistent. Therefore, for each frame, the absolute value (converting negative valuesto positive) of the fourth DCT coefficient was calculated. This was then compared to a moving average of up tothe 10 previous frames that were considered to also be of good quality, and the difference between this movingaverage and the coefficient represented the visual input variable.
To create this moving average, one assumption was made, that the first value of each sentence was successfullyidentified with a Viola-Jones detector ([49]). This first value was used as the initial moving average mean value.For the second frame onwards, the new value was compared to the mean of the moving average. If the new valuewas considered to be within a threshold (preliminary trials identified an appropriate threshold to be 2000), thenthis value was considered to be suitable, and so was added to the moving average. To take account of variationsin speech from frame-to-frame, only a maximum of the 10 most recent values were considered as part of themoving average. This moving average threshold aims to minimise incidences of incorrect results being added tothe moving average. The trapezoidal membership functions are shown in figure 4.
Figure 4 shows that there are two membership functions, ’Good’ and ’Poor’. The lower the input value, thecloser to the mean and therefore the better the frame of visual data was considered to be. It was considered thata visual quality value of less than 800 was definitely an example of a good frame of visual information. Between800 and 2000, then it could be sometimes considered a partial member of the good set in that there was someambiguity depending on the speaker, and also there were examples of partial frames (where only part of the ROIwas accurate), justifying the decision to use fuzzy logic.
3.3.2 Audio Power Fuzzy Input Variable
The second input variable is the audio power level. This considers the level of acoustic activity in an individualframe of speech. This variable does not consider the problem of voice activity detection, and so does not attempt to
7

0 0.5 1 1.5
0
0.2
0.4
0.6
0.8
1
Input Value − Audio Power
De
gre
e o
f M
em
be
rsh
ip
None Low High
Audio Power Fuzzy Input Variable − Membership Functions
Figure 5: Switching logic input parameter: audio frame power, showing only membership functions for valuesranging from 0 to 1.5. Depending on the level of audio power, the estimated parameter can be considered to be’None’, ’Low’, or ’High’.
distinguish between speech and noise. It is possible to devise an audiovisual VAD ([43]), and this could representfuture potential development as an additional input detector, but it was felt that the most important factor withregard to the proof of concept system was identifying the level of the audio input as in a real environment the levelof noise does not remain consistent, and can change from frame-to-frame. In terms of the various conventionalhearing-aid input detectors, this input variable functions in a similar manner to a level detector ([46]).
To calculate the audio power in each input speech frame, the frame is first converted back to the time domain,and the mean of the absolute values of the frame is then found. This represents the level of the audio power.The fuzzy set that the audio power input variable belongs to is then calculated based on this input, as shown infigure 5. To take account of extremely noisy input variables, due to the extremely low SNR that the system istested with, the largest trapezoidal membership function, has a maximum value of 25. Figure 5 shows only thefuzzy membership functions for values less than 1.5, with all values above this considered to belong to the ’High’function.
Figure 5 shows that if the level is recorded as being very low (less than 0.015), it is considered to belong tothe ’None’ membership function. However, as the level detector is very sensitive, it can be seen that any positivelevel (ranging from 0.009 to 0.5) is also part of the ’Low’ fuzzy-set to an extent. Finally, any values greater than0.4 were considered to be a member of the ’High’ set to an extent, and values greater than 0.9 were considered tofully belong to the ’High’ set. These values were set by using trial data.
3.3.3 Previous Frame Fuzzy Input Variable
The third input is a feedback variable that uses the fuzzy controller output from the previous frame. The threetrapezoidal membership functions can be seen in figure 6, which is valid for the representation of both the con-troller output and the third input. The reason for this third input is to act as a smoothing function in marginalcases. For example, the audio and visual inputs may produce input variables that lie near the thresholds betweentwo possible processing options. Small changes in subsequent frames may produce a radically different process-ing decision from frame-to-frame. As a consequence, the output sound quality may be of poor listening comfort(as is sometimes found in conventional hearing aids when the engage/adaption/attack configuration is set poorly,resulting in a ’choppy’ sound, as discussed by [46]).
The use of the previous frame output is designed to limit this. This performs the role of engage/adaption/attackconfiguration in this preliminary system, as it introduces what is effectively a small delay into processing changes.The use of a mean of several frames as part of an input variable was also considered, and the results of anevaluation of using a different number of frames as part of a mean is presented in section 5. It was concludedfrom this evaluation that there was no noticeable improvement when using a mean of 3, 5, or 10 previous frames.Therefore, it was considered suitable to use the single previous output value as an input variable. There are
8

0 1 2 3 4 5 6 7 8 9 10
0
0.2
0.4
0.6
0.8
1
Input Value − Previous Frame Decision
De
gre
e o
f M
em
be
rsh
ip
None Aud Avis
Previous Fuzzy Decision Variable − Membership Functions
Figure 6: Switching logic input parameter: previous frame output. This input variable considers the processingmethod chosen in the previous frame. Therefore, this input fuzzy set diagram matches the output choice.
three membership functions, with each one corresponding to a processing decision ’None’ (meaning to leave theframe unprocessed), ’Aud’ (meaning to use audio-only beamforming), and ’Avis’, meaning to use the audiovisualapproach. These match the output decision fuzzy sets.
3.4 Fuzzy Logic Based Switching SupervisorIn this framework, the fuzzy logic controller is used to determine the most suitable speech processing method toapply to an individual frame of speech, based on the fuzzy input variables defined in the previous section. Theinput variables are the audio level (audSigPow), visual quality (visQuality), and the previous frame controlleroutput (prevFrame). An input variable may simultaneously belong to more than one fuzzy set to varying extents.
The processing output options are no processing (a), audio-only processing (b), or two-stage audiovisualprocessing (c). The complete set of rules used in this system is listed as follows:
• Rule 1: IF audioSigPow IS low AND visQuality IS poor THEN process is b
• Rule 2: IF audioSigPow IS none AND visQuality IS poor THEN process is a
• Rule 3: IF audioSigPow IS high AND visQuality IS good THEN process is c
• Rule 4: IF audioSigPow IS none THEN process is a
• Rule 5: IF audioSigPow IS low AND visQuality IS Good AND prevFrame IS avis THEN process is c
• Rule 6: IF audioSigPow IS low AND visQuality IS Good AND prevFrame IS aud THEN process is b
Rule 1 activates audio-only processing if the audio input variable belongs to the ’Low’ fuzzy set and thevisual quality is defined as being ’Poor’. Rules 2 and 4 ensure that the frame is left unfiltered if the audio levelis found to be so low that the audio level is defined as being ’None’. Rule 3 activates audiovisual processing ifthere is a sufficient level of noise, and if visual information of an adequate quality is available. Rules 5 and 6are designed to take effect in scenarios where the potential choice of processing algorithm is ambiguous. If theaudio level is defined as ’Low’, but ’Good’ quality visual information is available, then the previous frame inputis also considered. Rule 5 activates audiovisual processing if the previous frame output was also audiovisual, andrule 6 activates audio-only processing if the previous frame decision was audio-only. This is intended to ensurecontinuity between frames and prevent rapid frame-by-frame changes that act as an irritant to listeners.
9

4 Audiovisual CorpusTo demonstrate the performance of the fuzzy logic based system, it was considered a requirement to use chal-lenging real world speech data. For this, it was considered necessary to record novel data, the corpora used inprevious work by the author (such as VidTimit [52] and GRID [53]) were not considered to be entirely suitable,due to limitations in content and variation of quality. To provide a diverse range of audiovisual speech data, and toprovide challenging data that the pre-existing corpora used in previous work (GRID and VidTIMIT) fail to supply,volunteers were asked to perform two tasks. Firstly, a reading task, where they read either a short story or a newsarticle. For this task, they were recorded reading for a minute in a quiet environment.
The second scenario was a conversational task, where volunteers were encouraged to speak in a more naturalmanner. Volunteers were recorded in pairs at a table facing each other, with one speaker recorded at a time for oneminute. By this it is meant that while the speakers were facing each other and making conversation, the camerawas only pointed at one speaker. This allowed more natural and relaxed speech, and the volunteers were also toldthat they were allowed to move freely and did not have to look directly into the camera at all times. This resultedin more noisy visual data such as head turning, speakers placing their hands over their mouths, and blurring inindividual frames due to motion. As this was a conversation rather than continuous speech from a single recordedspeaker, there were occasional silences, or speech from the other participant in the conversation. This providedchallenging data which the system has not been trained with.
To record volunteers carrying out the tasks described above, a single camera was used with an integratedmicrophone. Due to equipment limitations, the visual data was recorded at 15 fps at a resolution of 640 x 480.For each speaker, there were two minutes of initial raw data available. The final corpus contained data from eightspeakers, four male, four female. Six of the eight speakers spoke English (five with a Scottish accent and oneEnglish), and two were recorded speaking Bulgarian. For each speaker, two minutes of raw data were theoreticallyavailable, one minute of conversation, and of reading. Some example frames of the recorded volunteers are shownin figure 7.
However, there were some issues with the recording process. Firstly, the video camera had automatic bright-ness adjustment enabled, and so a small number of frames were considerably darker due to occasional automaticreadjustment. An example of this can be seen in the lower image in figure 8. There were also a number of glitchesin the recording that were discovered afterwards during the review of the data. An example of this can be seen inthe top image in figure 8. In this image, the camera has not recorded the head of the speaker in a single frame,although in subsequent and preceding frames, the head is not missing. One other issue was that the recording didnot function correctly for one speaker, with some synchronisation issues between audio and visual data. For thisreason, there is limited data available from one pair of volunteers.
As part of the requirement for the visual data to be challenging, speakers were expected to move naturally.This led to variable quality visual data, with speakers covering their mouth and turning their head, meaning thatlip information is not available, and the ROI therefore cannot be correctly identified. There is also blurring presentin this image due to movement. This will be resolved in future work by using a higher quality camera.
The data was divided into 20 second clips because of processing and testing requirements. This sentencelength was felt to be long enough to test the operation of the fuzzy-system, while still being short enough toprocess relatively efficiently. A number of these 20 second clips were then chosen for use as part of the testingprocess. These were chosen to represent a mixture of different conditions and data quality. The resulting visualdata was of variable quality, containing considerably different speech sentences and speakers from those that thesystem had been previously trained with with examples of turning and movement, as well as varying audio qualitydue to noise.
5 Experimental Results
5.1 Visual Quality Fuzzy Indicator5.1.1 Problem Description
There was an assumption made that the initial image frame was accurately detected, and subsequent frames werecalculated in terms of the difference from the mean of the absolute value of the fourth DCT coefficient. To takeaccount of natural movement over time, a moving average of the previous 10 frames was used, with only framesthat were considered to be within a set threshold added to the moving average. This value was then used as the
10

Figure 7: Speakers from recorded corpus, using sample frames taken from videos.
11
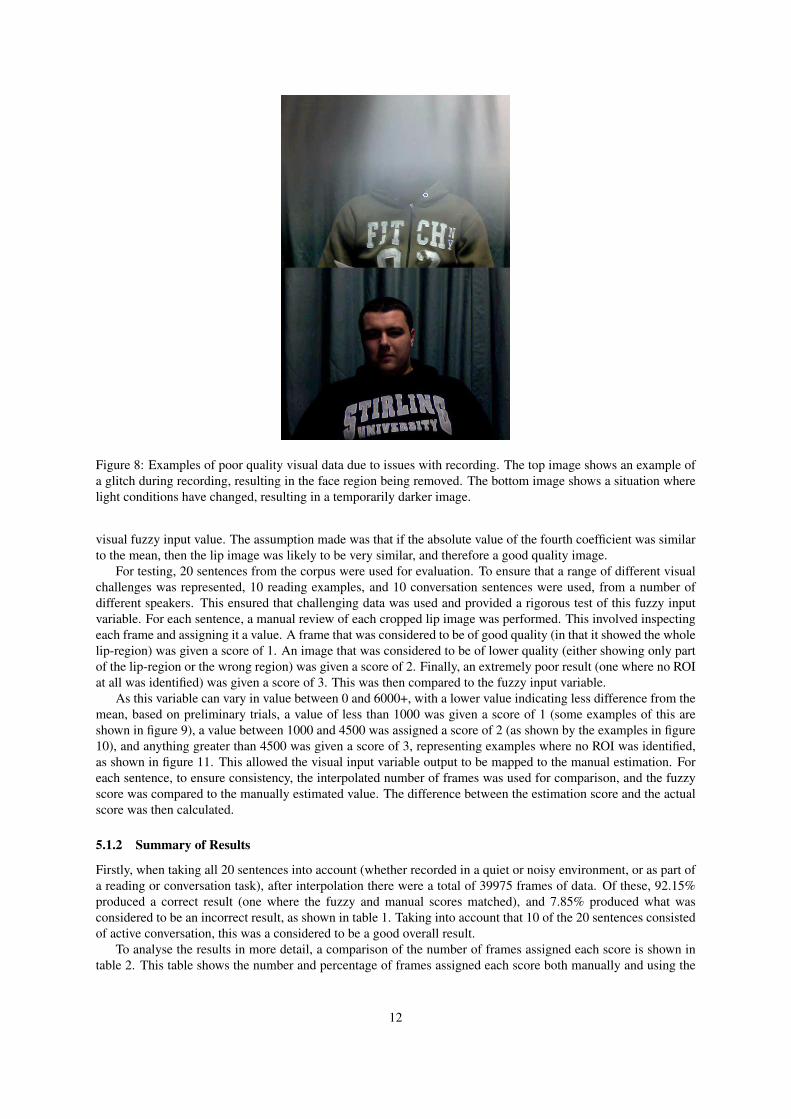
Figure 8: Examples of poor quality visual data due to issues with recording. The top image shows an example ofa glitch during recording, resulting in the face region being removed. The bottom image shows a situation wherelight conditions have changed, resulting in a temporarily darker image.
visual fuzzy input value. The assumption made was that if the absolute value of the fourth coefficient was similarto the mean, then the lip image was likely to be very similar, and therefore a good quality image.
For testing, 20 sentences from the corpus were used for evaluation. To ensure that a range of different visualchallenges was represented, 10 reading examples, and 10 conversation sentences were used, from a number ofdifferent speakers. This ensured that challenging data was used and provided a rigorous test of this fuzzy inputvariable. For each sentence, a manual review of each cropped lip image was performed. This involved inspectingeach frame and assigning it a value. A frame that was considered to be of good quality (in that it showed the wholelip-region) was given a score of 1. An image that was considered to be of lower quality (either showing only partof the lip-region or the wrong region) was given a score of 2. Finally, an extremely poor result (one where no ROIat all was identified) was given a score of 3. This was then compared to the fuzzy input variable.
As this variable can vary in value between 0 and 6000+, with a lower value indicating less difference from themean, based on preliminary trials, a value of less than 1000 was given a score of 1 (some examples of this areshown in figure 9), a value between 1000 and 4500 was assigned a score of 2 (as shown by the examples in figure10), and anything greater than 4500 was given a score of 3, representing examples where no ROI was identified,as shown in figure 11. This allowed the visual input variable output to be mapped to the manual estimation. Foreach sentence, to ensure consistency, the interpolated number of frames was used for comparison, and the fuzzyscore was compared to the manually estimated value. The difference between the estimation score and the actualscore was then calculated.
5.1.2 Summary of Results
Firstly, when taking all 20 sentences into account (whether recorded in a quiet or noisy environment, or as part ofa reading or conversation task), after interpolation there were a total of 39975 frames of data. Of these, 92.15%produced a correct result (one where the fuzzy and manual scores matched), and 7.85% produced what wasconsidered to be an incorrect result, as shown in table 1. Taking into account that 10 of the 20 sentences consistedof active conversation, this was a considered to be a good overall result.
To analyse the results in more detail, a comparison of the number of frames assigned each score is shown intable 2. This table shows the number and percentage of frames assigned each score both manually and using the
12

Figure 9: Examples of lip images regarded to be successfully detected. It can be seen that the images are ofvarying dimensionality, and also include different levels of additional facial detail depending on the results of theViola-Jones lip detector.
Figure 10: Examples of lip images regarded to be unsuccessfully detected. It can be seen that the images are ofvarying dimensionality, with issues such as identifying the wrong area of an image as the ROI, tracking only partof the lip-region, or poor quality information due to blurring and head motion.
Figure 11: Examples of lip images where no ROI was identified and cropping was not successful. It can be seenthat this is due to the speaker turning their head or obscuring their face.
Table 1: Overall performance of visual quality fuzzy input variable compared to manual scoring, considering eachframe of all 20 speech sentences.
Number of Frames PercentageCorrect 36836 92.15%
Incorrect 3139 07.85%Total 39975 100%
13

Table 2: Comparison of assigned values for overall 20 sentence dataset, showing difference in estimated value formanual inspection and fuzzy logic variable.
Method Assigned Value No. frames Perc. of totalManual 1 36334 90.89%Manual 2 3168 7.93%Manual 3 473 1.18%Fuzzy 1 37779 94.51%Fuzzy 2 1749 4.38%Fuzzy 3 447 1.12%
Table 3: Error between estimated visual fuzzy input and manual value for each frame of all 20 speech sentences.Est. Val. Manual Est. Fuzzy Est. Diff. Diff. Perc.
1 36334 37779 1445 3.977%2 3168 1749 1419 44.79%3 473 447 26 5.497%
fuzzy input variable. When observing the manually categorised frame scores, 90.89% were considered to be goodframes, 7.93% were considered to be incorrectly assigned frames, and 1.18% of frames were considered to haveidentified no correct ROI. In comparison, the estimated fuzzy scores were slightly different. 94.51% of frameswere considered to be good frames, 4.38% were estimated to be incorrect, and 1.12% were considered to haveidentified no correct ROI.
Table 2 shows that the number of frames considered to have no ROI were very similar, with the greatestdifference being that a higher number of fuzzy scores were estimated to be suitable than for a manual inspection.This is unsurprising due to the variation between speakers, sentences, cropped ROI dimensionality, and representsa justification for the use of a fuzzy logic variable. The difference in estimated values between the manual andthe fuzzy approach is shown in table 3. This table shows that 3.98% of frames were incorrectly categorised asbeing good values (i.e. the difference between the ground truth and automatic values), 5.5% were incorrectlyestimated to identify no ROI, and 44.8% were estimated to incorrectly be estimated as having a value of 2 (i.e.an incorrect/blurry/partial region). This was unsurprising as the difference between good and poor values couldsometimes be very small, and indicates that the detector may have limitations with regard to precise identificationof correct but partial regions.
To analyse the incorrect classification results shown in table 3 in more depth, individual sentences were exam-ined in order to identify if differences between the fuzzy estimation and the manual evaluation were evenly split,or were concentrated in specific sentences. Each of the 10 sentences was evaluated to compare the difference inresults. Considering the reading task first, the results are shown in table 4.
Table 4 shows that as expected, the percentage of matching fuzzy and ground truth values predicted is above94% for reading all cases, with only a very small number of results where the fuzzy estimation does not match
Table 4: Comparison of assigned values for 10 sentence reading dataset, showing difference in estimated valuefor manual inspection and fuzzy logic variable.
Sent. No. Correct Perc. Correct No. Incorrect Perc. Incorrect1 1933 96.70% 66 3.30%2 1992 99.65% 7 0.35%3 1974 98.75% 25 1.25%4 1985 99.30% 14 0.70%5 1880 94.05% 119 5.95%6 1926 96.59% 68 3.41%7 1952 97.65% 47 2.35%8 1915 95.80% 84 4.20%9 1957 97.90% 42 2.10%
10 1999 100% 0 0%
14

Table 5: Comparison of assigned values for 10 sentence conversation dataset, showing difference in estimatedvalue for manual inspection and fuzzy logic variable.
Sen. No. Correct Perc. Correct No. Incorrect Perc. Incorrect1 1836 91.85% 163 8.15%2 1432 71.64% 567 28.36%3 1999 100% 0 0%4 1947 97.40% 52 2.60%5 1840 92.05% 159 7.95%6 1930 96.55% 69 3.45%7 676 33.82% 1323 66.18%8 1689 84.49% 310 15.51%9 1978 98.95% 21 1.05%
10 1996 99.85% 3 0.15%
Figure 12: Examples of lip tracker extracting an incorrect image for a sequence of frames. These frames wereconsecutive frames from a single sentence and show that while a manual investigation may identify this as a partialresult, the fuzzy input may be more nuanced, due to most of the mouth being present.
the manual evaluation. In comparison, table 5 shows the match between the fuzzy estimation and the manualevaluation for the 10 sentences chosen for the conversation task.
Table 5 shows that the variation between individual sentences is much higher, which is to be expected con-sidering the issues the tracker faces with conversational speech. Although 6 of the 10 conversational sentenceshave a higher correct percentage than 90%, there is particular error concentrated in one sentence, with 66.18%of frames showing a difference between the manual and fuzzy estimation. An inspection of this specific croppedimage sequence identified that the reason for this was that while the tracker initially identifies a correct ROI, thereis an issue in that due to the specific features of this face, a large number of frames are considered to be partialand only show a percentage of the mouth. While a manual inspection resulted in these being classified as partialresults, the majority of the mouth was shown in these frames, as shown in figure 12, and so the difference wasrelatively small, resulting in the fuzzy value assigning these a score that was within the range of being consideredgood quality data. This indicates the difficulties with giving a precise score of 1, 2, or 3.
In summary, the visual input fuzzy variable was considered to be very accurate, with the majority of framesbeing correctly classified. It can be seen that the majority of errors were found when conversation data was used.In particular, one specific sentence in the test-set was shown to have a greater error than any other sentence, andan inspection of the data demonstrated that this could be identified as due to potential ambiguity over the qualityof the visual data, thus justifying the use of fuzzy logic rather than crisp sets, and demonstrating that the chosenthresholds are reasonably accurate and lead to correct classification in the majority of cases. There is scope forimprovement using a form of machine learning such as a HMM to build a classification model, but it was felt thatthe technique used to calculate the input variable was shown to be successful.
5.2 Previous Frame Fuzzy Input Variable5.2.1 Problem Description
As described in section 3.2, one input variable used in the system was the previous frame fuzzy output decision.The aim of this variable was to prevent rapid switching from frame-to-frame and there were very small differencesfrom frame-to-frame, meaning that a small change in environmental conditions may result in rapid changes in pro-cessing decision from frame-to-frame. Rapid oscillation between processing options can reduce listener comfort,and should be minimised. It was possible that using a moving average of the previous outputs could be more
15

Table 6: Number and percentage of frames with a difference in fuzzy output decision greater than or equal to 1,compared to previous frame.
Prev. Frame Mean of 3 Mean of 5 Mean of 10Sent. No. % Diff No. % Diff Diff % Diff Diff % Diff
1 40 2.00% 39 1.95% 40 2.00% 40 2.00%2 119 5.95% 120 6.00% 120 6.00% 122 6.10%3 34 1.70% 34 1.70% 34 1.70% 34 1.70%4 9 0.45% 16 0.80% 17 0.85% 18 0.90%5 10 0.50% 13 0.65% 14 0.70% 18 0.90%6 24 1.20% 30 1.50% 30 1.50% 29 1.45%7 22 1.10% 22 1.10% 22 1.10% 22 1.10%8 109 5.45% 112 5.60% 110 5.50% 110 5.50%9 120 6.00% 118 5.90% 118 5.90% 121 6.05%10 0 0% 0 0% 0 0% 0 0%11 43 2.15% 68 3.40% 74 3.70% 64 3.20%12 64 3.20% 77 3.85% 84 4.20% 87 4.35%13 48 2.40% 48 2.40% 48 2.40% 48 2.40%14 167 8.35% 169 8.45% 171 8.55% 172 8.60%15 174 8.70% 174 8.70% 174 8.70% 174 8.70%16 4 0.20% 4 0.20% 4 0.20% 4 0.20%17 12 0.60% 16 0.800% 17 0.85% 15 0.75%18 11 0.55% 11 0.550% 11 0.55% 11 0.55%19 8 0.40% 8 0.400% 8 0.40% 8 0.40%20 4 0.20% 4 0.200% 4 0.20% 4 0.20%21 110 5.50% 108 5.403% 108 5.40% 109 5.45%
effective in reducing switching than using a single value. This section investigates the effect of making use of thesingle previous output and compares this to using a mean of the previous 3, 5, and 10 previous output decisions.
A small dataset of 3 sentences from the corpus was used for evaluation. Broadband machine noise was addedto these sentences using the simulated room environment at varying SNR levels to produce 18 noisy speechsentences with a range of audio and visual fuzzy input variables. In addition to this 3 sentences that did not havenoise added to them, but were recorded in a noisy environment were also used, producing a total of 21 sentences.
The 21 sentences were evaluated four times using the fuzzy logic system, using the single previous outputdecision, the mean of the value for the previous 3 outputs, the mean of the previous 5 outputs, and the meanof the previous 10 outputs as the input variable. The resulting output processing decision from the fuzzy logicsystem was then compared to the decision from the previous frame to calculate the difference between frames. Asthe system is fuzzy, it is possible for the output decision to vary very slightly from frame-to-frame, without thedifference being large enough to affect the processing decision (i.e. no processing, audio-only, or audiovisual),and so it was felt of more relevance to focus on frames where there was a difference in output decision from theprevious frame greater than 1.
5.2.2 Summary of Results
A detailed inspection of fuzzy switching performance will be discussed later in this paper, but we first evaluatewhether the difference in output decision between frames is affected by using the previous value alone, or a meanof the previous 3, 5, or 10 outputs. Firstly, table 6 shows the number of frames where a difference is found fromthe previous frame, showing the total number of frames with a difference and the percentage of the total frames,for the four different previous input variables. As discussed, it was decided to filter the data by only consideringvalues where the difference from the previous frame is greater to or equal plus or minus 1.
Table 6 shows that there is a difference between frames from the previous frame on a relatively low numberof occasions, as low as 0%, and as high as 8.7%. The difference between individual sentences is to be expectedconsidering the different noise conditions. It can be seen that the difference between using a single frame and amean of previous frames is relatively small.
16

Table 7: Number and percentage of frames with any difference of in fuzzy output decision compared to previousframe, showing results when smoothing rule is enabled and disabled for one frame, mean of 3 frames, mean offive frames, and mean of 10 frames.
Prev. FrameRule No. Diff Perc Diff.
Enabled 1132 2.697%Disabled 2460 5.856%
Mean of 3Rule No. Diff Perc Diff.
Enabled 1191 2.837%Disabled 2460 5.856%
Mean of 5Rule No. Diff Perc Diff.
Enabled 1208 2.878%Disabled 2460 5.856%
Mean of 10Rule No. Diff Perc Diff.
Enabled 1210 2.882%Disabled 2460 5.856%
The second aspect of this evaluation concerned the impact that this fuzzy input variable had on reducing theoscillation from frame-to-frame. To investigate this, the fuzzy logic system was adjusted to disable the rulesconcerning the previous input variable, in effect meaning that the system made use of only the audio and visualinput variables at all times.
Table 7 shows that when the fuzzy rule pertaining to reduction of oscillation is enabled, increasing the numberof previous decisions used as part of the mean input variable results in a very small increase in difference. Whenonly the single previous output decision is used as the input variable, 1132, or 2.7% of the total 41980 framesshow a change in decision. Using a mean of the 3 previous decisions results in a change of 2.8%, increasing to2.9% when a mean of 5 previous decisions, and then finally 2.9% when a mean of the 10 previous decisions isused. Overall, the difference between frames when using an increased number of previous decisions as part of theinput mean variable was considered to be so small that it had no particularly noticeable difference. Therefore, itwas felt that it was suitable to use only the previous decision as an input variable into the fuzzy logic system.
Regarding the effect of disabling the fuzzy input variable, the results presented in table 7 are of interest forseveral different reasons. Firstly, when disabled, there is no change at all in output when a different number ofprevious decisions are part of the mean input variable. This confirms that this input variable has a role in affectingthe output decision. With the fuzzy input not used, the percentage of frames with a recorded difference varies from2.7% to 2.88%. With this input variable not used, 5.86% of frames record a difference in output decision from theprevious frame. Therefore, it can be concluded that the use of this input variable successfully limits processingdecision variation from frame-to-frame.
5.3 Fuzzy System Audio Performance EvaluationAs the input variables were evaluated individually in the previous section, this section focused on the audio per-formance of the fuzzy switching system. To do this, the composite measures [54] used in previous work by theauthors [1] and others [43] are used to perform a detailed evaluation. The output of using the fuzzy logic process-ing system was compared to mean values calculated by using a number of other techniques, including spectralsubtraction, the two-stage audiovisual approach, audio-only beamforming, and the unfiltered noisy speech. Inaddition to this, it was felt that it would be suitable to run a number of listening tests to evaluate the subjectivequality of the speech. As each speech sentence had a duration of 20 seconds, to prevent listener fatigue, threeversions of each sentence were evaluated, audiovisual, audio-only, and the fuzzy logic approach. In addition, thenumber of 20 second conversation snippets tested was limited to 5. These were then tested with volunteers toproduce a suitable Mean Opinion Score (MOS).
However, the focus on this paper is primarily on the performance of the switching system rather than on theexpected limited audio performance. Therefore, in addition to the audio output, the fuzzy switching is evaluated
17

Table 8: Composite objective mean test score table for overall speech quality for speech with washing machinenoise added, for audiovisual speech, audio-only beamforming, fuzzy-based processing, audio-only spectral sub-traction, and unprocessed speech.
Level Avis Beamform Fuzzy Spectral Noisy-40dB 1.482 3.5078 1.110 2.136 2.557-30dB 1.672 3.802 1.108 2.341 2.445-20dB 1.798 3.994 2.054 1.904 2.233-10dB 1.720 4.063 3.534 1.806 1.8180dB 1.315 4.089 3.903 2.573 2.485
+10dB 0.665 4.102 3.800 3.117 3.083
Table 9: Composite objective mean test score table for speech score speech quality for speech with washing ma-chine noise added, for audiovisual speech, audio-only beamforming, fuzzy-based processing, audio-only spectralsubtraction, and unprocessed speech.
Level Avis Beamform Fuzzy Spectral Noisy-40dB 1.649 4.415 1.373 2.121 2.561-30dB 1.786 4.642 1.401 2.292 2.490-20dB 1.874 4.790 2.391 2.059 2.394-10dB 1.729 4.846 4.226 2.199 2.2530dB 1.128 4.870 4.676 3.021 3.000
+10dB 0.115 4.882 4.536 3.625 3.682
in section 5.4.
5.3.1 Objective Testing With Broadband Noise
Each 20 second snippet of either conversation or reading had broadband machine noise added at different SNRlevels, ranging from -40dB to +10dB. Each mixture of speech and noise was then evaluated with the compositeobjective measures developed by [54]. Five versions of each sentence were compared, firstly, the audiovisual two-stage system presented in [1]. As this approach was shown to perform poorly with completely novel speakers, thenit was expected that this approach would perform poorly when tested with the newly recorded corpus. In additionto this, the results of performing audio-only beamforming are also presented. As the simulated room is designedto demonstrate the performance of the beamformer, it is expected that the results of using this technique will beextremely good in suitable environments. The noisy unfiltered sentence is also compared, along with conventionalspectral subtraction [55]. These are compared to the results of using the fuzzy-based system. The means of thecomposite overall, speech distortion, and background distortion at different SNR levels are provided in tables 8,9, and 10 respectively.
Considering the overall score first, the audio-only beamformer produced the best overall score, which wasexpected. The unfiltered and spectral subtraction scores are very similar, which matches expectations based onthe results presented in previous work. It can also be seen that the audiovisual approach is the worst performing
Table 10: Composite objective mean test score table for noisy speech quality for speech with washing machinenoise added, for audiovisual speech, audio-only beamforming, fuzzy-based processing, audio-only spectral sub-traction, and unprocessed speech.
Level Avis Beamform Fuzzy Spectral Noisy-40dB 1.842 2.770 1.630 1.995 1.957-30dB 1.910 3.001 1.591 2.116 1.889-20dB 1.917 3.331 2.101 1.847 1.753-10dB 1.835 3.750 3.285 1.774 1.4760dB 1.620 3.799 3.592 2.224 1.898
+10dB 1.359 3.816 3.429 2.519 2.341
18

Table 11: Selected results of Bonferroni Multiple Comparison, showing P-Value results for difference betweenAudiovisual Filtering and Fuzzy Processed Speech with washing machine noise added for overall compositescores.
Level Diff. of Means SE of Diff. T-Value Adjusted P-Value-40dB -0.372 0.144 -2.589 1.000-30dB -0.564 0.144 -3.926 0.053-20dB 0.256 0.144 1.782 1.000-10dB 1.814 0.144 12.639 0.0000dB 2.588 0.144 18.030 0.000
+10dB 3.135 0.144 21.84 0.000
Table 12: Selected results of Bonferroni Multiple Comparison, showing P-Value results for difference betweenAudio-only beamforming and Fuzzy Processed Speech with washing machine noise added for overall compositescores.
Level Diff. of Means SE of Diff. T-Value Adjusted P-Value-40dB -2.398 0.1435 -16.70 0.0000-30dB -2.694 0.1435 -10.18 0.0000-20dB -1.940 0.1435 -13.52 0.0000-10dB -0.529 0.1435 -3.68 0.13170dB -0.187 0.1435 -1.31 1.0000
+10dB -0.302 0.1435 -2.104 1.0000
method, which again matches expectations due to the limitations of the audiovisual model. The performance ofthe fuzzy-based system is of interest. The results of Bonferroni multiple comparison for the difference betweenthe audiovisual and fuzzy logic approach, and the audio-only and fuzzy approach are given in tables 11 and 12.The difference of means in table 11 shows that at a very low SNR (at SNR levels of -40dB, -30dB, -20dB), thefuzzy logic approach is the worst performing approach. However, although it is the worst performing approachthe difference between the audiovisual and fuzzy approaches was not statistically significant (p >0.05). Thissuggests that as the noise level is extremely high, the fuzzy logic system makes use of the audiovisual method,which explains the lack of difference.
At higher SNR levels, when there is less noise, the fuzzy-system makes more use of the audio-only approach,and so as shown by the comparison of means in table 12, the difference between the fuzzy-system at these higherSNR levels is not statistically significant (p >0.05). However, the scores do not match exactly. This is because thefuzzy-system does not make use of the same approach in all frames, as it switches in response to precise changesin input variables.
5.3.2 Subjective Testing with Broadband Noise
This section reports the results of listening tests performed on this dataset. 10 volunteers took part in listening testsin a quiet room, using noise cancelling headphones. All of the volunteers spoke English as a first language, andnone reported any abnormalities with their hearing. There were 6 male subjects and 4 female subjects, with an agerange between 21 and 37. Listeners were played sentences randomly from the test-set, and were asked to scoreeach between 0 and 5. This section discusses overall speech quality Mean Opinion Scores (MOS) results. As therewere concerns over listener fatigue due to the potential duration of listening tests using the entire dataset (due tothe length of each sentence), a smaller subset of the test-set was used. 5 sentences were selected (again, a mixof reading and conversation tasks), from different speakers, and broadband noise was added at 6 different SNRlevels. 3 processing methods were used, the audiovisual approach, the audio-only approach, and the fuzzy-basedsystem. The overall MOS results are shown in figure 13.
Figure 13 shows that the scores for subjective listening tests look very similar to the results presented insection 5.3.1. The audiovisual approach is consistently identified to have the worst output scores, and the audio-only technique returns the best results. The fuzzy-based approach performs poorly at a very low SNR, but has animproved output at a higher SNR. A more detailed analysis, using Bonferroni multiple comparison is shown inthe interaction plots in figure 14, and the difference of means is given in tables 13, and 14.
19

−40 dB −30 dB −20 dB −10 dB 0 dB +10 dB0
0.5
1
1.5
2
2.5
3
3.5
4
4.5
5
MO
S
MOS For Overall Quality at Different SNR Levels
Avis
Fuzzy
BeamF
Figure 13: Mean Opinion Score for overall speech quality for speech with washing machine noise added, foraudiovisual speech, audio-only beamforming, and fuzzy-based processing.
Figure 14: Interaction plot for overall MOS at varying SNR levels, showing audiovisual speech (black and cir-cle markers), audio-only beamforming (red with square markers), and fuzzy-based system (green with diamondmarkers).
Table 13: Selected results of Bonferroni Multiple Comparison, showing P-Value results for difference betweenAudio-only beamforming and Fuzzy Processed Speech for overall subjective scores.
Level Diff. of Means SE of Diff. T-Value Adjusted P-Value-40dB -2.204 0.180 -12.23 0.000-30dB -2.526 0.180 -14.02 0.000-20dB -2.386 0.180 -13.24 0.000-10dB -0.714 0.180 -3.96 0.0120dB -0.384 0.180 -2.13 1.000
+10dB -0.627 0.180 -3.479 0.081
20

Table 14: Selected results of Bonferroni Multiple Comparison, showing P-Value results for difference betweenAudiovisual Filtering and Fuzzy Processed Speech for overall subjective scores.
Level Diff. of Means SE of Diff. T-Value Adjusted P-Value-40dB -0.196 0.180 -1.088 1.000-30dB -0.046 0.180 -0.255 1.000-20dB 0.214 0.180 1.188 1.000-10dB 1.700 0.180 9.434 0.0000dB 2.550 0.180 14.151 0.000
+10dB 2.915 0.180 16.18 0.000
It can be seen that the trend of results is very similar to the objective scores. At a lower SNR, the audiovisualand fuzzy-based scores are very similar, with no significant difference. This signifies that there was a far greaterpreference by listeners for the sentences processed with audio-only beamforming. When the SNR is increased,the fuzzy-based approach produced an improved score, with a similar output to the audio-only approach, withthe results of Bonferroni multiple comparison showing that at SNR levels of -10dB, 0dB, and +10dB, the overallscores were not significantly different (p >0.05). This indicates that listeners found these sentences to be verysimilar in terms of overall results.
These results also confirm that the fuzzy-based system performs as expected. At lower SNR levels -40dB to -20dB), the fuzzy MOS is very similar to the audiovisual MOS, with small but not significant differences, as shownby the results of a comparison of means. At SNR levels of -10dB and 0dB, the audio-only and fuzzy-based resultsare very similar, suggesting that audio-only processing is used more often. However, the results also show thatsimilarly to the objective results in the previous section, the audiovisual MOS is the worst performing technique,and the audio-only approach far outperforms this method. However, these results should be interpreted with adegree of caution.
5.3.3 Objective Testing with Inconsistent Transient Noise
Objective and subjective testing identified that the audio-only beamforming approach produced the strongest re-sults. As expected, the audiovisual approach performed poorly when tested with novel data that it had not beentrained with, and the fuzzy logic approach produced output that resulted in a poorer score than the audio-onlyapproach due to the fuzzy switching system. However, there should be a degree of caution in interpreting theseresults. Firstly, although the output audio quality for the fuzzy logic processing approach produces lower objec-tive and subjective scores, this is due to limitations with the audiovisual processing approach, rather than with thefuzzy switching. Secondly, although the audio-only results have been identified as producing the strongest results,this is in a scenario with broadband noise from a fixed source, where a beamformer would be expected to performwell.
In this section, a different noise is used, one with silence and clapping, that represents a greater challenge. Amixture of clapping and silence is used as the noise source, and the 10 speech sentences described above are mixedwith the noise source at a range of SNR levels, from -40dB to +10dB. These noisy sentences are then processedusing the techniques also used in section 5.3.1, and evaluated using the objective composite measures. The meansof the overall scores at different SNR levels are shown in figure 15.
It can be seen that the audio-only beamformer returns the same score at all SNR levels. Listening to the audiooutput confirmed that the reason this score was so low and so consistent was because no audio signal was returned.The audiovisual score was also poor, but listening to the output confirmed that an audio signal could be heard,hence the higher yet still very low score. The results of Bonferroni multiple comparison, as shown in tables 15and 16 show that despite the lack of output signal, the difference between the fuzzy output and the audio-onlyoutput is only significant at a SNR of -40dB, and 0dB (where p <0.05). The difference between the audiovisualand fuzzy output scores was not significant at any SNR level.
Overall, the results demonstrated that the audio-only beamforming results presented in the previous sectionsshould be interpreted with a degree of caution. The fuzzy logic based results presented in this section are verydependent on the techniques used for processing speech. Although previous sections reported that the audio-onlyapproach produced clearly better results, this was when the noise was one which the beamformer was capable ofprocessing. Likewise, the audiovisual results were shown to be limited due to the system not being trained withdata similar to that used for testing. Therefore, although the fuzzy logic system is functioning as expected and is
21

−40 dB −30 dB −20 dB −10 dB 0 dB +10 dB−0.5
0
0.5
1
1.5
2
2.5
3
3.5
4
4.5
5
CO
vl −
Co
mp
osi
te fo
r O
vera
llComposite Measure for Overall Score at Different SNR Levels
Avis
Fuzzy
Spect
BeamF
Noisy
Figure 15: Composite objective mean test scores for overall speech quality for speech with transient clapping noiseadded, for audiovisual speech, audio-only beamforming, fuzzy-based processing, audio-only spectral subtraction,and unprocessed speech.
Table 15: Selected results of Bonferroni Multiple Comparison, showing P-Value results for difference betweenAudio-only beamforming and Fuzzy Processed Speech with transient clapping noise added for overall compositescores.
Level Diff. of Means SE of Diff. T-Value Adjusted P-Value-40dB 0.824 0.148 5.585 0.000-30dB 0.416 0.148 2.816 1.000-20dB 0.363 0.148 2.462 1.000-10dB 0.307 0.148 2.079 1.0000dB 0.965 0.148 6.543 0.000
+10dB 0.461 0.148 3.124 0.905
Table 16: Selected results of Bonferroni Multiple Comparison, showing P-Value results for difference betweenAudiovisual Filtering and Fuzzy Processed Speech with transient clapping noise added for overall compositescores.
Level Diff. of Means SE of Diff. T-Value Adjusted P-Value-40dB 0.002 0.148 0.011 1.000-30dB -0.463 0.148 -3.138 0.864-20dB -0.380 0.148 -2.577 1.000-10dB -0.333 0.148 -2.254 1.0000dB 0.220 0.148 1.490 1.000
+10dB -0.056 0.148 -0.379 1.000
22

0 200 400 600 800 1000 1200 1400 1600 1800 20000
200
400
600a) Visual Input Variable
0 200 400 600 800 1000 1200 1400 1600 1800 20000
0.2
0.4b) Transient Noise Audio Input Variable
0 200 400 600 800 1000 1200 1400 1600 1800 20000
5
10c) Transient Noise Fuzzy Output Decision
0 200 400 600 800 1000 1200 1400 1600 1800 20000
0.1
0.2d) Machine Noise Audio Input Variable
Change In Fuzzy Output With Different Noise
0 200 400 600 800 1000 1200 1400 1600 1800 20000
5
10e) Machine Noise Fuzzy OutputDecision
Figure 16: Comparison of fuzzy logic output decision depending on noise type at SNR of 0dB. (a) shows the inputvisual information. It can be seen that all values are below 600, therefore every frame is considered to be goodquality. As the visual information is unchanged, then this is the same for both transient and machine noise speechmixtures. (b) shows the transient mixture fuzzy input variable. (c) shows the associated transient noise mixtureoutput processing decision. (d) shows the machine noise mixture fuzzy input variable. (e) shows the machinenoise mixture output processing decision.
switching between techniques, the results are limited by limitations in the specific speech processing techniques,which will be addressed in future work.
5.4 Fuzzy System Switching Performance EvaluationAs discussed previously, it can be seen that the fuzzy logic output varies depending on factors such as the SNRlevel and the previous output decision value, and the results of subjective and objective tests show that the outputmean scores are often similar, but not identical to either the audio-only output scores or the audiovisual scores.However, as a range of sentences (with different associated visual quality fuzzy values), noises, and SNR levelswere tested, it was felt suitable to examine the performance of the fuzzy switching approach in detail.
5.4.1 Fuzzy Switching with Varying Noise Type
Firstly, the difference between sentences mixed with the two different noises used in this paper (broadband noiseand transient clapping) is examined. To do this, two sentences are compared, with different noise added. Thefuzzy output decision from frame-to-frame of a sentence with transient noise is compared to the frame-by-frameoutput decision of the same sentence, except with the machine noise added at the same SNR. Firstly, noise wasadded at a SNR of 0dB to the sentence, and the output is shown in figure 16. In order to ensure that good qualityvisual information was available at all times, an example of a sentence from the reading task was chosen.
Figure 16 shows the difference in the fuzzy output decision, depending on the input noise variable. As the
23
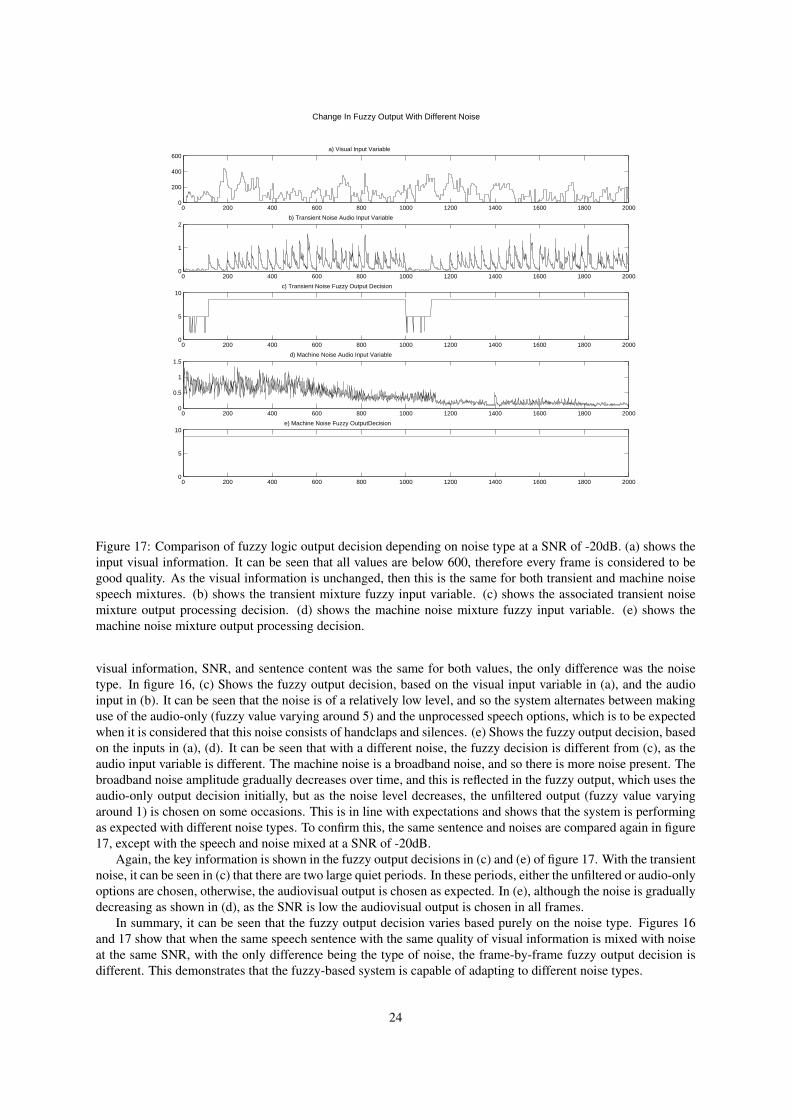
0 200 400 600 800 1000 1200 1400 1600 1800 20000
200
400
600a) Visual Input Variable
0 200 400 600 800 1000 1200 1400 1600 1800 20000
1
2b) Transient Noise Audio Input Variable
0 200 400 600 800 1000 1200 1400 1600 1800 20000
5
10c) Transient Noise Fuzzy Output Decision
0 200 400 600 800 1000 1200 1400 1600 1800 20000
0.5
1
1.5d) Machine Noise Audio Input Variable
Change In Fuzzy Output With Different Noise
0 200 400 600 800 1000 1200 1400 1600 1800 20000
5
10e) Machine Noise Fuzzy OutputDecision
Figure 17: Comparison of fuzzy logic output decision depending on noise type at a SNR of -20dB. (a) shows theinput visual information. It can be seen that all values are below 600, therefore every frame is considered to begood quality. As the visual information is unchanged, then this is the same for both transient and machine noisespeech mixtures. (b) shows the transient mixture fuzzy input variable. (c) shows the associated transient noisemixture output processing decision. (d) shows the machine noise mixture fuzzy input variable. (e) shows themachine noise mixture output processing decision.
visual information, SNR, and sentence content was the same for both values, the only difference was the noisetype. In figure 16, (c) Shows the fuzzy output decision, based on the visual input variable in (a), and the audioinput in (b). It can be seen that the noise is of a relatively low level, and so the system alternates between makinguse of the audio-only (fuzzy value varying around 5) and the unprocessed speech options, which is to be expectedwhen it is considered that this noise consists of handclaps and silences. (e) Shows the fuzzy output decision, basedon the inputs in (a), (d). It can be seen that with a different noise, the fuzzy decision is different from (c), as theaudio input variable is different. The machine noise is a broadband noise, and so there is more noise present. Thebroadband noise amplitude gradually decreases over time, and this is reflected in the fuzzy output, which uses theaudio-only output decision initially, but as the noise level decreases, the unfiltered output (fuzzy value varyingaround 1) is chosen on some occasions. This is in line with expectations and shows that the system is performingas expected with different noise types. To confirm this, the same sentence and noises are compared again in figure17, except with the speech and noise mixed at a SNR of -20dB.
Again, the key information is shown in the fuzzy output decisions in (c) and (e) of figure 17. With the transientnoise, it can be seen in (c) that there are two large quiet periods. In these periods, either the unfiltered or audio-onlyoptions are chosen, otherwise, the audiovisual output is chosen as expected. In (e), although the noise is graduallydecreasing as shown in (d), as the SNR is low the audiovisual output is chosen in all frames.
In summary, it can be seen that the fuzzy output decision varies based purely on the noise type. Figures 16and 17 show that when the same speech sentence with the same quality of visual information is mixed with noiseat the same SNR, with the only difference being the type of noise, the frame-by-frame fuzzy output decision isdifferent. This demonstrates that the fuzzy-based system is capable of adapting to different noise types.
24

0 200 400 600 800 1000 1200 1400 1600 1800 20000
100
200
300
400
500a) Visual Input Variable
0 200 400 600 800 1000 1200 1400 1600 1800 20000
1
2
3
4
5b) Audio Input Variable
Fuzzy Output at −30dB SNR
0 200 400 600 800 1000 1200 1400 1600 1800 20000
2
4
6
8
10c) Fuzzy Output Decision
Figure 18: Fuzzy logic output decision depending on quality of visual information, for sentence with no framesconsidered to be of poor quality. (a) shows the input visual variable. It can be seen that all values are below 600,therefore every frame is considered to be good quality. (b) shows the audio input variable, with machine noiseadded to speech at an SNR of -30dB. (c) shows the fuzzy output processing decision.
5.4.2 Fuzzy Switching with Varying Visual Information
The previous examples considered a sentence with good quality visual information available at all times, but it wasalso considered to be of interest to observe the effect that varying the quality of visual information had on the fuzzydecision. If the audio input level was considered to be high, then the fuzzy logic system would use audiovisualprocessing, but only if the visual information was considered to be of good quality (i.e. the visual input fuzzyvariable was low with all values below 600). To test this, a number of different sentences are compared, and thefuzzy outputs compared. These are shown in figures 18, 19, and 20. In all sentences, machine noise is mixed withthe speech signal at a SNR of -30dB to ensure consistency.
In figure 18, (a) represents the visual input variable, (b) shows the audio input variable and (c) shows the fuzzyoutput decision. As can be seen, the visual information quality is considered to be good for all frames, and soaudiovisual processing is chosen for all frames. However, figures 19, and 20 show different sentences with allother conditions kept the same. Despite the noise type and SNR being the same in each example, the visual inputvariable varies, and so the system only uses audiovisual processing when it is considered to be suitable. Thisdemonstrates that the system adapts to different sentences and uses visual information in an appropriate manner.
5.4.3 Fuzzy Switching with Varying SNR Level
In addition to considering the effect of noise type and visual information, the effect of mixing the speech and noisesources at varying SNR levels is of interest. For this example, one sentence was chosen, with a small number offrames with poor quality visual information, and the noise source was the broadband machine noise. The sentenceswere then mixed at different SNR levels. Figure 21 shows the effect of mixing the sources at an SNR of -40dB.
In figure 21, (a) represents the mixed audio waveform, and (b) the associated fuzzy input variable. (c) Shows
25

0 200 400 600 800 1000 1200 1400 1600 1800 20000
1000
2000
3000
4000a) Visual Input Variable
0 200 400 600 800 1000 1200 1400 1600 1800 20000
0.5
1
1.5
2
2.5
3b) Audio Input Variable
Fuzzy Output at −30dB SNR
0 200 400 600 800 1000 1200 1400 1600 1800 20000
2
4
6
8
10c) Fuzzy Output Decision
Figure 19: Fuzzy logic output decision depending on quality of visual information, for sentence with severalframes considered to be of poor quality. (a) shows the input visual variable. It can be seen that there are a smallnumber of frames where there is considered to be poor visual input. (b) shows the audio input variable, withmachine noise added to speech at an SNR of -30dB. (c) shows the fuzzy output processing decision.
26

0 200 400 600 800 1000 1200 1400 1600 1800 20000
1000
2000
3000
4000
5000
6000a) Visual Input Variable
0 200 400 600 800 1000 1200 1400 1600 1800 20000
1
2
3
4
5
6b) Audio Input Variable
Fuzzy Output at −30dB SNR
0 200 400 600 800 1000 1200 1400 1600 1800 20000
2
4
6
8
10c) Fuzzy Output Decision
Figure 20: fuzzy logic output decision depending on quality of visual information, for sentence with severalframes considered to be of poor quality. (a) shows the input visual variable. It can be seen that there are a numberof frames where there is considered to be poor visual input. (b) shows the audio input variable, with machinenoise added to speech at an SNR of -30dB. (c) shows the fuzzy output processing decision.
27

0 2 4 6 8 10 12 14 16
x 104
−1
−0.5
0
0.5
1a) Unfiltered Waveform
0 200 400 600 800 1000 1200 1400 1600 1800 20000
5
10
15
20b) Audio Input Variable
0 200 400 600 800 1000 1200 1400 1600 1800 20000
1000
2000
3000c) Visual Input Variable
Fuzzy Output for Sentence at −40dB SNR
0 200 400 600 800 1000 1200 1400 1600 1800 20000
5
10d) Fuzzy Output Decision
Figure 21: Fuzzy logic output decision depending on SNR level. (a) shows the input audio waveform, with speechand noise mixed at a SNR of -40dB. (b) shows the audio input variable. (c) shows the visual input variable, witha small number of frames considered to be of low quality. Finally, (d) shows the fuzzy output decision.
28

0 2 4 6 8 10 12 14 16
x 104
−1
−0.5
0
0.5
1a) Unfiltered Waveform
0 200 400 600 800 1000 1200 1400 1600 1800 20000
0.5
1
1.5
2b) Audio Input Variable
0 200 400 600 800 1000 1200 1400 1600 1800 20000
1000
2000
3000c) Visual Input Variable
Fuzzy Output for Sentence at −20dB SNR
0 200 400 600 800 1000 1200 1400 1600 1800 20000
5
10d) Fuzzy Output Decision
Figure 22: Fuzzy logic output decision depending on SNR level. (a) shows the input audio waveform, with speechand noise mixed at a SNR of -20dB. (b) shows the audio input variable. (c) shows the visual input variable, witha small number of frames considered to be of low quality. Finally, (d) shows the fuzzy output decision.
the visual input variable and (d) shows the fuzzy processing decision output. It can be seen that as the noise isconsidered to be consistently high, audiovisual information is used whenever good quality visual information isavailable. In figure 22, which shows the same sentence and noise mixture, but at a SNR of -20dB, there is a muchmore noticeable difference.
It can be seen in (a) that initially, the audiovisual processing option is chosen where appropriate. Later in thissentence, when there is considered to be lower quality visual information available, the system chooses audio-onlyprocessing. Unlike figure 21, the decision does not quickly change back to audiovisual processing, but continuesto choose audio-only processing for a much greater number of frames. This is because of the increased SNR,demonstrating that the fuzzy logic system adapts to different noise inputs.
In figure 23, it can be seen in (a) that the speech is more visible in the waveform, which is a reflection onthe increased SNR level. It can be seen in (d) that as the input level variable decreases, the fuzzy logic systemchooses the audio-only option for much of the second part of the sentence, which is very different from previousexamples of the same sentence with the same noise but a lower SNR. Finally, figure 24 shows that at a SNR of+10dB there are a much greater number of examples of the fuzzy logic system choosing to not filter the frame ofspeech. Overall, it is shown that the system will adapt to changing audio input levels, with an example of the samesentence, with the same visual input variable, and the same type of noise source, producing a different decisionfrom frame-to-frame, depending on the SNR, and therefore the level of noise.
6 Discussion of Results
6.1 Fuzzy Input Variable DiscussionSection 5 presented an evaluation of the input variables, as while the audio level was a very simple and effectiveinput detector, the visual quality and previous output detectors were more novel. It was concluded that the initial
29
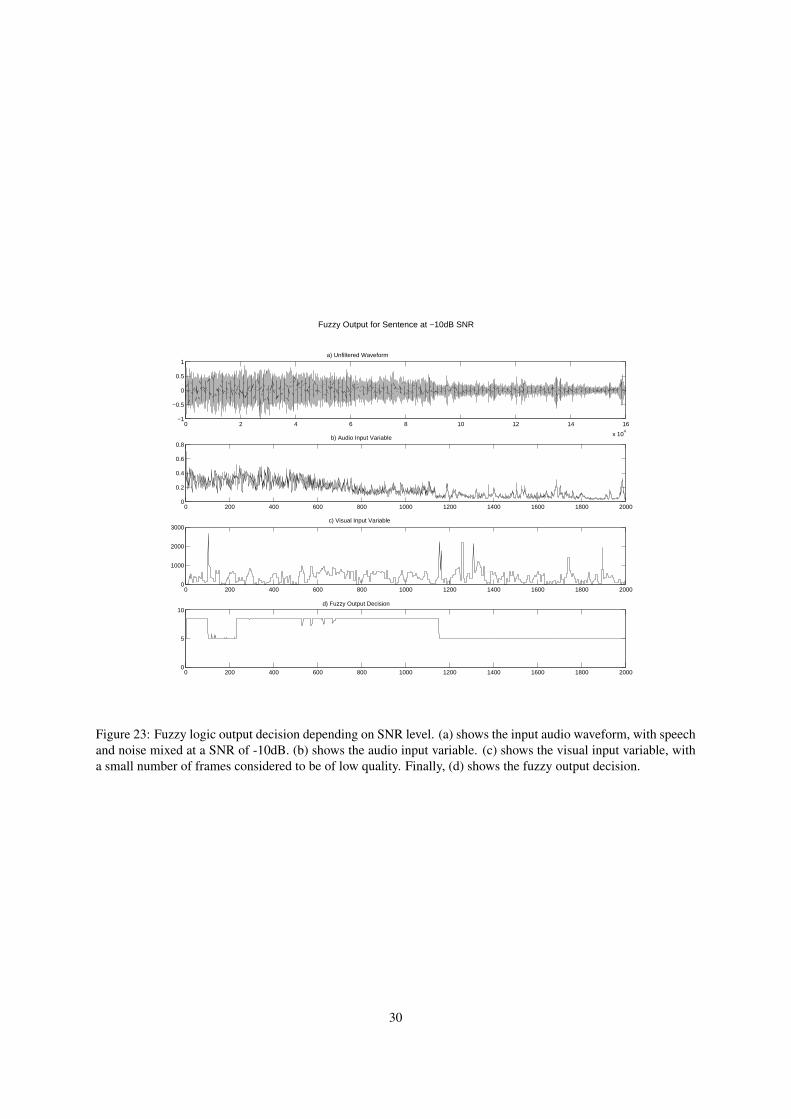
0 2 4 6 8 10 12 14 16
x 104
−1
−0.5
0
0.5
1a) Unfiltered Waveform
0 200 400 600 800 1000 1200 1400 1600 1800 20000
0.2
0.4
0.6
0.8b) Audio Input Variable
0 200 400 600 800 1000 1200 1400 1600 1800 20000
1000
2000
3000c) Visual Input Variable
Fuzzy Output for Sentence at −10dB SNR
0 200 400 600 800 1000 1200 1400 1600 1800 20000
5
10d) Fuzzy Output Decision
Figure 23: Fuzzy logic output decision depending on SNR level. (a) shows the input audio waveform, with speechand noise mixed at a SNR of -10dB. (b) shows the audio input variable. (c) shows the visual input variable, witha small number of frames considered to be of low quality. Finally, (d) shows the fuzzy output decision.
30

0 2 4 6 8 10 12 14 16
x 104
−1
−0.5
0
0.5
1a) Unfiltered Waveform
0 200 400 600 800 1000 1200 1400 1600 1800 20000
0.2
0.4
0.6
0.8b) Audio Input Variable
0 200 400 600 800 1000 1200 1400 1600 1800 20000
1000
2000
3000c) Visual Input Variable
Fuzzy Output for Sentence at +10dB SNR
0 200 400 600 800 1000 1200 1400 1600 1800 20000
5
10d) Fuzzy Output Decision
Figure 24: fuzzy logic output decision depending on SNR level. (a) shows the input audio waveform, with speechand noise mixed at a SNR of +10dB. (b) shows the audio input variable. (c) shows the visual input variable, witha small number of frames considered to be of low quality. Finally, (d) shows the fuzzy output decision.
31

visual fuzzy input variable can successfully be used to classify visual information. It was shown with a range ofchallenging conditions and widely varying conversation snippets from different speakers that the method correctlyidentified the quality of visual information in the majority of cases. Tracking errors due to animated movement ofthe speakers were generally correctly identified. This section justified the use of fuzzy variables by showing thatdifferent speech sentences had varying input values, matching the manually estimated predictions, and the chosenfuzzy thresholds were suitable to cover a wide range of potential input data.
However, there are further improvements that could be made to this approach. There are false positives presentin the results. To improve the accuracy of the fuzzy input variable, it could be possible to create an improved inputvariable using a machine learning technique, such as HMMs or ANNs, which would use a more sophisticatedassessment of whether the input value is a partial lip region, correct full ROI, or not a match. Due to the low errorrate the present implementation of this detector is considered to be suitable for use as part of a future refinementof this system.
Section 5 also discussed the use of the previous frame fuzzy output value as an input for the subsequent frame.The aim this is to reduce rapid switching between processing options on a frame-by-frame basis. The potentialbenefit of using the single previous frame or a floating mean of 3, 5, and 10 previous outputs was investigated. Theresults showed that although using a floating mean smoothed the input variable on a frame-to-frame basis, it madevery little difference to the final fuzzy output value, justifying the use of a single frame for the sake of simplicity.
The effect of using the fuzzy variable on switching of processing options from frame-to-frame was also eval-uated. While it is expected that the processing option will change in response to environmental conditions, rapidoscillation should be prevented where possible. To investigate this, the fuzzy rules pertaining to the previousinput variable were disabled and the system was run with a number of sentences at different SNR levels. The re-sults, when compared to running the system with the rules enabled demonstrated that using the previous variablefulfilled the requirement of reducing the oscillation from frame-to-frame.
However, there are a number of ways in which these inputs could be improved. As discussed above, a modelcould be trained to accurately identify the quality of an image. Also, in addition to the relatively basic audiolevel input, additional detectors such as a VAD could be used to positively identify the presence or absence ofspeech. This would serve as an additional input into the fuzzy-based system (and so would require the writing ofadditional rules), as used in some current commercial hearing-aids. This could also include specific front-back orwind detectors, to add versatility to the system.
6.2 Fuzzy Switching System Performance EvaluationThe fuzzy-based system performs as expected. The system switches between processing options when consideredappropriate, as confirmed by the results in section 5. Firstly, with regard to the audio output of the system, itcan be seen from the evaluation that the results are of limited interest. The audiovisual filtering often produces asignificantly worse result than using beamforming. This was an issue also identified in a previous paper [1], wherethe result was found to be significantly worse when used with data not similar to that which the system had notpreviously been trained with.
The fuzzy output results are of interest because they demonstrate that the fuzzy-based system performs asexpected. At a very low SNR, the system makes use of the audiovisual processing option, and at a high SNR,the system predominantly makes use of the audio-only approach as expected. However, at even the lowest SNR,the objective and subjective scores are not identical to the audiovisual scores. This is because the fuzzy-basedapproach makes use of different processing options, depending on the fuzzy input variables, and so there is adifference in scores. A similar pattern can be seen at a higher SNR, when the audio-only approach is predominantlyused, but again, it is not used in all cases, and is dependent on the input fuzzy variables. However, the score isagain rated as lower than the beamforming approach.
This would initially suggest that the beamforming approach is always better; however, this result has to beinterpreted with a degree of caution. Previous work by the authors [1] discussed the results of objective testswhen using an inconsistent clapping noise with transients and silences, designed to be extremely challenging for abeamformer. In this scenario, it was found that the audio-only approach produced no results of value. However, theaudiovisual approach also performed poorly, due to the limitations with the training dataset discussed previously.Accordingly, although the fuzzy-based approach performed as expected, the limitations identified with the speechprocessing techniques also show that the system is currently only suitable for testing in specialised environments,and needs further development before being suitable for more general purpose use.
Despite the limitations identified above, an investigation of the performance of the fuzzy switching system hasshown that the system switches between inputs as expected. In noisy environments with a high SNR, the system
32

automatically selects a different form of processing (in this case audiovisual), but only when there is suitableassociated visual information. This demonstrates that the system is capable of adapting to a range of differentaudiovisual environments, and is capable of solving the problem of lack of availability of visual information. Itshould be emphasised that this is a preliminary system, and future work specifically with regard to this aspect ofthe system would investigate the processing cost of using such a system, and potential performance savings to begained from using different processing options, and improving the speech processing techniques used in order toimprove versatility.
Overall, despite positive switching results, in order to improve this system, it is clear that the audiovisual filter-ing approach needs to be improved and refined. The results show that there is considerable scope for improvementwhen using data that the system has not been trained with. This limitation explains the limited speech evaluationresults. Another significant improvement needed is to further develop the system to enable more accurate evalua-tion. The results showed that the beamforming results were good with the appropriate type of noise, but extremelylimited with an unsuitable noise, and so therefore had to be treated with caution. Future work would involve thedevelopment of this system to be able to use a true multi-microphone environment rather than a simulated room,to fully and accurately evaluate the system. This would involve further refinement, and also the acquisition ofimproved hardware to use for testing. This improved hardware would allow for improved data synchronisation,correct acquisition of impulse responses and directional information, and would allow for noise to be added duringrecording rather than afterwards, taking more account of the Lombard Effect.
7 ConclusionThis paper expanded on an initial concept of a two stage audio-visual system presented in previous work by theauthors [1], to present a cognitively inspired multimodal speech filtering approach. This approach was designedto overcome limitations identified with a previous iteration of this system, and was inspired by the multimodalnature of human speech perception. To perform the enhancement, both audio-only beamforming and visuallyderived Wiener filtering were utilised to filter speech, within a fuzzy logic based framework. This frameworkuses a number of level detectors to determine the quality of the input information (i.e. whether a lip image ofadequate quality is present in a frame of visual data), and also what level of energy is present in a frame of audiodata. These detectors determine the appropriate processing method to use to filter a frame of noisy speech on aframe-by-frame basis.
All aspects of the system were thoroughly tested using a custom recorded novel speech database. This corpuscontained audiovisual speech data of variable quality, with an emphasis on natural conversational communication,encouraging the speakers to move naturally and engage in emotional speech. This meant that the visual data inten-tionally had some quality issues due to the speakers moving around, covering their mouth, speaking in differentmanners, and turning their heads. It can be seen from the results presented in this paper that the chosen fuzzyinputs functioned well. The visual quality input accurately evaluated the quality of the visual information andcould identify whether the ROI input was a good quality lip image. The level detector functioned as expected, andin addition, the previous frame output was shown to smooth the oscillation between frames that could be causedby audio and visual inputs close to the fuzzy thresholds. In addition to the detectors, the output from the fuzzysystem was tested and while the audio output did not perform well due to the visual component of the system notbeing trained with the novel corpus used in this work. It was considered that although the system could be trainedto gain some small improvements in performance, a more productive approach would be to improve the visualderived filtering component in future work. However, a thorough evaluation of the switching process showed thatthe fuzzy based system functioned well, with the processing decision changing depending on the input detectors.
While the cognitively inspired switching framework has been shown in this paper to perform successfully,and overcomes one of the weaknesses presented in initial work [1], there are further refinements that could beperformed within the overall fuzzy switching framework. Although the GMM-GMR based approach utilised inthis paper can deliver positive results, it does not perform well when presented with data significantly differentfrom that it has been trained with. This was also found to be the case in the previous work. Although this isa common problem for multimodal speech filtering systems, this is an aspect which requires improvement withthe upgrading of the audiovisual speech model presently used in this system. Future work with regard to thiscognitively inspired system is to improve the relatively unsophisticated visually derived speech estimation model.It has been shown that although the switching performance is good, the visually derived filtering algorithm itselfdoes not perform well with novel data, and so this aspect of the overall framework is a prime candidate forconsideration with regard to improvement. Overall, the benefits of making use of visual information as part of a
33
cognitively inspired speech enhancement switching framework are clear.
References[1] A. Abel and A. Hussain, “Novel two-stage audiovisual speech filtering in noisy environments,” Cognitive
Computation, pp. 1–18, 2013.
[2] J. Greenberg, “Improved design of microphone-array hearing aids,” 1994.
[3] R. Zelinski, “A microphone array with adaptive post-filtering for noise reduction in reverberant rooms,” inAcoustics, Speech, and Signal Processing, 1988. ICASSP-88., 1988 International Conference on, pp. 2578–2581, 1988.
[4] A. Hussain, S. Cifani, S. Squartini, F. Piazza, and T. Durrani, “A Novel Psychoacoustically Motivated Mul-tichannel Speech Enhancement System,” Verbal and Nonverbal Communication Behaviours, pp. 190–199,2007.
[5] L. Yang, J. Lv, and Y. Xiang, “Underdetermined blind source separation by parallel factor analysis in time-frequency domain,” Cognitive computation, pp. 1–8, 2013.
[6] S. Gannot, D. Burshtein, and E. Weinstein, “Signal enhancement using beamforming and nonstationaritywith applications to speech,” IEEE Transactions on Signal Processing, vol. 49, no. 8, pp. 1614–1626, 2001.
[7] L. Griffiths and C. Jim, “An alternative approach to linearly constrained adaptive beamforming,” IEEE Trans-actions on Antennas and Propagation, vol. 30, no. 1, pp. 27–34, 1982.
[8] N. Wiener, Extrapolation, interpolation, and smoothing of stationary time series: with engineering applica-tions. The MIT Press, 1949.
[9] J. Li, S. Sakamoto, S. Hongo, M. Akagi, Y. Suzuki, et al., “A two-stage binaural speech enhancementapproach for hearing aids with preserving binaural benefits in noisy environments,” Journal of the AcousticalSociety of America, vol. 123, no. 5, pp. 3012–3012, 2008.
[10] J. Li, S. Sakamoto, S. Hongo, M. Akagi, and Y. Suzuki, “Two-stage binaural speech enhancement withWiener filter for high-quality speech communication,” Speech Communication, 2010.
[11] T. Van den Bogaert, S. Doclo, J. Wouters, and M. Moonen, “Speech enhancement with multichannel Wienerfilter techniques in multimicrophone binaural hearing aids,” The Journal of the Acoustical Society of Amer-ica, vol. 125, pp. 360–371, 2009.
[12] M. Anderson, T. Adali, and X.-L. Li, “Joint blind source separation with multivariate gaussian model: algo-rithms and performance analysis,” Signal Processing, IEEE Transactions on, vol. 60, no. 4, pp. 1672–1683,2012.
[13] B. Rivet, L. Girin, and C. Jutten, “Mixing Audiovisual Speech Processing and Blind Source Separation forthe Extraction of Speech Signals From Convolutive Mixtures,” IEEE Transactions on Audio, Speech andLanguage Processing, vol. 15, no. 1, pp. 96–108, 2007.
[14] B. Rivet and J. Chambers, “Multimodal speech separation,” in Advances in Nonlinear Speech Processing(J. Sole-Casals and V. Zaiats, eds.), vol. 5933 of Lecture Notes in Computer Science, pp. 1–11, SpringerBerlin / Heidelberg, 2010.
[15] B. Rivet, L. Girin, and C. Jutten, “Log-rayleigh distribution: A simple and efficient statistical representationof log-spectral coefficients,” IEEE transactions on audio, speech, and language processing, vol. 15, no. 3,pp. 796–802, 2007.
[16] W. Sumby and I. Pollack, “Visual contribution to speech intelligibility in noise,” Journal of the AcousticalSociety of America, vol. 26, no. 2, pp. 212–215, 1954.
[17] N. P. Erber, “Auditory-visual perception of speech,” Journal of Speech and Hearing Disorders, vol. 40, no. 4,p. 481, 1975.
34

[18] Q. Summerfield, “Use of visual information for phonetic perception,” Phonetica, vol. 36, no. 4-5, pp. 314–331, 1979.
[19] F. Berthommier, “A phonetically neutral model of the low-level audio-visual interaction,” Speech Communi-cation, vol. 44, no. 1, pp. 31–41, 2004.
[20] H. McGurk and J. MacDonald, “Hearing lips and seeing voices,” Nature, vol. 264, pp. 746–748, 1976.
[21] M. L. Patterson and J. F. Werker, “Two-month-old infants match phonetic information in lips and voice,”Developmental Science, vol. 6, no. 2, pp. 191–196, 2003.
[22] M. L. Patterson and J. F. Werker, “Matching phonetic information in lips and voice is robust in 4.5-month-oldinfants,” Infant Behavior and Development, vol. 22, no. 2, pp. 237–247, 1999.
[23] A. A. Ghazanfar, K. Nielsen, and N. K. Logothetis, “Eye movements of monkey observers viewing vocaliz-ing conspecifics,” Cognition, vol. 101, no. 3, pp. 515–529, 2006.
[24] J.-L. Schwartz, F. Berthommier, and C. Savariaux, “Seeing to hear better: evidence for early audio-visualinteractions in speech identification,” Cognition, vol. 93, no. 2, pp. B69–B78, 2004.
[25] K. W. Grant and P.-F. Seitz, “The use of visible speech cues for improving auditory detection of spokensentences,” The Journal of the Acoustical Society of America, vol. 108, p. 1197, 2000.
[26] J. Kim and C. Davis, “Testing the cuing hypothesis for the av speech detection advantage,” in AVSP 2003-International Conference on Audio-Visual Speech Processing, 2003.
[27] L. E. Bernstein, S. Takayanagi, and E. T. Auer Jr, “Enhanced auditory detection with av speech: Perceptualevidence for speech and non-speech mechanisms,” in AVSP 2003-International Conference on Audio-VisualSpeech Processing, 2003.
[28] K. W. Grant, “The effect of speechreading on masked detection thresholds for filtered speech,” The Journalof the Acoustical Society of America, vol. 109, p. 2272, 2001.
[29] K. S. Helfer and R. L. Freyman, “The role of visual speech cues in reducing energetic and informationalmasking,” The Journal of the Acoustical Society of America, vol. 117, p. 842, 2005.
[30] F. Wightman, D. Kistler, and D. Brungart, “Informational masking of speech in children: Auditory-visualintegration,” The journal of the Acoustical Society of America, vol. 119, p. 3940, 2006.
[31] D. Sodoyer, B. Rivet, L. Girin, C. Savariaux, J.-L. Schwartz, and C. Jutten, “A study of lip movements duringspontaneous dialog and its application to voice activity detection,” The Journal of the Acoustical Society ofAmerica, vol. 125, no. 2, pp. 1184–1196, 2009.
[32] H. Yehia, P. Rubin, and E. Vatikiotis-Bateson, “Quantitative association of vocal-tract and facial behavior,”Speech Communication, vol. 26, no. 1-2, pp. 23–43, 1998.
[33] J. Barker and F. Berthommier, “Estimation of speech acoustics from visual speech features: A comparison oflinear and non-linear models,” in AVSP’99-International Conference on Auditory-Visual Speech Processing,1999.
[34] I. Almajai and B. Milner, “Maximising audio-visual speech correlation,” in Proc. AVSP, 2007.
[35] S. Cifani, A. Abel, A. Hussain, S. Squartini, and F. Piazza, “An investigation into audiovisual speech cor-relation in reverberant noisy environments,” in Cross-Modal Analysis of Speech, Gestures, Gaze and FacialExpressions: COST Action 2102 International Conference Prague, Czech Republic, October 15-18, 2008Revised Selected and Invited Papers, vol. 5641, pp. 331–343, Springer-Verlag, 2009.
[36] A. Abel, A. Hussain, Q. Nguyen, F. Ringeval, M. Chetouani, and M. Milgram, “Maximising audiovisual cor-relation with automatic lip tracking and vowel based segmentation,” in Biometric ID Management and Mul-timodal Communication: Joint COST 2101 and 2102 International Conference, BioID MultiComm 2009,Madrid, Spain, September 16-18, 2009, Proceedings, vol. 5707, pp. 65–72, Springer-Verlag, 2009.
35
[37] L. Girin, J. Schwartz, and G. Feng, “Audio-visual enhancement of speech in noise,” The Journal of theAcoustical Society of America, vol. 109, p. 3007, 2001.
[38] R. Goecke, G. Potamianos, and C. Neti, “Noisy audio feature enhancement using audio-visual speech data,”in Acoustics, Speech, and Signal Processing, 2002. Proceedings.(ICASSP’02). IEEE International Confer-ence on, vol. 2, pp. 2025–2028, IEEE, 2002.
[39] G. Potamianos, C. Neti, and S. Deligne, “Joint Audio-Visual Speech Processing for Recognition and En-hancement,” in AVSP 2003-International Conference on Auditory-Visual Speech Processing, pp. 95–104,2003.
[40] I. Almajai and B. Milner, “Enhancing Audio Speech using Visual Speech Features,” in Proc. Interspeech,Brighton, UK, 2009.
[41] Q. Nguyen and M. Milgram, “Semi adaptive appearance models for lip tracking,” in ICIP09, pp. 2437–2440,2009.
[42] S. Calinon, F. Guenter, and A. Billard, “On learning, representing, and generalizing a task in a humanoidrobot,” IEEE Transactions on Systems, Man, and Cybernetics, Part B, vol. 37, no. 2, pp. 286–298, 2007.
[43] I. Almajai and B. Milner, “Effective visually-derived Wiener filtering for audio-visual speech processing,”in Proc. Interspeech, Brighton, UK, 2009.
[44] N. Tellier, H. Arndt, and H. Luo, “Speech or noise? using signal detection and noise reduction,” HearingReview, vol. 10, no. 6, pp. 48–51, 2003.
[45] A. Esposito, E. Ezin, and C. Reyes-Garcia, “Designing a fast neuro-fuzzy system for speech noise cancella-tion,” MICAI 2000: Advances in Artificial Intelligence, pp. 482–492, 2000.
[46] K. Chung, “Challenges and recent developments in hearing aids. part i. speech understanding in noise, mi-crophone technologies and noise reduction algorithms,” Trends Amplif, vol. 8, no. 3, pp. 83–124, 2004.
[47] M. El-Wakdy, E. El-Sehely, M. El-Tokhy, A. El-Hennawy, N. Mastorakis, V. Mladenov, Z. Bojkovic,D. Simian, S. Kartalopoulos, A. Varonides, et al., “Speech recognition using a wavelet transform to establishfuzzy inference system through subtractive clustering and neural network(anfis),” in WSEAS InternationalConference. Proceedings. Mathematics and Computers in Science and Engineering, no. 12, WSEAS, 2008.
[48] L. Zadeh, “Fuzzy sets*,” Information and control, vol. 8, no. 3, pp. 338–353, 1965.
[49] P. Viola and M. Jones, “Rapid object detection using a boosted cascade of simple features,” in ComputerVision and Pattern Recognition, IEEE Computer Society Conference on, vol. 1, pp. 511–518, IEEE Comput.Soc, 2001.
[50] D.-J. Kroon, “Viola jones object detection.” http://www.mathworks.com/matlabcentral/fileexchange/29437-viola-jones-object-detection, 2010.
[51] A. Bagis, “Determining fuzzy membership functions with tabu search–an application to control,” Fuzzy setsand systems, vol. 139, no. 1, pp. 209–225, 2003.
[52] C. Sanderson, Biometric person recognition: Face, speech and fusion. VDM Verlag Dr. Muller, 2008.
[53] M. Cooke, J. Barker, S. Cunningham, and X. Shao, “An audio-visual corpus for speech perception and auto-matic speech recognition,” The Journal of the Acoustical Society of America, vol. 120, no. 5 Pt 1, pp. 2421–2424, 2006.
[54] Y. Hu and P. Loizou, “Evaluation of objective quality measures for speech enhancement,” IEEE Transactionson Audio, Speech and Language Processing, vol. 16, no. 1, pp. 229–238, 2008.
[55] Y. Lu and P. Loizou, “A geometric approach to spectral subtraction,” Speech communication, vol. 50, no. 6,pp. 453–466, 2008.
36