Embed Size (px)
Citation preview

RESEARCH ARTICLE
Dengue seroprevalence and force of primary
infection in a representative population of
urban dwelling Indonesian children
Ari Prayitno1☯, Anne-Frieda Taurel2☯*, Joshua Nealon2, Hindra Irawan Satari1, Mulya
Rahma Karyanti1, Rini Sekartini1, Soedjatmiko Soedjatmiko1, Hartono Gunardi1, Bernie
Endyarni Medise1, R. Tedjo Sasmono3, James Mark Simmerman2, Alain Bouckenooghe4,
Sri Rezeki Hadinegoro1
1 Department of Child Health, Faculty of Medicine Universitas Indonesia, Jakarta, Indonesia, 2 Epidemiology
and Health Economics & Outcomes Research, Sanofi Pasteur Asia & JPAC Region, Singapore, 3 Eijkman
Institute for Molecular Biology, Jakarta, Indonesia, 4 Medical Affairs & Clinical Sciences Department, Sanofi
Pasteur Asia and JPAC Region, Singapore
☯ These authors contributed equally to this work.
Abstract
Background
Indonesia reports the second highest dengue disease burden in the world; these data are
from passive surveillance reports and are likely to be significant underestimates. Age-strati-
fied seroprevalence data are relatively unbiased indicators of past exposure and allow
understanding of transmission dynamics.
Methodology/Principal Findings
To better understand dengue infection history and associated risk factors in Indonesia, a
representative population-based cross-sectional dengue seroprevalence study was con-
ducted in 1–18-year-old urban children. From October to November 2014, 3,210 children
were enrolled from 30 geographically dispersed clusters. Serum samples were tested for
anti-dengue IgG antibodies by indirect ELISA. A questionnaire investigated associations
between dengue serologic status and household socio-demographic and behavioural fac-
tors. Overall, 3,194 samples were tested, giving an adjusted national seroprevalence in
this urban population of 69.4% [95% CI: 64.4–74.3] (33.8% [95% CI: 26.4–41.2] in the
1–4-year-olds, 65.4% [95% CI: 69.1–71.7] in the 5–9-year-olds, 83.1% [95% CI: 77.1–
89.0] in the 10–14-year-olds, and 89.0% [95% CI: 83.9–94.1] in the 15–18-year–olds).
The median age of seroconversion estimated through a linear model was 4.8 years. Using
a catalytic model and considering a constant force of infection we estimated 13.1% of chil-
dren experience a primary infection per year. Through a hierarchical logistic multivariate
model, the subject’s age group (1–4 vs 5–9 OR = 4.25; 1–4 vs. 10–14 OR = 12.60; and
1–4 vs 15–18 OR = 21.87; p<0.0001) and the number of cases diagnosed in the house-
hold since the subject was born (p = 0.0004) remained associated with dengue serological
status.
PLOS Neglected Tropical Diseases | https://doi.org/10.1371/journal.pntd.0005621 June 15, 2017 1 / 16
a1111111111
a1111111111
a1111111111
a1111111111
a1111111111
OPENACCESS
Citation: Prayitno A, Taurel A-F, Nealon J, Satari
HI, Karyanti MR, Sekartini R, et al. (2017) Dengue
seroprevalence and force of primary infection in a
representative population of urban dwelling
Indonesian children. PLoS Negl Trop Dis 11(6):
e0005621. https://doi.org/10.1371/journal.
pntd.0005621
Editor: Ricardo E. Gurtler, Universidad de Buenos
Aires, ARGENTINA
Received: January 2, 2017
Accepted: May 3, 2017
Published: June 15, 2017
Copyright: © 2017 PRAYITNO et al. This is an open
access article distributed under the terms of the
Creative Commons Attribution License, which
permits unrestricted use, distribution, and
reproduction in any medium, provided the original
author and source are credited.
Data Availability Statement: All relevant data are
within the paper and its Supporting Information
files.
Funding: This work was supported by Sanofi
Pasteur. The sponsor participated in the study
design, data collection and analysis, decision to
publish, and preparation of the manuscript. The
interpretation of the data and the opinions
expressed in the manuscript are those of the
authors. Manuscript editing, assistance and

Conclusions/Significance
This is the first dengue seroprevalence study in Indonesia that is targeting a representative
sample of the urban paediatric population. This study revealed that more than 80% of chil-
dren aged 10 years or over have experienced dengue infection at least once. Prospective
incidence studies would likely reveal dengue burdens far in excess of reported incidence
rates.
Author summary
Indonesia reported to the WHO the world’s second highest average number of dengue
cases and the highest in Asia from 2004 to 2010. These passive surveillance reports vary
widely within the country and are likely to be a severe under-estimation of the full disease
burden as frequently only dengue haemorrhagic fever is captured. Understanding the
intensity of dengue virus transmission and associated risk factors nationwide is necessary
to guide and prioritize appropriate prevention and control measures against dengue dis-
ease, especially considering the availability of the first dengue vaccine and recent recom-
mendations for its use in areas of high endemicity, as measured by seroprevalence and
other indicators. Age-stratified seroprevalence data provide robust estimates of past expo-
sure and can inform on transmission intensity. Therefore, we conducted a seroprevalence
study of anti-dengue IgG antibodies in a representative sample of urban-dwelling Indone-
sian children. We found an overall dengue seroprevalence of 69.4% with half of the chil-
dren having been infected at least once by the age of 5 years. Age of the subject and the
number of dengue cases diagnosed in the household were associated with serostatus.
These results confirm the high dengue disease burden in Indonesia and the urgency of
implementation of effective prevention and control measures.
Introduction
Dengue is an arbovirus transmitted to humans via the bites of infected Aedes mosquitoes. It
is the most rapidly spreading mosquito-borne viral disease with a global incidence that has
increased 30-fold over the last 50 years [1]. While reliable burden estimates remain elusive,
two studies have estimated the global symptomatic disease burden to be 96 million and 58.4
million cases/year, with 70–80% of cases occurring in the Asia-Pacific region [2, 3]. Tradition-
ally an urban disease, dengue disease is increasingly reported in rural areas and its geographic
range has expanded to more than 125 tropical countries [1]. There is no specific antiviral treat-
ment; clinical management is focused on careful fluid management and detection of early
warning signs of severe disease. Historically, prevention measures have focused on vector con-
trol, education and behavioural changes to reduce interactions between humans and vector
mosquitoes [4, 5]. Improved clinical management and public awareness have contributed to
declining case fatality rates to below 1% in most countries [1]. While this represents important
progress, overall dengue incidence continues to rise and fatalities remain unacceptably high,
suggesting that traditional control approaches are not sufficient. Vector control measures are
important yet operationally challenging, of variable effectiveness and costly to sustain [6]. Rou-
tine vaccination is becoming a reality: several dengue vaccines are at different stages of clinical
development [7] and a chimeric tetravalent vaccine from Sanofi Pasteur is being licensed in an
Dengue seroprevalence and force of infection in Indonesian children
PLOS Neglected Tropical Diseases | https://doi.org/10.1371/journal.pntd.0005621 June 15, 2017 2 / 16
support for the submission provided by inScience
Communications, Springer Healthcare, funded by
Sanofi Pasteur.
Competing interests: I have read the journal’s
policy and the authors of this manuscript have the
following competing interests: AP, HIS, MRK, RS,
SS, HG, BEM, RTS, SRH have been clinical trial
and/or study investigators for, and received
associated payments from, Sanofi Pasteur; AFT,
JN, MS and AB are employees of Sanofi Pasteur
increasing number of countries in Latin America and Asia [7, 8]. In this new era of dengue as
a vaccine-preventable disease, an accurate understanding of disease burden and transmission
patterns will be essential to inform vaccine policy decisions.
Dengue is hyper-endemic with frequent epidemic cycles in Indonesia. The disease is most
common in urban areas and in recent years has reportedly spread to smaller, more rural vil-
lages. Reported incidence remains highest in children 1–15 years of age, but since the 1980s
incidence in persons over 15 years of age has gradually increased [9, 10]. Reporting of dengue
haemorrhagic fever (DHF) is mandatory in Indonesia and the country typically reports the
highest number of cases in the WHO Southeast Asia Region [1]. Between 2001 and 2011, there
was an average of 94,564 reported cases and between 472 and 1,446 reported deaths per year
[1, 11]. Dengue disease reporting is acknowledged by Indonesian experts to be incomplete
and to vary widely between provinces, with reported incidence rates ranging from 2.2 to 168.5
cases per 100,000 inhabitants in 2013 [12].
An improved understanding of dengue epidemiology, burden and its dynamic characteris-
tics are important for public health planning. Seroprevalence studies in healthy volunteers pro-
vide information on infection history in the population, from which inferences about disease
burden may be drawn. Since age reflects duration of exposure, age-stratified data provide
insights into transmission dynamics [13–17]. There is a lack of dengue seroepidemiological
data from Indonesia and no previous study has used a population representative sample of
urban Indonesian children [18–20]. This is a particularly important gap as it will provide infor-
mation on whether the variations in reported incidence from different Indonesian provinces
are reflective of underlying transmission dynamics or to the result of the reporting or surveil-
lance practices employed. We conducted a seroprevalence study in urban-dwelling Indonesian
children to improve understanding of dengue epidemiology and infection risk factors and
inform future dengue vaccine policy decisions.
Methods
The present study is reported according to STrengthening the Reporting of OBservational
studies in Epidemiology (STROBE) recommendations (supporting information file).
Ethic statement
The protocol was reviewed and ethical approval was obtained from the Health Research Ethics
Committee of Faculty of Medicine of University of Indonesia.
Study area
Indonesia is the largest country in Southeast Asia, with an area of 1.91 million km2. The
country has a population of 252.2 million living on five main islands and four archipelagos
(>17,000 islands) administratively divided into 34 provinces [21]. In 2014/2015, approxi-
mately 60% of Indonesians were living on the island of Java and 53.3% lived in urban areas
[21, 22]. Indonesia is divided into five administrative levels: provinces (n = 34), regencies
(n = 416), cities (n = 98), subdistricts (n = 7,024), and villages (n = 81,626). Villages are consid-
ered either as rural (desa) or urban (kelurahan) based on population density, percentage of
agricultural household and number of urban facilities such as schools and hospitals [21, 23].
Sampling design
A population-based cross-sectional study design was adapted from the World Health Organi-
zation (WHO) Expanded Program on Immunization (EPI) cluster survey method. This
Dengue seroprevalence and force of infection in Indonesian children
PLOS Neglected Tropical Diseases | https://doi.org/10.1371/journal.pntd.0005621 June 15, 2017 3 / 16

approach considers 30 clusters as an adequate number for their means to be normally distrib-
uted, thus permitting statistical theory based on the normal distribution to be used to analyse
the data [24, 25]. Based on the probability proportional to population size, 30 urban subdis-
tricts were selected using demographic data from 2009 or 2010, provided by the Sub-Director-
ate of Statistical Services and Promotion, Statistics Indonesia.
The geographical coordinates of Indonesian administrative units were retrieved from the
Global Rural-Urban Mapping Project, maintained by the Socioeconomic Data and ApplicationsCenter [26]. Provinces were listed based on their mean geographical coordinates from West to
East (Fig 1) and the cumulative urban population of their subdistricts was calculated using
2010 population data. To ensure the population of clusters was sufficient to enrol the desired
sample, a minimum population of 1,000 persons per subdistrict was defined and any smaller
subdistricts were removed from the list. The first cluster was selected by generating a random
number between 1 and 1/30th of the total urban population, using Epi Info Version 7, and
selecting the first subdistrict for which the cumulative population was superior or equal to this
random number. Subsequent clusters were selected by adding 1/30th of the urban population
to the random number and selecting the first corresponding subdistrict for which cumulative
population was higher or equal so that:
Clusteri cumulative population � random number þ i � 1=30 of urban population
The 30 subdistricts selected by this method are listed in Appendix 1. Each subdistrict in
Indonesia contains one main health centre (puskesmas kecamatan) whose catchment area
was the site of the study. Households in the five neighbourhood associations located closest to
the health centre (each comprising 30–50 households, giving a total of 150–250 households)
were eligible to participate in the study. Household visits were conducted, inviting one child
from each household to participate, until the sample size was reached. A table indicating the
required number of children from each of four age groups was provided to the health centre
study teams. If a household had only one eligible child, the child was invited. When a house-
hold had several eligible children, a child in the age group with the fewest children already
Fig 1. Map of Indonesia showing the ranking of provinces from West to East and study sites’ geographic distribution. Provinces with at least
one site are coloured in grey. Developed with QGIS 1.8.0 using data from Global Rural-Urban Mapping Project18.
https://doi.org/10.1371/journal.pntd.0005621.g001
Dengue seroprevalence and force of infection in Indonesian children
PLOS Neglected Tropical Diseases | https://doi.org/10.1371/journal.pntd.0005621 June 15, 2017 4 / 16

participating was selected. Towards the end of the survey, survey teams were allocated a spe-
cific number of subjects in each age group to recruit to avoid over-sampling. If the parents
refused the participation of the selected child, the household was not included. This process
was continued until the desired sample size was achieved in each of the 30 clusters.
Sample size
The sample size was calculated using EpiInfo Version 7 to estimate seroprevalence in each of
four age groups (1–4, 5–9, 10–14 and 15–18 years old) with 95% confidence, a margin error of
5% and accounting for clustering with a design effect of 2. The expected national seropreva-
lence, based on Indonesian expert opinion and published regional data [14, 19, 27, 28], was
25% in the 1–4-year-old group, 45% in the 5–9-year-old group, 55% in the 10–14-year-old
group and 65% in the 15–18-year-old group. To account for incomplete data, a 10% contin-
gency was applied. The total sample size was 3,210 children, 660 from the 1–4-year-old group
(22 per cluster), 870 from the 5–9-year-old group (29 per cluster), 870 from the 10–14-year-
old group (29 per cluster) and 810 from the 15–18-year-old group (27 per cluster). In total, 107
children were enrolled in each cluster.
Enrolment
The study was presented to families during monthly neighbourhood association meetings.
After household visits, eligible subjects were invited to the healthcare centre for enrolment and
blood sampling if they were healthy, 1–18 years of age on inclusion day, and had lived in the
location for at least 1 year. An informed consent form was signed by a parent or legal guardian,
and by the subject if aged 13–18 years. Subjects aged 8–12 years provided signed assent.
A questionnaire was administered to collect information on demographics, knowledge
of dengue symptoms and transmission, vector control practice, and medical history in the
household.
Blood sampling and laboratory analysis
For each subject, 2mL of venous blood was drawn into plain vacutainer tubes. After centrifuga-
tion, serum aliquots were frozen at -20˚C before refrigerated transport by courier to a central
laboratory for analysis. Each specimen was tested for dengue IgG antibodies by ELISA using
the commercial Panbio Dengue IgG Indirect ELISA kit (sensitivity = 96.3%; specificity = 91.4–
100% according to manufacturer’s instructions; Panbio, Alere, Australia) [29]. Samples were
considered positive for previous dengue infection according to the standard protocols of the
manufacturer (Panbio units <9 is negative; 9–11 is equivocal; and>11 is positive).
Data analysis and statistics
All analyses were run using SAS 9.4.
Dengue antibody seroprevalence and associations between serologic status and socio-
demographic and behavioural factors. The statistical unit was the individual subject.
Seroprevalence and the 95% confidence interval (95% CI) were calculated taking account of
the cluster effect. Univariate logistic regression was used to identify variables significantly asso-
ciated with serologic status. As the data structure was hierarchical with subjects included in
clusters, hierarchical logistic regression models were used to consider subject intra-cluster cor-
relation. The clusters account for the random effect and the covariates were taken as fixed
effects. As these analyses were considered exploratory, a level of significance (p-value) of
<0.15 was applied at univariate level.
Dengue seroprevalence and force of infection in Indonesian children
PLOS Neglected Tropical Diseases | https://doi.org/10.1371/journal.pntd.0005621 June 15, 2017 5 / 16

The multivariate hierarchical model was reduced by applying a backward descending selec-
tion of the non-significant variables at p-value >0.05.
The final model was:
P Y ¼1
0
� �
ij ¼ b � Parameter þ m � cluster þ ε
Where P Y ¼ 1
0
� �ij was the probability for a j subject from a i cluster to be seropositive, the βs
were the fixed effect describing the subject variables associated with socio-demographic and
behavioural factors, μ the cluster random effect and ε the error term.
Median age of conversion. The median age of seroconversion was estimated by fitting a
weighted linear regression model to age-specific seroprevalence data. Seroprevalence data
were transformed into probits and age values were log transformed to fit the model [30, 31].
However, goodness of fit parameters were not respected. Therefore, a simple linear regression
was used.
Force of infection. Catalytic models use seroprevalence data as cumulative markers of
past infections that result in life-long immunity from which force of primary infection esti-
mates can be derived. [32, 33], Two force of infection models were developed to describe the
rate of infection over the last 18 years and to examine its variability over time. The first model
assumed a constant force of infection (model 1) and the second one assumed a force of infec-
tion that varied with age (model 2) [13].
The probability of a person living in the area being infected in one year, the force of infec-
tion, is estimated by [34]:
� p ¼ 1 � e� m
Where μ is the mean number of infections per year.
The variable force of infection model can be estimated by allowing a separate risk of infec-
tion for each age group, were pi is the mean number of infections per year for the ith age group
and A is the age midpoint of the ith age group [34]. By fitting a binomial model with a comple-
mentary log-log link function and by using X = log(A) as an offset term, α = log(μ) can be esti-
mated as an intercept parameter [34]. The probability of being infected for the ith group at
midpoint age A is pi = 1- exp(-μi Ai), so that:
Logð� logð1 � piÞÞ ¼ logðmiÞ þ logðAiÞ
Results
Site selection and baseline demographics
From a total of 6,299 Indonesian subdistricts, 2,823 with urban population were identified,
2,756 of which had an urban population >1,000 and were thus used for sampling. A map of
the 30 selected clusters is presented in Fig 1. From 30 October 2014 to 27 November 2014, a
total of 3,210 subjects were enrolled in the study; 39 subjects (1.2%) were excluded due to at
least one criteria of eligibility not being fulfilled and four subjects (0.1%) due to missing or
incomplete data (demographic or serologic status result). A total of 3,194 subjects (98.7%)
were included in the analyses (Fig 2); there were 107 subjects per site with the exception of
four sites with 106 subjects, three sites with 105 subjects and one site with 101 subjects.
There were 672 subjects in the 1–4-year-old age group, 861 subjects in the 5–9-year-old age
group, 886 in the 10–14-year-old age group and 775 in the 15–18-year-old age group. Among
them, 47.8% were male and the mean age was 9.7 years.
Dengue seroprevalence and force of infection in Indonesian children
PLOS Neglected Tropical Diseases | https://doi.org/10.1371/journal.pntd.0005621 June 15, 2017 6 / 16

Dengue antibody seroprevalence and association between serologic
status and socio-demographic and behavioural factors
The age-specific seroprevalence ranged from 26.4% (95% CI: 15.8–37.1) in those aged 1-year-
old to 95.3% (95% CI: 89.8–100) in the 18-year-old subjects (Fig 3). The median age at sero-
conversion was 4.8 years. The overall nationwide seroprevalence was 69.4%, with a minimum
of 34.6% and a maximum of 87.9% observed per site, and the seroprevalence per age group
was 33.8% in the 1–4year-old group, 65.4% in the 5–9-year-old group, 83.1% in the 10–
14-year-old group and 89.0% in the 15–18-year-old group (Table 1).
In the final data set, the level of non-response (“no data”) varied from 0.4 to 14.0%
(Table 1). Subjects were familiar with dengue disease, with 92% having heard about dengue
and 91.4% able to cite at least one symptom. Control practices reported included use of repel-
lent cream or mosquito spray (43.8%), elimination of mosquito breeding sites by covering
water containers (59.0%) and eliminating stagnant water around the home (85.1%). Most sub-
jects (75.3%) reported they had never been diagnosed with dengue.
Fig 2. Study flow chart.
https://doi.org/10.1371/journal.pntd.0005621.g002
Fig 3. Mean age-specific dengue antibody seroprevalence distribution and 95% confidence interval.
https://doi.org/10.1371/journal.pntd.0005621.g003
Dengue seroprevalence and force of infection in Indonesian children
PLOS Neglected Tropical Diseases | https://doi.org/10.1371/journal.pntd.0005621 June 15, 2017 7 / 16

Table 1. Description of subject demographics and knowledge of dengue symptoms and transmission, vector control practice, and medical history
in the household and results of the univariate hierarchical logistic model.
Variable Number samples
(%)
Response
rate
Seroprevalence [95%
CI]
Odd ratio [95%
CI]
P-value
Overall urban seroprevalence 3,194 69.4 [64.4–74.3]
Subject demographics
Gender 100%
Male 1527 (47.8%) 67.4 [62.4–72.5] Ref. 0.018
Female 1667 (52.2%) 71.1 [65.9–76.3] 1.21 [1.03;1.41]
Age 100%
1–4 672 (21.0%) 33.8 [26.4–41.2] Ref. <0.0001
5–9 861 (27.0%) 65.4 [59.1–71.7] 4.40 [3.50;5.52]
10–14 886 (27.7%) 83.1 [77.1–89.0] 12.95
[10.0;16.79]
15–18 775 (24.3%) 89.0 [84.0–94.1] 22.24
[16.48;30.01]
Subject household socio-demographic
Household 97.6% 0.076
Temporary/unplanned or slum 291 (9.1%) 62.2 [50.1;74.3] Ref.
Multi-floored building 277 (8.7%) 68.6 [59.0;78.0] 1.16 [0.79;1.71]
Single-story attached building 1780 (55.7%) 69.0 [63.3;74.7] 1.25 [0.94;1.67]
Single-story detached house 769 (24.1%) 72.4 [67.6;77.3] 1.47 [1.07;2.02]
No data 77 (2.4%) 77.9 [69.5;86.3] 1.93 [1.04;3.59]
Living in the house since birth 98.3% 0.547
Yes 2790 (87.3%) 69.7 [64.6;74.8] Ref.
No 351 (11.0%) 66.1 [58.4;73.7] 1.04 [0.81;1.35]
No data 53 (1.7%) 75.5 [67.3;83.6] 1.47 [0.74;2.95]
Average monthly household income 99.0% 0.320
<200000 910 (28.5%) 68.4 [63.0;76.7] Ref.
200,000–400,000 241 (7.5%) 68.0 [60.8;75.3] 0.86 [0.71;1.03]
>400,000 2011 (63.0%) 69.9 [64.0;75.8] 1 [0.74;1.36]
No data 32 (1%) 75 [65.8;84.2] 1.37 [0.60;3.16]
Parents/guardian highest education level 99.4% <0.0001
University 366 (11.5%) 60.4 [53.8;67.0] Ref.
Never went to formal school 92 (2.9%) 85.9 [79.0;92.8] 3.62 [1.87;7.00]
Finished elementary school 628 (19.7%) 72.8 [64.8;80.7] 1.77 [1.30;2.40]
Finished junior high school 707 (22.1%) 72.0 [65.8;78.2] 1.50 [1.12;2.00]
Finished senior high school 1383 (43.3%) 67.7 [63.1;72.4] 1.18 [0.91;1.52]
No data 18 (0.6%) 72.2 [56.8;87.6] 1.55 [0.52;4.60]
How many persons live in the household 99.6% <0.0001
1–3 491 (15.4%) 61.1 [54.4;67.8] Ref.
4–5 1803 (56.4%) 71.2 [66.4;76.1] 1.66 [1.33;2.07]
>5 886 (27.7%) 70.2 [63.1;77.3] 1.52 [1.18;1.95]
No data 14 (0.4%) 71.4 [50.4;72.4] 1.56 [0.47;5.19]
Dengue knowledge, exposure and control
Heard about dengue before the study 99.4% 0.168
No 236 (7.4%) 64.8 [52.0;77.6] Ref.
Yes 2940 (92.0%) 69.8 [65.0;74.5] 1.34 [0.99;1.82]
No data 18 (0.6%) 66.7 [47.0;86.3] 1.29 [0.45;3.72]
Knowledge of dengue illness symptoms* 91.7% 0.145
(Continued )
Dengue seroprevalence and force of infection in Indonesian children
PLOS Neglected Tropical Diseases | https://doi.org/10.1371/journal.pntd.0005621 June 15, 2017 8 / 16

Table 1. (Continued)
Variable Number samples
(%)
Response
rate
Seroprevalence [95%
CI]
Odd ratio [95%
CI]
P-value
No symptoms known 9 (0.3%) 55.6 [11.5;99.6] Ref.
At least one symptoms 2919 (91.4%) 69.8 [65.1;74.5] 1.94 [0.47;7.97]
No data 266 (8.3%) 65.4 [53.8;77.1] 1.50 [0.36;6.29]
How is dengue virus spreading among human 91.1% 0.444
Mosquito bite 2573 (80.6%) 70.0 [65.6;74.4] Ref.
Other 336 (10.5%) 66.7 [57.1;76.3] 0.96 [0.72;1.28]
No data 285 (8.9%) 67.0 [55.8;78.2] 0.83 [0.63;1.10]
When do mosquito bite 86.0% 0.380
During the day 2603 (81.5%) 69.5 [65.1;73.3] Ref.
At night 145 (4.5%) 73.8 [62.1;85.5] 1.14 [0.76;1.69]
No data 446 (14.0%) 67.3 [56.7;77.8] 0.87 [0.69;1.10]
Use insecticide spray to kill mosquitoes 98.1% 0.903
No 2037 (63.8%) 68.6 [62.7;74.5] Ref.
Yes 110 (3.4%) 75.4 [57.3;93.6] 1.09 [0.67;1.78]
Yes, all year long 733 (22.9%) 71.5 [67.3;75.6] 1.03 [0.84;1.27]
Yes, during epidemics 254 (7.9%) 67.3 [60.2;74.4] 0.88 [0.65;1.20]
No data 60 (1.9%) 68.3 [57.8;78.4] 0.92 [0.52;1.65]
Use mosquito mat/coil/liquid vaporizer 97.8% 0.905
No 1385 (43.4%) 70.5 [64.8;76.2] Ref.
Yes 123 (3.8%) 71.5 [54.4;88.7] 1.04 [0.66;1.62]
Yes, all year long 1210 (37.9%) 69.1 [64.2;74.0] 1.00 [0.83;1.21]
Yes, during epidemics 406 (12.7%) 66.0 [58.2;73.8] 1.08 [0.83;1.40]
No data 70 (2.2%) 67.1 [56.4;77.9] 0.81 [0.47;1.40]
Sleep under insecticidal bed net 97.2% 0.555
No 2890 (90.5%) 70.1 [65.3;74.8] Ref.
Yes 23 (0.7%) 78.3 [60.0;96.6] 1.21 [0.42;3.44]
Yes, all year long 179 (5.6%) 61.4 [49.1;73.8] 0.88 [0.62;1.24]
Yes, during epidemics 13 (0.4%) 46.1 [10.5;81.8] 0.57 [1.18;1.81]
No data 89 (2.8%) 65.2 [55.9;74.4] 0.74 [0.46;1.19]
Sleep under untreated bed net 97.0% 0.102
No 2563 (80.2%) 70.7 [66.2;75.3] Ref.
Yes 43 (1.3%) 72.1 [57.2;86.9] 0.92 [0.46;1.86]
Yes, all year long 454 (14.2%) 63.4 [52.2;74.7] 0.75 [0.59;0.95]
Yes, during epidemics 39 (1.2%) 48.7 [32.9;64.5] 0.58 [0.30;1.13]
No data 95 (3.0%) 69.5 [58.5;80.4] 0.86 [0.55;1.44]
Use air conditioner at home 97.0% 0.168
No 2854 (89.3%) 69.8 [64.6;75.0] Ref.
Yes 20 (0.6%) 65.0 [36.6;93.4] 0.61 [0.23;1.62]
Yes, all year long 208 (6.5%) 64.9 [55.1;74.7] 0.70 [0.51;0.96]
Yes, during epidemics 16 (0.5%) 62.5 [38.8.86.2] 0.71 [0.25;2.05]
No data 96 (3.0%) 68.7 [60.0;77.4] 0.82 [0.31;1.31]
Use mosquito repellent cream or spray 97.5% 0.259
No 1714 (53.7%) 65.8 [59.7;71.9] Ref.
Yes 118 (3.7%) 72.0 [54.7;89.4] 0.90 [0.57;1.44]
Yes, all year long 940 (29.4% 74.6 [70.2;78.9] 1.20 [0.98;1.47]
Yes, during epidemics 341 (10.7%) 72.1 [66.2;78.0] 1.25 [0.95;1.66]
(Continued )
Dengue seroprevalence and force of infection in Indonesian children
PLOS Neglected Tropical Diseases | https://doi.org/10.1371/journal.pntd.0005621 June 15, 2017 9 / 16
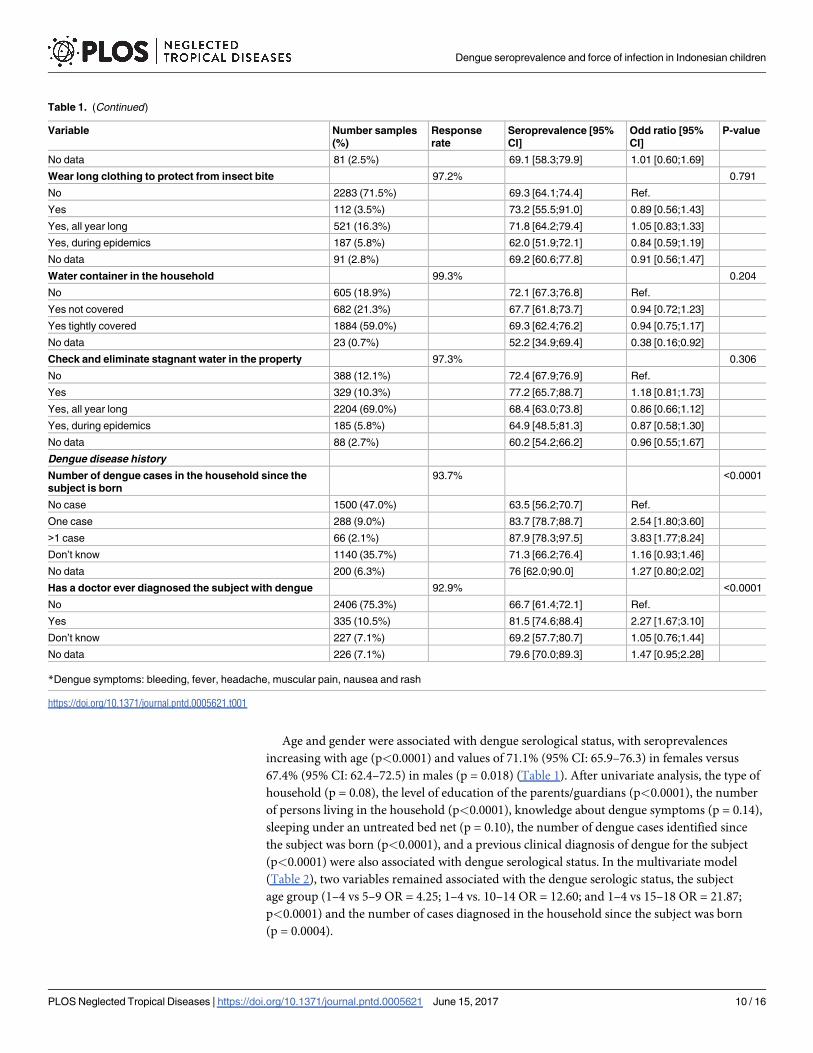
Age and gender were associated with dengue serological status, with seroprevalences
increasing with age (p<0.0001) and values of 71.1% (95% CI: 65.9–76.3) in females versus
67.4% (95% CI: 62.4–72.5) in males (p = 0.018) (Table 1). After univariate analysis, the type of
household (p = 0.08), the level of education of the parents/guardians (p<0.0001), the number
of persons living in the household (p<0.0001), knowledge about dengue symptoms (p = 0.14),
sleeping under an untreated bed net (p = 0.10), the number of dengue cases identified since
the subject was born (p<0.0001), and a previous clinical diagnosis of dengue for the subject
(p<0.0001) were also associated with dengue serological status. In the multivariate model
(Table 2), two variables remained associated with the dengue serologic status, the subject
age group (1–4 vs 5–9 OR = 4.25; 1–4 vs. 10–14 OR = 12.60; and 1–4 vs 15–18 OR = 21.87;
p<0.0001) and the number of cases diagnosed in the household since the subject was born
(p = 0.0004).
Table 1. (Continued)
Variable Number samples
(%)
Response
rate
Seroprevalence [95%
CI]
Odd ratio [95%
CI]
P-value
No data 81 (2.5%) 69.1 [58.3;79.9] 1.01 [0.60;1.69]
Wear long clothing to protect from insect bite 97.2% 0.791
No 2283 (71.5%) 69.3 [64.1;74.4] Ref.
Yes 112 (3.5%) 73.2 [55.5;91.0] 0.89 [0.56;1.43]
Yes, all year long 521 (16.3%) 71.8 [64.2;79.4] 1.05 [0.83;1.33]
Yes, during epidemics 187 (5.8%) 62.0 [51.9;72.1] 0.84 [0.59;1.19]
No data 91 (2.8%) 69.2 [60.6;77.8] 0.91 [0.56;1.47]
Water container in the household 99.3% 0.204
No 605 (18.9%) 72.1 [67.3;76.8] Ref.
Yes not covered 682 (21.3%) 67.7 [61.8;73.7] 0.94 [0.72;1.23]
Yes tightly covered 1884 (59.0%) 69.3 [62.4;76.2] 0.94 [0.75;1.17]
No data 23 (0.7%) 52.2 [34.9;69.4] 0.38 [0.16;0.92]
Check and eliminate stagnant water in the property 97.3% 0.306
No 388 (12.1%) 72.4 [67.9;76.9] Ref.
Yes 329 (10.3%) 77.2 [65.7;88.7] 1.18 [0.81;1.73]
Yes, all year long 2204 (69.0%) 68.4 [63.0;73.8] 0.86 [0.66;1.12]
Yes, during epidemics 185 (5.8%) 64.9 [48.5;81.3] 0.87 [0.58;1.30]
No data 88 (2.7%) 60.2 [54.2;66.2] 0.96 [0.55;1.67]
Dengue disease history
Number of dengue cases in the household since the
subject is born
93.7% <0.0001
No case 1500 (47.0%) 63.5 [56.2;70.7] Ref.
One case 288 (9.0%) 83.7 [78.7;88.7] 2.54 [1.80;3.60]
>1 case 66 (2.1%) 87.9 [78.3;97.5] 3.83 [1.77;8.24]
Don’t know 1140 (35.7%) 71.3 [66.2;76.4] 1.16 [0.93;1.46]
No data 200 (6.3%) 76 [62.0;90.0] 1.27 [0.80;2.02]
Has a doctor ever diagnosed the subject with dengue 92.9% <0.0001
No 2406 (75.3%) 66.7 [61.4;72.1] Ref.
Yes 335 (10.5%) 81.5 [74.6;88.4] 2.27 [1.67;3.10]
Don’t know 227 (7.1%) 69.2 [57.7;80.7] 1.05 [0.76;1.44]
No data 226 (7.1%) 79.6 [70.0;89.3] 1.47 [0.95;2.28]
*Dengue symptoms: bleeding, fever, headache, muscular pain, nausea and rash
https://doi.org/10.1371/journal.pntd.0005621.t001
Dengue seroprevalence and force of infection in Indonesian children
PLOS Neglected Tropical Diseases | https://doi.org/10.1371/journal.pntd.0005621 June 15, 2017 10 / 16
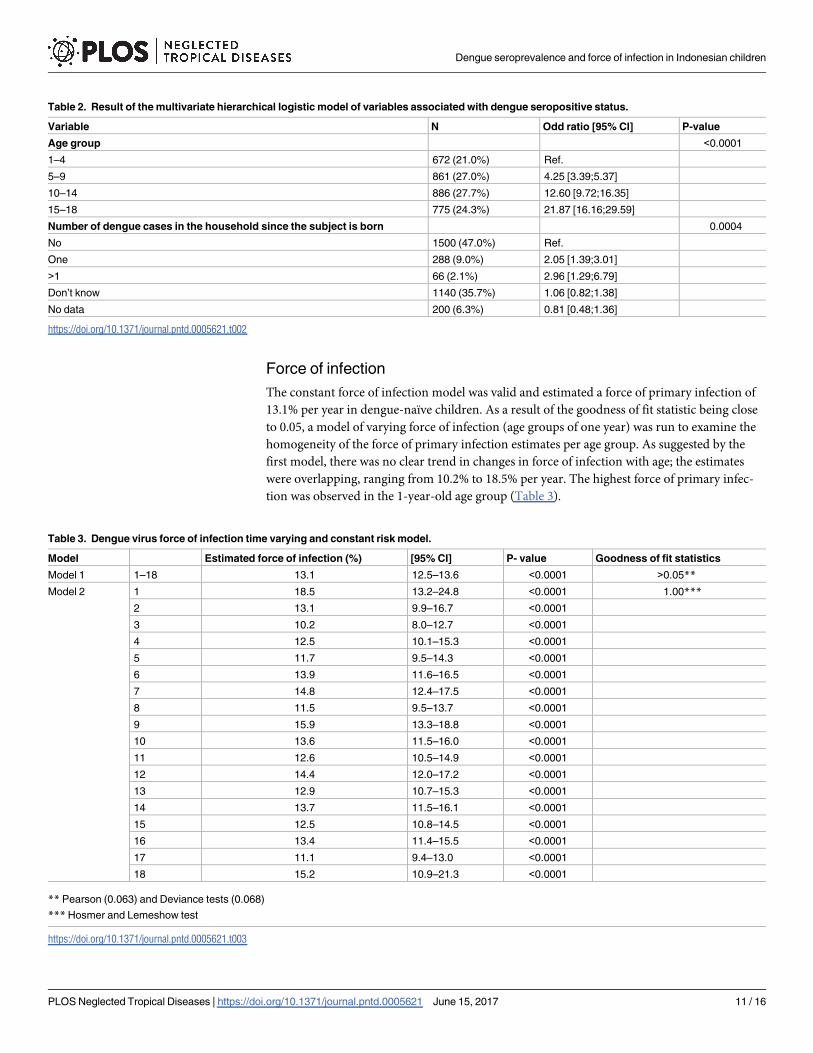
Force of infection
The constant force of infection model was valid and estimated a force of primary infection of
13.1% per year in dengue-naïve children. As a result of the goodness of fit statistic being close
to 0.05, a model of varying force of infection (age groups of one year) was run to examine the
homogeneity of the force of primary infection estimates per age group. As suggested by the
first model, there was no clear trend in changes in force of infection with age; the estimates
were overlapping, ranging from 10.2% to 18.5% per year. The highest force of primary infec-
tion was observed in the 1-year-old age group (Table 3).
Table 2. Result of the multivariate hierarchical logistic model of variables associated with dengue seropositive status.
Variable N Odd ratio [95% CI] P-value
Age group <0.0001
1–4 672 (21.0%) Ref.
5–9 861 (27.0%) 4.25 [3.39;5.37]
10–14 886 (27.7%) 12.60 [9.72;16.35]
15–18 775 (24.3%) 21.87 [16.16;29.59]
Number of dengue cases in the household since the subject is born 0.0004
No 1500 (47.0%) Ref.
One 288 (9.0%) 2.05 [1.39;3.01]
>1 66 (2.1%) 2.96 [1.29;6.79]
Don’t know 1140 (35.7%) 1.06 [0.82;1.38]
No data 200 (6.3%) 0.81 [0.48;1.36]
https://doi.org/10.1371/journal.pntd.0005621.t002
Table 3. Dengue virus force of infection time varying and constant risk model.
Model Estimated force of infection (%) [95% CI] P- value Goodness of fit statistics
Model 1 1–18 13.1 12.5–13.6 <0.0001 >0.05**
Model 2 1 18.5 13.2–24.8 <0.0001 1.00***
2 13.1 9.9–16.7 <0.0001
3 10.2 8.0–12.7 <0.0001
4 12.5 10.1–15.3 <0.0001
5 11.7 9.5–14.3 <0.0001
6 13.9 11.6–16.5 <0.0001
7 14.8 12.4–17.5 <0.0001
8 11.5 9.5–13.7 <0.0001
9 15.9 13.3–18.8 <0.0001
10 13.6 11.5–16.0 <0.0001
11 12.6 10.5–14.9 <0.0001
12 14.4 12.0–17.2 <0.0001
13 12.9 10.7–15.3 <0.0001
14 13.7 11.5–16.1 <0.0001
15 12.5 10.8–14.5 <0.0001
16 13.4 11.4–15.5 <0.0001
17 11.1 9.4–13.0 <0.0001
18 15.2 10.9–21.3 <0.0001
** Pearson (0.063) and Deviance tests (0.068)
*** Hosmer and Lemeshow test
https://doi.org/10.1371/journal.pntd.0005621.t003
Dengue seroprevalence and force of infection in Indonesian children
PLOS Neglected Tropical Diseases | https://doi.org/10.1371/journal.pntd.0005621 June 15, 2017 11 / 16

Discussion
This is the first dengue antibody seroprevalence study conducted in a representative popula-
tion of urban dwelling Indonesian children. The findings benefit from a cluster sampling
design with probability proportional to size method, and sensitive and specific dengue diag-
nostic assays performed in the same laboratory.
This study found that 69.4% of children had been previously infected with dengue virus,
more than 80% of children aged 10 years or over, indicating that the disease burden is
extremely high. A seroprevalence study conducted in 1995 in healthy children in Yogyakarta,
Indonesia, using the plaque reduction neutralization test to determine previous exposure,
reported the presence of neutralizing antibodies in 56.2% of 4–9-year-old children, ranging
from 37.2% in 4-year-old subjects to 69.7% in those 9 years of age. These are slightly lower
than the rates observed in our study (Fig 3 and Table 1) and may be reflective of increasing
dengue endemicity in the intervening decades, or geographic variability [19]. Our results also
show higher levels of dengue virus exposure than those reported in other dengue endemic
countries such as Sri Lanka (Colombo, 2008, 52.0% in those<12 years of age, and median age
of seroconversion of 4.7 years) [13, 35], and Vietnam (Binh Thuan, 2003, 65.7% in 7–13 year
olds) [14]. This elevated dengue exposure risk was also observed during a 2011 dengue vaccine
trial in 5 Asian countries, where baseline dengue seroprevalence was highest in Indonesian
children [36].
Our constant force of infection model estimated a 13.1% annual rate of primary infection
among 1–18-year-old children, while the variable model estimated a force of infection that var-
ied from 10.2% to 18.5%. These estimates are similar to those reported in Sri Lanka in 2008
(14.1% in those aged<12 years) and Southern Vietnam in 2003 (11.7% in 7–13-year-old
children) [13, 14]. Despite these similarities between Vietnam and Indonesia in terms of trans-
mission dynamics, the reported incidence of disease in Vietnam is more than twice that in
Indonesia. [37]. A number of hypotheses could explain this difference in findings: most likely,
it is reflective of Indonesia’s specific case definition for reported dengue disease (only DHF is
reported), but underlying virological, genetic or epidemiological differences could play a role.
From the constant force of primary infection model, it can be assumed that the average rate of
primary infection was not highly variable over the past 18 years. Additional analysis may be
needed to better understand infection risk over time. The recently observed increase in age dis-
tribution of reported cases may have been driven by more variable virologic, demographic,
reporting or other determinants of disease [10]. A similar phenomenon was illustrated by a
study conducted in Thailand showing that the upward shift in dengue case age was associated
with demographic changes [38].
It can be assumed that dengue awareness, through social mobilization and education cam-
paigns, begun in the 1970s, and the increasing public health importance associated with high
media coverage, has steadily increased [39]. Knowledge of dengue transmission and symptoms
was high within the study subjects; 92% of households had heard about dengue before our
study and were able to cite at least one of the disease symptoms, and more than 80% knew that
dengue virus is transmitted by diurnal mosquito bites. In term of exposure, household prac-
tices were focused on destroying mosquito breeding sites rather than personal protection. The
level of exposure to the virus, however, is strong evidence that these reported behaviours are
inadequate to protect against infection and additional prevention and control measures are
urgently required.
In the multivariate model, only subject age group and the number of dengue cases that
occurred in the household were associated with seropositive status. Some of the parameters
significantly associated with dengue seropositivity in univariate models were also implicated in
Dengue seroprevalence and force of infection in Indonesian children
PLOS Neglected Tropical Diseases | https://doi.org/10.1371/journal.pntd.0005621 June 15, 2017 12 / 16
other dengue studies conducted in Latin America and Asia. For example, parental level of edu-
cation and dengue illness history in the household have been associated with dengue seroposi-
tivity [17]. Other parameters, such as household size, exhibit an association inverse to that
previously reported in the literature [40]. This is most likely explained by confounding effects
from known risk factors such as age or unknown, socio-demographic drivers of exposure risk.
The lack of significant associations between socio-demographic and behavioural factors with
serological status provides evidence that essentially everyone is at risk of infection; that knowl-
edge of prevention and control at the individual/household level is not protective against infec-
tion; and that additional measures to prevent transmission are required. The retrospective
nature of our questionnaire limits the robustness of our results; recall bias may have been an
issue.
A recent expansion in dengue virus transmission from urban to peri-urban and rural areas
has been described [15] and the identification of provinces or areas of high transmission risk is
a focus of prevention and control planning. This study showed a high level of exposure across
urban Indonesia and, while we excluded rural areas from this study for operational reasons, it
is likely that nearby peri-urban populations may have experienced similar high levels of expo-
sure [40]. Another possible limitation is that cross-reaction between flaviviruses has been
documented and the risk of false positives cannot be excluded. We consider this risk as low,
because reports of other viruses such as Japanese encephalitis and Zika, in Indonesia, are rare.
This study was not designed to make national-level infection or disease burden estimates but
the observation that 13.1% of children suffer a primary infection per year translates into many
millions of infections per year. Adults are presumably infected with a similar frequency. A pro-
portion of these infections will be secondary, predisposing to symptomatic and severe disease.
While a modelling approach would be required to quantify this burden, these data are strongly
suggestive that dengue infections result in a significant burden of symptomatic and severe dis-
ease in urban Indonesia.
Supporting information
S1 Checklist. STROBE Checklist.
(DOC)
S1 Appendix. List of the 30 clusters selected in Indonesia.
(DOCX)
Acknowledgments
The authors would like to thank Annick Moureau from Sanofi Pasteur for her technical advice
on statistical methods, Benediktus Yohan and Rahma F. Hayati from Eijkman Institute for
Molecular Biology for their technical assistance in laboratory analysis, the health centre
employees who conducted the study in the field, the subjects and their family who agreed to
take part to this study, the employee of the Indonesian Sub-Directorate of Statistical Services
and Promotion Statistics (BPS) for providing the data for the sampling of urban areas. Juliette
Gray of inScience Communications, Springer Healthcare provided manuscript editing assis-
tance and provided support for the submission.
Author Contributions
Conceptualization: AFT JN AP JMS AB.
Formal analysis: AFT.
Dengue seroprevalence and force of infection in Indonesian children
PLOS Neglected Tropical Diseases | https://doi.org/10.1371/journal.pntd.0005621 June 15, 2017 13 / 16

Funding acquisition: AFT JN JMS AB.
Investigation: AP SRH HIS RMK RS SS HG RTS BEM.
Methodology: AFT JN JMS.
Project administration: AP SRH HIS MRK RS SS HG RTS BEM.
Supervision: SRH AP.
Validation: AFT JN AP JMS AB AP SRH HIS MRK RS SS HG RTS BEM.
Visualization: AFT.
Writing – original draft: AFT JN JMS.
Writing – review & editing: AFT JN AP JMS AB AP SRH HIS MRK RS SS HG RTS BEM.
References1. WHO, editor. Global Strategy For Dengue Prevention And Control, 2012–2020. Geneva: WHO Press;
2012.
2. Bhatt S, Gething PW, Brady OJ, Messina JP, Farlow AW, Moyes CL, et al. The global distribution and
burden of dengue. Nature. 2013.
3. Stanaway JD, Shepard DS, Undurraga EA, Halasa YA, Coffeng LE, Brady OJ, et al. The global burden
of dengue: an analysis from the Global Burden of Disease Study 2013. Lancet Infect Dis. 2016. Epub
2016/02/15. https://doi.org/10.1016/s1473-3099(16)00026-8 PMID: 26874619.
4. WHO. Dengue Haemorrhagic Fever: Diagnosis, treatment, prevention and control: World Health Orga-
nization; 1997.
5. Guzman MG, Halstead SB, Artsob H, Buchy P, Farrar J, Gubler DJ, et al. Dengue: a continuing global
threat. Nat Rev Microbiol. 2010; 8(12 Suppl):S7–16. https://doi.org/10.1038/nrmicro2460 PMID:
21079655.
6. Horstick O, Runge-Ranzinger S, Nathan MB, Kroeger A. Dengue vector-control services: how do they
work? A systematic literature review and country case studies. Transactions of the Royal Society of
Tropical Medicine and Hygiene. 2010; 104(6):379–86. Epub 2010/04/20. https://doi.org/10.1016/j.
trstmh.2009.07.027 PMID: 20400169.
7. Schwartz LM, Halloran ME, Durbin AP, Longini IM. The dengue vaccine pipeline: Implications for the
future of dengue control. Vaccine. 2015.
8. Capeding MR, Tran NH, Hadinegoro SR, Ismail HI, Chotpitayasunondh T, Chua MN, et al. Clinical effi-
cacy and safety of a novel tetravalent dengue vaccine in healthy children in Asia: a phase 3, rando-
mised, observer-masked, placebo-controlled trial. Lancet. 2014; 384(9951):1358–65. Epub 2014/07/
16. https://doi.org/10.1016/S0140-6736(14)61060-6 PMID: 25018116.
9. Indonesia S. Population of Indonesia by Village—Result of the 2010 population census 2010. http://bps.
go.id/eng/download_file/Population_of_Indonesia_by_Village_2010.pdf.
10. Karyanti M, Uiterwaal CSP, Kusriastuti R, Hadinegoro S, Rovers M, Heesterbeek H, et al. The changing
incidence of Dengue Haemorrhagic Fever in Indonesia: a 45-year registry-based analysis. BMC infec-
tious diseases. 2014; 14(1):412. https://doi.org/10.1186/1471-2334-14-412 PMID: 25064368
11. SEARO. Reported cases of dengue and deaths from the SEA countries 2000–2011 2013 [cited 2013
November 2013]. http://www.searo.who.int/entity/vector_borne_tropical_diseases/data/
ReportedCasesDeaths.pdf.
12. Indonesia MoH. Situasi Demam Berdarah Dengue Di Indonesia. [Situation of dengue fever in Indone-
sia]. April 2014 ed2014.
13. Tam CC, Tissera H, de Silva AM, De Silva AD, Margolis HS, Amarasinge A. Estimates of dengue force
of infection in children in Colombo, Sri Lanka. PLoS Negl Trop Dis. 2013; 7(6):e2259. https://doi.org/10.
1371/journal.pntd.0002259 PMID: 23755315.
14. Thai KT, Binh TQ, Giao PT, Phuong HL, Hung le Q, Van Nam N, et al. Seroprevalence of dengue anti-
bodies, annual incidence and risk factors among children in southern Vietnam. Tropical medicine &
international health: TM & IH. 2005; 10(4):379–86. https://doi.org/10.1111/j.1365-3156.2005.01388.x
PMID: 15807802.
Dengue seroprevalence and force of infection in Indonesian children
PLOS Neglected Tropical Diseases | https://doi.org/10.1371/journal.pntd.0005621 June 15, 2017 14 / 16

15. Muhammad Azami NA, Salleh SA, Neoh HM, Syed Zakaria SZ, Jamal R. Dengue epidemic in Malaysia:
Not a predominantly urban disease anymore. BMC Res Notes. 2011; 4:216. Epub 2011/07/01. https://
doi.org/10.1186/1756-0500-4-216 PMID: 21714858.
16. Wilder-Smith A, Foo W, Earnest A, Sremulanathan S, Paton NI. Seroepidemiology of dengue in the
adult population of Singapore. Tropical Medicine & International Health. 2004; 9(2):305–8.
17. Siqueira JB, Martelli CM, Maciel IJ, Oliveira RM, Ribeiro MG, Amorim FP, et al. Household survey of
dengue infection in central Brazil: spatial point pattern analysis and risk factors assessment. The Ameri-
can journal of tropical medicine and hygiene. 2004; 71(5):646–51. PMID: 15569799
18. Chairulfatah A, Setiabudi D, Agoes R, van Sprundel M, Colebunders R. Hospital based clinical surveil-
lance for dengue haemorrhagic fever in Bandung, Indonesia 1994–1995. Acta tropica. 2001; 80
(2):111–5. PMID: 11600087
19. Graham R, Juffrie M, Tan R, Hayes C, Laksono I, Ma’roef C, et al. A prospective seroepidemiologic
study on dengue in children four to nine years of age in Yogyakarta, Indonesia I. studies in 1995–1996.
The American journal of tropical medicine and hygiene. 1999; 61(3):412–9. PMID: 10497982
20. Porter KR, Beckett CG, Kosasih H, Tan RI, Alisjahbana B, RUDIMAN PIF, et al. Epidemiology of den-
gue and dengue hemorrhagic fever in a cohort of adults living in Bandung, West Java, Indonesia. The
American journal of tropical medicine and hygiene. 2005; 72(1):60–6. PMID: 15728868
21. Indonesia B-S. Statistical Yearbook of Indonesia 2015. In: Publication S-doSCa, editor. Indonesia:
BPS-Statistics Indonesia; 2015. p. 670.
22. Indonesia B-S. Percentage of Urban Population by Province, 2010–2035 2015 [cited 2015 01/09/2015].
http://www.bps.go.id/linkTabelStatis/view/id/1276.
23. Mulyana W. Rural-Urban Linkages: Indonesia Case Study. In: Urban and Regional Development Insti-
tute (URDI) J, Indonesia, editor. Santiago, Chile: RIMISP; 2014.
24. Henderson RH, Sundaresan T. Cluster sampling to assess immunization coverage: a review of experi-
ence with a simplified sampling method. Bulletin of the World Health Organization. 1982; 60(2):253.
PMID: 6980735
25. Turner AG, Magnani RJ, Shuaib M. A not quite as quick but much cleaner alternative to the Expanded
Programme on Immunization (EPI) Cluster Survey design. International journal of epidemiology. 1996;
25(1):198–203. PMID: 8666490
26. Center for International Earth Science Information Network—CIESIN—Columbia University, Interna-
tional Food Policy Research Institute—IFPRI, The World Bank, Centro Internacional de Agricultura
Tropical—CIAT. Global Rural-Urban Mapping Project, Version 1 (GRUMPv1): Urban Extents Grid. Pal-
isades, NY: NASA Socioeconomic Data and Applications Center (SEDAC); 2011.
27. Malavige G, Fernando S, Aaskov J, Sivayogan S, Dissanayaka T, Peelawattage M K, et al. Seropreva-
lence of Anti-dengue Virus Antibodies in Children in Colombo District, Sri Lanka. Dengue Bulletin. 2006;
30(Dec.).
28. Pengsaa K, Limkittikul K, Luxemburger C, Yoksan S, Chambonneau L, Ariyasriwatana C, et al. Age-
specific prevalence of dengue antibodies in Bangkok infants and children. The Pediatric infectious dis-
ease journal. 2008; 27(5):461–3. Epub 2008/03/25. https://doi.org/10.1097/INF.0b013e3181646d45
PMID: 18360303.
29. matters AKw. Panbio® Dengue IgG Indirect ELISA 2010–2015. http://www.alere.com/ww/en/product-
details/panbio-dengue-igg-indirect-elisa.html.
30. Ferreira MU, Hiramoto RM, Aureliano DP, da Silva-Nunes M, da Silva NS, Malafronte RS, et al. A Com-
munity-based Survey of Human Toxoplasmosis in Rural Amazonia: Seroprevalence, Seroconversion
Rate, and Associated Risk Factors. The American journal of tropical medicine and hygiene. 2009; 81
(1):171–6. PMID: 19556584
31. Ferreira MU, Camargo LMA, Ferreira CS. The median age of primary malaria infection in an Amazonian
community: Probit analysis of cross-sectional data. Acta Tropica. 1994; 58(1):73–8. http://dx.doi.org/
10.1016/0001-706X(94)90122-8. PMID: 7863855
32. Ferrari MJ, Djibo A, Grais RF, Grenfell BT, Bjornstad ON. Episodic outbreaks bias estimates of age-
specific force of infection: a corrected method using measles as an example. Epidemiology and infec-
tion. 2010; 138(1):108–16. https://doi.org/10.1017/S0950268809990173 PMID: 19538818.
33. Whitaker HJ, Farrington CP. Estimation of infectious disease parameters from serological survey data:
the impact of regular epidemics. Statistics in medicine. 2004; 23(15):2429–43. Epub 2004/07/27.
https://doi.org/10.1002/sim.1819 PMID: 15273957.
34. Inc. SI. SAS/STAT® 13.1 User’s Guide. Inc. SI, editor. Cary, NC, USA: SAS Institute Inc.; 2013.
35. Tissera HA, De Silva AD, Abeysinghe MRN, de Silva AM, Palihawadana P, Gunasena S, et al. Dengue
Surveillance in Colombo, Sri Lanka: Baseline seroprevalence among children. Procedia in Vaccinology.
2010; 2(1):109–12. http://dx.doi.org/10.1016/j.provac.2010.03.020.
Dengue seroprevalence and force of infection in Indonesian children
PLOS Neglected Tropical Diseases | https://doi.org/10.1371/journal.pntd.0005621 June 15, 2017 15 / 16

36. L’Azou M, Moureau A, Sarti E, Nealon J, Zambrano B, Wartel TA, et al. Symptomatic Dengue in Chil-
dren in 10 Asian and Latin American Countries. New England Journal of Medicine. 2016; 374
(12):1155–66. https://doi.org/10.1056/NEJMoa1503877 PMID: 27007959.
37. SEARO. Comprehensive Guidelines for Prevention and Control of Dengue and Dengue Haemorrhagic
Fever. WHO SEARO, 2011.
38. Rodriguez-Barraquer I, Buathong R, Iamsirithaworn S, Nisalak A, Lessler J, Jarman RG, et al. Revisit-
ing Rayong: shifting seroprofiles of dengue in Thailand and their implications for transmission and con-
trol. American journal of epidemiology. 2014; 179(3):353–60. Epub 2013/11/08. https://doi.org/10.1093/
aje/kwt256 PMID: 24197388.
39. Kusriastuti R, Sutomo S. Evolution of dengue prevention and control programme in Indonesia. Dengue
bulletin. 2005; 29:1.
40. Tipayamongkholgul M, Lisakulruk S. Socio-geographical factors in vulnerability to dengue in Thai vil-
lages: a spatial regression analysis. Geospatial health. 2011; 5(2):191–8. https://doi.org/10.4081/gh.
2011.171 PMID: 21590669
Dengue seroprevalence and force of infection in Indonesian children
PLOS Neglected Tropical Diseases | https://doi.org/10.1371/journal.pntd.0005621 June 15, 2017 16 / 16