Embed Size (px)
Citation preview
DEMOGRAPHIC FEATURES OF A LAPLAND LONGSPUR
POPULATION NEAR BARROW, ALASKA
THOMAS W. CUSTER AND FRANK A. PITELKA
ABsTP,•CT.--Breeding density, clutch size, hatching and fiedging success, and survival of adult Lapland Longspurs (Calcarius lapponicus) were monitored over a 7-year period near the Naval Arctic Research Laboratory, Barrow, Alaska. Nesting begins as soon as the tundra starts to clear of snow and appears to be timed so that the young of the year reach independence before the end of adult insect emergence. Arthropod prey become abruptly scarce after the period of insect emergence and thus probability of success for late broods is low. Time of nesting is also discussed in relation to factors of predation and timing of molt. At least 42.9% of males and 45.4% of females survived the next season after 1 year of age. Maximum longevity observed for both sexes is 6 years. Mean clutch size for all years investigated was 5.06 eggs per clutch. Clutch size showed both yearly and seasonal variation. The data indicate that timing of nesting is the chief factor in the observed clutch size differences, further modified by habitat quality, second nesting attempts, and probably age of female. Over a 4-year period the longspur breeding population on a 17-ha study plot declined from 15 to 2 breeding females. Life-table analysis indicates that low fledgling success for 3 consecu- tive years apparently was the main cause of this decline. Overall mean egg success was 44.0%, but close to 60% in 4 years considered more "normal." The low egg success was due to 3 consecutive years of high predation, which may have been related to the disrupted lemming cycle of the Barrow region.--Museum of Vertebrate Zoology, University of California, Berkeley, California 94720. Pres- ent address of senior author: Patuxent Wildlife Research Center, Laurel, Maryland 20811. Ac- cepted 9 December 1975.
THE increase in fieldwork in the Arctic in the 1950's and 1960's has made it
possible to examine various aspects of the demography of passefine birds there (Ricklefs 1969, 1973; Hussell 1972). Even so, information on density, clutch size, and hatching success of arctic birds is generally scarce, and only a few recent studies (e.g. Williamson 1968, Williamson and Emison 1971, Hussell 1972) had been carried out for more than one season.
The demographic data presented here represent part of an investigation dealing with the role of the Lapland Longspur (Calcarius lapponicus) in the arctic coastal tundra ecosystem of northern Alaska. Data on clutch size, hatching and fledging success, and survival of adults, which span a seven-year period (1967-1973), are analyzed by life-table techniques. During the course of the study longspur breeding density decreased drastically at Barrow. The life-table analysis helps explain the observed decline. Some data pertinent to various aspects of this paper are also drawn from work on the Lapland Longspur by F. A. Pitelka during the period 1951-1969.
Other parts of this study, dealing with diet, activity patterns, molt, and bioenerget- ics will be published elsewhere. Background information on coastal tundra as a habitat is available in Britton (1957) and Wiggins and Thomas (1962). The total ecological setting is compactly summarized by Bunnell et al. (1975).
METHODS
Nests were located at various stages of the nesting cycle and checked regularly (usually every other day) during the summers of 1967 to 1973 within a 3-mile radius of the Naval Arctic Research Laboratory, Bar- row, Alaska (7 lø20'N, 156ø46'W). The date of first egg laid for clutches not found during egg-laying was estimated using the known incubation period (12 days) and hatching date of the last egg. Date of first egg laid was also determined by counts of empty follicles in six female longspurs collected in the middle of their egg-laying period.
505 The Auk 94: 505-525. July 1977

506 CUSTEa AND PITELKA [Auk, Vol. 94
1967 1968 1969 1970 1971 1972 1973 14 15 8 8 4 2 5
Fig. 1. Nest location and number of nests for 7 years on a 17-hectare (42-acre) study plot. Connected black dots represent first and second nesting attempts of one pair. Connected starred dots represent nests of a polygamous male. Scale for 1 acre shown in upper left.
Clutches were considered complete when the number of eggs remained the same for more than 24 hours. As Mayfield (1961) and Hussell (1972) found, partial losses of clutches are infrequent and any error through failure to detect this is negligible. Unless specifically stated otherwise, "renesting" refers to second efforts following loss of the first nest.
Factors responsible for egg loss were defined as follows: hatching failure--egg(s) remaining in nest after hatching of clutch; lemming activity--egg(s) found outside of a nest built in a lemming runway; abandonment--entire clutch cold for 3 or more days; predation--disappearance of all eggs from the nest or egg shells found near the nest, often with nest torn or other signs of disturbance; unknown--disappearance of 1 or 2 eggs from the nest. Factors responsible for nestling loss were defined as follows: weather-- nestling(s) found dead in flooded or snow-tilled nest; starvation--one or more nestlings found dead in nest containing live young; abandonment--total brood found dead in nest; predation--disappearance of all nestlings prior to fledging; unknown--disappearance of one or more nestlings from a nest containing live young.
Nest and egg success was calculated by Mayfield's (1961) technique. This method is based on days of nest exposure and allows the use of all nests whether discovered early or late in the nesting cycle. The reason for using this technique is that success of eggs (number of young fledged per number of eggs laid) should theoretically be based on eggs watched throughout the nesting period, whereas nests are found at various stages of the nesting period. Thus if a substantial number of nests are found late in the nesting period, without Mayfield's technique nest success would be overestimated.
From 1968 to 1973 a trapline of 12 to 24 Glenhaven four-celled sparrow traps baited with commercial bird seed was run every 3 to 5 days during June and July on a 17 hectare (42-acre) study plot immediately southeast of the laboratory. In 1970 and 1971 the traps were run into late August. Additionally during June, July, and August of 1972 and 1973, 24 and 18 Glenhaven traps, respectively, were run every 3 to 5 days on a 25-hectare plot (International Biological Program tundra site 1) 2 miles south of the laboratory. The captured birds were marked with U.S. Fish and Wildlife Service bands and color of unique combina- tions. Most of the breeding females and all the breeding males on the study areas were marked during the course of the study. All nestlings on the study plots were banded prior to leaving the nest, and this was done also, as far as possible, for nestlings found off but near the study areas.
The stages of the breeding cycle used in this study follow Ricklefs (1969). The incubation period is the time between laying of the last egg and its subsequent hatching. The nestling period extends from the hatching time of the last egg until the last young leaves the nest. Fledging (young leaving nest) occurs in the longspur at Barrow 6 to 8 days after hatching of the last egg, but first flight occurs 12 days post- hatching (Maher 1964), and the juveniles start feeding partly on their own near onset of flight and become progressively more independent. At 24 days juveniles are moving about freely and entering traps baited with bird seed. By then they are completely independent of parental care.
RESULTS
Breeding density.--The location and density of nests on the 17-hectare study plot for the 7 seasons 1967-1973 are shown in Figure 1. The breeding population declined
July 1977] Lapland Longspur Demography 507
72 75 68 70 6967 71
20
r
5 ID 1•5 2[0 2'5 29 JUNE
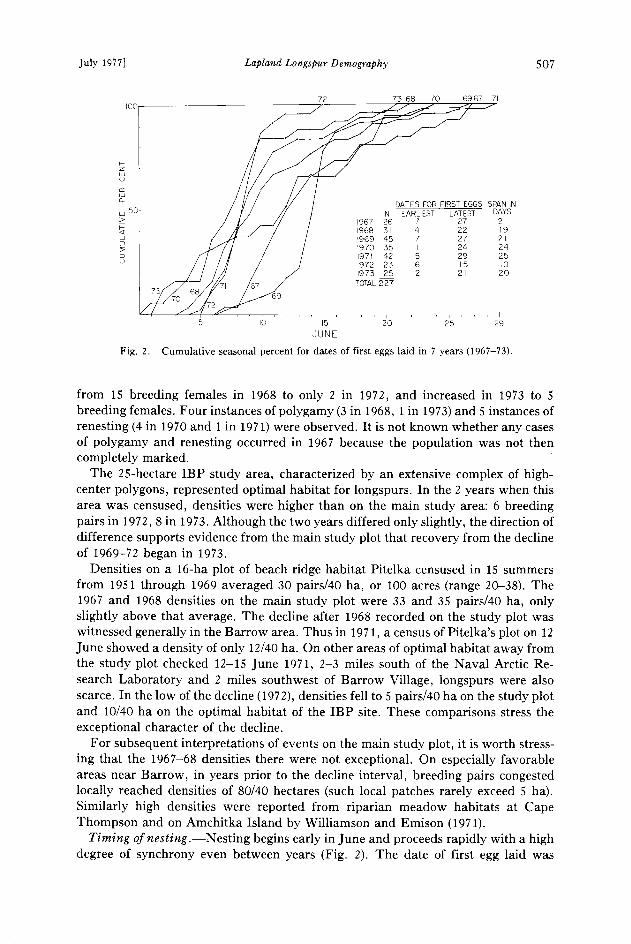
Fig. 2. Cumulative seasonal percent for dates of first eggs laid in 7 years (1967-73).
from 15 breeding females in 1968 to only 2 in 1972, and increased in 1973 to 5 breeding females. Four instances of polygamy (3 in 1968, 1 in 1973) and 5 instances of renesting (4 in 1970 and 1 in 1971) were observed. It is not known whether any cases of polygamy and renesting occurred in 1967 because the population was not then completely marked.
The 25-hectare IBP study area, characterized by an extensive complex of high- center polygons, represented optimal habitat for longspurs. In the 2 years when this area was censused, densities were higher than on the main study area: 6 breeding pairs in 1972, 8 in 1973. Although the two years differed only slightly, the direction of difference supports evidence from the main study plot that recovery from the decline of 1969-72 began in 1973.
Densities on a 16-ha plot of beach ridge habitat Pitelka censused in 15 summers from 1951 through 1969 averaged 30 pairs/40 ha, or 100 acres (range 20-38). The 1967 and 1968 densities on the main study plot were 33 and 35 pairs/40 ha, only slightly above that average. The decline after 1968 recorded on the study plot was witnessed generally in the Barrow area. Thus in 1971, a census of Pitelka's plot on 12 June showed a density of only 12/40 ha. On other areas of optimal habitat away from the study plot checked 12-15 June 1971, 2-3 miles south of the Naval Arctic Re- search Laboratory and 2 miles southwest of Barrow Village, longspurs were also scarce. In the low of the decline (1972), densities fell to 5 pairs/40 ha on the study plot and 10/40 ha on the optimal habitat of the IBP site. These comparisons stress the exceptional character of the decline.
For subsequent interpretations of events on the main study plot, it is worth stress- ing that the 1967-68 densities there were not exceptional. On especially favorable areas near Barrow, in years prior to the decline interval, breeding pairs congested locally reached densities of 80/40 hectares (such local patches rarely exceed 5 ha). Similarly high densities were reported from riparian meadow habitats at Cape Thompson and on Amchitka Island by Williamson and Emison (1971).
Timing ofnesting.--Nesting begins early in June and proceeds rapidly with a high degree of synchrony even between years (Fig. 2). The date of first egg laid was
508 CUSTER AND P•TELKA [Auk, Vol. 94
IOO i I ••
I ? / Pooled first egg dates
0 • I I I I I i io 20 30
June
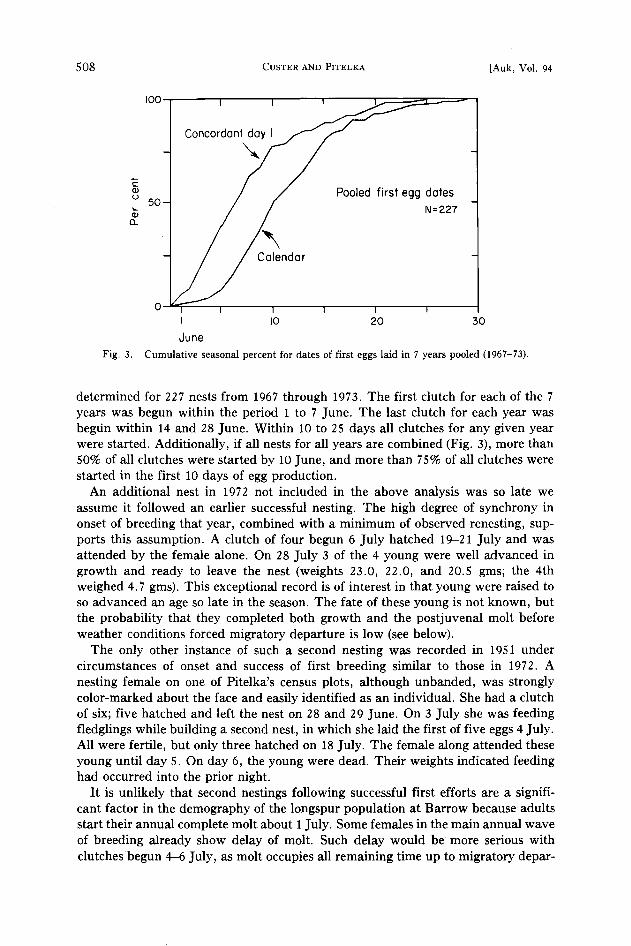
Fig. 3. Cumulative seasonal percent for dates of first eggs laid in 7 years pooled (1967-73).
determined for 227 nests from 1967 through 1973. The first clutch for each of the 7 years was begun within the period 1 to 7 June. The last clutch for each year was begdn within 14 and 28 June. Within 10 to 25 days all clutches for any given year were started. Additionally, if all nests for all years are combined (Fig. 3), more than 50% of all clutches were started by 10 June, and more than 75% of all clutches were started in the first 10 days of egg production.
An additional nest in 1972 not included in the above analysis was so late we assume it followed an earlier successful nesting. The high degree of synchrony in onset of breeding that year, combined with a minimum of observed renesting, sup- ports this assumption. A clutch of four begun 6 July hatched 19-21 July and was attended by the female alone. On 28 July 3 of the 4 young were well advanced in growth and ready to leave the nest (weights 23.0, 22.0, and 20.5 gms; the 4th weighed 4.7 gms). This exceptional record is of interest in that young were raised to so advanced an age so late in the season. The fate of these young is not known, but the probability that they completed both growth and the postjuvenal molt before weather conditions forced migratory departure is low (see below).
The only other instance of such a second nesting was recorded in 1951 under circumstances of onset and success of first breeding similar to those in 1972. A nesting female on one of Pitelka's census plots, although unbanded, was strongly color-marked about the face and easily identified as an individual. She had a clutch of six; five hatched and left the nest on 28 and 29 June. On 3 July she was feeding fledglings while building a second nest, in which she laid the first of five eggs 4 July. All were fertile, but only three hatched on 18 July. The female along attended these young until day 5. On day 6, the young were dead. Their weights indicated feeding had occurred into the prior night.
It is unlikely that second nestings following successful first efforts are a signifi- cant factor in the demography of the longspur population at Barrow because adults start their annual complete molt about 1 July. Some females in the main annual wave of breeding already show delay of molt. Such delay would be more serious with clutches begun 4-6 July, as molt occupies all remaining time up to migratory depar-

July 1977] Lapland Longspur Demography
TABLE 1
VARIATION IN CLUTCH SIZE OF LAPLAND LONGSPURS NEAR BARROW• ALASKA
5O9
Number of eggs
Year 2 3 4 5 6 7 8 N Mean
1967 1 7 13 9 30 4.97 1968 9 16 7 1 1 34 5.09 1969 3 it 25 6 45 4.76 1970 2 9 17 12 3 43 5.12 1971 1 1 8 20 12 42 4.98 1972 4 9 15 2 30 5.50 1973 4 13 10 27 5.22
Total 7 • 5-• 11T 71 • •- 251 5.06
ture, and thus females starting late second clutches run risks of failing to complete molt and/or to undertake migration with normal timing if they persist in attending young after the third week of July. Cold weather often with snow triggering migra- tory departure usually comes between mid-August and the first days of September. Interaction of molt and breeding will be considered more fully elsewhere. Here the main point is that from the standpoint of timing of nesting, second nestings following successful first efforts do occur near Barrow, but with such rarity as to be negligible at the population level.
Clutch size.--With rare exceptions (see above), longspurs lay only one clutch unless the first is destroyed early in the nesting cycle and renesting occurs. Annual variation in clutch size is shown in Table 1. Clutch size varied from 2 to 8 eggs (modal class 5, pooled mean 5.06). Mean clutch size varied between years from 4.76 to 5.50 eggs per clutch, and only these extreme values were significantly different (Student-Newman-Keuls test, P < 0.05). But between-year differences are not the main point, and display of significance is somewhat misleading. We present these results in deference to numerous similar analyses of data published in the past.
The observed yearly variation in clutch size is actually the result of within-year seasonal decline in clutch size. A two-way factor analysis of variance without replica- tion between mean clutch size and time of season shows no significant between-year differences (0.2 > P > 0.1); but there are significant within-year differences (P < 0.001). Each year was divided into the periods 1-5 days, 6-10 days, and 11 or more days past the laying of the first clutch for that year. Mean clutch size for all years decreased during these three periods from 5.25 to 5.11 to 4.38 eggs per clutch. Significant differences were found between the last period and the first 2 periods (Student-Newman-Keuls test, P < 0.05).
Although the sample size is small, apparently second clutches following first
TABLE 2
YEARLY VARIATION IN CLUTCH SIZE FOR INDIVIDUALLY MARKED FEMALES
No. 1968 1969 1970 1971 1972 1973
1 4 4 ....
2 6 6 .... 3 5 5 5 - - - 4 5 - 5 - - - 5 5 5 .... 6 - - - 6 7 - 7 .... 5 5 8 .... 6 6

5 10 CUSTER AND PITELKA [Auk, Vol. 94
TABLE 3
YEARLY ANALYSIS OF EGG AND NESTLING LOSSES
Percent Percent
losses by losses of 1967 1968 1969 1970 1971 1972 1973 Total stage all eggs
Eggs laid 140 160 237 231 217 133 126 1244 Losses
Hatching failure 8 2 8 16 13 8 10 65 17.15 5.23 Lemmings 6 6 1.58 .48 Abandonment 5 11 4 8 28 7.39 2.25 Predation 5 27 101 88 45 6 5 277 73.09 22.27 Unknown 2 1 3 .79 .24
Total Losses 26 30 120 104 62 14 23 379 100.00
Young hatched 113 110 112 109 147 103 98 792 Losses
Weather 4 4 1.60 Starvation 1 6 8 2 5 2 5 29 11.60 Lemmings 5 5 2.00 Abandonment 9 4 5 5 6 29 11.60 Predation 20 22 30 7 84 12 5 180 72.00 Unknown 2 1 3 1.20 Total Losses 27 38 42 14 94 19 16 250 100.00
.51 3.66
.63 3.66
22.73 .38
clutches that failed are generally smaller. For 3 femmes, the first clutch was 5, 5, and 6 eggs and the second clutch was 4, 5, and 5 eggs, respectively.
Individual females show little yearly variation in clutch size (Table 2). Of 8 femmes only 1 showed an increase in clutch size, from 6 eggs in 1971 to 7 eggs in 1972. Differences between clutch size in each year and the subsequent year when data are available were not significant (paired t-test, P > 0.5). Clutch size is reported usually to change with age (Ricklefs 1973), but no such change was detected in this study. All 8 females in Table 2 were of unknown age when first observed, and could have been 2 or more years old; the possibility that age contributes to variation in clutch size thus remains.
We have no nesting data for known first-year femmes banded as juveniles. We believe most first-year females at least attempt to breed for the following reasons: A substantial number of specimens collected over a series of years with plumage characteristics extreme enough to leave little doubt they were first-year individuals were also breeding; in breeding populations, floating, nonbreeding femmes are scarce; many nests in the latter half of the breeding season are located poorly and built flimsily, and we believe most of these femmes are first-year. Floating males, on
TABLE 4
PERIOD OF NESTING CYCLE AND PREDATION RATE FOR 95 NESTS FOUND DURING EGG-LAYING
Percent lost per period Number of
Nest-days nests lost Loss rate Egg-laying and Period observation to predation per day Total incubation only
Egg-laying 245 17 0.0694 39.26 51.99 Incubation (day 1-6) 450 7 0.0156 8.82 11.69 Incubation (day 7+) 371 18 0.0485 27.43 36.33 Nestling (day 1-4) 184 4 0.0217 12.27 -- Nestling (day 5+) 185 4 0.0216 12.22 -- Total 1435 50
July 1977] Lapland Longspur Demograph y 5 1 1
TABLE 5
EGG SUCCESS AND NUMBER OF YOUNG FLEDGED PER FEMALE •
A B C .D
Success Egg Success of Egg success of nests success to nests with hatching to
Year with eggs B/A 2 hatching young D/C 2 fledging
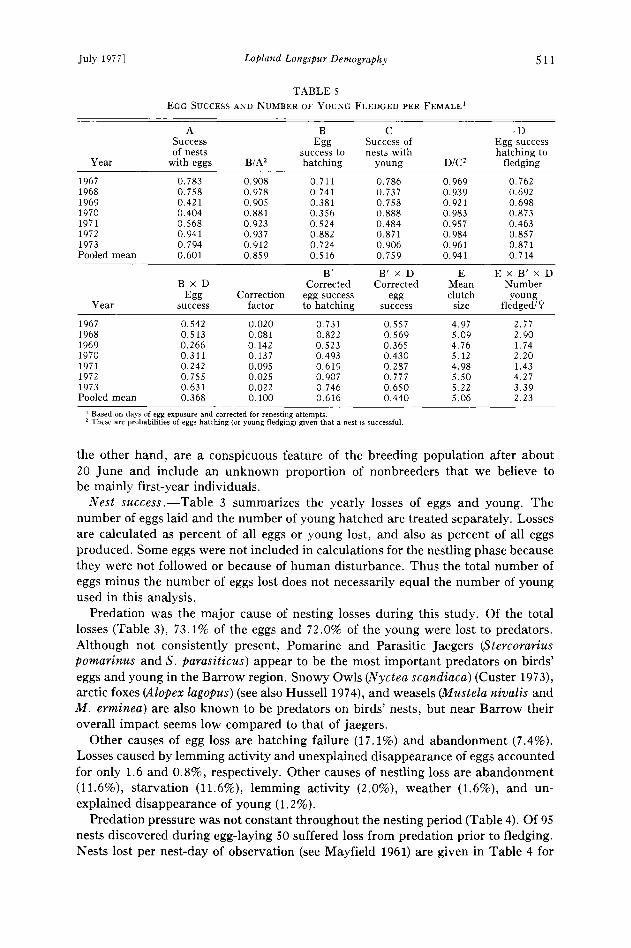
1967 0.783 0. 908 0.711 0. 786 0.969 0. 762 1968 0.758 0.978 0.741 0.737 0.939 0.692 1969 0.421 0.905 0.381 0.758 0.921 0.698 1970 0.404 0.881 0.356 0.888 0.983 0.873 1971 0.568 0.923 0.524 0.484 0.957 0.463 1972 0.941 0.937 0.882 0.871 0.984 0.857 1973 0.794 0.912 0.724 0.906 0.961 0.871 Pooled mean 0.601 0.859 0.516 0.759 0.941 0.714
B' B' x D E E x B' x D B x D Corrected Corrected Mean Number
Egg Correction egg success egg clutch young Year success factor to hatching success size fledged/•>
1967 0.542 0.020 0.731 0.557 4.97 2.77 1968 0.513 0.081 0.822 0.569 5.09 2.90 1969 0.266 0.142 0.523 0.365 4.76 1.74 1970 0.311 0.137 0.493 0.430 5.12 2.20 1971 0.242 0.095 0.619 0.287 4.98 1.43 1972 0.755 0.025 0.907 0.777 5.50 4.27 1973 0.631 0.022 0.746 0.650 5.22 3.39 Pooled mean 0.368 0.100 0.616 0.440 5.06 2.23
Based on days of egg exposure and corrected for renesting attempts. These are probabilities of eggs hatching (or young fledging) given that a nest is successful.
the other hand, are a conspicuous feature of the breeding population after about 20 June and include an unknown proportion of nonbreeders that we believe to be mainly first-year individuals.
Nest success.--Table 3 summarizes the yearly losses of eggs and young. The number of eggs laid and the number of young hatched are treated separately. Losses are calculated as percent of all eggs or young lost, and also as percent of all eggs produced. Some eggs were not included in calculations for the nestling phase because they were not followed or because of human disturbance. Thus the total number of eggs minus the number of eggs lost does not necessarily equal the number of young used in this analysis.
Predation was the major cause of nesting losses during this study. Of the total losses (Table 3), 73.1% of the eggs and 72.0% of the young were lost to predators. Although not consistently present, Pomarine and Parasitic Jaegers (Stercorarius pomarinus and S. parasiticus) appear to be the most important predators on birds' eggs and young in the Barrow region. Snowy Owls (Nyctea scandiaca) (Custer 1973), arctic foxes (Alopex lagopus) (see also Hussell 1974), and weasels (Mustela nivalis and M. erminea) are also known to be predators on birds' nests, but near Barrow their overall impact seems low compared to that of jaegers.
Other causes of egg loss are hatching failure (17.1%) and abandonment (7.4%). Losses caused by lemming activity and unexplained disappearance of eggs accounted for only 1.6 and 0.8%, respectively. Other causes of nestling loss are abandonment (11.6%), starvation (11.6%), lemming activity (2.0%), weather (1.6%), and un- explained disappearance of young (1.2%).
Predation pressure was not constant throughout the nesting period (Table 4). Of 95 nests discovered during egg-laying 50 suffered loss from predation prior to fledging. Nests lost per nest-day of observation (see Mayfield 1961) are given in Table 4 for

5 12 CUSTEa AND PITELKA [Auk, Vol. 94
five intervals of the nesting period. The highest rate of loss occurred during the egg-laying period; the rate dropped markedly in the remainder of the nesting cycle except for the second half of incubation.
Table 5 summarizes hatching and fledging success of eggs for 1967 through 1973. Hatching success of 1244 eggs (column B) varied from 35.6 to 88.2% (pooled mean 51.6%). Fledging success of 792 young (column D) varied from 46.3 to 87.3% (pooled mean 71.4%). Significant between-year differences in both hatching success (column B) and fledging success (column D) occurred (X 2, P < 0.05; see Snedecor, 1956: 227). Fledging success of eggs, the product of hatching success of eggs (column B) and fledging success of young (column D) varied from 24.2 to 75.5% (pooled mean 36.8%).
Using Mayfield's (1961) method, the pooled mean success of eggs for all years combined was 36.8%, whereas using the simpler method generally used earlier giv- ing no regard to varying periods of nest exposure, the pooled success of eggs would be 47.6%. Thus applying Mayfield's more precise technique to our longspur data modi- fies the resulting estimates significantly. Taking only the 4 years with low predation, one would expect this difference to be smaller, and it is: The corresponding per- centages are 61.0 and 63.7.
Correction of success estimates for second nesting attempts.--The above computa- tions for egg and nest success underestimate success of individual females because they do not include females who lost their first nest but who undertook a second. Nest losses at given stages of the nesting cycle are known for 26 banded females. All four females whose nests were lost during the egg-laying period renested. Two of the 4 females who lost their nests during day 1-6 of incubation renested; 18 females who lost their nests later in the incubation period did not renest.
An attempt to correct the success estimates for second nests follows: Second nest- ing attempts following a successful first nest are so rare they can be neglected in these calculations. From data summarized above, we assume that during egg-laying (the first of three more or less equal intervals for the egg stage of nesting), all females losing their nest attempt to renest; during days 1-6 of incubation (the second of three intervals), one-half of the females attempt to renest; and during days 7-12 of incuba- tion (third and last interval), no females losing first nests attempt to tenest. Thus, given loss of first nest in the egg stage, and using the observed predation (Table 4) during egg-laying and the two incubation periods, the probability of renesting is
(1.0 x 0.52) + (0.5 x 0.12) + (0 x 0.36) = 0.58
egg-laying day 1-6 day 7-12 (5-6 days) incubation incubation
The margin of additional success can be estimated using the predation data in Table 3. The actual impact of predation will be less as a result of success by females who renest. Thus,
Si = (Pro)(P)(1 - Pro)
where Si is the increment of probability of breeding success with second nesting attempts, Pro is the observed predation, P is the probability of renesting and 1 = Pro is the expected success among renesters. In 1967, using predation data in table 3, the value for Si will be
= (5/140)(.58)(1 - 5/140) = 0.020
July 1977] Lapland Longspur Demography
TABLE 6
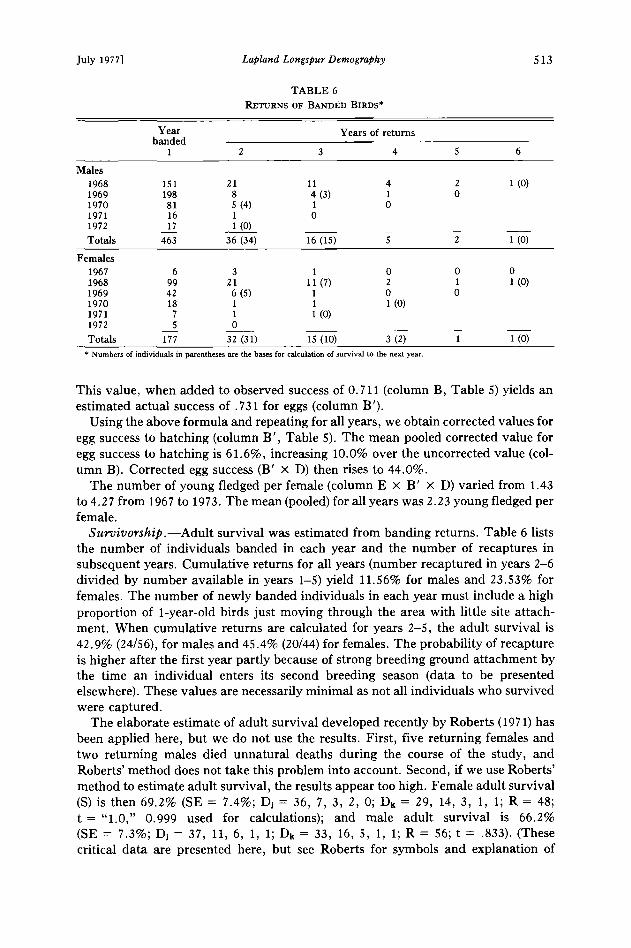
P•ETURNS OF BANDED BIRDS*
513
Year banded
1
Years of returns
2 3 4 5 6
Males
1968 151 21 11 1969 198 8 4 (3) 1970 81 5 (4) 1 1971 16 1 0 1972 17 1 (0)
Totals 463 36 (34) 16 (15)
4 2 1 0 0
1 (0)
Females
1967 6 3 1
1968 99 21 11 (7) 1969 42 6 (5) 1 1970 18 1 1 1971 7 1 1 (0) 1972 5 0
Totals 177 32 (31) 15 (10)
0 0 0
2 1 1 (0) 0 0
1 (0)
3 (2) •- i (0) * Numbers of individuals in parentheses are the bases for calculation of survival to the next year.
This value, when added to observed success of 0.711 (column B, Table 5) yields an estimated actual success of .731 for eggs (column B').
Using the above formula and repeating for all years, we obtain corrected values for egg success to hatching (column B', Table 5). The mean pooled corrected value for egg success to hatching is 61.6%, increasing 10.0% over the uncorrected value (col- umn B). Corrected egg success (B' x D) then rises to 44.0%.
The number of young fledged per female (column E x B' x D) varied from 1.43 to 4.27 from 1967 to 1973. The mean (pooled) for all years was 2.23 young fledged per female.
Survivorship.--Adult survival was estimated from banding returns. Table 6 lists the number of individuals banded in each year and the number of recaptures in subsequent years. Cumulative returns for all years (number recaptured in years 2-6 divided by number available in years 1-5) yield 11.56% for males and 23.53% for females. The number of newly banded individuals in each year must include a high proportion of 1-year-old birds just moving through the area with little site attach- ment. When cumulative returns are calculated for years 2-5, the adult survival is 42.9% (24/56), for males and 45.4% (20/44)for females. The probability of recapture is higher after the first year partly because of strong breeding ground attachment by the time an individual enters its second breeding season (data to be presented elsewhere). These values are necessarily minimal as not all individuals who survived were captured.
The elaborate estimate of adult survival developed recently by Roberts (1971) has been applied here, but we do not use the results. First, five returning females and two returning males died unnatural deaths during the course of the study, and Roberts' method does not take this problem into account. Second, if we use Roberts' method to estimate adult survival, the results appear too high. Female adult survival (S) is then 69.2% (SE = 7.4%; Dj -- 36, 7, 3, 2, 0; Dk = 29, 14, 3, 1, 1; R = 48; t = "1.0," 0.999 used for calculations); and male adult survival is 66.2% (SE = 7.3%; Dj -- 37, 11, 6, 1, 1; Dk = 33, 16, 5, 1, 1; R = 56; t = .833). (These critical data are presented here, but see Roberts for symbols and explanation of
5 14 CUSTER ̂ND P•TELK^ [Auk, Vol. 94
5.0
4.0 7•1 6'9 7'0
3.0
2.0
1.0
0.5 1.0
67 68 7'3 7'2
,M, eon fo,r, / normal /
years 1.665 •
mean 1.335 / Postulated
• first-year survival
.4545 • 0.•
o 115
4.60
2.09
1,57
1.04
Ro
2'.o Number of females fledged per female
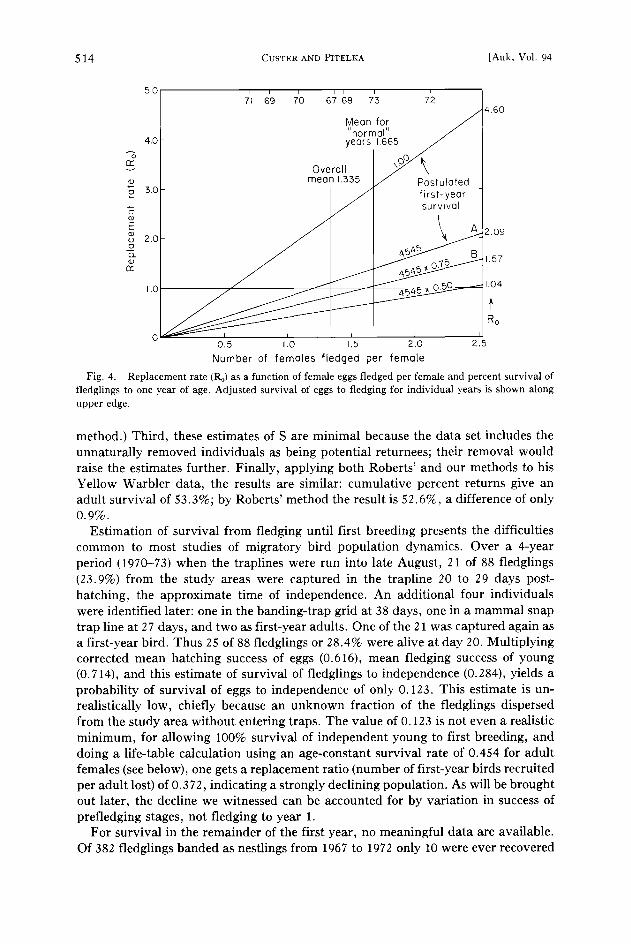
Fig. 4. Replacement rate (Ro) as a function of female eggs fledged per female and percent survival of fledglings to one year of age. Adjusted survival of eggs to fledging for individual years is shown along upper edge.
method.) Third, these estimates of S are minimal because the data set includes the unnaturally removed individuals as being potential returnees; their removal would raise the estimates further. Finally, applying both Roberts' and our methods to his Yellow Warbler data, the results are similar: cumulative percent returns give an adult survival of 53.3%; by Roberts' method the result is 52.6%, a difference of only O.9%.
Estimation of survival from fledging until first breeding presents the difficulties common to most studies of migratory bird population dynamics. Over a 4-year period (1970-73) when the traplines were run into late August, 21 of 88 fledglings (23.9%) from the study areas were captured in the trapline 20 to 29 days post- hatching, the approximate time of independence. An additional four individuals were identified later: one in the banding-trap grid at 38 days, one in a mammal snap trap line at 27 days, and two as first-year adults. One of the 21 was captured again as a first-year bird. Thus 25 of 88 fledglings or 28.4% were alive at day 20. Multiplying corrected mean hatching success of eggs (0.616), mean fledging success of young (0.714), and this estimate of survival of fledglings to independence (0.284), yields a probability of survival of eggs to independence of only 0.123. This estimate is un- realistically low, chiefly because an unknown fraction of the fledglings dispersed from the study area without entering traps. The value of 0.123 is not even a realistic minimum, for allowing 100% survival of independent young to first breeding, and doing a life-table calculation using an age-constant survival rate of 0.454 for adult females (see below), one gets a replacement ratio (number of first-year birds recruited per adult lost) of 0.372, indicating a strongly declining population. As will be brought out later, the decline we witnessed can be accounted for by variation in success of prefledging stages, not fledging to year 1.
For survival in the remainder of the first year, no meamngful data are available. Of 382 fledglings banded as nestlings from 1967 to 1972 only 10 were ever recovered
Lapland Longspur Demography 5 15 July 1977]
40¸
200 -
400
200-
200
1967
I I
I I
1968
I I
I I
eggs incubation '•' nestlings •-fledglings
1969
0 • First Clutch
Medion C. I I
, Last C.
I I I I i I I c• I $l I0 20 $0 IO 20 30 19 dUNE dULY AUGUST
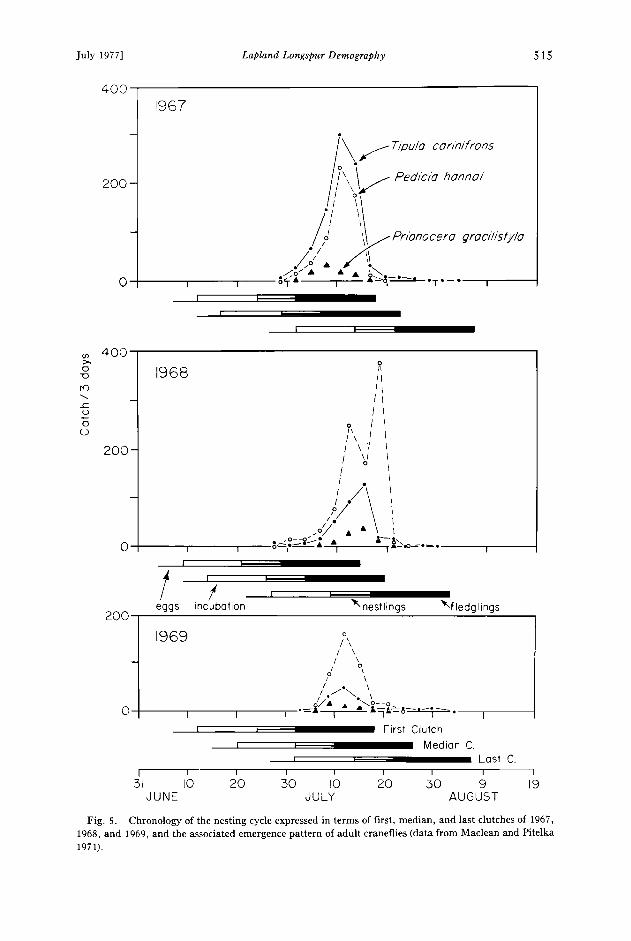
Fig. 5. Chronology of the nesting cycle expressed in terms of first, median, and last clutches of 1967, 1968, and 1969, and the associated emergence pattern of adult craneflies (data from Maclean and Pitelka 1971).
516 CUSTER AND PITELKA [Auk, Vol. 94
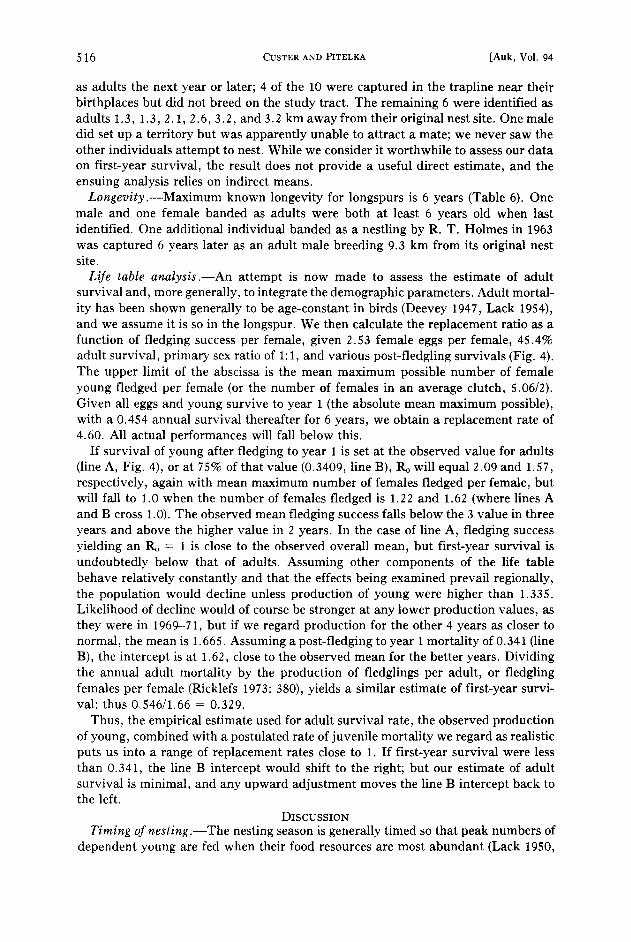
as adults the next year or later; 4 of the 10 were captured in the trapline near their birthplaces but did not breed on the study tract. The remaining 6 were identified as adults 1.3, 1.3, 2.1, 2.6, 3.2, and 3.2 km away from their original nest site. One male did set up a territory but was apparently unable to attract a mate; we never saw the other individuals attempt to nest. While we consider it worthwhile to assess our data on first-year survival, the result does not provide a useful direct estimate, and the ensuing analysis relies on indirect means.
Longevity.--Maximum known longevity for longspurs is 6 years (Table 6). One male and one female banded as adults were both at least 6 years old when last identified. One additional individual banded as a nestling by R. T. Holmes in 1963 was captured 6 years later as an adult male breeding 9.3 km from its original nest site.
Life table analysis .---An attempt is now made to assess the estimate of adult survival and, more generally, to integrate the demographic parameters. Adult mortal- ity has been shown generally to be age-constant in birds (Deevey 1947, Lack 1954), and we assume it is so in the longspur. We then calculate the replacement ratio as a function of fledging success per female, given 2.53 female eggs per female, 45.4% adult survival, primary sex ratio of 1:1, and various post-fledgling survivals (Fig. 4). The upper limit of the abscissa is the mean maximum possible number of female young fledged per female (or the number of females in an average clutch, 5.06/2). Given all eggs and young survive to year 1 (the absolute mean maximum possible), with a 0.454 annual survival thereafter for 6 years, we obtain a replacement rate of 4.60. All actual performances will fall below this.
If survival of young after fledging to year 1 is set at the observed value for adults (line A, Fig. 4), or at 75% of that value (0.3409, line B), Ro will equal 2.09 and 1.57, respectively, again with mean maximum number of females fledged per female, but will fall to 1.0 when the number of females fledged is 1.22 and 1.62 (where lines A and B cross 1.0). The observed mean fledging success falls below the 3 value in three years and above the higher value in 2 years. In the case of line A, fledging success yielding an Ro = 1 is close to the observed overall mean, but first-year survival is undoubtedly below that of adults. Assuming other components of the life table behave relatively constantly and that the effects being examined prevail regionally, the population would decline unless production of young were higher than 1.335. Likelihood of decline would of course be stronger at any lower production values, as they were in 1969-71, but if we regard production for the other 4 years as closer to normal, the mean is 1.665. Assuming a post-fledging to year 1 mortality of 0.341 (line B), the intercept is at 1.62, close to the observed mean for the better years. Dividing the annual adult mortality by the production of fledglings per adult, or fledgling females per female (Ricklefs 1973: 380), yields a similar estimate of first-year survi- val: thus 0.546/1.66 = 0.329.
Thus, the empirical estimate used for adult survival rate, the observed production of young, combined with a postulated rate of juvenile mortality we regard as realistic puts us into a range of replacement rates close to 1. If first-year survival were less than 0.341, the line B intercept would shift to the right; but our estimate of adult survival is minimal, and any upward adjustment moves the line B intercept back to the left.
DISCUSSION
Timing ofnesting.--The nesting season is generally timed so that peak numbers of dependent young are fed when their food resources are most abundant (Lack 1950,

July ! 977] Lapland Longspur Demography
TABLE 7
PERCENT ESTIMATES OF DIET COMPOSITION IN RELATION TO MIDSUMMER INSECT BLOOM I
517
Postemergence Preemergence Emergence
21-30 June 1-20 July 21-31 July 1-10 August
Adult arthropods Number 30 75 30 5 Weight 35 85 30 10
Larval arthropods Number 20 15 25 5 Weight 60 10 65 602
Seeds
Number 50 I0 45 90 Weight 5 5 5 30
Data will be reported fully in a paper on diet. This high value is due to large size of tenthredinid larvae, the main larval type taken at this time,
1954, 1968; Moreau 1959; Skutch 1950; Marshall 1951). Although concluding from this evidence that the ultimate factor determining nesting season is food supply, Lack (1968 and earlier) recognized factors modifying or compromising this basic relation- ship, such as nutritional needs of the egg-laying female and the interaction of molt and breeding. The longspur at Barrow is an example showing such compromises.
Onset of breeding at Barrow is timed in general to snow melt. The first patches of exposed tundra vegetation usually appear around 1 June, and in such years, the majority of clutches are started between 5 and 10 June (Fig. 2). Egg-laying in 1969 was exceptionally late, as was the disappearance of the snow cover. In contrast, advanced but patchy clearings of snow occurred in 1970 and 1973, and nesting started earlier. Early longspur nests were also found associated with snow-free tundra on Devon Island (Hussell 1972), but at Cape Thompson and on Amchitka Island Williamson and Emison (1971) report longspurs to have longer prenesting periods than they do at Barrow; that is, factors other than earliest available oppor- tunity to initiate nesting appear to be controlling the general timing of nesting.
At Barrow surface-active insect foods peak in abundance in early to mid-July (Holmes 1966, Maclean and Pitelka 1971). The result is that, though the onset of breeding there is relatively rushed and certainly highly synchronized, the nestling period comes before peak surface insect food abundance and the young fledge and reach independence during this interval and before the end of insect emergence. In Figure 5, the chronologies of first, median, and last clutches of 1967, 1968, and 1969 are compared to the corresponding emergence pattern of three cranefly species (Dip- tera, Tipulidae; data from Maclean and Pitelka 1971), which are the main items of longspur diets during peak insect food abundance. The postfledging period of the first and median clutches for all years coincides with the peak of cranefly emergence. For the latest clutches of each year, the nestling period corresponds to the period of peak insect emergence, but these represent no more than 5% of all clutches.
We hypothesize that timing of young to reach independence before the end of insect emergence is related to rising abundance of surface-active arthropods. This is reflected in changing composition of the diets of breeding adults (see Table 7, for additional data see Custer 1974a). Thus if dietary composition reflects relative abun- dance of insects (which it does), and if animal prey items are important to the growth of young, the critical relationship is not that nestling dependence coincide with peak insect emergence (as Lack would have it), but that independence of young be reached

5 18 CUSTER AND PITELKA [Auk, Vol. 94
prior to the end of insect emergence. Adults feed their young larval insects, and one could argue that this class of insects is the main selective force setting timing of the nestling stage, but we believe not. Compromises are necessarily involved, as short- ness of season forces prompt onset of breeding. But the resulting coincidence of the nestling stage with larval abundance rather than with the later surface insect abun- dance means that fledglings and juveniles, themselves still growing new feathers and already entering the postjuvenal molt (Pitelka MS), capitalize on an abundant food supply due shortly to collapse.
Strong year-to-year variation in summer temperatures (Maclean and Pitelka 1971) and the resulting unpredictability of the timing of the peak and decline in insect numbers selects for the advanced timing of dependence on insects by growing young (and thus for advanced timing of breeding, whatever else selects in the same direc- tion). As Table 7 shows, the decline is typically abrupt, and the period of growth, if its coincidence with supply of animal food is to be maximized, must come mainly forward of the insect peak. Also in this interval, maximal capture rates of individual birds to sustain their energy needs are lower than later in the season because large animal food items are available and temperatures are near or at seasonal peak values (data from Custer 1974b). For inexperienced young, this factor contributes to advan- tages of timing their growth ahead of the peak and decline. Finally, a factor exacer- bating the effect of abrupt decline in insects is that during this interval growth of the standing herbaceous ground cover is completed, or almost so, with the result that in most years (lemming highs being the exception), area of ground surface accessible for foraging declines midsummer, remaining so for the rest of the summer, and even declining further with surface water resulting from any rains or snow.
Predation may also be an important factor in selecting for time of nesting (see Immelman 1971 for review). In 1972 and 1973, just after most young longspurs had fledged, Pomarine and Parasitic Jaegers shifted from their preferred prey, the brown lemming, to eggs, mainly those of shorebirds (U. Safriel and D. Norton, pers. comm.). Thus in years such as 1972 and 1973, early nesting of longspurs probably increases their breeding success compared to that of shorebirds.
Timing of molt may be another factor influencing nesting season (Lack 1950; Pitelka 1957, 1958; Hussell 1972). Molt in breeding longspurs at Barrow usually begins in the first week of July, at the end of nesting, and juveniles begin their incomplete molt in mid-July. Also, nonbreeding longspurs begin molt earlier than breeding individuals (Custer and Pitelka MS). This strongly suggests that the ear- liest possible onset of molt improves probability of survival in adults. But breeding cannot be scheduled earlier because of snow cover, and both molt and breeding must be fitted into the summer period. Thus the correlation of maximal food supply with achievement of independence by young (instead of with the nestling period when food demands of a population are higher) is probably only one aspect of a set of compromises maximizing overall adaptation of the population to limits imposed by the short summer.
Thus with regard to timing of breeding, the factors most critical in our view are, in order of importance, snow cover, food supply (including access to food affected by snow melt), molt, and predation.
Variation in clutch size.--Annual variation in clutch size has been observed in
several passerine species including the Great Tit (Kluyver 1951), Pied Flycatcher (yon Haartman 1967), and European Blackbird (Snow 1958). Annual variation in clutch size for longspurs demonstrated in this study was minimal (only the extremes
July 1977] Lapland Longspur Demography 5 19
were significantly different). Moreover, no significant between-year differences in clutch size for longspurs were observed in a 4-year study on Devon Island (Hussell 1972) or in a 2-year study at Cape Thompson, Alaska (Williamson et al. 1966). Hussell did find significant yearly differences in clutch size in the Snow Bunting.
The results for longspurs are unexpected, considering the notorious severity and variability of the arctic environment. As yearly variation in clutch size of individuals is also low (Table 2), it appears that clutch size as a demographic component may be relatively fixed genetically and not subject to strong environmental effects, at least in the years we studied. The strongest such effect witnessed by us occurred in 1969, an exceptionally late year (see Fig. 2) because of late snow melt, and mean clutch size that year was the lowest observed.
Seasonal variation in clutch size has been demonstrated in several passerines (Snow 1955, Newton 1964, von Haartman 1967), and also in Lapland longspurs at several locations (Wynne-Edwards 1952, Williamson and Emison 1971, Hussell 1972) including Barrow and is apparently the cause for observed yearly differences in clutch size. At these other locations as well as at Barrow, longspurs exhibit a decline in clutch size through the season. It has been demonstrated in other species and suggested here that size of replacement clutches is usually equal to or less than original clutches (von Haartman 1967, Haukioja 1970; also see review by Lack 1954). These replacement clutches could account for the decline in clutch size late in the season, but Hussell (1972) did not consider second nests as a major factor in the decline of longspur clutch size on Devon Island because of the rarity of repeat clutches there. At Barrow repeat clutches are not rare (see Fig. 1) and, in our opinion, contribute to the seasonal decline in clutch size. Such decline may reflect limited ability of a renesting female to mobilize necessary reserves of energy and/or nutrients (such as calcium), as well as the imminence of complete body molt.
Hussell (1972) also discussed the possibility that seasonal variation may be the result of older females having larger clutches and starting earlier in the season (see Lack 1954 for examples) and the older birds may be more experienced, thus able to raise more chicks (also see Perrins 1965, Lack 1968). Most of the first longspurs to arrive and nest at Barrow are 2 or more years old (Custer 1971). The data do not indicate an increase in clutch size with age in longspurs at Barrow (Table 2), but it is possible that such variation, if it occurs, is masked by the circumstance that age of these females when first trapped was not known and they could have been two or more years old.
Clutch size in the Great Tit has been shown to be related to habitat (Perrins 1965). Thus seasonal decrease in clutch size may be the result of late-arriving individuals nesting in poor habitats. Females of polygamous male longspurs arrive first at Bar- row, nest first, and their young at least in one year exhibited greater growth rates than the young of females of monogamous males (Custer 1971). These facts clearly suggest that in the longspur, also, habitat differences may influence clutch size.
Thus, the chief factor considered to have significant influence on the seasonal decline in clutch size is timing of egg-laying, further modified by habitat quality, proportion of second nesting attempts, and probably age of female.
Nesting success.--According to Ricklefs (1969), there is a latitudinal gradient in egg success for open-nesting passerines from 60.0% in arctic species to 46.6% in temperate-zone species and 32.4% in humid tropical species. Overall egg success of longspurs at Barrow was intermediate between temperate and humid tropical species (36.8, 44.0 corrected).
520 CUSTER AND PITELKA [Auk, Vol. 94
The apparent discrepancy between our longspur data and those for other arctic passerines is the result of low nesting success for 3 years (1969, 1970, 1971) from heavy predation (Table 5). In these 3 years, egg success averaged 27.3% .(corrected, 36.1); whereas, in tl•e other 4 years, it averaged 61.0% (corrected 63.8), close to Ricklef's overall estimate for arctic passerines. The exceptional lowness of the figures for 1969--71 is thus emphasized.
Longspur egg and young losses to predators accounted for 22.3 and 22.7% (Table 3), respectively, while Ricklef's (1969) comparable figures for temperate species were 23.3 and 22.6%. Other causes of egg and young loss in longspurs are also not too dissimilar from those of temperate passerine species. Figures for longspurs and tem- perate species, respectively, are as follows: hatching failure, 5.2 and 5.1%; abandon- ment of eggs, 2.2 and 2.8; starvation of young, 3.7 and 2.2; abandonment of young, 3.7 and 0.7; losses to weather in eggs, 0 and 2.6, and in young, 0.5 and 2.4. Thus we have the unexpected result that the spectrum of mortality factors for a high arctic longspur population is remarkably parallel to that seen in open-nesting temperate passerines, and that weather factors per se do not assume any significant importance, at least in years such as we experienced.
With regard to correction factors serving to estimate actual breeding success of a population, we emphasize predation on eggs simply because it is the overwhelming cause of loss (73.1%) and the only factor significantly affecting the probability of renesting. Abandonment (7.4%) in most cases almost certainly means loss of the female---that is, no renesting. Hatching failure (17.1%) refers to clutches incom- pletely hatching, also meaning no likelihood of renesting. Other sources of loss are negligible. Predation on young led to no renesting, in our experience, although this may happen occasionally in view of the occurrence, albeit very rare, of bona fide second nestings.
In the manipulation of nest success data, we make no allowance for the reduced clutch size of second nests. Not only is the overall difference small, if renesting occurs to a significant degree, it does so mainly in the first half of June, during which the decline in mean clutch is only 0.14 eggs.
The correction for second nestings we have developed in assessing breeding suc- cess seems to be useful in other high latitude birds with strongly synchronized short- term breeding periods and whose nests are easy to find and monitor. At lower latitudes, in the absence of these conditions, the method will to all intents and purposes be useless.
Survivorship and Life Table Analysis.--The basic assumption underlying the method employed in this study to calculate adult survivorship is that if individuals captured in successive years on the study areas are not captured the following years, they are considered dead (von Haartman 1971). The estimate of adult survivorship is then necessarily a minimal one, but in strongly site-tenacious species, for example the Song Sparrow (Nice 1937) and also apparently the Lapland Longspur, the error should be minimal (Lack 1954).
Survival rates for adults of most temperate species fall between 40 to 60% (Ricklefs 1969). The data for longspurs from Barrow fall within this range. The real survival rates are higher than the recorded values of 45.4% for females and 42.9% for males, but we have no way of estimating the necessary increase in these figures in the absence of data showing the proportion of adults not returning to a study area that are breeding elsewhere.
The life-table analysis requires at least two additional basic assumptions: that
July 1977] Lapland Longspur Demography 52 1
clutch size does not change with age, and that adult mortality is age-constant. We use the female adult survival rate of 45.4%, but as mentioned earlier, this is necessarily a minimal estimate. Thus the calculations of replacement ratio (Ro) are approximate and fall on the conservative end of a range whose limits we now try briefly to examine.
The chief unknown is that of postfledging first-year survival. This common prob- lem is exacerbated for us by our population's strong 3-year decline in the middle. Nest success was then low. Accordingly we assume that data from the other 4 years reflect more normal conditions and estimate first-year survival rate using the average egg success values for those 4 years (Table 5), or 63.8%. This agrees with Ricklef's (1969) estimate of 60% egg success for arctic passerines in general. Taking the longspur figure converted to female fledglings per female, the fledgling-to-year 1 survival would have to approximate 75% of the adult survival rate (or 34%) if the population is to be in a near-equilibrium state. Rounding the figures off, we believe that the Barrow population producing 1.7 fledgling females/female will maintain itself with survival rates for post-fledgling first-year birds and for adults of approxi- mately 30 and 50%, respectively.
Available data for first-year survival, recently summarized by Ricklefs (1973) are scant. He concludes tentatively that for small passerines, survival rate from fledging to breeding is about one-quarter of the annual adult rate. Using the longevity and production data we have, adult survival would have to rise to 74% before the first-year rate falls to ¬ of that value. This seems excessive, and we must conclude that even if our empirically obtained estimate of adult survival is minimal, increasing it by some realistic margin (10-20%) still requires that first-year survival be consid- erably above •/4 of the adult rate. A longspur population breeds once per annum, whereas midlatitude passerines breeding as many as three times per annum thereby make possible a much lower rate of first-year survival.
Thus while a margin of error in estimates no doubt exists, the effort to reconcile estimated and observed values using the life-table method is generally successful. Our estimates yielding Ro near 1 then indicate that if observed fledging rates in 3 consecutive years are far below the mean, the population should decline, as in fact it did, starting in 1969. Fledging of young was above 3.0 (1.5 females) per female for the first time in 1972, and numbers increased for the first time in 1973. This increase continued in 1974. We therefore believe that the observed decline in population density can be attributed to 3 consecutive years of low egg-to-fledgling survival. The strong effect of fledging success in fluctuations in populations has also been stressed by others (Nice 1937, Perrins 1965, Lack 1966).
Other factors could, of course, have contributed to the observed decline. A rele- vant example is provided by the incident of heavy winter storm kill of longspurs reported by Roberts (1932), which clearly suggests that unusual winter mortality may make survival rates vary considerably in a high-latitude passerine such as the longspur. But our data are too limited to deal with such variation, and anyway, the likelihood of concordance in effects of independent events on and off the breeding grounds over 3 consecutive years is weak. Further, it should be noted that the production figures of 1969-71, low as they are, may have been even lower because of lack of data on success of young after leaving the nest at 8 days ("fledged") but actually beginning to fly at 12 days. In those 3 years of heavy nest losses to predators, loss of young out of the nest and still unable to fly or flying poorly could also have been abnormal. These additional reasons support our emphasis on poor fledging
522 CUSTER AND PITELKA [Auk, Vol. 94
success as the main cause of the observed decline, notwithstanding the acknowledged possible effects of other factors.
Predation.--Here we review the main events in the population history for longspurs near Barrow in 1967-74, mostly fact but some inference, to provide a framing for the discussion that follows.
In 1967 and 1968 the population on the study plot was dense and above average for the region, but not exceptionally so. Similar high densities had regularly occurred on a plot near Barrow censused by Pitelka in 15 seasons. The drop in 1969 reflects the effect of late snow melt on our study plot; elsewhere near Barrow no general drop in numbers was evident. In 1970 the population remained at the 1969 level, and we consider that the absence of any rebound upward reflects the poor nesting success observed in 1969 on our study tract and elsewhere in the Barrow area. The 1970 data were the first hint of significant decline. Predation kept nesting success poor again in 1970 and 1971 with the result that the population declined sharply into 1972. Recov- ery began in 1973, reflecting the high level of nesting success in 1972, and continued into 1974.
The chief factor in our years of poor nesting success was predation. When present at Barrow, Jaegers, owls, weasels, and foxes prey primarily on one basic food item, the brown lemming (Pitelka 1973). In years when lemmings are scarce (e.g. 1969, 1970), predators may appear at Barrow, and although not breeding, they wander locally and take a significant number of eggs and young birds. Also in years when lemmings are relatively abundant early in the season, Pomarine Jaegers and Snowy Owls initiate breeding while relying on lemmings, but as prey numbers decline through June, these predators shift to alternate prey, mainly eggs and young birds.
First, then, predator impact characteristics depend on phase of the lemming cycle. Second they depend on relative abundance of particular predators in a given phase. Thus the exceptionally high losses of 1969 occurred mainly in the egg stage. In that year, already low lemming numbers declined sharply early in summer, jaegers oc- curred only irregularly without breeding, and the most important predators were weasels. We suspect weasels were responsible for the heavy egg loss. The 1970 egg loss was also high, though lower than in 1969; lemmings were scarce, weasels were absent, and the predators were mainly nonbreeding jaegers wandering locally. In 1971 exceptionally high losses occurred mainly in the nestling stage. In that year lemmings were abundant, weasels were absent, and jaegers bred throughout the region. We suspect that jaegers were responsible for the heavy loss of nestlings. The summer season decline in lemming densities characteristic of years when they are abundant forces jaegers to alternative prey at varying times depending on the timing of that decline; if the shift begins in late June or early July, longspurs are particularly vulnerable. See Pitelka (1973) for further details of this chronology.
Ricklefs (1969) concluded that predation is the major cause of egg and nest failure in temperate birds but may be negligible in the Arctic. In contrast, Jehl (1971) demonstrated that predation was the major source of nest mortality in shorebirds and water birds studied near Churchill, Manitoba as did Williamson and Emison (1971) in the Lapland Longspur studied on Amchitka Island and at Cape Thompson. Additionally, Hussell and Holroyd (1974) found on Devon Island that 80% of longspur nests were taken by predators. These findings are supported by data from Barrow not only for longspurs, but also for shorebirds (to be reported elsewhere).
Predation rate clearly changes in the course of the nesting cycle (Table 4). We believe that the exceptionally high rate during egg-laying results from the effects of at

July 1977] Lapland Longspur Demography 5 2 3
least two factors. First, incomplete clutches are exposed because the female is often active near her nest and the nest itself is poorly attended early in egg-laying (days 1-3). Second, the factor of nest exposure is increased by the higher frequency in the latter half of June of exposed nests, which we believe belong to first-year females.
Breeding Density and Success.--The fluctuation in longspur breeding density observed in this study is not unusual relative to data from other species of birds. For a number of species reviewed by Lack (1954), fluctuations in breeding populations were two- to sixfold. In the 6 years of this study the number of breeding males varied x 6.5 and the number of females x 7.5. In birds generally, increases or decreases rarely span more than 2 consecutive years (Lack 1954), whereas the re- ported longspur decline started in 1969 and reached its low point in 1972. This unusual event we believe was part of a pattern manifest over a much larger area than that near Barrow (see below). As brought out earlier, no major decline in longspurs was observed on a plot near Barrow censused during the period 1951 to 1969.
An unusual feature of the period 1968-73 was the atypical behavior of the popula- tion cycle of the brown lemming (Pitelka 1973). The last typical cyclic peak at Barrow occurred in 1965, and since then the population has fluctuated irregularly. Moreover, since 1965 the only report of lemming predators indicating local lemming abundance in the entire lower northern slope of Alaska came from the Peard Bay region in 1970, and this was evidently only a modest concentration. At Barrow lemming numbers rose sharply only in spring 1971, and this was of short duration. The evidence, such as it is, therefore suggests a phenomenon of persistent regional scarcity of lemmings. It is of special interest that a decline in longspur numbers parallel to that at Barrow was reported also along the Colville River, 250 miles southeast of Barrow (T. J. Cade, pers. comm.). Thus the strong impact by predators on longspurs and probably other birds at Barrow may have been a general regional phenomenon. If small mammals are scarce, predators rely more heavily on birds, and if scarcity persists, impact on birds persists to the extent that a decline such as that at Barrow results. Thus, relatively steady-state densities in arctic Alaskan popu- lations of the longspur may well occur if other components of the tundra ecosystem are behaving and interacting in what we must believe is a more normal, more usual manner. Finally, it is worth emphasizing that the observed impact of predation is significantly greater than the effect of any other factors influencing longspur numbers near Barrow and detected there since 1951. The longspur population at carrying capacity near Barrow has evolved a replacement rate in relation to a spectrum of biotic and abiotic influences in which predation may usually be less important than observed in 1968-73. To this limited extent Ricklefs (1969) may be partly correct about the reduced importance of predation in the arctic, but of course he was looking at the matter more broadly. And given the strong variability typical of arctic envi- ronments, predation at times can exert a heavy influence, as the evidence from Barrow indicates. It can, in fact, generate degrees of fluctuation comparable to or exceeding those known for populations of midlatitude passerines.
ACKNOWLEDGMENTS
The research at Barrow was supported by grants to F. A. Pitelka in 1967-70 from the Arctic Institute of North America under contractual arrangement with the Office of Naval Research and in 1971-73 from the National Science Foundation (Grant GV-29343 to the University of California) as part of the U.S. Tundra Biome Program. In addition, in summers of 1970 and 1971, critical field assistance was provided by the Naval Arctic Research Laboratory.
524 CUSTER AND PITELKA [Auk, Vol. 94
We thank D. J. T. Hussell, R. E. Ricklefs, H. G. Baker, G. C. West, S. F. Maclean Jr., W. D. Koenig, and J.P. Myers for their helpful advice and criticism of an earlier draft of this manuscript. S. F. Bailey, R. G. Ford, and S. F. Maclean Jr. were of substantial help in the development of the correction factor for renesting by females. R. G. Osborn and Richard MacArthur aided with some of the statistical computa- tions. We also thank Max C. Brewer and John L. Schindler, past directors of the Naval Arctic Research Laboratory, for logistic support at Barrow.
We are grateful for the field assistance and companionship of Thomas Schwan, Russell Graham, A. P. Romspert, J. Van Remsen• and M. W. Monroe. Other individuals who aided in finding and following nests include D. L. Beaver, L. S. Goldstein, W. D. Koenig, S. F. Maclean Jr., D. W. Norton, and Uriel Safriel.
LITERATURE CITED
BRITTON, M. E. 1957. Vegetation of the arctic tundra. Pp. 26-61 in Arctic biology, Oregon State College Biology Colloquium No. 18 (H. P. Hanson, Ed.).
BUNNELL, F. L., S. F. MACLEAN, JR., AND J. BROWN. 1975. Barrow, Alaska, USA. Pp. 73-124 in Structure and function of tundra ecosystems. Ecological Bulletin 20 (T. Rosswall and O. W. Heal, Eds.). Stockholm, Swedish Natural Science Research Council.
CUSTER, T.W. 1971. Breeding biology of the Alaska Longspur. Unpublished M.S. thesis, Fullerton, California State University.
1973. Snowy owl predation on Lapland Longspur nestlings recorded on film. Auk 90: 433- 435.
1974a. Population ecology and bioenergetics of the Lapland Longspur (Calcarius lapponicus) near Barrow, Alaska. II. Diet and habitat selection. Unpubl. Ph.D. thesis, Univ. of California, Berkeley.
1974b. Population ecology and bioenergetics of the Lapland Longspur (Calcarius lapponicus) near Barrow, Alaska. III. Bioenergetics: A time-activity modeling approach. Unpublished Ph.D. thesis, Berkeley, Univ. California.
DEEVE¾, E. S., JR. 1947. Life tables for natural populations of animals. Quart. Rev. Biol. 22: 283-314. HAARTMAN, L. VON. 1967. Clutch size in the Pied Flycatcher. Proc. 14th Intern. Ornithol. Congr. p.
155-164.
1971. Population dynamics. Pp. 391-459 in Avian biology, vol. 1. (D. S. Farner and J. R. King, Eds.). New York, Academic Press.
H,•UKIOJA, E. 1970. Clutch size of the Reed Bunting Emberiza schoeniculus. Ornis Fennica 47: 101- 135.
HOLMES, R. T. 1966. Feeding ecology of the Red-backed Sandpiper (Calidris alpina) in northern Alaska. Condor 68: 3-46.
HUSSELL, D. J.T. 1972. Factors affecting clutch size in Arctic passerines. Ecol. Monogr. 42: 317-364. 1974. Photographic records of predation at Lapland Longspur and Snow Bunting nests.
Canadian Field-Naturalist 88: 503-506.
--, AND G. L. HOLDROYD. 1974. Birds of the Truelove Lowland and adjacent areas of northeast- ern Devon Island, N. W. T. Canadian Field-Naturalist 88: 197-212.
IMMELMAN, K. 1971. Ecological aspects of periodic reproduction. Pp. 341-389 in Avian biology, vol. 1 (D. S. Farner and J. R. King, Eds.). New York, Academic Press.
JEHL, J. R., JR. 1971. Patterns of hatching success in subarctic birds. Ecology 52: 169-173. KLUYVER, H. N. 1951. The population ecology of the Great Tit Parus m. major. Ardea 39: 1-135. LACK, D. 1950. The breeding seasons of European birds. Ibis 92: 288-316.
1954. The natural regulation of animal numbers. Oxford, Clarendon Press. 1966. Population studies of birds. Oxford, Clarendon Press. 1968. Ecological adaptations for breeding in birds. London, Methuen and Co.
MACLEAN, S. F., JR., AND F. A. PITELKA. 1971. Seasonal patterns of abundance of tundra ar- thropods near Barrow. Arctic 24: 19-40.
MAHER, W.J. 1964. Growth rate and development of endothermy in the Snow Bunting (Plec- trophenax nivalis) and Lapland Longspur (Calcarius lapponicus) at Barrow,• Alaska. Ecology 45: 520-528.
MARSHALL, A.J. 1951. Food availability as a timing factor in the sexual cycle of birds. Emu 50: 267-282.
MAYFIELD, H. 1961. Nesting success calculated from exposure. Wilson Bull. 73: 584-599.
July 1977] Lapland Longspur Demography 5 2 5
MORE^U, R. E 1950. The breeding seasons of African birds. I. Land birds. Ibis 92: 223-267. NEWTON, I. 1964. The breeding biology of the Chaffinch. Bird Study 11: 47-68. NICE, M.M. 1937. Studies in the life history of the Song Sparrow, vol. 1. Trans. Linnaean Soc. New
York 4: 1-247.
PERRINS, C. 1965. Population fluctuations and clutch size in the Great Tit, Parus major L. J. Anim. Ecol. 34: 601-647.
PITELKA, F.A. 1957. Review of Lack, D., "The natural regulation of animal numbers." Ecology 38: 176-177.
1958. Timing of molt in Steller's jays of the Queen Charlotte Islands, British Columbia. Condor 60: 38-49.
1973. Cyclic pattern in lemming populations near Barrow, Alaska. Pp. 199-215 in Alaskan arctic tundra, Arctic Institute of North America, Technical Paper No. 25 (M. E. Britton, Ed.).
R1CKLEFS, R.E. 1969. An analysis of nesting mortality in birds. Smithsonian Contrib. Zool. 9: 1-48. 1973. Fecundity, mortality, and avian demography. Pp. 367-435 in Breeding biology of
birds (D. S. Farner Ed.). Washington, Natl. Acad. Sci. ROBERTS, J. O.L. 1971. Survival among some North American wood warblers. Bird-Banding 42:
165-184.
ROBERTS, T.S. 1932. The birds of Minnesota, vol. 2. Minneapolis, Univ. of Minnesota Press• SKUTCH, A. F. 1950. The nesting season of Central American birds in relation to climate and food
supply. Ibis 92: 185-222. SNEDECOR, G.W. 1956. Statistical methods. Ames, Iowa State Univ. Press. SNOW, D.W. 1955. The breeding of the Blackbird, Song Thrush, and Mistle Thrush in Great Britain,
part 2. Clutch-size. Bird Study 2: 72-84. 1958. The breeding of the Blackbird Turdus merula at Oxford. Ibis 100: 1-30.
WIGGINS, I. L., AND J. H. THOMAS. 1962. A flora of the arctic Alaskan slope. Toronto, Univ. Toronto Press.
WILLIAMSON, F. S.L. 1968. Alaska Longspur. Pp. 1608-1627 in Life histories of North American cardinals, grosbeaks, buntings, towhees, finches, sparrows, and allies (O. L. Austin, Jr., Ed.). U.S. Natl. Mus. Bull. 237, part 3.
, .•ND W. B. EMISON. 1971. Variation in the timing of breeding and molt of the Lapland Longspur (Calcar•us lapponicus) in Alaska, with relation to differences in latitude. Bioscience 21: 701-707.
, m. C. THOMPSON, AND J. Q. HINES. 1966. Avifaunal investigations. Pp. 437-480 in Envi- ronment of the Cape Thompson region Alaska (N.J. Wilimovsky and J. N. Wolfe, Eds.). U.S. Atomic Energy Commission, Division of Technical Information. Oak Ridge, Tennessee.
WYNNE-EDWARDS, V. C. 1952. Zoology of the Baird Expedition (1950). I. The birds observed in central and south-east Baffin Island. Auk 69: 353-391.

![A LAPLAND LONGSPUR TRAGEDY...Vol. 1907 XXIV] J RObeRTS, A Lapland Longspur Tragedy 371 streets of the village, but it was said that many had been washed away by a hard rain storm which](https://img.dokumen.tips/doc/110x75/5ea648e58e27bf7414386b15/a-lapland-longspur-tragedy-vol-1907-xxiv-j-roberts-a-lapland-longspur-tragedy.jpg)